Embed Size (px)
Citation preview
EN EN
EUROPEAN COMMISSION
Brussels, 16.10.2015
SWD(2015) 197 final
PART 2/2
COMMISSION STAFF WORKING DOCUMENT
Accompanying the document
Report from the Commission to the European Parliament and Council
REFIT
Adjusting course: EU Passenger Ship Safety Legislation Fitness Check
{COM(2015) 508 final}

161
COMMISSION STAFF WORKING DOCUMENT
Accompanying the document
Report from the Commission to the European Parliament and Council
REFIT
Adjusting course: EU Passenger Ship Safety Legislation Fitness Check

162
Table of content
18 Annex 9: EU domestic passenger fleet .................................................................... 163
163
18 ANNEX 9: EU DOMESTIC PASSENGER FLEET
1 SIZE OF THE MARKET
1.1. Passengers
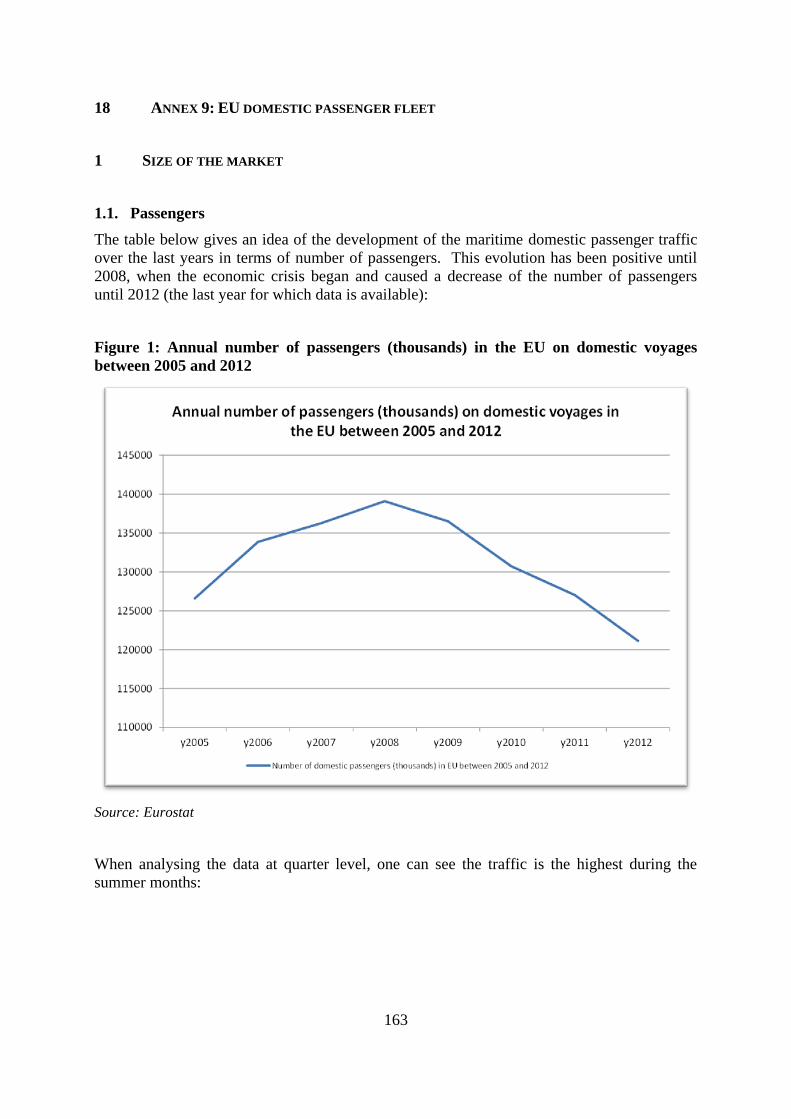
The table below gives an idea of the development of the maritime domestic passenger traffic
over the last years in terms of number of passengers. This evolution has been positive until
2008, when the economic crisis began and caused a decrease of the number of passengers
until 2012 (the last year for which data is available):
Figure 1: Annual number of passengers (thousands) in the EU on domestic voyages
between 2005 and 2012
Source: Eurostat
When analysing the data at quarter level, one can see the traffic is the highest during the
summer months:
164
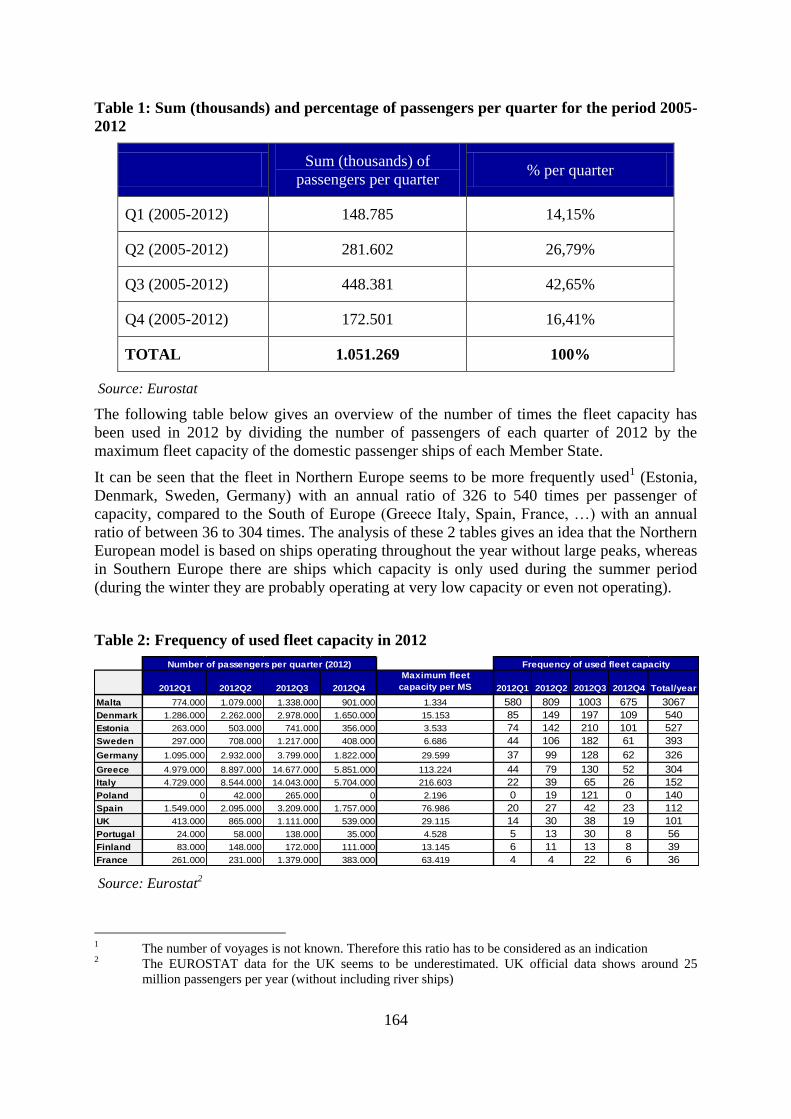
Table 1: Sum (thousands) and percentage of passengers per quarter for the period 2005-
2012
Sum (thousands) of
passengers per quarter % per quarter
Q1 (2005-2012) 148.785 14,15%
Q2 (2005-2012) 281.602 26,79%
Q3 (2005-2012) 448.381 42,65%
Q4 (2005-2012) 172.501 16,41%
TOTAL 1.051.269 100%
Source: Eurostat
The following table below gives an overview of the number of times the fleet capacity has
been used in 2012 by dividing the number of passengers of each quarter of 2012 by the
maximum fleet capacity of the domestic passenger ships of each Member State.
It can be seen that the fleet in Northern Europe seems to be more frequently used1 (Estonia,
Denmark, Sweden, Germany) with an annual ratio of 326 to 540 times per passenger of
capacity, compared to the South of Europe (Greece Italy, Spain, France, …) with an annual
ratio of between 36 to 304 times. The analysis of these 2 tables gives an idea that the Northern
European model is based on ships operating throughout the year without large peaks, whereas
in Southern Europe there are ships which capacity is only used during the summer period
(during the winter they are probably operating at very low capacity or even not operating).
Table 2: Frequency of used fleet capacity in 2012
Source: Eurostat2
1 The number of voyages is not known. Therefore this ratio has to be considered as an indication 2 The EUROSTAT data for the UK seems to be underestimated. UK official data shows around 25
million passengers per year (without including river ships)
2012Q1 2012Q2 2012Q3 2012Q4
Maximum fleet
capacity per MS 2012Q1 2012Q2 2012Q3 2012Q4 Total/year
Malta 774.000 1.079.000 1.338.000 901.000 1.334 580 809 1003 675 3067
Denmark 1.286.000 2.262.000 2.978.000 1.650.000 15.153 85 149 197 109 540
Estonia 263.000 503.000 741.000 356.000 3.533 74 142 210 101 527
Sweden 297.000 708.000 1.217.000 408.000 6.686 44 106 182 61 393
Germany 1.095.000 2.932.000 3.799.000 1.822.000 29.599 37 99 128 62 326
Greece 4.979.000 8.897.000 14.677.000 5.851.000 113.224 44 79 130 52 304
Italy 4.729.000 8.544.000 14.043.000 5.704.000 216.603 22 39 65 26 152
Poland 0 42.000 265.000 0 2.196 0 19 121 0 140
Spain 1.549.000 2.095.000 3.209.000 1.757.000 76.986 20 27 42 23 112
UK 413.000 865.000 1.111.000 539.000 29.115 14 30 38 19 101
Portugal 24.000 58.000 138.000 35.000 4.528 5 13 30 8 56
Finland 83.000 148.000 172.000 111.000 13.145 6 11 13 8 39
France 261.000 231.000 1.379.000 383.000 63.419 4 4 22 6 36
Number of passengers per quarter (2012) Frequency of used fleet capacity

165
1.2. Ship owners
Greece (with about 100 ship owners) is the country that has by far the largest number of ship
owners. In all the other Member States the number of ship owners ranges between 1 and 40.
Greece is also one of the Member States where a large majority of these ship owners own
only one domestic passenger ship (see table below). This gives an indication of the
importance of SMEs among Greek ship owners.
Figure 2: Number of ship owners per MS (country of operation)
Source: MS 2014/09 FC Questionnaire + MARINFO (EMSA)
0
20
40
60
80
100
120
Number of shipowners (companies) per country of operation
Number of shipowners (companies)

166
The following table can nevertheless give an idea of the ship owners’ company sizes:
Table 3: Number of domestic passenger ships (under Directive 2009/45/EC) per ship
owner in each Member State
Source: MS 2014/09 FC Questionnaire + MARINFO (EMSA)
Most (259) of the ship owners with ships under Directive 2009/45/EC only manage one
domestic passenger ship. This has nevertheless to be taken with caution, as some of the ship
owner companies also have ships in other materials or also organise international voyages.
The turnover and number of jobs that is created thanks to this specific domestic passenger
traffic market in the ship owner sector is very difficult to quantify as some of the companies
(more usually those with more ships) may also be trading internationally.
One can make a rough estimation (for all domestic passenger ships falling under Directive
2009/45/EC) based on data provided by 2 ship owners with Class A and HSC ships and 1 ship
owner with Class B ships. The total estimated turnover and full time equivalent (FTE)
positions has therefore to be considered as a rough estimation.
Considering that a Class A ship has on average 80 FTE per ship (including shore personnel),
and that a Class B ship has on average 30 FTE per ship, this Class B average number of FTE
can be extrapolated to the ships of other classes.3
3 First divide the average maximum capacity per type of ship (Class C, Class D or HSC) by the average
maximum capacity of a Class B ship. Multiply this number by 30 FTE (average number of FTE on a
Class B ship). As such, we obtain on average 20 FTE per Class C ship, 17 FTE per Class D ship and 24
per HSC ship. Then multiply these FTE averages by the number of ships in each class (69 Class A ships
* 80 FTE = 5520 FTE; 166 Class B ships * 30 FTE = 4980 FTE; 262 Class C ships * {(313 pax Class
1 ship 2 to 3 ships 4 to 5 ships 5 to 10 ships 11 to 20 ships More than 20
Denmark 31 6 1
Estonia 4 3
Finland 15 1 2
France 5 6 1
Germany 17 2 2 3
Greece 68 9 2 1
Ireland 1 2
Italy 24 10 7 6 2
Malta 1 3
Netherlands 16 3
Norway 19 1 2 2 2
Poland 3 1
Portugal 1 2
Romania 1
Spain 24 5 2 1
Sweden 20 4 1 1 1
United Kingdom 9 2 1 1 1
Total 259 60 15 18 5 4
Number of ships owned per shipowner in each country of operation
167
Based on these hypotheses, the employment created by the ship owners with domestic
passenger ships under Directive 2009/45/EC represents about 24.014 FTE’s in the European
Union.
The same exercise can be done in order to have a rough estimation of the turnover of the
domestic passenger traffic market. Based on an annual turnover of EUR 14,6 million per
Class A ship or HSC ship, the turnover per Class B, C and D ship can also be calculated by
extrapolating this amount in function of the average passenger capacity of Class B, C and D
ships, multiplied by the number of ships in each class.
The turnover created by the ship owners with domestic passenger ships under Directive
2009/45/EC represented EUR 5.798 million in 2013.
On the other hand, a recent study commissioned by EMSA and carried out by a consortium of
ship owners, shipyards and led by a Classification Society on damage stability4, provides a
figure of USD 50.000 of turnover (about EUR 45.000) per passenger of capacity per year for
ships with more than 80m and 1.000GT. Taking this value and extrapolating to small ships
with proportionate lower values, the turnover would be around EUR 20.000 million.
Therefore, with the data available, the best approximation that can be made to the market
value of the domestic passenger ships in the EU would be between EUR 6 and EUR 20
billion of annual turnover.
C/481 pax Class B)*30} FTE = 5240 FTE; 272 Class D ships * {(272 pax Class D/481 pax Class
B)*30} FTE = 4624 FTE; 152 HSC ships * {(386 pax HSC/481 pax Class B)*30} FTE = 3648 FTE) 4 EMSA 3 study, available at: http://emsa.europa.eu/damage-stability-study.html
168
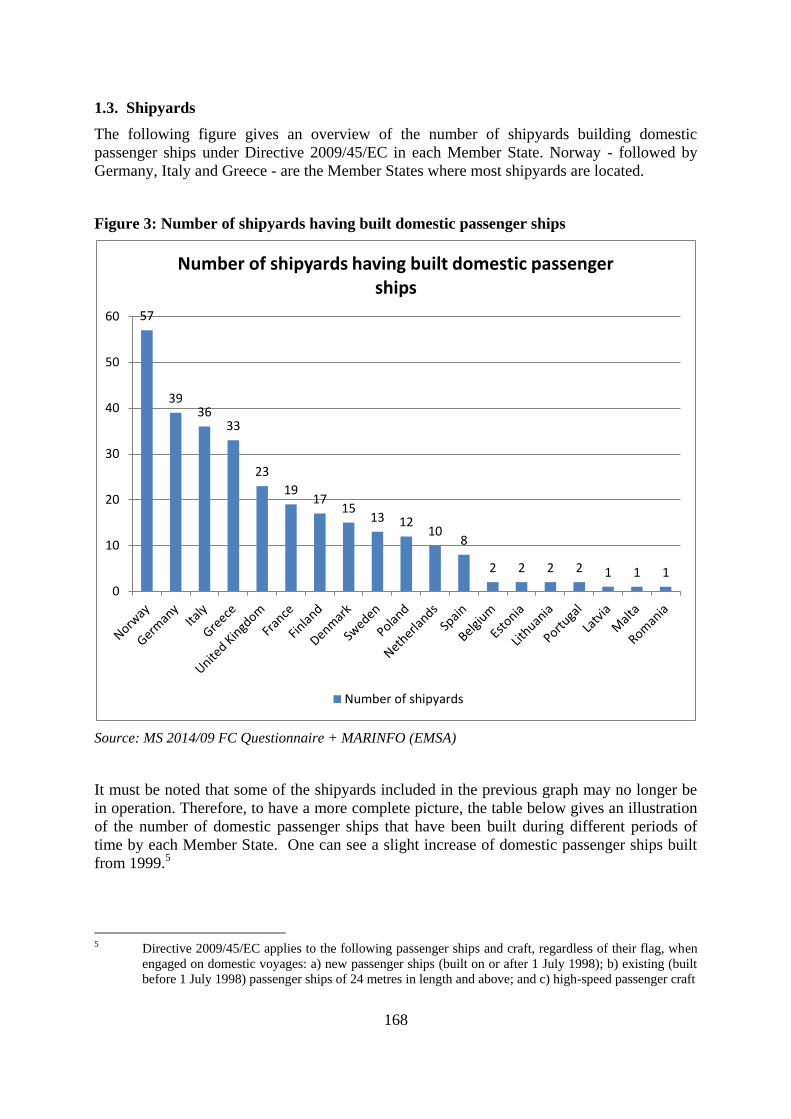
1.3. Shipyards
The following figure gives an overview of the number of shipyards building domestic
passenger ships under Directive 2009/45/EC in each Member State. Norway - followed by
Germany, Italy and Greece - are the Member States where most shipyards are located.
Figure 3: Number of shipyards having built domestic passenger ships
Source: MS 2014/09 FC Questionnaire + MARINFO (EMSA)
It must be noted that some of the shipyards included in the previous graph may no longer be
in operation. Therefore, to have a more complete picture, the table below gives an illustration
of the number of domestic passenger ships that have been built during different periods of
time by each Member State. One can see a slight increase of domestic passenger ships built
from 1999.5
5 Directive 2009/45/EC applies to the following passenger ships and craft, regardless of their flag, when
engaged on domestic voyages: a) new passenger ships (built on or after 1 July 1998); b) existing (built
before 1 July 1998) passenger ships of 24 metres in length and above; and c) high-speed passenger craft
57
3936
33
23
1917
1513 12
108
2 2 2 2 1 1 1
0
10
20
30
40
50
60
Number of shipyards having built domestic passenger ships
Number of shipyards

169
Table 4: Number of the domestic passenger ships (under Directive 2009/45/EC) built per
period in each Member State
Source: MS 2014/09 FC Questionnaire + MARINFO (EMSA)
The figure below presents the evolution of new orders of domestic passenger ships (built in
the Member States and outside Europe). From 1971 to 1998, there has been a slight increase
in new orders. In the period 1999-2006, new orders of domestic passenger ships increased by
28%. After that period, the economic crisis had an impact on the ship building market: 75
fewer ships were built in the period between 2007 and 2014.
Till 1970 1971-1980 1981-1990 1991-1998 1999-2014
Belgium 0 1 0 0 1
Denmark 5 6 3 14 11
Estonia 0 0 0 0 2
Finland 5 5 5 5 2
France 1 5 4 4 10
Germany 24 28 10 7 8
Greece 3 8 14 16 21
Italy 5 24 22 15 54
Latvia 0 0 0 0 5
Lithuania 0 0 0 0 6
Malta 0 0 1 0 1
Netherlands 4 1 0 8 1
Norway 18 31 19 20 47
Poland 2 1 3 0 20
Portugal 0 0 2 0 0
Romania 0 0 0 0 5
Spain 0 1 0 3 18
Sweden 5 3 6 3 4
United Kingdom 4 3 21 10 13
TOTAL 76 117 110 105 229

170
Figure 4: New orders of domestic passenger ships per period
Source: MS 2014/09 FC Questionnaire + MARINFO (EMSA)
The table below gives an idea of the production of domestic passenger ships expressed in GT
(Gross Tonnage) and CGT (Compensated Gross Tonnage) for each Member State, which
gives a measure of the shipyard activity related to domestic passenger ships falling under
Directive 2009/45/EC.
Compensated Gross Tonnage (CGT)6 is an indicator, developed by the OECD, of the amount
of work that is necessary to build a given ship and is calculated by multiplying the tonnage of
a ship by a coefficient, which is determined according to the type and size of a particular ship.
In the case of a passenger ship, the CGT is calculated as: CGT = 49 * (gt^0, 67), where 49 is
the factor representing the influence of the ship type (in this case: passenger ship) and 0,67
the factor which represents the influence of the ship size (of the passenger ship).
In following table, the GT of every ship falling under Directive 2009/45 has been multiplied
with this formula, and CGT of all ships have been summed up per Member State (where the
ships have been built).
6 Statistical information on new ships completed is available on a country or global basis in gross tons, as well as
partly in deadweight tons. Figures in gross tons are available for all ship types, but not the number of man-hours,
the use of materials and the amount of yard-hardware used in their production. Resources used to build one gross
ton differ widely with the size and type of ship. By multiplying figures in gross tons with CGT coefficients, which
reflect the work content of each type and size of ship, it is possible to convert the ever changing product mix into
CGT figures, which reflect with some accuracy worldwide shipbuilding activity (Source: “Compensated Gross Ton
(CGT) system, 2007, OECD, council working party on shipbuilding)
129 132141 140
179
104
0
20
40
60
80
100
120
140
160
180
200
Till 1970 1971-1980 1981-1990 1991-1998 1999-2006 2007-2014
New orders of domestic passenger ships per period
Number of domestic passenger ships

171
Table 5: Total GT and CGT of all domestic passenger ships under Directive 2009/45/EC
built in the EU per Member State
Country GT CGT
Italy 800.974 1.625.055
Norway 216.288 765.527
Germany 288.563 651.457
Spain 311.947 603.128
Greece 64.875 284.753
United Kingdom 71.348 270.155
Netherlands 139.251 268.753
Sweden 136.722 257.312
Denmark 42.159 177.969
Poland 49.312 174.841
Finland 43.042 126.327
France 36.128 122.237
Romania 34.700 91.807
Lithuania 27.152 80.679
Belgium 7.024 22.792
Latvia 4.106 21.306
Portugal 450 3.691
Malta 366 3.213
Estonia 308 2.860
TOTAL 2.274.715 5.553.863
Source: MS 2014/09 FC Questionnaire + TRACTEBEL + MARINFO (EMSA)
The shipbuilding activity related to domestic passenger ships falling under Directive
2009/45/EC is highest in Italy, Norway and Germany. Figure 3 shows that Norway has the

172
highest number of shipyards building this type of ships but the CGT is much lower than Italy
where there are fewer shipyards than in Norway. It can be deduced that the shipyards in Italy
are building more and/or bigger domestic passenger ships than the shipyards in Norway.
2 SEGMENTATION OF THE MARKET
The domestic passenger ship market can be segmented with respect to different parameters:
Area of operation (in or out port areas);
New or existing ships (built before or after the Directive entered into force)
Building material (steel, aluminium, composite or wood).
Size of ship (>= or < 24m in length); and
Type of activity (regular services)
An analysis of the evolution of the figures related to these different segmentations is not
possible as data about the situation in the past are not available (e.g. information about ships
that are not operating anymore). Only information on segmentation about the current situation
has been collected in the fitness check Member States questionnaire of September 2014.
2.1. Area of operation
According to the Member States 2014/09 fitness check questionnaire, EU domestic passenger
fleet include around 3175 vessels trading in sea areas A, B, C and D (including HSC) as
defined by Directive 2009/45/EC and around 900 ships operating exclusively in port areas as
defined by Member States. The ships operating exclusively in port areas are out of the scope
of the Directive.
Ships operating in the Directive sea areas can also be outside the scope of the Directive due to
the construction material: only ships built in steel or equivalent are within the scope. Out of
the ships operating in the sea areas under the scope of the Directive, around 30% of them are
certified according to the Directive representing 62% of the passenger capacity, i.e. the largest
ships are certified according to the Directive. The average passenger capacity of ships under
the Directive is 420 as compared to 104 for ships not certified under the Directive.

173
Figure 5: Distribution of number of ships operating in Directive Sea Areas
Source: MS 2014/09 FC Questionnaire
Figure 6: Distribution of passenger capacity for ships operating in Directive Sea Areas
Source: MS 2014/09 FC Questionnaire + MARINFO (EMSA)
174
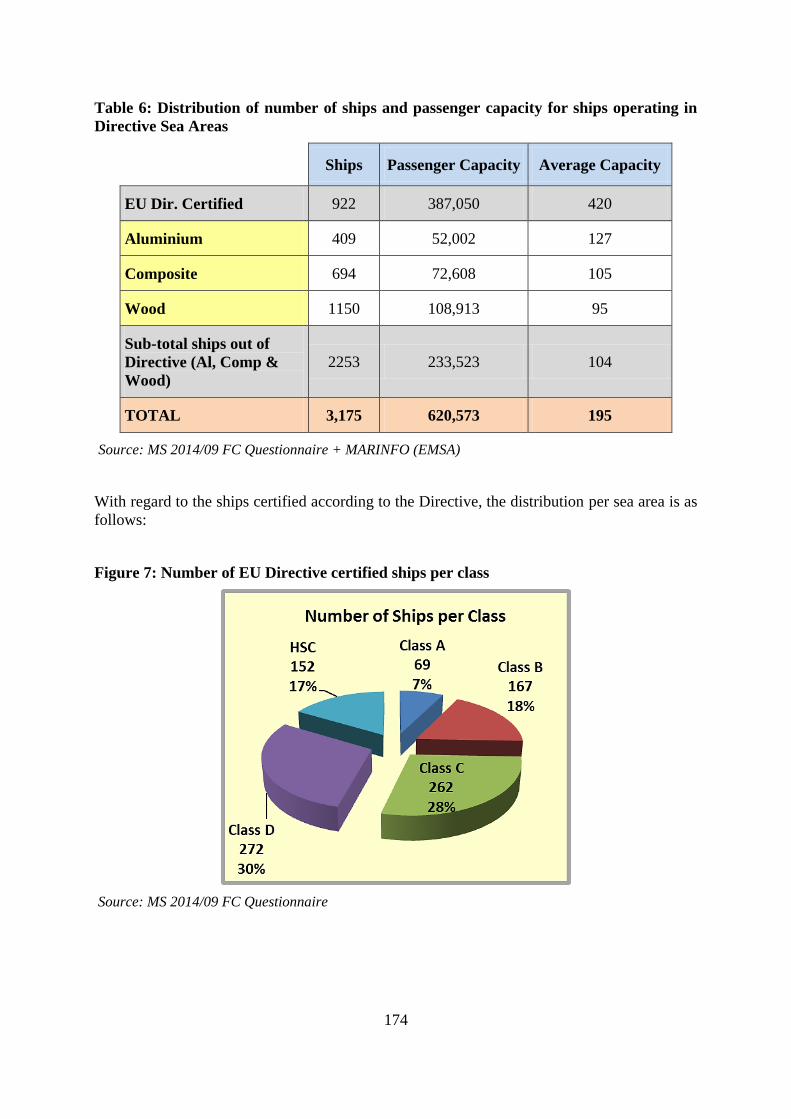
Table 6: Distribution of number of ships and passenger capacity for ships operating in
Directive Sea Areas
Ships Passenger Capacity Average Capacity
EU Dir. Certified 922 387,050 420
Aluminium 409 52,002 127
Composite 694 72,608 105
Wood 1150 108,913 95
Sub-total ships out of
Directive (Al, Comp &
Wood)
2253 233,523 104
TOTAL 3,175 620,573 195
Source: MS 2014/09 FC Questionnaire + MARINFO (EMSA)
With regard to the ships certified according to the Directive, the distribution per sea area is as
follows:
Figure 7: Number of EU Directive certified ships per class
Source: MS 2014/09 FC Questionnaire

175
Figure 8: Passenger Capacity of EU Directive certified ships per class
Source: MS 2014/09 FC Questionnaire
Table 7: Number and passenger capacity for EU Directive certified ships
Ships Passenger Capacity Average Capacity
Class A 69 92,414 1,339
Class B 167 79,961 479
Class C 262 82,120 313
Class D 272 73,908 272
HSC 152 58,647 386
TOTAL 922 387,050 420
Source: MS 2014/09 FC Questionnaire + MARINFO (EMSA)
As expected, Class A ships have, on average, the largest capacity. While they represent 7% of
the fleet, their passenger capacity is 24% of the total.

176
2.2. New or existing ships (built before or after the Directive entered into force)
The Directive distinguishes between existing (built before the Directive entered into force)
and new ships (built after the Directive entered into force). This distinction is more relevant
for Classes B, C and D. The existing ships of these classes had to be adapted to the Directive
requirements within a certain time frame (already elapsed) but with a certain degree of
flexibility. According to the data available7 (see table below), more than 75% of the ships
certified under the Directive for Classes C and D are “existing”. With regard to Class B, 70%
of the ships are “existing”:
Table 8: Number of new and existing Class B, C & D ships
New Ships Existing Ships
Class B Number 50 114
% 30% 70%
Class C Number 46 186
% 20% 80%
Class D Number 50 161
% 24% 76%
Source: MS 2014/09 FC Questionnaire + MARINFO (EMSA)
2.3. Analysis of materials of passenger ships
As indicated above, the EU passenger ship fleet includes around 3175 vessels trading in sea
areas A, B, C and D as defined by Directive 2009/45/EC. Such vessels are built in four
different materials: (1) steel, (2) aluminium, (3) composite and (4) wood. In the following
points an analysis by material is presented.
Ships built in steel
Steel ships fall under the scope of the Directive 2009/45/EC, with the sole exception of
existing ships of less than 24m or those operating in port areas. Out of the 922 ships certified
according to the Directive, steel ships accounts for 742 (including one built in iron). It has
also to be noted that two vessels flying the French flag, are not sailing in European waters
(Indian Ocean).
In the tables and graphs below a more detailed analysis of the fleet is carried out.
7 The data displayed in the table is related to ships for which the year of construction is available in
MARINFO

177
Figure 9: Number of steel ships and passenger capacity
Source: MS 2014/09 FC Questionnaire + MARINFO (EMSA)
A first classification is made with respect to the ship's length, i.e. below or above 24m. In this
respect, more than 92% of the ships are above 24 m in length representing 98% of the
passenger capacity for steel ships. In the table below more details are provided.
Table 9: Classification of EU certified ships built in steel per size
< 24 m > 24 m Total
Ships 60 682 742
% of Ships 8% 92% 100%
Passenger Capacity 6,643 320,558 327,201
% Pass. Capacity 2% 98% 100%
Source: Member States 2014/09 fitness check questionnaire + MARINFO (EMSA)
178
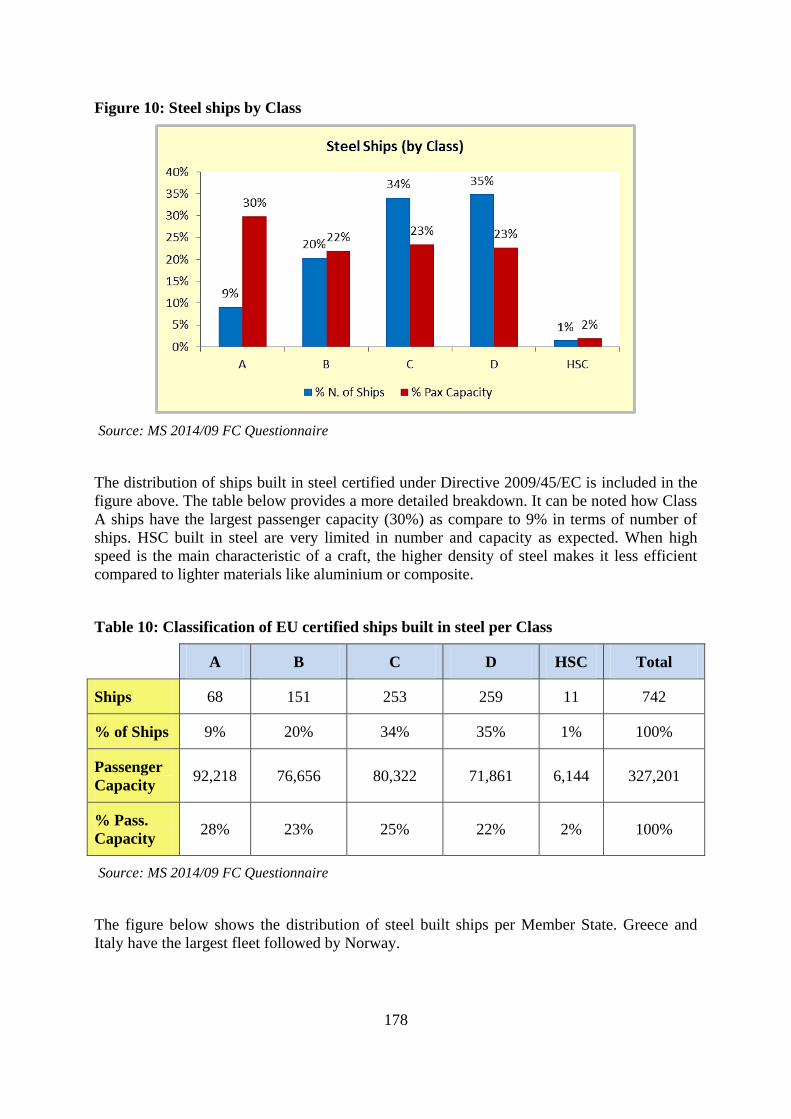
Figure 10: Steel ships by Class
Source: MS 2014/09 FC Questionnaire
The distribution of ships built in steel certified under Directive 2009/45/EC is included in the
figure above. The table below provides a more detailed breakdown. It can be noted how Class
A ships have the largest passenger capacity (30%) as compare to 9% in terms of number of
ships. HSC built in steel are very limited in number and capacity as expected. When high
speed is the main characteristic of a craft, the higher density of steel makes it less efficient
compared to lighter materials like aluminium or composite.
Table 10: Classification of EU certified ships built in steel per Class
A B C D HSC Total
Ships 68 151 253 259 11 742
% of Ships 9% 20% 34% 35% 1% 100%
Passenger
Capacity 92,218 76,656 80,322 71,861 6,144 327,201
% Pass.
Capacity 28% 23% 25% 22% 2% 100%
Source: MS 2014/09 FC Questionnaire
The figure below shows the distribution of steel built ships per Member State. Greece and
Italy have the largest fleet followed by Norway.

179
Figure 11: Steel ships by Member State (Source: MS 2014/09 FC Questionnaire)
Table 11: Average age of steel fleet (Source: MS 2014/09 FC Questionnaire+MARINFO, EMSA)
<5 years >20 years >25 years >30 years >40 years Average
Class A Number 5 25 16 13 0
18 % 7% 36% 23% 19% 0%
Class B Number 9 99 84 65 41
29 % 5% 59% 50% 39% 25%
Class C Number 13 168 139 112 66
35 % 5% 64% 53% 43% 25%
Class D Number 23 141 118 99 59
30 % 8% 52% 43% 36% 22%
HSC Number 0 1 1 0 0
15 % 0% 1% 1% 0% 0%
TOTAL Number 50 434 358 289 166
30 % 5% 47% 39% 31% 18%
Ro-Ro Number 39 244 188 137 54
23 % 9% 59% 45% 33% 13%

180
Table 12: Average age of the complete fleet
<5 years >20 years >25 years >30 years >40 years Average
Class A Number 5 25 16 13 0
18 % 7% 36% 23% 19% 0%
Class B Number 10 105 89 68 41
29 % 6% 63% 53% 41% 25%
Class C Number 13 171 142 114 68
35 % 5% 65% 54% 44% 26%
Class D Number 23 147 122 102 61
31 % 8% 54% 45% 38% 22%
HSC Number 26 26 11 4 0
13 % 17% 17% 7% 3% 0%
TOTAL Number 77 474 380 301 170
27 % 8% 51% 41% 33% 18%
Ro-Ro Number 42 248 189 137 54
23 % 9% 55% 42% 30% 12%
Source: MS 2014/09 FC Questionnaire + MARINFO (EMSA)
As it can be noted in the tables above, large part of the steel fleet is built after 1975 (82%).
About 40% of the fleet is older than 25 years. HSC comprise the youngest part of the fleet
with an average age of 13 years. These ships are mainly built in material other than steel. This
is clear when comparing the average age of the steel fleet (30 years) with the average age of
the complete fleet (27 years), which means that the ships built in materials other than steel,
mainly HSC, decrease the average age.
Within the steel fleet, Class A ships are the youngest ships with an average age of 18 years,
whereas Class C ships are the oldest with an average age of 35 years.
The average age of ro-ro passenger ships is 23 years, with 30% of the fleet older than 30
years. It is likely that the inclusion of traditional sailing ships has skewed the age profile of
the fleet, increasing the average age.

181
Figure 12: Distribution of steel ships by GT and number of passengers
Source: MS 2014/09 FC Questionnaire + MARINFO (EMSA)
In the figure above it can be seen the distribution of steel built ships per Gross Tonnage (GT)
versus Number of ships. Large part of the fleet is made of relatively smaller ships below
5,000 GT.
Figure 13: Distribution of steel ships by GT and Froude number
Source: MS 2014/09 FC Questionnaire + MARINFO (EMSA)
In the figure above it can be seen the distribution of steel built ships by Gross Tonnage (GT)
versus Froude number8 (Fn). It is worth noting that the fleet is sailing around Fn 0.3. Only
smaller vessels, well below 5000 GT are sailing above Fn 0.5 and hold a HSC certificate.
8 Froude number = speed/square root of (gravity acceleration*length of the ship)

182
Figure 14 – Distribution of steel ships by year of built and Froude number
Source: MS 2014/09 FC Questionnaire + MARINFO (EMSA))
In the figure above it can be seen the evolution of the Fn against Year of Built. Interestingly
the average Fn is fairly constant over the years (Fn = 0.3) showing that over the past 60 years
the service speed has not increased.
Ships built in aluminium
In the tables and graphs below a detailed analysis of the fleet of aluminium built ships is
carried out. The analysis is carried out in the following order:
1. aluminium built ships for which the Member States have not issued a Directive 2009/45/EC
certificate;
2. aluminium built ships for which the Member States have issued a Directive 2009/45/EC
certificate;
3. aluminium built ships aggregated data.
183
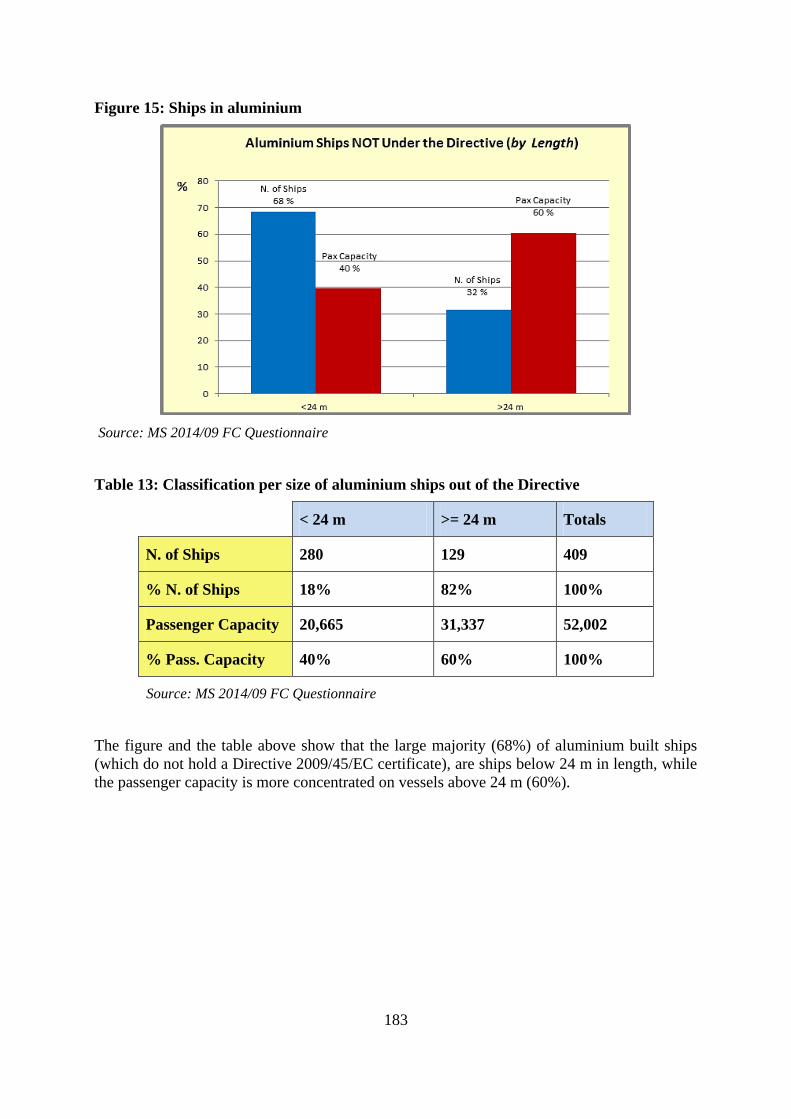
Figure 15: Ships in aluminium
Source: MS 2014/09 FC Questionnaire
Table 13: Classification per size of aluminium ships out of the Directive
< 24 m >= 24 m Totals
N. of Ships 280 129 409
% N. of Ships 18% 82% 100%
Passenger Capacity 20,665 31,337 52,002
% Pass. Capacity 40% 60% 100%
Source: MS 2014/09 FC Questionnaire
The figure and the table above show that the large majority (68%) of aluminium built ships
(which do not hold a Directive 2009/45/EC certificate), are ships below 24 m in length, while
the passenger capacity is more concentrated on vessels above 24 m (60%).

184
Figure 16: Ships in Aluminium out of the Directive per Member State
Source: MS 2014/09 FC Questionnaire
The figure above shows the aluminium built ships distribution (which do not hold a Directive
2009/45/EC certificate), by Member States. It clearly emerges that France has the largest
share (82%) with 337 vessels of 409 vessels in total. These vessels are then certified under
various national standards with navigation permitted in sea areas of 5 nm or 20 nm from the
coast line. Only very few hold a sailing permit beyond the 20 nm. However, it is not possible
to assess how many of these vessels hold a HSC Certificate.
Figure 17: Ships in Aluminium out of the Directive – France
Source: MS 2014/09 FC Questionnaire + MARINFO (EMSA)
185
A closer look to the aluminium built ships flying the French flag shows that nearly half of
such vessels is sailing in French waters outside European waters.
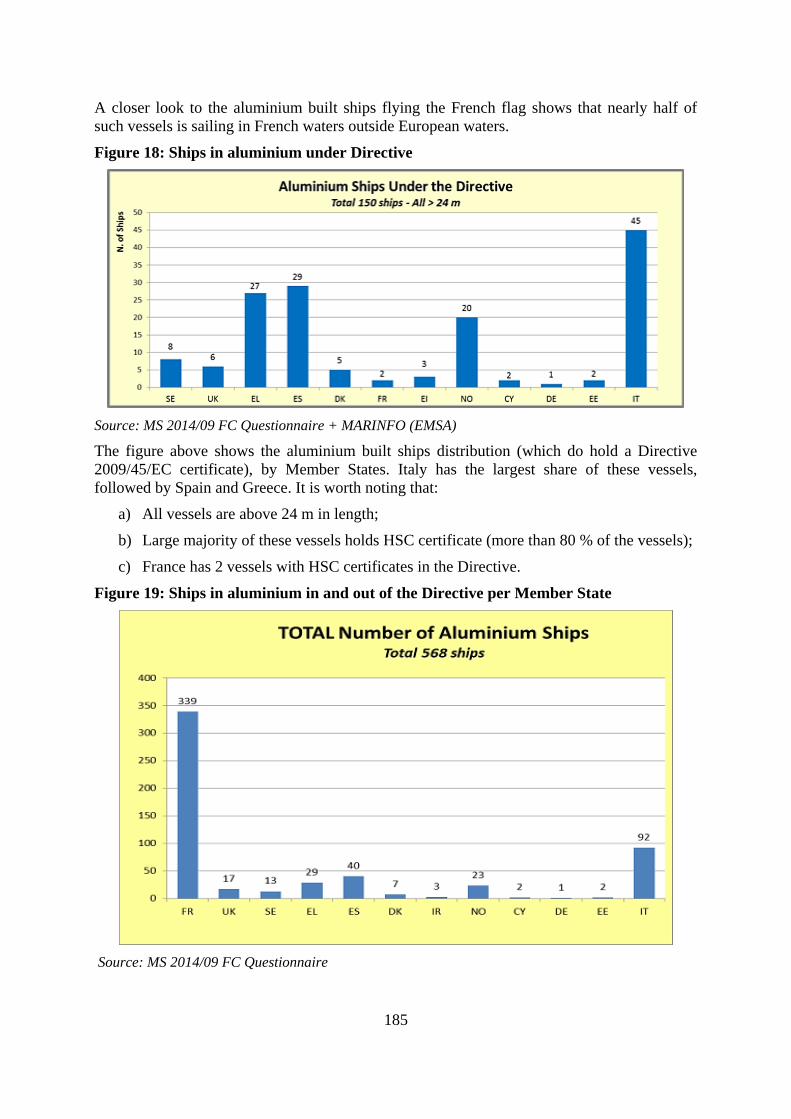
Figure 18: Ships in aluminium under Directive
Source: MS 2014/09 FC Questionnaire + MARINFO (EMSA)
The figure above shows the aluminium built ships distribution (which do hold a Directive
2009/45/EC certificate), by Member States. Italy has the largest share of these vessels,
followed by Spain and Greece. It is worth noting that:
a) All vessels are above 24 m in length;
b) Large majority of these vessels holds HSC certificate (more than 80 % of the vessels);
c) France has 2 vessels with HSC certificates in the Directive.
Figure 19: Ships in aluminium in and out of the Directive per Member State
Source: MS 2014/09 FC Questionnaire
186
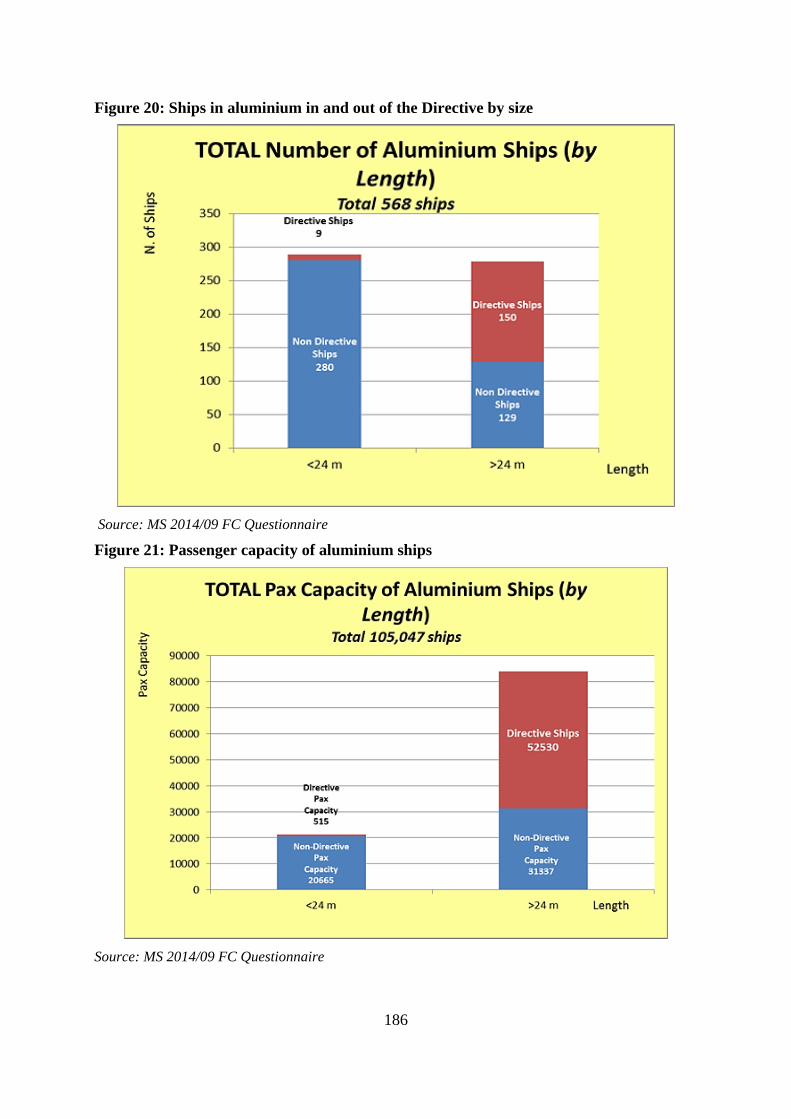
Figure 20: Ships in aluminium in and out of the Directive by size
Source: MS 2014/09 FC Questionnaire
Figure 21: Passenger capacity of aluminium ships
Source: MS 2014/09 FC Questionnaire

187
The figures above show the total passenger capacity of aluminium built ships which carry a
Directive certificate and ships not carrying such a certificate. The total passenger capacity for
the aluminium built ships fleet is greater than 100.000 passengers, with about 80% of capacity
concentrated in vessels above 24 m. In terms of number of ships, in total there are 568, 50%
above 24m and 50% below 24 m. France has by far the largest share in terms of number of
ships (60%) and about 30% of the passenger capacity, which is distributed in European
continental waters and overseas as shown below:
Figure 22: Passenger capacity of aluminium ships in France
Source: MS 2014/09 FC Questionnaire
The figure below shows the aluminium built ship fleet in terms of passenger capacity versus
number of ships. It emerges that most of the vessels are carrying far less than 200 passengers.
Figure 23: Aluminium ships by number of passengers
Source: MS 2014/09 FC Questionnaire
188
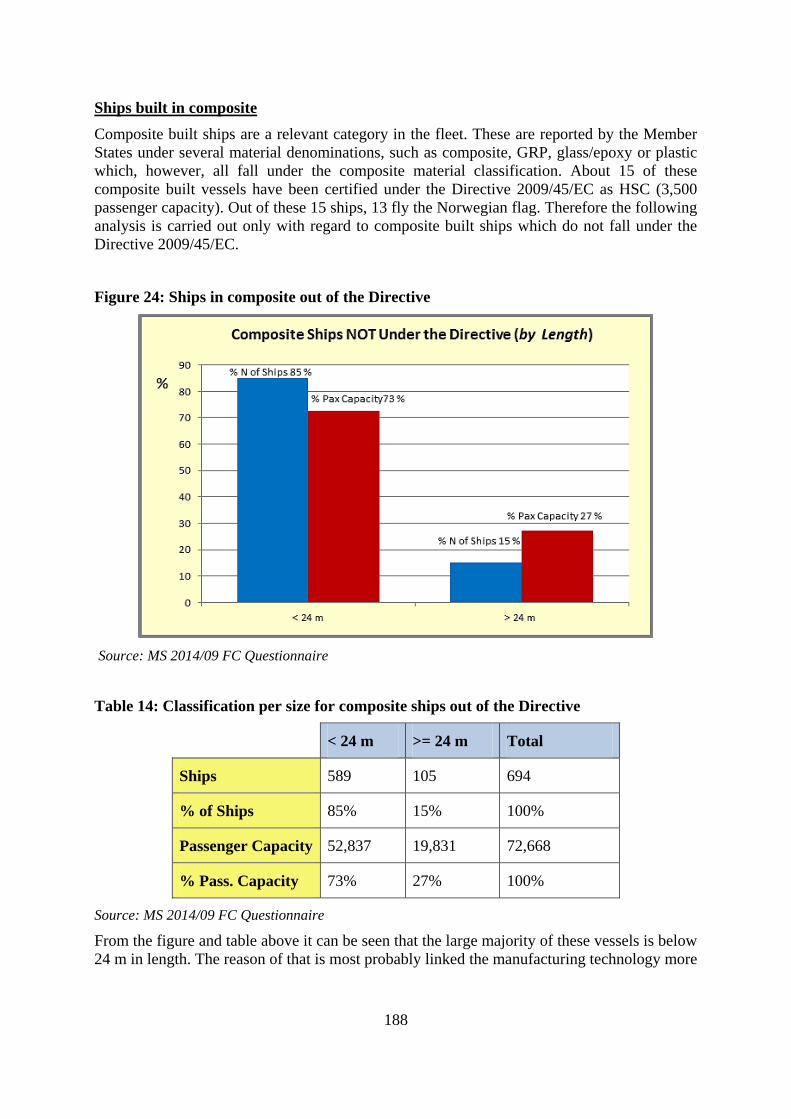
Ships built in composite
Composite built ships are a relevant category in the fleet. These are reported by the Member
States under several material denominations, such as composite, GRP, glass/epoxy or plastic
which, however, all fall under the composite material classification. About 15 of these
composite built vessels have been certified under the Directive 2009/45/EC as HSC (3,500
passenger capacity). Out of these 15 ships, 13 fly the Norwegian flag. Therefore the following
analysis is carried out only with regard to composite built ships which do not fall under the
Directive 2009/45/EC.
Figure 24: Ships in composite out of the Directive
Source: MS 2014/09 FC Questionnaire
Table 14: Classification per size for composite ships out of the Directive
< 24 m >= 24 m Total
Ships 589 105 694
% of Ships 85% 15% 100%
Passenger Capacity 52,837 19,831 72,668
% Pass. Capacity 73% 27% 100%
Source: MS 2014/09 FC Questionnaire
From the figure and table above it can be seen that the large majority of these vessels is below
24 m in length. The reason of that is most probably linked the manufacturing technology more

189
easily available to smaller yards and to some technological and economic challenges in
scaling up this type of construction.
Figure 25: Ships in composite out of the Directive per Member State
Source: MS 2014/09 FC Questionnaire
In terms of fleet distribution in the Member States, Spain has the largest fleet, followed by
France and Italy.
Figure 26: Ships in composite out of the Directive by number of passengers
Source: MS 2014/09 FC Questionnaire
The figure above illustrates the fleet distribution in terms of passenger capacity versus the
number of ships, providing some examples of vessels in different passenger capacity
segments.

190
Ships built in wood
Wooden built ships constitute a relevant part of the total EU passenger ship fleet, in terms of
number of vessels accounting for around 36% of the total fleet. However, in terms of
passenger capacity, the percentage falls to 18% of the total share. Wooden built ships do not
hold a Directive 2009/45/EC certificate as none of the Member States consider wood as
equivalent to steel. Initially, Denmark included some ships under the Directive, although they
were later removed during the fitness check process. A breakdown of the wooden built ships
is set below:
Figure 27: Classification of wood ships out of the Directive per size
Source: MS 2014/09 FC Questionnaire
Table 15: Classification of wood ships out of the Directive per size
< 24 m >= 24 m Total
Ships 1014 136 1150
% of Ships 88 12 100
Passenger Capacity 77,004 31,909 108,913
% Pass. Capacity 71 29 100
Source: MS 2014/09 FC Questionnaire
The table above shows that most of the wooden built ships both in terms of number of ships
and passenger capacity are vessels below 24 m in length.

191
Figure 28: Wood ships per Member State
Source: MS 2014/09 FC Questionnaire
Italy has by far the largest share of wood built ships (61%) followed by Spain and Greece
(around 10% each.)
Figure 29: Wood ships distribution per passengers
Source: MS 2014/09 FC Questionnaire
The figure above illustrates the distribution of wooden built ships in terms of passenger
capacity versus number of ships. Distribution is skewed towards smaller ships, however there
is a statistically relevant number of vessels with passenger capacity exceeding 150 and up to
450 passengers, which can be considered as a relevant figure for such type of built.

192
All ships under Directive 2009/45/EC
In the following figures, some further data are presented regarding the entire vessels
populations falling under the scope of the Directive 2009/45/EC including steel ships,
aluminium and composite ships (i.e. when a Member State has granted them a Directive
certificate) and HSC. The data presented show only those vessels for which (from the
questionnaire to Member States) figures were provided and therefore the datasets showed in
the figures do not represent the entire population.
The following 3 figures (i.e. 30, 31 and 32) show the distribution of passenger capacity versus
GT for all classes with a closer look at HSC and Class C and D below < 10.000 GT. As can
be easily seen, the large majority of the fleet is well below 5.000 GT and carries less than
1.000 passengers.
Figure 30: All EU Ships under Directive 2009/45/EC
Source: MS 2014/09 FC Questionnaire + MARINFO (EMSA)

193
Figure 31: Zoom (< 10.000 GT) Ships distribution all classes – HSC highlighted
Source: MS 2014/09 FC Questionnaire + MARINFO (EMSA)
Figure 32: Zoom (< 10.000 GT) Ships distribution all classes – Only class C and D
Source: MS 2014/09 FC Questionnaire + MARINFO (EMSA)

194
Figure 33: HSC GT versus Froude Number
Source: MS 2014/09 FC Questionnaire + MARINFO (EMSA)
Figure 33 shows the Froude Number distribution versus GT of the European HSC fleet. As
can be seen, the large majority of HSC is below 1.000 GT. It can also be noted as some data
as submitted by the MS maybe affected by clerical mistakes (such as Fn > 1.20 and < 0.5).
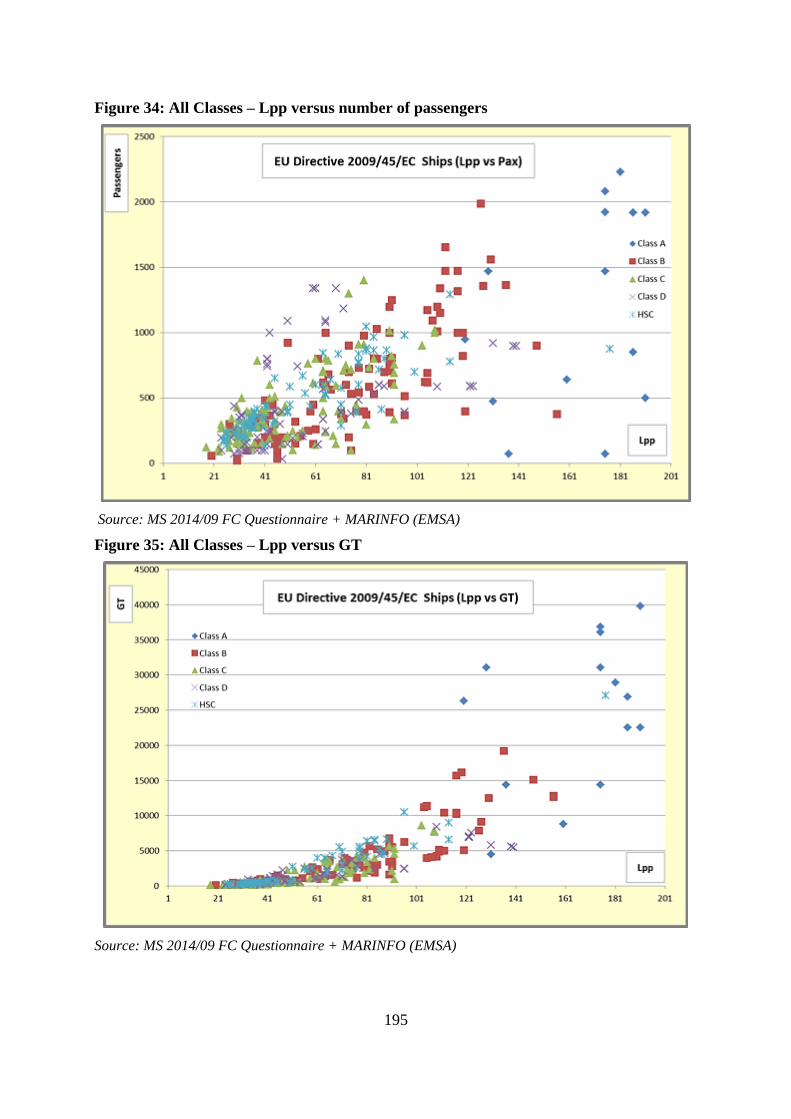
Figures 34, 35 and 36 show Directive 2009/45/EC ships of all Classes. In particular Figure 34
shows the Lpp (Length between perpendicular) versus number of passengers, from which it
can be seen that the bulk of the fleet is between 20 and 100/120 m in length.
Figures 35 and 36 (close-up) are showing the fleet distribution for all Classes Lpp versus GT;
bulk of the fleet between 20-100 in length and < 5.000 GT.
195
Figure 34: All Classes – Lpp versus number of passengers
Source: MS 2014/09 FC Questionnaire + MARINFO (EMSA)
Figure 35: All Classes – Lpp versus GT
Source: MS 2014/09 FC Questionnaire + MARINFO (EMSA)

196
Figure 36: All Classes – Lpp versus N. Passengers – Zoom < 100 m and GT < 5.000
Source: MS 2014/09 FC Questionnaire + MARINFO (EMSA)

197
2.4. Size of ships
With regard to the size of the ships, as already indicated in the previous point, the largest
ships are certified according to the Directive: 92% of the 922 passenger ships covered at
present by Directive are ships of > 24m length. On the other hand, the proportion of passenger
ships outside the scope of the Directive due to their construction material of > 24m length is
16%.
Table 16: Classification per size
No. Ships
>24m
No. ships
<24m
% Ships
>24m
% Ships
<24m
EU Dir. Certified 850 72 92% 8%
Aluminium9 129 280 32% 68%
Composite 105 589 15% 85%
Wood 136 1014 12% 88%
Sub-total of ships out
of Directive (Al,
Comp & Wood)
370 1883 16% 84%
Source: MS 2014/09 FC Questionnaire
It is worth mentioning that the maximum length of the ships above 24m for the ships certified
out of the Directive is around 38m.
9 Includes the ships operating in French Overseas Territories (New Caledonia etc.)

198
2.5. Type of activity of ships
The following table shows that about 50% of the domestic passenger ships under Directive
2009/45/EC are ro-ro passenger ships. These ro-ro passenger ships are, in general, providing
regular services. The following table shows the classification per sea area:
Table 17: Classification of ro-ro passenger ships under Directive 2009/45/EC
Ships Pass. Capacity >400
Pass.
> 250
Pass
% of
Class
% of Pass.
Capacity for the
Class
Class A 66 88,738 58 60 96% 96%
Class B 96 62,727 61 76 57% 78%
Class C 107 46,004 43 62 41% 56%
Class D 144 48,428 32 61 53% 66%
HSC 39 22,830 29 34 26% 39%
TOTAL 452 268,727 223 293 49% 69%
Source: MS 2014/09 FC Questionnaire + MARINFO (EMSA)
As it can be seen in the previous table, around 50% of the ships certified under the Directive
are ro-ro passenger ships representing 70% of the passenger capacity. It can also be noted that
practically all Class A ships have ro-ro capacity vs 26% of the HSC.
Existing data about the activities of the domestic passenger ships under Directive 2009/45/EC
are only related to the fact of whether they are ro-ro passenger ships or not. No other data
about activities of the domestic passenger ships is available.
Most of these ships operate in regular services. Nevertheless, based on the statistics about
passengers and seasonality, it can be estimated that around 70% of the passengers are
transported during the summer period (i.e. second and third quarter of the year), and 30% in
the winter period. This means that the main concentration of the activity is in the period
where good weather conditions are more frequent and where the proportion of daylight and
good visibility conditions is higher. This could also lead to think that ro-ro passenger ships
increment their activity in summer.

199
3 GEOGRAPHICAL DISTRIBUTION OF TRANSPORT ACTIVITY
Next figure gives an overview of the total sum of domestic passengers in the EU per MS
during the period 2005-2012 according to Eurostat. However, the figure corresponding to the
UK seems to be underestimated. UK official data shows around 25 million passengers per
year (not including river ships), which would mean that the UK would be the third EU State
in terms of number of domestic passengers transported. However, the two major countries are
Greece and Italy.
Figure 37: Sum of domestic ship passengers in the EU per MS in the period 2005-2012
(thousands)
Source: Eurostat10
This corresponds with the following figure where it is shown that the biggest part of the
passengers transport is done in the Mediterranean Sea:
10 The data for the UK is probably underestimated in the source used
0
50000
100000
150000
200000
250000
300000
350000
Sum of domestic ship passengers per MS in the period 2005-2012
Number of passengers (thousands)

200
Figure 38: Geographical distribution of passengers per sea basin11
Source: Eurostat + TRACTEBEL
The next figure indicates the geographical distribution of all passenger ships per sea basin,
which corresponds more or less to the geographical distribution of passengers per sea basin.
Although no information is available regarding the number of voyages performed by the
passenger ships, nor about the evolution of the number of ships between 2005 and 2012, a
correlation can be seen between the percentages of ships and percentages of passengers in
each sea basin:
11 MSs of Baltic Sea: Poland, Sweden, Denmark, Estonia, Finland, Germany; MSs of North Sea and Channel:
Germany, Netherlands, UK, Ireland, Belgium, Norway; MSs of Atlantic Coast: France, Portugal; MSs of
Mediterranean Sea: France, Malta, Greece, Spain, Italy, Croatia, Slovenia and Black Sea: Romania
100259; 9% 93903; 9% 2616; 0%
873137; 82%
Geographical distribution of passengers per sea basin (2005-2012)
Baltic Sea
North Sea & channel
Atlantic Coast
Mediterranean Sea

201
Figure 39: Geographical distribution of the reported passenger ships in the EU per sea
basin
Source: MS2014/09 FC Questionnaire + TRACTEBEL
234; 7%
470; 15%
55; 2%
2397; 76%
2; 0%
Geographical distribution of the reported passenger ships in the EU per sea basin
Baltic Sea
North Sea & channel
Atlantic Coast
Mediterranean Sea
Black Sea


 XXX COMMISSION STAFF WORKING DOCUMENT ILLUSTRATIVE GUIDANCE ON IMPORT/TRANSIT](https://img.dokumen.tips/doc/110x75/5acf6aac7f8b9a6c6c8d152f/brussels-xxx-swd-2015-79-european-commission-en-european-commission-brussels.jpg)