Embed Size (px)
Citation preview

CEE SPECIAL REPORT
The Children’s Workforce: A Data Scoping Study A Report for the Department of Children, School
and Family (DCSF)
Stephen Machin
Sandra McNally
Dongshu Ou
This research was commissioned before the new UK Government took office on 11 May 2010. As a result the content may not reflect current Government policy and may make reference to the Department for Children, Schools and Families (DCSF) which has now been replaced by the Department for Education (DfE). The views expressed in this report are those of the authors' and do not necessarily reflect those of the Department for Education.
July 2010

Published by
Centre for the Economics of Education
London School of Economics
Houghton Street
London WC2A 2AE
© Stephen Machin, Sandra McNally, Dongshu Ou, submitted July 2010
This work contains statistical data from ONS which is Crown copyright and reproduced with
the permission of the controller of HMSO and Queen's Printer for Scotland. The use of the
ONS statistical data in this work does not imply the endorsement of the ONS in relation to the
interpretation or analysis of the statistical data. This work uses research datasets which may
not exactly reproduce National Statistics aggregates.
This research was commissioned before the new UK Government took office on 11 May
2010. As a result the content may not reflect current Government policy and may make
reference to the Department for Children, Schools and Families (DCSF) which has now been
replaced by the Department for Education (DfE). The views expressed in this report are those
of the authors' and do not necessarily reflect those of the Department for Education.
All rights reserved. No part of this publication may be reproduced, stored in a retrieval system
or transmitted in any form or by any means without the prior permission in writing of the
publisher nor be issued to the public or circulated in any form other than that in which it is
published.
Requests for permission to reproduce any article or part of the Working Paper should be sent
to the editor at the above address.
The Centre for the Economics of Education is an independent multidisciplinary research
centre. All errors and omissions remain the authors.

CEE SPECIAL REPORT
The Children’s Workforce: A Data Scoping Study A Report for the Department of Children, School
and Family (DCSF)
Stephen Machin
Sandra McNally
Dongshu Ou
1. Introduction 1
How do we define the Children's Workforce? 2 What questions can we ask about the Children's workforce? 2
2. The Structure and Evolution of the 'Children's Workforce' 7
The 'Children's Workforce': definition, composition and evolution 7
3. Demographics of Children's Workforce 11
4. Wages and Earnings in the Childcare Sector 15
5. Formulation of a Research Agenda Moving Forward 21
Review of Data Sets – Appendix 23
Annual Survey of Hours and Earnings (ASHE) 24 The Childcare and Early Years Provider Survey 26 Early Years Census (EYC) 30 Labour Force Survey (LFS) 38
National Evaluation of Sure Start (NESS) 44 The National Minimum Data Set for Social Care (NMDS-SC) 46 Ofsted – Registered Childcare Providers and Places in England (2005-2009) 51 SSDS01 (Annual Social Service Staffing) 53

Acknowledgments
Stephen Machin is Director of the CEE, Director of Research at the Centre for Economic
Performance, London School of Economics and a Professor at the Department of Economics,
University College London. Sandra McNally is a Research Fellow and Director of the
Education & Skills Programme at the Centre for Economic Performance, London School of
Economics and Deputy Director of the Centre for the Economics of Education. Dongshu Ou
is a Research Economist at the Centre for Economic Performance, London School of
Economics and a CEE Associate.
1
The Children’s Workforce: A Data Scoping Study
A Report for the Department of Children, School and Family (DCSF)
Stephen Machin, Sandra McNally, Dongshu Ou Centre for Economic Performance, LSE and Centre for the Economics of Education
December 2009 1.1 Introduction
There has been much policy interest on the theme of children‘s services in recent years. For
example, the 1998 National Child Strategy explicitly aims to ensure good quality, affordable
childcare for children aged 0 to 14 in every neighbourhood, including both formal childcare
and support for informal arrangements. The sector has a changed a lot in recent years and a
there are a range of data sets that explore aspects of how it works.
This report explores and describes available data sources on the early years children‘s
workforce, focusing particularly on childcare. We have investigated what administrative or
survey data sets are available and how the data sources could be linked together. We start the
report with a general introduction to what we mean by the ‗children‘s workforce‘ and the sort
of questions that could be asked. We summarise the data sets we have looked at, briefly
commenting on how they could be used in research. In a detailed appendix, we discuss each
of these data sets in turn, highlighting key strengths and limitations. In the core of the text, we
provide an analysis of the children‘s workforce in the Labour Force Survey (occasionally
supplemented with information from the Annual Survey of Hours and Earnings). Finally, we
discuss future directions for research in this context.

2
1.2 How do we define the Children’s Workforce?
By the DCSF definition, “….everyone who works with children and young people and their
families, or who is responsible for improving their outcomes.‖1 However, the data sets that
we collected from different sources and described below mainly focus on the early years‘
children‘s workforce. Furthermore, because of the difficulty in precisely defining the ‗early
years‘ children‘s workforce from the occupational coding, for analysis using the LFS and
ASHE, we will further limit the workforce to those who work in the field of child care and
related services.
1.3 What questions can we ask about the Children’s workforce? There are many research and policy questions surrounding the children‘s workforce. A good
starting point is offering a description of the characteristics of the children‘s workforce and
how this has changed over time. We do this using the Labour Force Survey (LFS) and the
Annual Survey of Hours and Earnings (ASHE) (in Section 4).
Figure 1-1 below is a very simplified representation of the relationships one may want
to investigate (as well as the role of government intervention, which can be in several of these
areas). For example, we may be interested to know the relationship between family
background and choice of child care provision – and how this in turn relates to both female
labour supply and child development.
We may be interested to consider determinants of the quality of child care provision.
This might be related to various characteristics of the child care environment, for example,
child-staff ratio, group size, teacher education and training, safety and program
administration etc. Of particular interest is the quality of the workforce and it is important to
1 DCSF.(2008) Building Brighter Futures: next steps for the children‘s workforce. http://www.dcsf.gov.uk/childrensplan/downloads/7482-DCSF-WorkforceMatters.pdf

3
analyse pay in this context. It is important to consider how participation decisions may be
affected by how well the sector pays and to consider how the sector rewards training and
education (as well as how this changes over time). Our analysis of the LFS starts to consider
these issues.
Figure: 1-1 : Family Background Female Labour Supply Child Care Choice
Price of Child Care Quality and quantity Child Development of Childcare Provision
Supply of Child Care Workers
The ability to analyse these issues depends on the availability of suitable data and the link-
ability of different data sets (where all relevant data are not contained within the same data
set). Major data sets that could be used to address the following themes are listed below:
Child Care Choice; Female Labour Supply: Labour Force Survey (LFS) or Annual
Survey of Hours and Earnings (ASHE).
Child Care Quality: Ofsted Rating Data
Level of Child Care Provision: Early Years Census and Schools Census
Supply of Childcare Workers: LFS/ASHE
Price of Child Care: Child Care and Early Years Providers Survey
Child Development: Early Years‘ Census (linked to child‘s record in NPD)

4
In Table 1-1, we give a very brief summary of available data sets; how they may be linked
and a comment on how they might be used together. In the data appendix we give a
description of all the data sets considered here, including an assessment of their strengths and
limitations.

5
Table 1-1. Data sets in the Scoping Study
Data set Short description Years
available
Link-ability to other
data sets
General comment
Annual Survey of
Hours and Earnings
Annual sample of earnings of
employees in Great Britain
(formerly New Earnings
Survey)
We use 1997-
2007
Local Authority or
above
Need to apply for
permission to use the
data and use it at ONS
Only formally employed workers are included in the survey.
No details about educational qualifications. Good quality
information on wages as usually provided by company
records
Childcare and Early
Years Providers
Survey
Collects information on key
characteristics of the provider,
the number of places and
children attending, staff
characteristics (including pay).
Costs incurred by centres from
2005
Not publicly
available:
1998, 2001,
2003
In Data
Archive: 2005-
2007
Government office
region
DCSF unable to release information at establishment level
because of data security issues.
Different providers surveyed every year.
May be interesting to link with OfSTED quality data (below)
but data would need to be at establishment data to be useful.
Early Years Census Collected annually from 2003.
Contains information relating
to private, voluntary or
independent early years funded
providers.
2003-2009 (at
establishment
level)
2008-09: child
level
Local authority or
above from 2003
Also postcode
Child-level data can be
linked to NPD from
2010
Needs to be used in conjunction with the LEA and School
Information System to be most useful (i.e. to cover early
years/nursery settings funded by the LA).
Very interesting possibilities – especially from 2010
onwards. Most useful will be basic characteristics of
providers (number of providers; number of 3-4 year olds in
the care of different providers; total staff; number of staff
with certain qualifications). For example, one could relate
childcare provision in various dimensions to children’s
Foundation Stage Profile.
Also, interesting to link with OfSTED data on institutional
quality. Could explore the relationship between early year
provider characteristics and OfSTED quality ratings
See note on LFS below
Labour Force Survey Quarterly sample of
households in the UK (about
LFS began in
1973. Earnings
Local authority or
above (but restricted
Main data source for considering changes in the childcare
workforce over time because of good range of labour market

6
120,000 respondents per
quarter). Provides detailed
information on employment,
occupation, education etc.
information
provided from
1994. We use
1994-2008
access). Need to apply
to ONS for permission
to use data with Local
Authority Codes. Also
use data at ONS (if
using individual-level
data with LA codes).
indicators and individual characteristics over time.
Occupational coding changes in 2001 (which affects
categories within the CWF)
Potentially interesting to link with data to quantity and
quality indicators of childcare provision (EYC, School
Census and OfSTED) – and any indicators of expenditure on
childcare by region (not available to us). It would be
interesting to analyse the relationship between quantity and
quality of childcare provision and female labour market
participation (for example)
National Evaluation
of Sure Start
Long-term, wide ranging study
to evaluation the efficacy and
cost-effectiveness of Sure Start
2003-04
Contains a lot
of information
on staffing
That data only covers a
small number of Sure
Start Learning
Programmes in
particular years.
Not clear that data can
be linked to other
available data sets
Unsuppressed data only accessible to Sure Start research
team.
(confidentiality issues)
National Minimum
Data Set for Social
Care
Contains information about the
social care workforce.
2009 Local
Authority/postcode
This is a non-mandatory system and all data are submitted
voluntarily by employers. The data set is small (only 1341
establishments with children’s services as main service
type). Not clear that one would learn much from linking this
to other data sets.
OfSTED. Registered
childcare providers
and places in England
Contains information on
provision type, inspection date
and quality indicator
2005-08 Establishment level
data recently given to
us from OfSTED.
Linkable to Early Years
Census.
Also, potentially useful
at Local Authority level
for linking to the LFS
Potentially very interesting to consider relationship between
quality and provider characteristics (EYC); quality of
childcare and female labour market participation at regional
level (LFS); quality, provider and children’s outcomes
(EYC, School Census, NPD – from this year)

7
2. The Structure and Evolution of the ‘Children’s Workforce’ In this Section we discuss the structure of the Children‘s Workforce and how this has evolved over time. We
mainly use the Labour Force Survey (LFS), occasionally supplemented by information in the Annual Survey
of Hours and Earnings (ASHE). More specifically, we first discuss how the early years’ Children‘s
Workforce is defined in these surveys, its composition, and changes in employment over time. Secondly, we
discuss the profile of the workforce in terms of demographic and educational characteristics and how this
has changed over time. We also consider the characteristics of people who have entered and exited the
workforce over the time considered here. Thirdly, we estimate wage regressions for those in the Children‘s
Workforce – including estimates of returns to educational qualifications. Finally, we comment on how the
survey might be used in future analysis to consider relevant questions.
2.1. The ‘Children’s Workforce’: definition, composition and evolution As discussed above, we focus on the early years’ children‘s workforce. Since occupational classifications in
the LFS and ASHE change over time, in some analyses we have to split the data into two sub-periods: 1993-
2001 and 2002-2008.
Between 1993 and 2001 four occupations fall into our definition: ―nursery nurses‖, ―playgroup
leaders‖, ―educational assistants‖ and ―other childcare and related occupations not elsewhere classified‖.
From 2002, the new occupational classification was implemented (i.e. from Soc90 to Soc2000) and the four
childcare occupations were modified slightly to become: ―nursery nurses‖, ―childminders and related
occupations‖, ―playgroup leaders/assistants‖ and ―educational assistants‖. The below tables gives a brief
definition of each category:2
2 ―Entry, Retention and Loss: A Study of Childcare Students and Workers‖ by Cameron, Owen and Moss (2001), Thomas Coram Research Unit, IOE. Note that these definitions do not correspond exactly to information collected in the Childcare and Early Year Providers Survey. Notably, the latter includes employees in ‗Early Years‘ (i.e. teachers of 4/5 year olds in Nurseries and Schools (Reception classes). These would be classified as teachers in the LFS or ASHE. However, the hourly wage and average weekly hours look similar in the LFS and the Childcare and Early Years Providers Survey.

8
Category Definition Nursery nurses They care for children in day or residential nurseries, children‘s homes, maternity units and
similar establishments. Playgroup leaders3 Playgroup leaders supervise play and other activities for pre-school age children.
Educational assistants4 Educational assistants assist teachers with, or relieve them of, a variety of non-teaching duties. Childminder Registered childminders are self-employed day care providers who offer home-based care and
education in a family setting Other child care and related occupations
Workers in this unit group perform a variety of childcare and related occupations not elsewhere classified in ―Childcare and related occupations‖
Tables 2.1 and 2.2 show the composition of the female child care workforce (most childcare workers) over
the two sub-periods. Estimates are generally quite similar between the LFS and ASHE. In the first sub-
period (1993-2001), the largest categories where ‗educational assistants‘ and ‗other childcare‘. In the second
sub-period (2001-2008), the largest category was educational assistants. In both time periods, the
composition has changed in the direction of an increasing proportion of workers classified as educational
assistants and a lower proportion classified in other categories. If we just consider the second period (2001-
2008), the LFS suggests that the share of (female) childcare workers classified as educational assistants
increased from 52% in 2001 to 65% in 2008
Table 2-1: The proportion of all female childcare workers employed in each occupation (Soc1990.5)
Year Nursery nurses Playgroup leaders Educational assistants
Other childcare (includes ‗playgroup
assistants‘ and ‗childminders‘ among
other things) LFS ASHE LFS ASHE LFS ASHE LFS ASHE 1993 21% 7% 23% 49% 1994 22% 7% 23% 48% 1995 22% 6% 26% 45% 1996 21% 7% 29% 43% 1997 22% 21% 5% 2% 31% 31% 41% 46% 1998 23% 21% 5% 2% 32% 32% 40% 46% 1999 24% 21% 5% 2% 33% 32% 38% 45% 2000 22% 20% 4% 3% 39% 33% 35% 44% 2001 21% 19% 4% 2% 42% 38% 33% 40% Source: Labour Force Survey 1993-2008; Annual Survey of Hours and Earnings, 1997-2007 3 Prior to 2001, playgroup assistants were grouped into this ―other‖ category, while after 2001, playgroup assistants and leaders are placed in the same category. Child-minders were in ―others‖ before 2001. 4 These are teaching assistants at the early years or childcare centres. 5 Analysis of LFS excludes the self-employed and the unpaid family workers.

9
Table 2-2: The proportion of all female childcare workers employed in each occupation (Soc2000) Year Nursery nurses Childminders &
related occ. Playgroup
leaders/assistants Educational assistants
LFS ASHE LFS ASHE LFS ASHE LFS ASHE 2001 26% 11% 11% 52% 2002 26% 28% 9% 7% 10% 7% 55% 57% 2003 26% 26% 9% 5% 10% 7% 56% 63% 2004 26% 24% 9% 4% 9% 7% 56% 64% 2005 25% 24% 8% 5% 9% 6% 59% 65% 2006 24% 23% 8% 4% 8% 7% 60% 67% 2007 23% 21% 8% 3% 7% 7% 62% 68% 2008 22% 6% 7% 65% Source: Labour Force Survey 1993-2008; Annual Survey of Hours and Earnings, 1997-2007 Figures 2.1 shows how the children‘s early years‘ workforce has changed over time in terms of the
proportion of the working age population employed as ‗early‘ childcare workers.6 The percentage is higher
and has increased faster among female workers. It is of interest to compare this to trends for primary and
nursery teachers over the same period (Figure 2.2). In contrast, the trends have been much less marked. This
further illustrates how the ‗early years and child care‘ part of the children‘s workforce has shown particular
expansion over this time.
6 We also plot the share of child care workforce as a percentage of all employees rather than as a percentage of working age population. The patterns are similar.

10
Figure 2-1: Percentage of Employees Who Worked in Child Care and Related Services 93-08 Sources: Labour Force Survey Notes: Female childcare workers as a percentage of the female working age population (age 16-59). All childcare workers as a percentage of working age population (age 16-59 for females; age 16-64 for males). Figure 2-2: Primary and Nursery Teacher Employees as a Percentage of the Total Workforce, 1993-2008
Childcare workers (incl. mid-day assistants) as a percentage of the
workforce, 1993-2008
0.00%
0.50%
1.00%
1.50%
2.00%
2.50%
3.00%
3.50%
4.00%
4.50%
5.00%
1993 1994 1995 1996 1997 1998 1999 2000 2001 2002 2003 2004 2005 2006 2007 2008
Female workers
All workers
Teacher employees as a percentage of the workforce, 1993-2008
0.0%
0.2%
0.4%
0.6%
0.8%
1.0%
1.2%
1.4%
1.6%
1.8%
2.0%
1993 1994 1995 1996 1997 1998 1999 2000 2001 2002 2003 2004 2005 2006 2007 2008
Female workers
All workers

11
3. Demographics of Children’s Workforce
Table 3-1 summarises the characteristics of childcare workers and how they have changed over the decade
according to the LFS. The analysis is restricted to workers who say that ‗child care‘ is their main job. The
Table shows that the average age of employees is 40; the sector is predominantly female and most workers
are British nationals. There has been little change over time in these dimensions. However, the sector has
changed in that the percentage of child care workers employed in the public sector has increased from about
56% in 1994 to 62% in 2008.7 The proportion working as self-employed or unpaid has reduced from 16% in
1993 and 10% in 2008. Interestingly, the proportion of people working full-time has increased considerably
– from 33% in 1993 to 49% in 2008. Together with the increase in the number of child care workers, this
suggests that overall supply of children‘s workforce has increased even more than the participation rate
would suggest (Figure 2-1).
There has been a marked change in the composition of the early children‘s workforce in terms of
their educational credentials. This is shown in Table 3-2. In column (1) it can be seen that the proportion of
childcare workers who had not completed schooling by age 16 was around 30 percent in the early 1990s, but
this rate had fallen below 10 percent by 2005. Likewise, in the early 1990s the majority of childcare workers
were amongst the least educated of the adult population (column (2)). By 2008 just 30 percent of childcare
workers fell into this category. The upgrade in qualifications is true throughout the distribution. In 2008, the
proportion of workers with NVQ Level 4+ was over double what it was in 1993). Although most childcare
workers are not qualified up to this level, the majority (58%) have a qualification to at least to NVQ Level
3.8 This is a huge change since the early 1990s. If we look within sub-categories of workers (between 2002
and 2008), we can see that educational upgrading has occurred across the whole sector (Table 3-2).
7 In the dimensions considered in Table 3-1, workers in the public sector and private sector look similar. A slightly higher percentage of workers in the public sector work full-time (52% in 2008, compared to 48% in the private sector). 8 The public sector has a higher proportion of very highly qualified workers (29% at NVQ Level 4 or above compared to 19% in the private sector).

12
Table 3-1. : Profile of Childcare workers. LFS, 1993-2008 Year Average
Age Female (%)
Full time (%)
Self-employed or unpaid (%)
Public Sector (%)
British nationals (%)
Total workers
1993 38 98.6 33.1 16.0 22.69 95.4 3,675 1994 38 97.8 33.1 16.6 55.7 95.6 4,584 1995 38 97.6 35.8 16.8 56.0 95.8 5,108 1996 38 98.0 34.4 15.7 58.3 95.4 5,252 1997 38 98.0 33.8 16.8 55.0 95.5 5,366 1998 38 97.7 35.5 14.4 57.9 95.5 5,528 1999 39 97.0 35.6 11.9 60.4 96.1 5,854 2000 39 97.5 36.0 10.6 62.9 96.6 6,203 2001 39 96.6 40.8 12.7 58.7 95.8 5,429 2002 39 96.1 45.8 11.9 57.7 96.2 5,592 2003 39 96.3 47.1 12.3 57.3 96.1 5,578 2004 38 96.3 45.6 10.9 58.5 95.6 5,660 2005 40 95.5 46.9 9.7 60.4 96.3 5,810 2006 40 95.8 46.1 10.4 61.3 95.8 5,900 2007 40 95.6 48.5 10.6 60.5 95.7 6,061 2008 40 95.9 49.4 10.3 61.8 95.5 5,904 Note: the analysis on LFS is limited to the workers who took ―child care‖ as their main job.
9 There were many missing values in this indicator in 1993. However, there were 831 out of 1457 who answered the question reported as working in a public sector, which is about 57%.

13
Table 3-2: Qualifications of childcare workers, 1993-2008 (LFS) Highest Qualification (% of all cc workers)
(1) (2) (3) (4) (5) (6) Year Incomplete schooling at the age
of 16 Low educated
1 or more GCSE A*-C
NVQ Level 2+
NVQ Level 3+
NVQ Level 4+
1993 29.0 70.8 56.8 41.6 24.7 11.9 1994 26.7 69.4 59.7 43.0 26.4 11.7 1995 25.2 70.5 60.7 41.5 27.7 12.2 1996 23.2 70.6 62.6 38.4 26.6 10.6 1997 19.9 64.9 66.3 46.6 29.5 12.4 1998 18.8 63.6 67.6 49.4 31.8 14.7 1999 19.9 60.2 69.4 51.8 35.1 15.3 2000 17.8 57.8 71.1 55.2 38.5 16.6 2001 15.0 52.3 76.4 61.8 43.5 20.7 2002 12.4 48.9 78.5 65.0 45.6 22.3 2003 11.8 51.1 79.9 66.5 47.6 22.7 2004 10.8 52.6 81.1 69.1 49.8 22.2 2005 9.6 49.2 83.5 71.6 51.0 22.8 2006 9.7 45.5 84.6 73.6 53.9 25.2 2007 8.6 42.7 86.3 75.7 56.6 26.9 2008 8.4 31.8 87.4 76.9 58.0 25.6 Source: Labour Force Survey, 1993-2008 Notes: (1): ―low education means ―In bottom 30 percent of the entire population‖ (2) Definition of NVQ Levels 2, 3 and 4: NVQ Level 2 means ―A-level or equivalent‖ including GNVQ intermediate, NVQ Level 2, Trade apprenticeship, A,S level or equiv, SCE higher or equiv, City & Guilds advanced craft, OND, ONC, BTEC etc, national. NVQ Level 3 means ―Other Higher Education qualification (excluding first degree and higher degree)‖ including Teaching, secondary education; Teaching, primary education, Teaching, level not stated, Nursing etc, RSA higher diploma, Other HE below degree, NVQ level 3, GNVQ advanced, A level or equivalent, RSA advanced diploma. NVQ Level 4 means ―First degree‖ including First degree, other degree, NVQ level 4, diploma in higher education, HNC, HND, BTEC etc higher. Table 3-3: % of each category with given qualification level 2002 (%) 2008 (%) Nursery Nurse L2+
73.4 86.07
L3+ 53.77 64.71 L4+ 25.22 23.42 Childminder L2+
53.85 65.18
L3+ 32.37 49.05 L4+ 13.97 14.9 Playgroup L2+
62.76 77.83
L3+ 45.56 56.46 L4+ 23.63 21.37 Educational assistant L2+
66.42 77.15
L3+ 47.29 58.65 L4+ 23.97 29.61

14
One of the interesting questions that arise from this is how the new entrants to the Children‘s Workforce
compare to others in the workforce. We consider this question for those who move between occupations in
the Labour Force Survey10 (note: this is not all new entrants as it does not include participants in the LFS
who have entered the Children‘s Workforce out of the time period in which they are in the survey – 5
quarters, as most). Specifically, we compare the occupation of a person in two consecutive quarters in LFS.
On average new entrants to the children‘s workforce are about 9% of all workers observed in two
consecutive quarters. If we look at Table 3-4, we see that the majority of new entrants used to come from the
economically inactive population (1993-2001) but in the more recent period (2002-2008) come from other
types of employment. Of those moving from other jobs, frequently observed previous occupations include
primary and nursery teaching; care assistants and home carers; sales assistants; catering assistants; special
needs education teaching professionals; welfare, community and youth workers; nurses; general office
assistants; cleaners.
Table 3-4: Previous Employment Status and Occupational Groups of the New Entrants in Childcare Services 1993-2001 2002-2008 Previous Employment Status Number Percentage Number Percentage Unemployed 658 19.38 444 15.55 Employed 1133 33.36 1326 46.43 Economically Inactive 1605 47.26 1086 38.02 Total 3396 2856
Table 3-5 shows characteristics of ‗new entrants‘ and those exiting from the children‘s workforce (as
defined above) and compares them to the whole early years‘ children‘s workforce and those not in the
children‘s workforce. In each case, we are only using participants who are observed in two consecutive
periods. We also consider characteristics in the time periods 1993-2001 and 2002-2008, to see if there have
been changes over time.
10 If we compare employed people who move between quarters in the LFS, the average turnover rate is lower in child care and related services compared with all occupations.

15
Table 3.5: Characteristics of new entrants and those exiting from the Children’s Workforce in comparison with other groups Non-CWF All CWF New Entrants Exits 1993-2001 2002-2008 1993-2001 2002-2008 1993-2001 2002-2008 1993-2001 2002-2008 White 92% 90% 96% 94% 91% 88% 95% 94% Female 51% 51% 98% 96% 94% 91% 94% 91% British 96% 94% 96% 96% 93% 91% 96% 95% Age 38 39 38 40 32 36 34 38 No qualification
12% 9% 15% 8% 12% 7% 17% 8%
NVQ Level 1 15% 13% 36% 26% 29% 20% 34% 22% NVQ Level 2 7% 8% 16% 19% 20% 16% 18% 17% NVQ Level 3 14% 14% 18% 25% 17% 22% 18% 23% NVQ Level 4 11% 13% 14% 20% 14% 22% 13% 25% NVQ Level 5 2% 3% 1% 2% 1% 5% 1% 4% Missing NVQ*
39% 40% 7% 8% 0 0 0 1%
Bottom 30th percentile
32% 30% 64% 51% 56% 43% 64% 46%
Completed school by age 16
33% 35% 70% 75% 60% 58% 64% 66%
N 3868446 2457426 36953 33223 3396 2856 2552 2621 *The NVQ indicator is often missing for people who are economically inactive. This does not affect most of our analysis as it is about workers in the Children‘s Workforce. If we consider new entrants, they are younger on average that the rest of the children‘s workforce or those
not in the children‘s workforce. They are more highly qualified than the rest of the children‘s workforce and
more likely to be male (though still predominantly female). Furthermore, in the two sub-periods considered
(1993-2001 and 2002-2008), new entrants have become increasingly well-qualified. If we compare those
who enter and exit the children‘s workforce in the most recent period (2002-08), they are similar in most
dimensions.
4. Wages and Earnings in the Childcare Sector
The average earnings of childcare workers have risen steadily through the decade. As low wage workers,
trends do track closely the increases that have occurred in the national minimum wage. Tables 4-1 and 4-2
show details hours and wages of female workers overall and in the public and private sector respectively.
Table 4-1 shows this data from ASHE whereas Table 4-2 shows the same information from the LFS. The
former is more accurate with regard to earnings as the data comes from employer records and is not self-
reported (as in the LFS). However, average estimates are similar and trends are the same. Figure 4-1 shows
the evolution of hourly wages for various categories in ASHE.

16
Table 4-1: Average hours worked and hourly wages of female childcare workers, 1997-2007 All Public Private Year Hours
per week
Hourly wages (nominal)
Hourly wages (2008)
Hours per week
Hourly wages (nominal)
Hourly wages (2008)
Hours per week
Hourly wages (nominal)
Hourly wages (2008)
1997 17.1 4.25 5.14 14.9 4.37 5.29 26.5 3.54 4.29 1998 18.1 4.60 5.48 15.1 4.69 5.58 29.8 3.94 4.69 1999 19.3 5.11 6.01 16.6 5.27 6.20 29.7 4.36 5.13 2000 19.5 5.20 6.06 16.8 5.38 6.28 29.7 4.33 5.05 2001 20.1 5.38 6.20 17.6 5.53 6.37 30.0 4.55 5.24 2002 24.5 5.85 6.65 23.1 6.11 6.95 29.6 4.89 5.56 2003 23.5 6.35 7.13 22.1 6.78 7.60 28.6 5.03 5.65 2004 23.6 6.35 7.03 22.2 6.54 7.24 28.1 5.82 6.44 2005 24.2 7.36 7.98 23.3 7.74 8.39 27.7 6.08 6.60 2006 24.8 7.54 8.00 24.1 7.84 8.32 28.8 6.43 6.82 2007 24.9 7.65 7.93 24.5 7.96 8.25 28.9 6.43 6.66
Source: Annual Survey of Hours and Earnings, 1997-2007
Table 4-2: Average hours worked and hourly wages of female childcare workers, 1993-2008 (using LFS) All Public Private Year Hours
per week
Hourly wages (nominal)
Hourly wages (2008)
Hours per week
Hourly wages (nominal)
Hourly wages (2008)
Hours per week
Hourly wages (nominal)
Hourly wages (2008)
1993 18.2 6.74 8.87 16.9 4.27 5.60 22.7 3.02 3.95 1994 18.6 6.27 8.11 16.7 6.52 8.44 23.1 3.15 4.08 1995 18.3 5.41 6.82 16.4 6.06 7.62 22.8 3.95 4.99 1996 19.3 4.67 5.74 17.2 5.05 6.21 23.7 3.84 4.73 1997 20.0 4.50 5.43 17.6 5.04 6.08 25.1 3.37 4.06 1998 20.0 4.58 5.44 17.5 4.96 5.90 25.5 3.72 4.42 1999 20.2 4.95 5.81 18.2 5.20 6.10 25.0 4.35 5.10 2000 20.5 5.26 6.13 18.9 5.58 6.50 24.9 4.38 5.11 2001 22.9 5.63 6.47 21.9 6.03 6.93 25.2 4.73 5.43 2002 24.8 6.06 6.88 23.8 6.46 7.32 26.8 5.24 5.94 2003 25.1 6.17 6.90 24.1 6.67 7.47 27.1 5.20 5.82 2004 24.7 6.49 7.16 24.3 6.96 7.68 25.7 5.52 6.09 2005 24.9 6.78 7.36 24.5 7.27 7.89 25.8 5.72 6.21 2006 24.8 6.92 7.32 24.4 7.38 7.80 25.6 5.90 6.25 2007 25.7 7.27 7.52 25.2 7.64 7.90 26.8 6.41 6.62 2008 25.8 7.69 7.68 25.4 8.07 8.07 26.8 6.78 6.78
Source: Labour Force Survey, 1993-2008

17
Figure 4-1: Hourly wages of Female Child Care Workers, using ASHE (in 2008 prices) The change in real wages is different for different groups of workers. If we consider changes between 2002
and 2008 (when we can define categories on the same basis), we see a relatively large rise in average wages
for the lowest paid groups in 2002 (Childminders; Playgroup leaders), with less change for educational
assistants (10%) and hardly any change for Nursery Nurses. This is shown in Table 4-3.
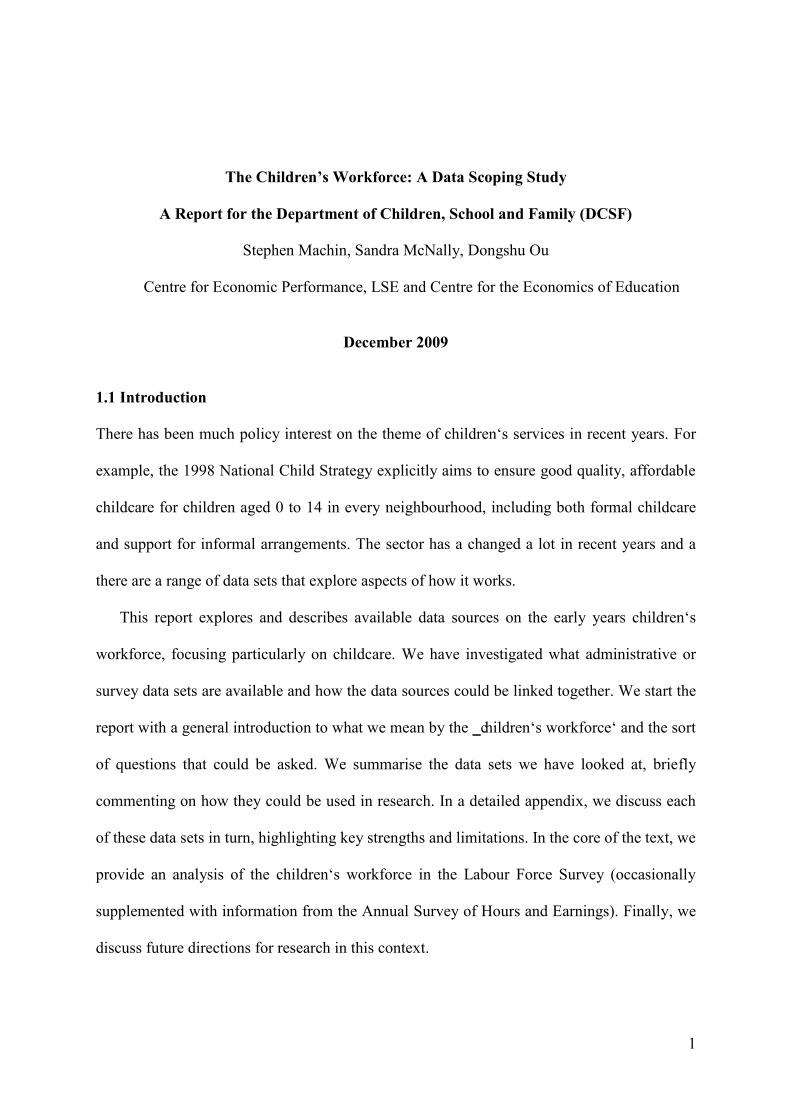
Table 4-3: Hourly Wages by Category (in 2008 prices, standard deviation in parentheses) 2002 2008 % change Nursery Nurses 7.01 (2.73) 7.08(2.65) 1% Childminder & related occupation 5.91(2.62) 7.46(3.26) 26% Playgroup leaders/assistants 6.66(3.80) 8.42(9.79) 26% Educational assistants 7.13(3.94) 7.84(4.58) 10% In Table 4-4a and 4.4b, we show wage and earnings regressions for child care workers in various categories
as well as for all child care workers. The dependent variable is (real) log hourly earnings in Table 4-4a and
(real) log weekly earnings in Table 4-4b. We report both as the latter reflects hours worked as well as the
hourly wage. We relate these measures to whether the person works in the private sector, demographics
(gender, age, and nationality), educational level and whether he/she works part-time. In Panel A, we show
this for the period 1993-2001 whereas in Panel B, we show this for the period 2002-2008. Changes in the
Hourly earnings of female child-care workers, 2008 prices
4.00
4.50
5.00
5.50
6.00
6.50
7.00
7.50
8.00
8.50
9.00
1997 1998 1999 2000 2001 2002 2003 2004 2005 2006 2007
Hourly wage, Constant 2008
Pounds
All childcare workers
Public Sector
Private sector
National Minimum Wage

18
occupational classification make it difficult to compare sub-categories over the two time periods. However,
it makes sense to compare coefficients for child care workers as a whole (final column).
Of particular interest is the strong positive wage gain associated with higher educational
qualifications in both periods. These premia are stronger in the second period. This shows that the demand
for educated workers to be strong and that it has increased in recent years. This is interesting in view of the
large inflow of educated workers to the sector over the same time period. It suggests that demand for
educated workers has been growing faster than the supply. Furthermore, there are increasing returns to
educational qualifications within each sub-category, with the exception of mid-day assistants in schools
(2002-08). In the more recent period (2002-2008), returns are highest for playgroup leaders, followed by
educational assistants.
Other findings from the regressions are a penalty to part-time work (similar overall in both periods);
a negative wage differential from working in the private sector which has declined over time (it is half of
what it was in the earlier period; and not apparent in earnings for the later period at all – suggesting that
people working in the private sector work longer hours); a strong positive effect from being of British
nationality for wages (which has declined to some extent), though no effect for weekly earnings. This shows
that immigrants are in the lower paying jobs and also tend to work longer hours; and a negative pay
differential to being female, which has grown over time – showing that while the sector is predominantly
female, it is males who get the highest paying jobs in the sector.
19
Table 4-4a: Wage regressions for child care workers (dependent variable=hourly wage) Panel A: 1993-2001 (1) (2) (3) (4) (5)
Nursery Nurses Playgroup
Educational Assistant Others ALL
Private Sector -0.376* -0.149* -0.055 -0.242* -0.260* [0.021] [0.050] [0.028] [0.019] [0.010] white 0.029 -0.198 -0.078* -0.148* -0.090* [0.051] [0.184] [0.039] [0.043] [0.024] female 0.054 -0.273 -0.028 -0.038 -0.045 [0.106] [0.177] [0.040] [0.054] [0.028] age 0.060* 0.042* 0.032* 0.024* 0.035* [0.006] [0.015] [0.005] [0.004] [0.002] age-squared -0.069* -0.044* -0.032* -0.022* -0.037* [0.007] [0.018] [0.006] [0.005] [0.003] British -0.025 0.093 -0.067 0.282* 0.184* [0.071] [0.155] [0.057] [0.032] [0.023] NVQ Level 2 0.050* 0.116 0.013 0.024 0.058* [0.026] [0.064] [0.020] [0.023] [0.012] NVQ Level 3 0.072* 0.045 0.044* 0.055* 0.080* [0.026] [0.054] [0.019] [0.022] [0.012] NVQ Level 4 0.133* 0.159* 0.077* 0.093* 0.159* [0.026] [0.058] [0.020] [0.031] [0.013] NVQ Level 5 -0.367 -0.001 0.253* 0.053 0.220* [0.236] [0.262] [0.073] [0.153] [0.050] part-time -0.091 -0.178* -0.080* -0.051* -0.156* [0.021] [0.070] [0.015] [0.023] [0.010] Observations 1924 444 2904 3446 10117 R-squared 0.342 0.279 0.098 0.201 0.220
(1) (2) (3) (4) (5) (6) Panel B: 2002-2008
Nursery Nurses Childminders
Playgroup Leaders
Educational Assistants
Mid-day Assistants ALL
Private Sector -0.284* 0.023 -0.186* -0.062* 0.033 -0.120* [0.015] [0.043] [0.030] [0.014] [0.039] [0.008] white -0.085* 0.083 -0.072 0.004 -0.089* -0.031 [0.034] [0.078] [0.078] [0.020] [0.036] [0.016] female 0.085 -0.199* -0.173* -0.115* -0.042 -0.132* [0.092] [0.092] [0.067] [0.019] [0.064] [0.017] age 0.043* 0.062* 0.026* 0.016* 0.011* 0.030* [0.004] [0.008] [0.006] [0.003] [0.006] [0.002] age-squared -0.047* -0.072* -0.026* -0.013* -0.010 -0.030* [0.005] [0.010] [0.008] [0.003] [0.006] [0.002] British 0.059 0.553* -0.111 -0.050 0.056 0.125* [0.045] [0.057] [0.117] [0.027] [0.054] [0.019] NVQ Level 2 0.018 0.020 0.069* 0.013 0.013 0.042* [0.021] [0.054] [0.041] [0.013] [0.024] [0.010] NVQ Level 3 0.048* 0.061 0.144* 0.045* -0.002 0.087* [0.019] [0.048] [0.036] [0.012] [0.026] [0.009] NVQ Level 4 0.148* 0.173* 0.345* 0.122* -0.030 0.189* [0.020] [0.050] [0.042] [0.012] [0.041] [0.009] NVQ Level 5 -0.078 0.311 0.582* 0.278* -0.247 0.343* [0.093] [0.187] [0.075] [0.028] [0.132] [0.024] part-time -0.112* -0.051 -0.159* -0.072* -0.240* -0.122* [0.015] [0.036] [0.036] [0.009] [0.072] [0.007] Observations 2433 715 940 6596 1670 12354 R-squared 0.336 0.309 0.279 0.099 0.055 0.165 Notes: Standard errors in brackets. p<0.05 * Other controls include ten Government Office Region dummies and year. Individuals with no qualification (NVQ=0) or NVQ Level 1 serve as a reference group for the other four NVQ Level dummies.

20
Table 4-4b: Earnings regressions for child care workers (dependent variable=weekly earnings)
Panel A: 1993-2001 (1) Nursery Nurses (2) Playgroup
(3) Educational Assistants (4) Others (5) ALL
Private Sector -0.308* 0.001 -0.039 0.186* -0.090* [0.028] [0.070] [0.044] [0.027] [0.016] white 0.025 -0.792* -0.015 -0.139* -0.041 [0.066] [0.257] [0.061] [0.063] [0.039] female 0.032 -0.481* -0.010 -0.037 -0.003 [0.138] [0.247] [0.063] [0.078] [0.047] age 0.050* 0.067* 0.059* 0.020* 0.045* [0.007] [0.022] [0.008] [0.005] [0.004] age-squared -0.059* -0.073* -0.061* -0.017* -0.050* [0.010] [0.025] [0.009] [0.007] [0.005] British -0.105 -0.131 -0.165 0.054 0.012 [0.093] [0.216] [0.089] [0.047] [0.038] NVQ Level 2 0.060* 0.168* 0.050 -0.014 0.171* [0.034] [0.089] [0.031] [0.033] [0.020] NVQ Level 3 0.126* 0.136* 0.095* 0.084* 0.224* [0.033] [0.075] [0.030] [0.032] [0.019] NVQ Level 4 0.208* 0.187* 0.092* 0.149* 0.363* [0.034] [0.081] [0.032] [0.044] [0.021] NVQ Level 5 -1.409* 0.393 -0.018 -0.526* 0.237* [0.307] [0.365] [0.115] [0.221] [0.082] part-time -0.880* -1.086* -0.762* -1.407* -1.219* [0.027] [0.097] [0.024] [0.034] [0.016] Observations 1924 444 2904 3446 10117 R-squared 0.473 0.421 0.312 0.453 0.452 Panel B: 2002-2008
(1) (1) Nursery
Nurses (2) Childminders
(3) Playgroup Leaders
(4)Educational Assistants
(5) Mid-day Assistants (6) ALL
Private Sector -0.250* 0.047 -0.177*** -0.053*** 0.352*** -0.009 [0.021] [0.061] [0.046] [0.020] [0.059] [0.013] white -0.091* 0.190* -0.032 0.040 -0.140** 0.034 [0.048] [0.110] [0.120] [0.030] [0.055] [0.027] female 0.165 0.126 -0.246** -0.168*** -0.437*** -0.160*** [0.130] [0.129] [0.102] [0.027] [0.097] [0.029] age 0.027* 0.084*** 0.055*** 0.040*** 0.046*** 0.047*** [0.005] [0.011] [0.010] [0.004] [0.008] [0.003] age-squared -0.030*** -0.103*** -0.061*** -0.040*** -0.043*** -0.053*** [0.007] [0.014] [0.013] [0.005] [0.009] [0.004] British 0.069 0.418*** -0.299* -0.062 -0.144* -0.014 [0.064] [0.080] [0.179] [0.038] [0.082] [0.032] NVQ Level 2 0.042 -0.150** -0.011 0.041** -0.052 0.172*** [0.030] [0.076] [0.063] [0.019] [0.036] [0.017] NVQ Level 3 0.077*** -0.011 0.224*** 0.085*** -0.032 0.282*** [0.027] [0.068] [0.056] [0.017] [0.040] [0.015] NVQ Level 4 0.157*** 0.122* 0.458*** 0.154*** -0.213*** 0.402*** [0.029] [0.071] [0.064] [0.017] [0.062] [0.016] NVQ Level 5 -0.032 -0.038 0.556*** 0.251*** -1.225*** 0.487*** [0.131] [0.264] [0.115] [0.040] [0.200] [0.042] part-time -0.862*** -0.983*** -1.080*** -0.650*** -1.701*** -0.982*** [0.021] [0.051] [0.055] [0.013] [0.110] [0.012] Observations R-squared 2433 715 940 6596 1670 12354 0.497 0.494 0.465 0.330 0.272 0.425 Notes: Standard errors in brackets. p<0.05 * Other controls include ten Government Office Region dummies and year. Individuals with no qualification (NVQ=0) or NVQ Level 1 serve as a reference group for the other four NVQ Level dummies.

21
5. Formulation of a Research Agenda Moving Forward
In our data analysis, we have focused on the basic structure of the early year‘s children‘s workforce, how
this has changed over time and studied the wages of these workers. This shows the expansion of the sector,
its change in composition (towards more highly educated workers) and rising wage returns to educational
qualifications. The analysis suggests that the demand for educated workers has been increasing faster than
the supply.
In future work, it would be interesting to separate out the influence of changes in the demand for and
supply of childcare workers on their wages. For example, what implications have changes in government
policy regarding the supply of child care places had for the wages of child care workers? Separating the
influence of demand and supply is only possible with some form of ‗shock‘ to one or the other. Changes in
government policy regarding the supply of child care places constitute such a ‗shock‘. Some progress could
be made on this issue by merging information on the quantity of childcare places from other data sources
(e.g. the Early Years Census and the Schools Census) with the LFS (which could be done at Local Authority
level, subject to permission by ONS). It would also be very useful to have information on government
spending on childcare by region over time and/or the number of Sure Start centres by region over time.
Unfortunately, we have been unable to obtain this information.
Another interesting research issue is how female labour market participation has responded to the
increased availability of child care. Figure 5 shows that the labour market participation of lone mothers has
increased over time. While this may be due to the increased availability of child care, it might also be due to
changing tax incentives or to other changes in the labour market. By relating quantity measures of child care
provision from other data sources to female labour market participation (i.e through the merging of data sets
described above), it would be possible to shed further light on this issue.
Thus, analysis of the LFS and ASHE on their own is very revealing with regard to how this sector
has changed over time. This data scoping study suggests that much more could be learnt from linking
various data sets together – although to do so would need to be part of a much larger, longer term research
project.

22
Figure 5: Labour Force Participation Rate of Mothers in the UK by Marital Status and Age of Dependent Children
Labour Force Participation rate of mothers, by marital status and age of
children
0.30
0.35
0.40
0.45
0.50
0.55
0.60
0.65
0.70
0.75
0.80
1996 1997 1998 1999 2000 2001 2002 2003 2004 2005 2006 2007 2008
Married, children aged 0-4Single, children aged 0-4
Married, children aged 5-16

23
Review of Data Sets - Appendix:
1. Annual Survey of Hours and Earnings (ASHE)
2. The Childcare and Early Years Provider Survey
3. Early Years Census (EYC)
4. Labour Force Survey (LFS)
5. National Evaluation of Sure Start (NESS)
6. The National Minumum Data Set for Social Care (NMDS-Sc)
7. Ofsted – Registered Childcare Providers and Places in England (2005-2009)
8. SSDS01 (Annual Social Service Staffing)

24
1. Annual Survey of Hours and Earnings (ASHE)
Description: The Annual Survey of Hours and Earnings (ASHE) is an annual sample survey of the earnings of employees in Great Britain. The data provides detailed employment information (working hours and earnings) in different occupation and industry. Employers receive a questionnaire which asks for particular employee details at a specified date in the year, including pay, hours of work, pension, job description and location. The main purpose of the survey is to obtain information about the levels, distribution and make-up of earnings, and for the collective agreements which cover them. The early version of ASHE is called the New Earnings Survey (NES), which was replaced by ASHE in October 200411. From October 2004 the New Earnings Survey (NES) was replaced by the Annual Survey of Hours and Earnings (ASHE). Years Covered: 1997-2007 Key Variables: Regional indicators include Local Authority and Government Office Region. Occupation indicators: Occ90 (Occupation based on SOC1990) Occ (Occupation based on SOC2000) Staff: Sex, Age, Full/Part-time marker; Same job marker; Main job marker; Basic paid hours; Total paid hours; Basic pay ; average gross weekly earnings; average gross weekly earnings excluding overtime; average hourly earnings; average hourly earnings excluding overtime; Further detail on how we use ASHE In our analysis on the structure of the child care workforce, we have used ASHE to supplement the analysis in the LFS. The data we have used are as follows: Child care workers: Similar to the LFS, we use the SOC1992 and SOC2000 to identify the child care workers in the Labour Force Survey (LFS) 1997-2007. Details are in LFS ―child care workers‖. However, the total sample in ASHE will be those who were employed in a formal sector. It does not include the self-employees or family workers. Wage: We use the average hourly earnings for the reference period excluding overtime (―hexo‖). Working Hours: We use the basic weekly paid hours worked (―bhr‖). Other variables:
11 At that time a back history of data to 1998 was published to replace the NES data.

25
Full-time: a dummy variable for full time; Turnover: the original variable is called ―Same Job Marker‖ (―sjd‖), which equals to one if the employee has worked in the same job for more than one year and two otherwise. Main-job: a dummy indicating the main job. Public Sector: an indicator for public (―pubpriv‖==1), private sector(―pubpriv‖==2), or unclassified ((―pubpriv‖==0). Female: a dummy for female (―sex‖==2). Age: The age at the survey reference date. Strengths: Information on hours and earnings is collected from employers. It is based on a 1 per cent random sample of jobs on the HMRC PAYE register. It covers all employee jobs in all industries and occupations across the whole of the UK. Thus, it is more accurate than self-reported earnings provided in the Labour Force Survey. According to the ONS, the survey is the most comprehensive source of information on the structure and distribution of earnings in the UK. Limitations: (1) Only formally employed workers are included in the survey. (2) There is very limited demographic information available for these workers, for example, there is no educational information in ASHE. (3) The identification of children‘s workforce is limited by the occupational and industrial coding. (see the Data Appendix in LFS for details). The Standard Occupational Classification (SOC) has been changed during 1997-2007. The SOC was first published in 1990 to replace both the Classification of Occupations 1980 (CO80) and the Classification of Occupations and Dictionary of Occupational Titles (CODOT). SOC 1990 has been revised and updated to produce SOC2000. Contact: The Office for National Statistics

26
2. The Childcare and Early Years Providers Survey Description: The survey collects information from childcare and early year‘s providers on the key characteristics of the provider, the number of places and children attending, staff characteristics and qualifications, training, recruitment and retention issues and income. In 2005, it starts to look at the costs incurred by childcare and early years‘ providers and their income. The survey covers a range of providers. From 2006 onwards the following eight childcare and early years settings have been included in the survey: Childminders; Children‘s centres ; Full-day childcare ; Out-of-school childcare ; Sessional childcare ; Nursery schools ; Primary schools with nursery and reception classes ;Primary schools with reception but no nursery classes.12 The main categories are as follows: Childminders: ―A childminder is registered to look after one or more children under the age of eight to whom they are not related on domestic premises for reward and for a total of more than 2 hours in any day.‖ Early years: ages 4-5. Nursery/reception classes in primary school setting ; nursery schools Childcare: More formal setting. 1-3 year olds. Includes full day/sessional day care; out of school; children‘s centres: ―places where children under 5 years old and their families can receive seamless holistic integrated services and information, and where they can access help from multi-disciplinary teams of professionals.‖
For example, some children‘s centres provide literacy, language or numeracy programmes for parents or carers with basic skills needs. For the purposes of this survey, analysis has focused on full day care provision offered by these establishments. Group providers: (2005 only): Early years and childcare. Numbers Percentage Type 2007 2006 2007 2006 full day care 165,200 159,300 28% 26% full day care in children‘s centres 14,000 10500 2% 2% Sessional 64500 75100 11% 12% after school clubs 50400 54500 9% 9% holiday clubs 51200 68200 9% 11% childminders, working 59,800 57,900 10% 10% childminders, registered 69,200 71,500 12% 12% childcare, total 474,300 497,000 80% 82% Nursery schools 5900 5500 1% 1% Primary schools with nursery and reception classes 64900 58000 11% 10% Primary schools with reception but no nursery classes 53500 48300 9% 8% Early Years, total 118400 106300 20% 18% Total Providers 592,700 603,300 9% 8% Years Covered: 1998, 2001, 2003(not available publicly), 2005-2007 (in Data Archive), 200813 (forthcoming) Key Variables:
o Pay and rewards : paid/unpaid/volunteer etc, average hourly rate o Demographics: Age, disability, ethnicity, gender o Entry requirements: qualification level (defined by CWDC), years of experiences o Recruitment: number of new staffed recruited
12 In 2005 there were only childminders, full day care, out-of-school providers, sessional day care providers. 13 The DCSF will not yet be able to provide the data set for the 2008 survey as this has not yet been published. Once the report is published, the data set will be placed in the data archive where you should be able to access it.

27
o Retention: length of service o Training and development: percentage of all staff working towards a qualification etc.
Geography: Each dataset has regional data, with the 9 regions being ―North East‖, ―Yorkshire & The Humber‖, ―North West‖, ―South East‖, ―South West‖, ―West Midlands‖, ―East Midlands‖, ―East‖ and ―London‖. In most cases the ―North East‖ and ―Yorkshire & The Humber‖ are combined, resulting in 8 regions. The table below summarises this: Dataset Years Variables Number of Regions Childminder 2005-2007 region (2005), breg
(2006) and b4 (2007).
8
Childcare 2006, 2007 breg 8 Early Years 2006, 2007 bkreg 9 Group Providers 2005 region 8 Staff: There is lots of data on staff numbers, qualifications, hours etc. Here is a summary of some of the key variables: Childminder data (2005-2007): ―how long childminder looks after children during term time‖, ―level of highest qualification held‖, ―number of days training received over the past 12 months‖, ―childminder‘s annual/weekly/ net annual income from fees paid by parents‖, ―whether childminder is from black or minority ethnic group‖. Childcare data (2006-2007): ―total number of staff (paid, unpaid, students, volunteers)‖, ―how much senior managers/supervisory staff/other paid childcare staff/early years professional leaders get paid per hour‖, ―number and proportion of staff from black and minority ethnic groups‖, ―number of hours senior manager/supervisory staff/other paid childcare/early years professional leaders work‖, ―number of paid staff at different qualification levels‖, ―number and proportion of paid staff that are male‖, ―number and proportion of paid staff that have a disability‖, ―level of highest qualification that senior manager/supervisory staff/other paid childcare/early years professional leaders hold/are working towards‖, ―type of training provided (first aid/early years training etc)‖, ―whether provider pays any of the costs associated with training‖, ―whether the provider helps staff to receive any other training‖. Early Years data (2006): ―number and proportion of early years staff from a black or minority ethnic group‖, training information as above plus ―whether provider has a training budget‖ and ―whether provider has a written training plan‖, ―how much EY headteachers/qualified EY teachers/EY nursery nurses get paid per year‖, ―number and proportion of paid EY staff that are male‖, ―level of highest qualification of headteachers/qualified EY teachers/EY nursery nurses/other paid EY support staff‖, ―number of hours that headteachers/qualified EY teachers/EY nursery nurses/other paid EY support staff work a week‖. Early Years data (2007): ―number of hours EY professional leaders/senior managers/supervisory staff/other paid childcare staff work‖, ―highest qualification held by EY professional leaders/senior managers/supervisory staff/other paid childcare staff‖, ―how much EY headteachers/qualified EY teachers/EY nursery nurses/other paid EY support staff get paid per year‖, ―number and proportion of early years staff from a black or minority ethnic group‖, ―number and proportion of paid EY staff that are male‖. Group Providers (2005): ―level of highest qualification that senior manager/supervisory staff/other paid childcare staff hold/are working towards‖, ―number of hours that senior managers/supervisory staff/other paid childcare staff work per week‖, ―how much senior manager/supervisory staff/other paid childcare staff get paid per year/per hour‖, ―number and proportion of staff from a black or minority ethnic group‖, ―number and proportion of staff that are male‖, ―type of training provided (first aid/early years training etc)‖, ―whether provider pays any of the costs associated with training‖, ―whether the provider helps staff to receive any other training‖, ―whether provider has a training budget‖ and ―whether provider has a written training plan‖.

28
Strengths: To supplement our analysis of the LFS, one could use this survey to look at how wages of child care workers relate to their own characteristics and to their job characteristics (using the fields described above). Limitations:
1. Difficult to link this data set with other data sets (e.g. OfSTED data on quality ratings) because DCSF cannot release information at establishment level due to issues related to data security and confidentiality. However, DCSF could link OfSTED quality ratings to this data at establishment data and look at how the quality of establishment relates to the characteristics of employees.
2. Limited regional information limits the usefulness of linking it to other surveys on this basis (e.g. to the LFS).
3. Few years publically available. 4. One does not see the same establishments in each year. One reason is that the same contractor has
not run all of the providers surveys to date14.The other most important problem is that: '[t]o reduce the burden on providers, settings selected in the 2006 sample were excluded when drawing the 2007 sample.' (2007 Providers' Survey report, DCSF). This has been the practice adopted throughout the survey to ensure that unreasonable burden is not placed on providers year after year. Therefore it is not possible to link the providers who took part in the survey over the years. Chapter 2 of the providers' survey includes this information and other information about the survey design, sample, weighting etc.
5. The CEYPS surveyed the information about staff for each provider. However, the 2005 survey is not fully comparable with the 2006 and 2007 survey. The numbers of Staff below are from the 2007 Report (table 5.1 in Page 68, table 5.2 in Page 70, Table 3.1 in Page 19 for Childminder‘s information), including both paid and unpaid staff. The Table 5.1 in 2007 Report also divides them into unpaid and paid staff. In general, the numbers of workers in each type of the childcare and early years‘ providers are quite similar in these two years.
Numbers Percentage Type 2007 2006 2007 2006 full day care 165,200 159,300 28% 26% full day care in children‘s centres
14,000 10500 2% 2%
Sessional 64500 75100 11% 12% after school clubs 50400 54500 9% 9% holiday clubs 51200 68200 9% 11% childminders, working 59,800 57,900 10% 10% childminders, registered 69,200 71,500 12% 12% childcare, total 474,300 497,000 80% 82% Nursery schools 5900 5500 1% 1% Primary schools with nursery and reception Classes 64900 58000 11% 10% Primary schools with reception but no nursery classes 53500 48300 9% 8% Early Years, total 118400 106300 20% 18% Total Providers 592,700 603,300 9% 8%
14 The survey series were conducted by British Market Research Bureau (BMRB) on behalf of DCSF from 2003.

29
Contact: Leila Allsopp Early Years, Childcare and Extended Services Analysis and Research (Children and Families Directorate) Tel: 020 7340 8279 Ext. 308279 DCSF Sanctuary Buildings, Great Smith Street, London SW1P 3BT

30
3. Early Years Census (EYC) Description: The Early Years Census is collected annually in January each year from 2003.The EYC establishment level data contains information relating to the Private, Voluntary or Independent Early Years funded provider. The child-level data relating to the individual child taking up Early Years free entitlement was collected nationally for the first time in 2008. Its introduction meant that individual-level data on three and four-year old children in early years settings was available in a similar manner to that collected on children in mainstream schools via the School Census. The individual level data collection from private, voluntary and independent providers has become a statutory requirement on providers and LAs through regulations under Clauses 99 – 101 of the Childcare Act 2006 (Statutory Instrument 2007 No. 712 - The Education (Provision of Information About Young Children) (England) Regulations 2007). This means that EYC is required from any Private Voluntary and Independent (PVI) sector nursery with one or more children receiving funding from the DCSF. The census does not cover early years/nursery settings funded by the LA — these children are included in the School Census return. In addition PVIs without funded children are not required to make a return. In the earlier years, statistics on provision for children under five are published as 'Provision for Children Under Five Years of Age in England' and include data on the numbers of three and four year old children benefiting from some free early years education. Years Covered: The Early Years Census provides establishment level data from 2003 to 2007, and establishment plus child level data from 2008 to 2009. Other aggregated data online:
o Early Years Education Provision for Four Year Old Children in England - January 1999 (Provisional) http://www.dcsf.gov.uk/rsgateway/DB/SFR/s000033/index.shtml
o Provision for children under five years of age in England, January 2000 - Statistical Bulletin
o http://www.dcsf.gov.uk/rsgateway/DB/SBU/b000238/index.shtml o Provision for children under five years of age in England, January 2001
- Statistical Bulletin o http://www.dcsf.gov.uk/rsgateway/DB/SBU/b000300/index.shtml o Provision for children under five years of age in England, January 2002
- Statistical Bulletin o http://www.dcsf.gov.uk/rsgateway/DB/SBU/b000364/index.shtml
Key Variables: Geography: Establishment level data is disaggregated into 10 Government Office Regions (2003 to 2007), 150 Local Educational Authorities (all years, 2003 to 2009), and complete geographical postcodes are provided for all years beginning in 2004 (2004 to 2009). Level Available Years Variable Name Government Office Region (10 regions)
2003 to 2007 gor (2003-2004); govtofficeregion (2005-2007)
Local Educational Authority 2003 to 2009 leaname (2003-2005); LAName (2006-2007); laname (2008-2009)
Postcode 2003 to 2009 ppcode (2004); box7 (2005-2007); cleanestablishmentpostcode (2008); establishmentpostcode (2009)

31
Type of Establishment: There is no data provided on individual establishments prior to 2003. From 2003 onwards, each establishment is categorised as one of 6 provider categories. Between 2003 and 2007 the 6 categories are ―private/voluntary‖, ―registered independent school‖, ―LA day nursery‖, ―portage service‖, ―childminding network‖ and ―other‖. Between 2008 and 2009 the 6 provider categories change slightly, becoming ―private‖, ―voluntary‖, ―registered independent school‖, ―local authority day nursery‖, ―childminding network‖ and ―other‖. Establishments are further classified by the type of service they provide. Summary of provider category information: Years Variable Values and coding 2003 to 2005 provider (2003), provcat (2004),
providercategory (2005) A=Private/Voluntary, B=Registered Independent School, C=LA Day Nursery, D=Portage Service, E=Childminding Network, F=Other
2006 to 2007 providercat 1=Private/Voluntary, 2= Registered Independent School, 3=LA Day Nursery, 4=Portage Service, 5=Childminding Network, 6=Other
2008 to 2009 categoryofeyproviderdescription Private, Voluntary, Registered independent school, Local authority day nursery, Childminding network, Other (coding explained above).
Tabulation of Providers‘ Type, Early Years Census 2007. Type Full-day Care Sessional Care Other Private/Voluntary (1) Day Nursery 37.01% 1.34% 0.28% (2) Playgroup/Pre-school 11.54% 31.53% 0.25% (3) Nursery School 3.17% 1.55% 0.04% (4) Family/Combined/Integrated Centre 0.45% 0.06% 0.02% (5) Other 0.80% 0.22% 0.05% Subtotal 52.97% 34.69% 0.63% Private/Voluntary, total 88.29% Registered Independent Schools 5.73% Local Authority Day Nursey 1.88% Portage Service 0.15% Childminding Network 0.62% Other 3.34% Total Providers 19892

32
Staff: In 2000 information is provided on the number of full time equivalent staff employed in ―nursery schools and nursery classes in primary schools‖ for each Government Office Region and Local Education Authority. This information is further disaggregated into ―teaching staff‖ and ―all adult staff‖. There is also a ―pupil staff ratio‖ for both ―teaching staff‖ and ―all adult staff‖ within nursery schools and classes. More detailed information is available on the number of staff employed from 2004 onwards. This includes information on the number of staff employed at each establishment. The table below summarises the available data on the number of staff employed. Years Variable Information provided 2004-2009 totstaff (2004, 2006, 2007), box54 (2005),
TotalTeachingStaffAtEstablishment (2008-2009)
Total staff
2004-2009 qtstatus (2004, 2006, 2007), box55 (2005), TotalStaffAtEstablishmentWithQTS (2008-2009)
Number with qualified teacher status
2004-2007 care34stf (2004, 2006, 2007), box56 (2005),
Staff involved with the care of 3 & 4 year old children
2004-2007 care34qt (2004, 2006, 2007), box57 (2005)
Staff with qualified teacher status involved with the care of 3 & 4 year old children
2008-2009 TeachingStaffParticipatingInEYEducation Teaching staff participating in early years education
2008-2009 EYStaffWithQTS Teaching staff participating in early years education with QTS
Age of staff: The 2007 report (page 80) provides information on the ―age profile of all paid staff‖ by type of provider (full day care, sessional etc) for 2007, 2006 and 2003. The 2005 report (Page 21)uses different age ranges, as well as different classifications of types of provider. Information from datasets: Variable(s) Information Dataset Years dsage ―Age of all paid staff‖ Childcare 2007 & 2006 qsmage ―Age of senior
manager‖ Childcare; Group Providers
2007 & 2006; 2005
qsag_1 ―Age of supervisory staff – first‖
Childcare; Group Providers
2007 & 2006; 2005
qoag_1 ―Age of other paid childcare staff – first‖
Childcare; Group Providers
2007 & 2006; 2005
qtag_1 ―Age of paid qualified Early Years teachers‖
Early Years 2007 & 2006
qnag_1 ―Age of paid Early Years nursery nurses‖
Early Years 2007 & 2006
qpag_1 ―Age of other paid Early Years support staff‖
Early Years 2007 & 2006
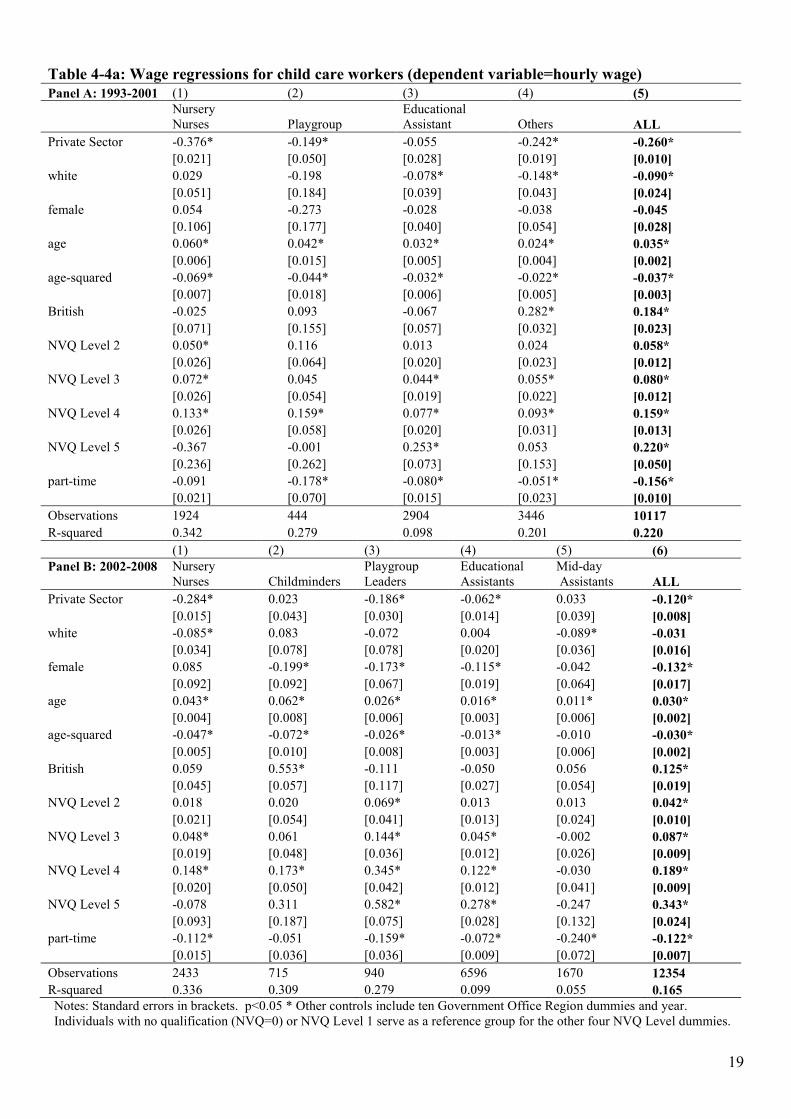
Qualifications: 2007 report (Page 98) gives a table on the ―staff qualifications held by all paid staff (levels 1-8)‖ by type of provider (full day care, full day care in children‘s centres, sessional, after school clubs, holiday clubs and childminders) for 2007, 2006 and 2003. Information on qualifications at different types of provider is given in the 2005 report on page 25, although it is not directly comparable.
33
Information from datasets: Variable(s) Information Dataset Years dsqual ―Level of highest
qualification that paid staff hold‖ - levels 1-8 as in reports
Childcare 2007 & 2006
dsqts ―Whether staff have QTS status‖
Childcare 2007 & 2006
dsqualw ―Highest qualification staff are working towards‖
Childcare 2007 & 2006
qqualif etc ―level of highest qualification that senior manager/supervisory staff/other paid childcare staff hold‖ - levels 1-8 as in reports
Group Providers 2005
qqualif, qqualwo etc ―level of highest qualification of headteachers/qualified EY teachers/EY nursery nurses/other paid EY support staff‖ - levels 1-8 as in reports
Early Years 2007 & 2006
Experience: 2007 report (page 142) provides information on the ―average length of service‖ by type of provider (full day care, full day care in children‘s centres, sessional, after school clubs, holiday clubs and childminders) for 2007, 2006, 2005 and 2003, although there is much missing data in 2005. Information from datasets: Variable(s) Information Dataset Years qsmyear ―Number of years
senior manager has been employed by the provider‖
Childcare; Group Providers
2007 & 2006; 2005
qoem_1 ―How long other paid childcare staff have been employed –first‖
Childcare; Group Providers
2007 & 2006; 2005
qsuh_1 ―How long supervisory staff have been employed –first‖
Childcare; Group Providers
2007 & 2006; 2005
qnuyear1 ―Number of years paid nursery nurses have been employed‖
Early Years 2007 & 2006
qlength ―Number of years headteacher has been employed‖
Early Years 2007 & 2006
qteanum1 ―Number of years paid qualified Early Years teachers have been employed‖
Early Years 2007 & 2006
qpyears1 ―Number of years other paid Early Years support staff have been employed‖
Early Years 2007 & 2006

34
Wages: 2007 report (page 86), ―average (mean) hourly pay‖ by type of provider (full day care, full day care in children‘s centres, sessional, after school clubs, holiday clubs) and ―all staff‖, ―senior managers‖, ―supervisory‖ and ―other paid staff‖. Same information is available on page 64, 2006 report. In the 2005 report (page 23) the information is provided for ―full day‖, ―sessional‖ and ―out of school‖. Information from datasets: Variable(s) Information Dataset Years dsupho1 etc ―how much senior
managers/supervisory staff/other paid childcare staff/early years professional leaders get paid per hour‖
Childcare 2007 & 2006
smpyh etc ―how much senior manager/supervisory staff/other paid childcare staff get paid per year/per hour‖
Group Providers
2005
dqtphr_1 etc ―how much EY headteachers/qualified EY teachers/EY nursery nurses/other paid EY support staff get paid per year/per hour‖
Early Years
2007 & 2006
Provider Characteristics: Age range of children: The 2007 (page 52) report provides information on the percentage of children in each age group at different types of provider (full day care, sessional etc). The 2006 report presents the same chart, although it does not provide the actual percentages (page 42). The 2005 report (Page 17) provides similar information, although the categories are slightly different. Information from datasets: Variable(s) Information Datasets Years 6 variables, one for each age range: q_ages1 to q_ages6
―number of children in different age groups – under two years old‖ etc
Childcare; Group Providers
2007 & 2006; 2005
4 variables, one for each age range: dageu2 to dage8o
―proportion of children within a provider aged under 2 years old‖ etc
Childcare; Group Providers
2007 & 2006; 2005
3 variables: qage3, qage4, qage5
―number of children in different age groups – three years old‖ etc
Early Years 2007 & 2006

35
Number of children catered for: The 2007 report (page49) provides data on the ―mean number of children attending childcare and early years provision‖, by type of provider (same categories as in the above table). Information is provided for 2007, 2006, 2005 and 2003. Page 48 provides information on the gross number of children attending. Information from datasets: Variable(s) Information Datasets Years Qnothol ―number of children
attending in a typical term time week‖
Childcare 2007 & 2006
Totkids ―total number of children looked after‖
Childcare; Group Providers
2007 & 2006; 2005
dtotkids ―total number of children attending‖
Early Years 2007 & 2006
qregist ―number of full time places‖
Early Years 2007 & 2006
qattend ―number of children attending in a typical term time week‖
Early Years 2007 & 2006
Ownership of providers: information is provided on page 28 of the 2007 report on the proportion of ―full day care‖, ―full day care in children‘s centres‖, ―sessional‖, ―after school clubs‖ and ―holiday clubs‖ that are ―private‖, ―voluntary‖, ―Local Authority‖ and ―school/college‖ owned. Data is provided for 2007, 2006 and 2005. Information from datasets: Variable(s) Information Dataset Years 24 dummies, _qnman1 to _qnman24
―who manages provision – Local Authority‖ etc
Childcare 2007 & 2006
13 dummies, _qncov1 to _qncov13
―what fees vary according to – age of child‖ etc
Childcare 2007 & 2006
dlocal ―total funding from Local Authorities/ central government per year‖
Childcare 2007 & 2006
12 dummies, _qsour1 to qsour12
―other source of income – fundraising‖ etc
Childcare; Group Providers
2007 & 2006; 2005
18 dummies, _qmana1 to _qmana18
―who manages provision‖
Group Providers 2005
qlocal ―total funding from Local Authorities/ central government per year‖
Group Providers 2005

36
Type of staff – volunteers etc. Not mentioned in reports. Variable(s) Information Dataset Years Qvolun ―Number of unpaid
volunteers‖ Early Years 2007 & 2006
Qvolunt ―Number of unpaid volunteers‖
Childcare; Group Providers
2007 & 2006; 2005
Variable(s)
Information Dataset Years
8 dummies, _qtypes1 to _qtypes8
Type of provider, ―full day care for children under 5‖ etc
Childcare; Group Providers
2007 & 2006; 2005
13 dummies, _qorg1 to _qorg13
Type of provider, ―playgroup or preschool‖ etc
Group providers 2005
dsample ―Type of provider‖ Early Years 2007 & 2006 (not directly comparable)
Type ―Type of provider‖ Group providers 2005 (different categories to dsample above)
Strengths: This data makes it possible to obtain a useful profile of providers in the Children‘s Workforce and is described in annual DCSF reports. There are another three main ways we suggest that the data could be used for analytical purposes:
1. Together with the School Census, use information on the number of children catered for to obtain a data set (at Local Authority level) on how the supply of childcare has increased over time in different areas. Then merge with the Labour Force Survey (at Local Authority level) to analyse changes in the demand for and supply of children‘s services (discussed in the main text of the report). This assumes one can get permission to use the LFS (at Local Authority) when at the ONS and get permission to merge the data with other data sets at this level.
2. Together with OfSTED data on quality ratings, analyse how the quality of different institutions related to their characteristics (e.g. training and qualifications of staff).
3. Now that the data is at pupil-level, merge information with the National Pupil Database. Then children‘s outcomes (e.g. Foundation Stage Profile) can be related to the type of childcare received (if any) and potentially also its quality (e.g. using OfSTED data).
Limitations:
1. The census does not cover early years/nursery settings funded by the LA — these children are included in the School Census return. Unless the same data is collected in both, providers cannot be compared on exactly the same dimensions.
2. The information collected in the Early Years Census relates only to those providers with funded three and four year old children taking up the free entitlement. Early years‘ providers that are not in this category will not be included in the Census.

37
Contacts: Graham Knox Statistician Children and Early Years Data Unit Data Services Group 1F Area H, Mowden Hall Darlington, DL3 9BG Tel: 01325 392 470 [email protected] Laura Nurse Higher Statistical Officer Children and Early Years Data Unit Tel: 01325 391074 [email protected]
.

38
4. Labour Force Survey (LFS) Description: The Labour Force Survey (LFS) is a quarterly sample survey of households in the UK that provides information about people's employment status and conditions. It asks individuals about their current and previous jobs as well as enquiring about related topics such as training, qualifications, income and disability. The questionnaire design, sample selection, and interviewing are carried out by the Social and Vital Statistics Division of the Office for National Statistics (ONS) on behalf of the Statistical Outputs Group of the ONS. Its purpose is to provide information on the UK labour market that can then be used to develop, manage, evaluate and report on labour market policies. The survey is continuous, with a sample drawn each quarter of approximately 52,000 households, representing around 120,000 respondents, selected from the Postcode Address File. Each sampled household is interviewed for five successive quarters, with some questions varying from quarter to quarter. Households are interviewed face-to-face in the first quarter in which they are included, and afterwards by telephone. The initial response rate in Great Britain is generally over 70 per cent. The LFS began in 1973. It was carried out every two years until 1983. Between 1984 and 1991, data were collected annually and the survey has been running in its present form, with quarterly sampling, since spring 1992. The Labour Force Survey asked employed individuals to report their occupation and industry, and we can use this to identify child care workers (including teachers15). We will use the 1993-2008 data to study the trend and changes of the workers‘ characteristics. Although the individual-level data can be linked to a Local Authority identifier, there are access restrictions. The individual-level data can only be used in conjunction with Local Authority information at the ONS. Years Covered: 199316-present Variable used in our analysis Our analysis only includes women aged 16 to 59. Males were excluded from our analysis because less than four percent of the child care workers were men. Workers with hourly wage higher than £300 were also excluded from the sample (there are very few). Earnings were deflated to a 2008 basis using the consumer price index obtained from the National Statistics website (http://www.statistics.gov.uk/). Statistics on the National Minimum Wage were obtained from:http://www.politics.co.uk/briefings-guides/issue-briefs/employment/national-minimum-wage-$366581.htm Child care workers: 15 The data analysis part will be focusing on child care workers because the policy frame for these early years children‘s workforce is quite different from the workforce in school settings. 16 Note that the LFS data prior to 1993 does not provide wage information. Therefore, we specify here to use data from 1993 onwards for our research purposes.

39
We use the SOC1992 and SOC2000 to identify the child care workers in the Labour Force Survey (LFS) 1993-2008. In particular, in 1993 to 2000, a woman was defined as a child care worker if her main occupation code was 650 (Nursery nurses), 651(Playgroup leaders), 652(Educational assistants), or 659(Other childcare and related occupations n.e.c.) From 2001, SOC2000 were used and a woman was defined as a child care worker if her main occupation code was 6121(Nursery nurses), 6122 (Childminders and related occupations), 6123(Playgroup leaders/assistants), or 6124(Educational assistants). Marital status: We combined 3 LFS variables to create a marital status variable that is consistent across all the years of our analysis. The new variable is coded as follows: 0="D.N.A/N.A", 1="single", 2="married", 3="divorced", 4="separated", 5="widowed", 6="others". The marital status variables we used from the LFS are: Variables Variable name Year17 coding Marital status marcon 1993-1994 See 2007 LFS User
Guide for all coding
Marital status marstt 1995-2005 Marital status marsta 2006-2008 Nationality: We utilised the existing nationality variables in the LFS to create a new variable that is consistent for all years from 1993 to 2008. As advised in the 2007 LFS User Guide (Volume 3), we filtered on both the nato and nation variables between 1993 and 2005 and the nato and ntlty variables from 2006 onwards. This is to ensure accuracy. To further ensure accuracy, we also filtered on the natox (1993-2006) and natox7 (from 2007) variables. Our final nationality variable has 11 values, broadly following the main categories of the natox and natox7 variables. The coding of the new variable is provided here: 1="UK/GB", 2="Other EU", 3="Other Western Europe", 4="Eastern Europe", 5="America", 6="Africa", 7="Indian-Subcontinent", 8="Middle East", 9="Remainder of Asia", 10="Australasia", 11="Other countries". The nationality variables we used from the LFS are: Variables Variable name Year coding Nationality nation 1993-2005 See 2007 LFS User
Guide for all coding
Nationality (other) nato 1993-2007 Nationality (other) natox 1999-2007 Nationality ntnlty 2005-2008 Nationality (other) natox7 2008
17 All years are the reference year (refwky) of LFS.

40
Country of Origin: Our procedure for creating a consistent country of origin variable parallels that of the nationality variable described above. The new country of origin variable is also consistent for all years between 1993 and 2008 and has the same 11 values (and codes) as the nationality variable above. Again, as advised in the 2007 LFS User Guide, we filter on multiple country of origin variables (where possible) to ensure accuracy. Specifically, between 2001 and 2006 we filter on both the cryo and cry01 variables. The country of origin variables we used from the LFS are: Variables Variable name Year coding Country of birth cryo 1993-2006 See 2007 LFS User
Guide for all coding
Country of birth cry01 2001-2006 Country of birth (other)
cryox7 2007-2008
Ethnicity: To create our ethnicity variable, we updated the previous LFS ethcen variable with information from the LFS ethnicity variables introduced in 2001. As the post-2000 ethnicity variables are not directly comparable with ethcen, we filtered on a number of variables to ensure individuals were coded in the correct ethcen category. As an example, to code an individual as ―Black-mixed‖, we filtered on both the ethmx and ethcen15 variables. To code an individual as ―Chinese‖ we filtered on the eth01, ethcen6 and ethcen15 variables. The final coding of the ethcen variable is as follows: 0=―White‖, 1=―Black-Caribbean‖, 2=―Black-African‖, 3=―Black-other (non-mixed)‖, 4=―Black-mixed‖, 5=―Indian‖, 6=―Pakistani‖, 7=―Bangladeshi‖, 8=―Chinese‖, 9=―Other-Asian (non-mixed)‖, 10=―Other-other (non-mixed)‖, 11=―Other-mixed‖. The following ethnicity variables were used:
Variables Variable name Year Ethnic group ethcen 1993-2000
Ethnic group eth01 2001-2008 Mixed ethnic group ethmx 2001-2008 Asian ethnic group ethas 2001-2008 Black ethnic group ethbl 2001-2008 Ethnicity - revised ethcen6 2001-2008 Ethnicity - revised ethcen15 2001-2008

41
Education: We created a number of new education variables, details of which are provided here: 1. Definitions as in Dustmann et. al (2005).18 Degree: Dummy equal to 1 if the individual has a first or higher degree or other degree level qualification. A-level: Dummy equal to 1 if the individual has Higher Education qualification below Degree level, or has A-level or equivalent. O-level: Dummy equal to 1 if the individual has O-level or equivalent or any other Professional-vocational qualifications. O-Level or equivalent is defined here as having GCSEs at grades A*-C or equivalent. The LFS variables used in creating these new education variables are hiquapd, hiquald, hiqual4d, hiqual5d and hiqual8d (see table below for relevant years). 2. Definition as in Manacorda, Manning and Wadsworth (2006)19 ―Low-educated‖ are defined as the bottom 30% of the distribution, when ranked according to the highest level of qualification. To create this variable we used the hiquap, hiqual, hiqual4, hiqual5 and hiqual8 variables from the LFS (see table below). 3. Definition as in Nickell and Saleheen (2008)20 Following Nickell and Saleheen (2008), we consider completing education at the age of 21 to be a proxy for completing a degree; completing education before age 16 to be a proxy for incomplete schooling; and completing education between the ages of 16 and 21 to be a proxy for schooling being completed. To generate these three new dummy variables we used the LFS variable edage. 4. Highest NVQ Level Due to a high level of non-response in a number of LFS variables (in particular levqual), we created a variable to capture the highest NVQ Level obtained by an individual based on the definition by the Office of National Statistics21. This is based on the more accurate hiquap and hiqual(4,5,8) variables. The only addition we made to these variables was for NVQ Level 2, as these variables do not capture whether an individual has passed five or more GCSEs.
18 Dustmann, Christian, and Francesca Fabbri. 2005. ―Immigrants in the British Labour Market.‖. CReAM Discussion Paper No. 07/05. Centre for Research and Analysis of Migration. 19 Manacorda, Marco, Alan Manning, and Jonathan Wadsworth. 2006. ―The Impact of Immigration on the Structure of Male Wages: Theory and Evidence from Britain.‖ London School of Economics, CEP Discussion Paper. No. 754. 20 Nickell, Stephen and Jumana Saleheen. 2008. ―The impact of immigration on occupational wages: evidence from Britain‖. Working paper, Federal Reserve Bank of Boston. 21 See Table 1 in Annex A1 (pp.15). ―National Statistics, Education and Training Theme Working Group: Performance Statistics Quality Review: the mesure of attainment of young people. Project Initiation Document.‖ Retrieved from www.statistics.gov.uk/methods_quality/quality_review/downloads/AttainmentofYP_PID(incannexes).doc. See Also Table 1(pp.16) in ―Design Study for Research on the Impact of Level 2 Qualifications‖ (Blanden et. al, IFS).

42
We therefore also created a dummy variable from numol, numol4 and numol5 which equals 1 if an individual has passed five or more GCSEs. Note, however, that in 1993 numol captures whether an individual has passed four or more GCSEs. To be classified as achieving NVQ Level 2 therefore, an individual must fall within the relevant range of values from hiquap or hiqual(4,5,8) and also have passed five or more GCSEs. The variables we used from the LFS are: Variables Variable name year Highest Qualification
hiquap 1993-1995
hiqual 1996-2003 hiqual4 2004 hiqual5 2005 hiqual8 2008 Highest hiquapd 1993-1995 Qulification hiquald 1996-2003 (Detailed hiqual4d 2004 Grouping) hiqual5d 2005 hiqual8d 2008 Number of GCSE passes
numol 1993-2003
numol4 2004 numol5 2005-2008 Age when completed full time education
edage 1993-2008
Employment status: Following Dustmann and Fabbri (2005) we define the participation rate as the ratio of economically active22individuals over the total (working) population, i.e. females who are aged 16 to 5923. Results are similar when we use the population of aged 16 and above. In particular, the following categories in the variable (INECAC05/INECACR – ―Economic Activity (reported)‖) are used for employment count: Employee; self-employed; government employment & training programmes; unpaid family workers. Individuals under the ―ILO (International Labour Organisation) unemployed‖ are coded as ―unemployed‖. The employment rate is defined as the ratio of individuals working over individuals participating. Accordingly, the unemployment rate equals one minus the employment rate. The inactivity rate is one minus the participation rate.
22 Dustmann and Fabbri (2005) defined economically active individuals include individuals currently unemployed, but seeking for a job. 23 The working age for males is 16 to 64, but we do not include male workers in the child care sector in our analysis.

43
Wage: We use the gross weekly wage to divide by the basic usual hours (―bushr‖) and usual hours of paid overtime (―pothr‖) worked weekly to calculate the hourly wage. Therefore, whenever there is missing information on the basic hours, the hourly wage will be missing as well. Because we consider the workers with main job as child care and related services, we will use the wage for the main job24. Other Variables: Age: Age of individual. Children: Dummies for individuals who have dependent/step/foster children aged 0-2/3-4/5-16 and 0-16 in the family. Strengths: The LFS has the largest coverage of any household survey and asks detailed questions on employment, education and demographic characteristics. It is the source recommended by ONS for certain employment-related statistics, for example, estimates of the number of people in employment and the unemployed. Limitations The sample design provides no guarantee of adequate coverage of any particular industry. The LFS coverage also omits communal establishments, excepting NHS housing and student halls of residence. Members of the armed forces are only included if they live in private accommodation. Workers younger than 16 are also not covered. It can be linked with other data sets through regional level information (Local Authority being the most disaggregate level possible). However, access to the individual-level data which has local authority indicators is restricted and must be used at the ONS. Contact: Quarterly data can be downloaded from the UK Data Archive.
24 There were very few individuals reported the child care and related services as their second job, and many of them do not report the wage information either.

44
5. National Evaluation of Sure Start (NESS) Description: The national evaluation of the Sure Start programme is a long-term, wide ranging study designed to evaluate the efficacy and cost-effectiveness of Sure Start. The first phase of the national evaluation ran from 2001 to 2008 and was undertaken by a consortium of academics and practitioners, led by Professor Edward Melhuish of Birkbeck College, University of London. Further information can be accessed from the website: http://www.ness.bbk.ac.uk/ The information on staff comes from the implementation module of the NESS, which covers the first 260 Sure Start Local Programmes in England. 236 SSLPs have responded: 48 SSLPs set up in Round 1 and 56 SSLPs set up in Round 2 answered the survey questions in 2003. 66 SSLPs in Round 3 and 66 SSLPs in Round 4 finished the survey in 2004. The questionnaire was designed to provide an overview of the numbers of people who are working in each of the Sure Start programmes25 . The questions tend to investigate the staffing situation in programmes on the basis of whether the staff was employed on a full-time, part-time, or on a sessional basis. In addition, questionnaire respondents were asked to indicate how many of these same people were members of the local community; and also, if they were involved in co-ordination and management; and/or in delivering services to families. Other information includes the number of staff attending last staff meeting and details on training provision. Key Variables: (1) Region: gvreg Government Region # of obs EA 13 EM 21 LO 38 NE 30 NW 47 SE 16 SW 17 WM 26 YH 28 (2) Staff related information: For details on variables names and questions, please refer to the Appendix ―National Evaluation of Sure Start- Implementation Module: Second Administration of the National Survey‖. The corresponding page numbers are listed below. Section 1.1. Core Services Staffing (page 1) (1) The numbers of staff and (2) the full-time equivalent of staff (FTE) in each of four core service areas: outreach and home visiting; support to families; health and good quality play; learning and childcare. (3) Number of staff vacancies in any of the core service areas 25 http://www.ness.bbk.ac.uk/implementation/documents/157.pdf

45
Section 3.1 Staff employment status (4) The numbers of people working in a Sure Start capacity and the basis on which they are employed – i.e. full time, part-time or sessional, including people in administrative as well as other posts. Section 3.2 Monitoring staff ethnicity (page 32) (5) Number of staff directly involved on Sure Start (excluding programme management) by Ethnicity: White, Mixed, Asian or Asian British, Black or Black British, Chinese or other ethnic group. Strengths Data of use in the context of Birbeck‘s own study. Limitations: (1) The confidentiality issue. Data were collected from interviews where informants were told that identifiable data would only be accessed by the NESS research team. (2) Because of policy changes, the nature of the back-then SSLPs is very different than the Sure Start Children‘s Centres nowadays. (3) The data only covers a small number of the SSLPs, while there are now more than 3000 Sure Start Centres have been set up. In addition, the information of staff was not able to be collected for a longer period of time due to the research funding cut. There is no plan so far to collect more information on the sure start centre‘s staff. (4) Missing observations on some variables. For example, only 62% of programmes provided information on staff‘s ethnicity. Contacts: Edward Melhuish Executive Director National Evaluation of Sure Start Birkbeck, University of London 7 Bedford Square London WC1B 3RA Tel: 020 7079 0834 Mobile: 07855 309427 Fax: 020 7323 4738 email: [email protected] website: www.ness.bbk.ac.uk Marianna Stone Team Leader Early Years, Childcare and Extended Schools Analysis & Research Team 4th floor Sanctuary Buildings Great Smith St, London SW1P 3BT Tel: 020 73408049

46
6. The National Minimum Data Set for Social Care (NMDS-Sc) Description: The National Minimum Data Set for Social Care (NMDS-SC) was developed with the Department of Health, the Department for Education & Skills (now Department for Children, Schools & Families) and other major organisations and employer bodies in social care. It was designed to address the chronic lack of information about the social care workforce. It is a non-mandatory system and all data are submitted voluntarily by employers throughout England. The Online system asks for two lots of information: 1. Organisational data - includes the numbers of people at the workplace, the jobs they do, numbers of starters and leavers, the range of services offered and the types of service users. 2. Worker data - includes the gender, date of birth, National Insurance Number, home post code, ethnic group, disability status, job role, pay, hours worked, sickness absence and qualifications of each worker. Individuals‘ names, addresses and contact details are not collected as part of the dataset. Key variables: Geography: Level Available Years Variable
Name Government Office Region (9 regions)
2009 regionid
Sub-region 2009 estabsubregion Council with SSR the establishment is located in
2009 cssr
Local Authority 2009 lauthid Postcode 2009 postcode Establishment Type: Variable Information provided Mainstid Main service offered at the provision Mainstgp Main service category at the provision st24flag Residential school - is this service provided at this provision? st24cap Residential school - service provision capacity, places st24util Residential school - capacity utilisation on completion date, beds st25flag Other children's residential care service - is this service provided?

47
Staff: The following information is provided on the aggregate number of staff employed and/or working at each establishment. Variable Information provided provemps Total number of permanent, temporary and 'other' staff
working at this provision staffsz Establishment staff size grouping (total number of
permanent or temporary staff) staffszgp Establishment staff size category (total number of
permanent or temporary staff) wrkemps Total number of permanent or temporary staff
employed at this provision wkrrecs Total number of permanent or temporary staff
completed in the worker record wkrrecgp Percentage of total worker records received to the total
number of staff employe The dataset also provides more detailed information regarding the number of staff employed by Job Role. Variable Information provided jr12perm Number of permanent employees classified as: ―educational support‖ jr13perm Number of permanent employees classified as: ―youth offending support‖ jr18perm Number of permanent employees classified as: ―nursery nurse‖ jr19perm Number of permanent employees classified as: ―childcare worker or
childcare assistant‖ jr20perm Number of permanent employees classified as: ―teacher (qualified)‖ jr21perm Number of permanent employees classified as: ―educational assistant‖ jr22perm Number of permanent employees classified as: ―technician‖

48
The worker data set provides much more detailed information on individual workers. Some of the key information available is listed below: Variable Information provided Ethnicgp Ethnic group of the worker Agegroup Age group of the worker Disabled Has the worker got a disability? Mainjrid Worker‘s main job role (e.g. nursery nurse; childcare
worker etc.) Hrlyrate Hourly rate (of pay) Homeregion Region the worker lives in homesubregion Sub-region the worker lives in homelauthid Local Authority (district) the worker lives in ql21wtq Employee working towards child care award (cca) ql21achq Whether received child care award (cca) ql23achq (ql23wtq=working toward qual.)
Whether received practice teacher award (pta) - has this employee achieved this qualification?
ql29achq (ql29wtq=working toward qual.)
Any nursery nursing qualification
ql30achq (ql30wtq=working toward qual.)
Any childcare, preschool or playwork qualification
ql31achq (ql31wtq=working toward qual.)
Any teaching qualification
ql38achq (ql38wtq=working toward qual.)
Any other qualification relevant to the job role
Strengths: A strength of the data is that it provides useful information about providers that take part. One could obtain from this a useful profile of participating providers and perhaps also look at the correlation between wages and employer/employee characteristics. Limitations The total number of records of Children‘s Services is very small. In 2009, by the organisational type, there were only 375 ―statutory: local authority children‘s services‖ (91 Ofsted registered, 41 CSCI26 registered). Even if we include all kinds of establishments whose main service type is children‘s services27, there were only 1341 establishments in 2009. The early years have even fewer records (according to the email from Christine Eborall, Skills for Care). The NMDS-Sc does collect the names and postcodes of individual care-providing establishments. They can be released to the regional offices of Skills for Care for workforce development purposes if permissions are given but otherwise they are in confidence. The data team from Skills for Care undertakes not to pass on any information which could identify
26 Commission for Social Care Inspection. 27 Children‘s residential, children‘s domiciliary, and children‘s community care.

49
individual establishments and individual staff28. The NMDS-Sc is not intended to provide a list of operations of particular types, but rather to provide aggregated workforce information. In children's services in particular, there are security considerations over and above commercial confidentiality. The postcodes in the data file available to the CEP/CEE are truncated at district level so as to prevent individual establishments being identified. Though it is technically feasible to contact selected children's services by email [if email address available] and ask permission to release an agreed amount of existing, one needs to be very clear of what the work is about and the response rate might not be high. The team expects that the number of children's establishments will start increasing in the autumn of 2009 because CWDC is intending to start promotional activity encouraging organisations to complete it. The reason for the limited coverage of children's' services in the NMDS-Sc is merely because there has been limited collection activity, communication and promotion of the NMDS-Sc in this sector. We recall that the number of workers in children‘s services in NMDS-Sc Data is not representative to the total workforce. Nevertheless, the two tables below intend to provide a picture of the observations in the data in terms of their gender and ethnicity composition, educational level and other characteristics that we‘ve been looking at from LFS and ASHE. Contacts: Christine Eborall Programme Head - Research Direct tel 020 8991 1222 fax 020 8991 1222 Email: [email protected] Skills for Care - part of the sector skills council, Skills for Care and Development Albion Court, 5 Albion Place, Leeds LS1 6JL
28 http://www.nmds-sc-online.org.uk/content/view.aspx?id=Data%20Protection.

50
Educational Qualifications of the Social Workers related to Children‘s Services in NMDS-Sc 2009 Main Service Category at the Provision Private Statutory Local All(including
children's residential children's day children's domiciliary children's community
Authority Voluntary and others)
No qualification 61.98% 40.37% 65.12% 75.36% 62.53% 71.69% 64.57%
Entry level - - - 0.46% - 0.43% 0.12%
Other qualification 7.45% 10.43% 4.65% 3.83% 4.22% 3.79% 6.56%
level1 0.02% - - 0.13% 0.05% - 0.04%
level2 1.63% 4.81% 3.49% 1.22% 2.17% 0.62% 1.72%
level2+ 0.90% 26.47% 4.07% 0.63% 2.65% 1.31% 1.95%
level3 16.44% 6.68% 9.01% 3.50% 15.15% 8.47% 12.57%
level3+ 1.99% 2.14% 4.94% 1.43% 1.74% 1.70% 1.96%
level4 4.96% 2.41% 2.33% 6.19% 5.57% 6.81% 5.07%
level4+ 4.64% 6.68% 6.40% 7.25% 5.91% 5.18% 5.43%
Total Workers 6446 374 344 2374 4145 2586 9538
Characteristics of Children's Services Workers (NMDS-Sc, 2009) Average Age % Female % White %Full-time Permanent Turnover total
All 40 67.20% 74.44% 50.20% 73.64% 62.61% 9538
Private 35 60.46% 67.41% 48.73% 63.74% 62.90% 4145
Statutory Local Authority
42 80.63% 84.45% 46.09% 87.70% 66.51% 2586
Note: (1) The children‘s workforce in NMDS-Sc consists of social workers who worked at a provision with main service category related to children, including children‘s residential, children‘s day, children‘s domiciliary, and children‘s community. (2) The public/statutory division came from the variable ―Nature of organisation at the establishment/ sector‖. Besides ―private‖ and ―statutory local authority‖ (adult services & children‘s services), there are 2335 workers in ―voluntary/third sector‖, and 472 workers worked for an organisation of ―other types‖ or ―not recorded‖.

51
7. Ofsted – Registered childcare providers and places in England, 2005-2009 Description:
This data shows the number of registered providers and the overall effectiveness grades held on Ofsted‘s database29, by each of the national childcare categories. The categories are ―childminders‖, ―full day care‖, ―sessional day care‖, ―out of school day care‖, and ―crèche day care‖. The sum of these categories may not be consistent with the total number of providers and/or places as a large number of providers offer more than one type of day care – for example offering both full day care and sessional day care. These establishments are entered separately under each of the headings. A ―total‖ category is therefore also provided. As not all providers inform Ofsted that they have ceased provision, the number of registered providers is likely to be higher than the actual number of providers. In addition, where a setting received more than one inspection within each period data is supplied on all published inspections. Data is available for from 1 April 2005 to 31 March 2009, spilt by financial year. The latest available complete data is August 2008. Years Covered: 2005-2009 Key Variables: Geography: Establishment level data provided (and also Local Authority identified in data set) Establishment type and other provider level variables: Variable Information Provided Coding provision_type Type of Provision Childcare-Domestic
Childcare-Non-Domestic Childminder Day Care Home Childcarer
current_registration_status Current registration Status Active Cancelled Exempt Resigned Suspended
overall_effectiveness Overall Effectiveness Rating
Inadequate-Enforcement Action Inadequate - Notice of Action to Improve Satisfactory Good Outstanding
29 Ofsted also collects information on registered places.

52
Number of Ofsted Registered Providers By Provision Type and Year: Provision Type
2005-2006 2006-2007 2007-2008 April08-Aug08 2008-2009
Childcare-Domestic
14 16 15 4 29
Childcare-NonDomestic
6458 9942 11796 2668 8762
Childminder 18846 17394 21639 6231 18616 Day Care 2216 1856 786 27 Home Childcarer
4 6 3 2
Total 27538 29214 34239 8932 27407 Number of Ofsted Registered Providers By Overall Care Judgement and Year: Provision Type
2005-2006 2006-2007 2007-2008 April08-Aug08 2008-2009
Good 15778 15353 17913 4263 15021 Inadequate - Enforcement Action
103 127 98 36 133
Inadequate - Notice of Action to Improve
1392 1653 2574 634 1649
Outstanding 601 740 1444 245 2461 Satisfactory 9664 11341 12210 3754 8143 Total 27538 29214 34239 8932 27407 Strengths Should be very useful in combining with other data sets (as documented above) to see how provider characteristics relates to the quality ratings given by OfSTED. Limitations: In circumstances where a childcare provider is co-located with a school and is registered separately, it is not possible to retrieve the URN of the co-located school because data on schools and nurseries are stored in separate systems. Contacts: Oliver Papps
Inspection Insight Ofsted
Tel: 0207 421 5804
Email: [email protected]

53
8. SSDS001 (Annual Social Service Staffing) , 1996-2008 Description: Information on staff employed by English council social services departments was collected each September by the Department of Health by means of a return known as SSDS001. The return covers all staff directly employed by council social services departments, broken down into groups of detailed categories which reflect the various occupational groups. The data contained in the files are given in Whole Time Equivalents (WTE) for 1996 and 1997. For 1998-2003 data are given in terms of staff numbers as well as WTEs for each column of the SSDS001 return. A gender breakdown is also available from 1999. In translating their numbers of part time staff into WTEs, councils were asked to make the calculations on the basis of a staff contractual week. For any grade where the council does not have a standard working week, WTEs were calculated on the basis of 39 (contractual) hours per week for care assistants, manual and domestic staff and 37 hours per week (36 in London) for other staff. Key variables: Geography: The staff information listed below is available at Local Authority level only. There are 150 Local Authorities in each year with the exception of 1996 (119) and 1997 (132). Establishment type: Data is not available for individual establishments. Staff: The data are provided in Whole Time Equivalents (WTE) for 1996 and 1997. For 1998-2008 data are given in terms of staff numbers as well as WTEs for each column of the SSDS001 return. A gender breakdown is also available from 1999. In translating their numbers of part time staff into WTEs, councils were asked to make the calculations on the basis of a staff contractual week. For any grade where the council does not have a standard working week, WTEs were calculated on the basis of 39 (contractual) hours per week for care assistants, manual and domestic staff and 37 hours per week (36 in London) for other staff. The following information is provided for each year relating to staff at children‘s services: Section II: STAFF IN OPERATIONAL DIVISIONS/NOT ESTABLISHMENT BASED: Provision specifically for children’s services: Total number of staff, ―team leaders/managers‖, ―assistant team managers/senior social workers‖, ―care managers‖, ―field social workers‖, ―social services officers/social work assistants‖, ―child protection, family placement, juvenile/youth justice workers‖, ―community workers‖, ―occupational therapists‖, ―OT assistants, equipment aids & other officers‖ and ―technical officers‖. Section III: DAY CARE PROVISION (including sheltered workshops where appropriate): Family centres: Total number of staff, ―officers in charge‖, ―deputy offices in charge‖, ―social workers based in family centres‖, ―family centre workers, family aides & other care staff‖, ―other support services staff‖. Staff in day nurseries: Total number of staff, ―managers and officers in charge and nursery group leaders‖, ―deputy officers in charge‖, ―nursery officers, students and assistants‖, ―other support services staff‖. Staff in play groups: Total number of staff, ―playgroup leaders and assistants‖, ―other support services staff‖. Nursery centres where funded by social services: Total number of staff, ―teachers (whether qualified or not‖, ―managers and officers in charge‖, ―deputy officers in charge‖, ―nursery officers, students & assistants‖, ―other support services staff‖.

54
Community centres: Total staff employed by social services in community centres. Section IV: CARE IN RESIDENTIAL ESTABLISHMENTS: Staff of homes and hostels mainly for children with learning disabilities: Total number of staff, ―managers and officers in charge‖, ―deputy officers in charge‖, ―other supervisory staff‖, ―care staff‖, ―other support services staff‖. Staff of community homes for children looked after (including observation and assessment centres where mainly residential: Total number of staff, ―managers and officers in charge‖, ―deputy officers in charge‖, ―other supervisory staff‖, ―child care staff‖, ―teaching staff‖, ―other support services staff‖. Section V: SPECIALIST NEEDS ESTABLISHMENTS: Staff in combined `specialist needs' establishments/resource centres (which are designed to cater for some combination of residential/significant levels of short stay/day centre services). Mainly for children: Total number of staff, ―managers and officers in charge‖, ―deputy officers in charge‖, ―other supervisory staff‖, ―child care staff‖, ―teaching staff‖, ―other support services staff‖. In 2000 ethnicity data is also available. All ethnicity data is split into male, female and total, and the ethnic groups are ―ethnic origin not known‖, ―white‖, ―black and minority ethnic‖, ―all ethnic groups‖. It is advised that in view of the high percentage of staff with ―ethnic origin unknown‖, great caution should be exercised in interpreting the ethnic origin breakdown shown. Ethnicity data is provided on ―all social services staff‖ (in actual numbers, not Whole Time Equivalents) for the following children‘s services: ―field work staff -services for children‖, ―residential care staff - children with learning disabilities‖, ―residential care staff - care homes for children looked after‖, ―residential care staff - Specialist needs establishments/resource centres‖, ―day care staff – family centres‖, ―day care staff – nursery and play groups‖, and ―day care staff – community centres‖. In addition, the same ethnicity information is provided for ―social work staff‖ working for ―children‖, ―day centres‖, and ―day centres – of which care managers‖. We can plot the total number of children‘s services workers over the total number of all social services workers. We see that the share of workers in children‘s services have been increasing steadily from 1996 to 2008, especially after 2001. Supply of Children‘s Services Workers
% children's service workers in total social service workers
0%
5%
10%
15%
20%
25%
1996 1997 1998 1999 2000 2001 2002 2003 2004 2005 2006 2007 2008
Year
Perc
en
tag
e
% children's service workers in total social service workers

55
Notes: (1) Percentage is calculated as the total number of whole time equivalent (WTE) social workers related to children‘s divided by the total WTE number of social workers in SSDS001 from 1996-2008. (2) The data is on Unitary Authority Level. We also aggregate the information on GOR level, which can be compared with the children‘s workforce supply in other data sets. Strengths Data items are consistently measured over time and available at the Local Authority level. The data is useful for getting a profile of some basic characteristics of staff employed by English council social services departments Limitations The data would need to be used in conjunction with other data sets to get a picture of overall staffing of children‘s services. Contact: Data can be retrieved from online: http://www.dh.gov.uk/en/Publicationsandstatistics/Statistics/StatisticalWorkAreas/Statisticalworkforce/DH_4000233