Embed Size (px)
Citation preview

The public reporting burden for this collection of information is estimated to average 1 hour per response, including the time for reviewing instructions,
searching existing data sources, gathering and maintaining the data needed, and completing and reviewing the collection of information. Send comments
regarding this burden estimate or any other aspect of this collection of information, including suggesstions for reducing this burden, to Washington
Headquarters Services, Directorate for Information Operations and Reports, 1215 Jefferson Davis Highway, Suite 1204, Arlington VA, 22202-4302.
Respondents should be aware that notwithstanding any other provision of law, no person shall be subject to any oenalty for failing to comply with a collection of
information if it does not display a currently valid OMB control number.
PLEASE DO NOT RETURN YOUR FORM TO THE ABOVE ADDRESS.
a. REPORT
Predicting Odor Pleasantness from Odorant Structure:
Pleasantness as a Reflection of the Physical World
14. ABSTRACT
16. SECURITY CLASSIFICATION OF:
Although it is agreed that physicochemical features of molecules determine their perceived odor, the rules
governing this relationship
remain unknown. A significant obstacle to such understanding is the high dimensionality of features describing
both percepts and
molecules.Weapplied a statistical method to reduce dimensionality in both odor percepts and physicochemical
1. REPORT DATE (DD-MM-YYYY)
4. TITLE AND SUBTITLE
01-11-2009
13. SUPPLEMENTARY NOTES
The views, opinions and/or findings contained in this report are those of the author(s) and should not contrued as an official Department
of the Army position, policy or decision, unless so designated by other documentation.
12. DISTRIBUTION AVAILIBILITY STATEMENT
Approved for Public Release; Distribution Unlimited
UU
9. SPONSORING/MONITORING AGENCY NAME(S) AND
ADDRESS(ES)
6. AUTHORS
7. PERFORMING ORGANIZATION NAMES AND ADDRESSES
U.S. Army Research Office
P.O. Box 12211
Research Triangle Park, NC 27709-2211
15. SUBJECT TERMS
sniffing, odor pleasantness, odor perception, odorant structure
Rehan M. Khan, Chung-Hay Luk, Adeen Flinker, Amit Aggarwal,
Hadas Lapid, Rafi Haddad, and Noam Sobel
University of California - Berkeley
Sponsored Projects Office
The Regents of the University of California
Berkeley, CA 94704 -5940
REPORT DOCUMENTATION PAGE
b. ABSTRACT
UU
c. THIS PAGE
UU
2. REPORT TYPE
Final Report
17. LIMITATION OF
ABSTRACT
UU
15. NUMBER
OF PAGES
5d. PROJECT NUMBER
5e. TASK NUMBER
5f. WORK UNIT NUMBER
5c. PROGRAM ELEMENT NUMBER
5b. GRANT NUMBER
5a. CONTRACT NUMBER
W911NF-04-1-0321
611102
Form Approved OMB NO. 0704-0188
46666-LS.3
11. SPONSOR/MONITOR'S REPORT
NUMBER(S)
10. SPONSOR/MONITOR'S ACRONYM(S)
ARO
8. PERFORMING ORGANIZATION REPORT
NUMBER
19a. NAME OF RESPONSIBLE PERSON
19b. TELEPHONE NUMBER
Noam Sobel
510-643-0131
3. DATES COVERED (From - To)
6-Jul-2004
Standard Form 298 (Rev 8/98)
Prescribed by ANSI Std. Z39.18
- 5-Jul-2007

Final ARO Report
1
Predicting Odor Pleasantness from Odorant Structure: Pleasantness as
a Reflection of the Physical World
Rehan M Khan, Chung-Hay Luk, Adeen Flinker, Amit Aggarwal, Hadas Lapid,
Rafi Haddad, and Noam Sobel

Final ARO Report
2
Foreword
The mapping of various physical stimulus attributes onto perception is well defined in
vision and audition, but not in olfaction. Other than the mapping of molecular
concentration onto perceived odor intensity (Cain, 1969), there is no known general
systematic mapping of molecular properties onto the olfactory percept. In other words,
there is no scientist or perfumer who can predict the smell of a novel molecule by its
physico-chemical structure, or the physico-chemical structure of a novel smell.
Understanding this link between physico-chemical structure and percept has been
elusive because the percept is in large part plastic, dependent on experience and learning
(Brennan and Keverne, 1997; Wilson and Stevenson, 2006). Nevertheless, part of the
olfactory percept is innate and hard wired. For example, laboratory rodents that have
never encountered a cat through generations of breeding still react fearfully to cat-odor,
but not other novel and noxious odors (Dielenberg and McGregor, 2001). Yet the link
between physico-chemical structure and this hard-wired portion of the percept has proven
equally elusive.
This may be due in part to the complexity of both the perceptual space and the stimulus
space. The perceptual space is made of odors, that can be described by a large number of
verbal descriptors. The stimulus space is made of odorants, relatively small molecules
(Ohloff, 1986), that can be described by a large number of physico-chemical descriptors.
Verbal descriptors for a large number of odorants have been reliably obtained, revealing
considerable agreement in several aspects of olfactory perception (Dravnieks, 1982,
1985), and physico-chemical descriptors can be mined and computed (Tetko et al., 2005)
from structures available in chemical data-bases (e.g., PubChem). Thus, we sought to

Final ARO Report
3
construct a perceptual space from verbal descriptors, an analogous physico-chemical
space from chemical descriptors, and then test for any systematic relation between these
two spaces.

Final ARO Report
4
Table of contents:
Forward: pp 1-3
List of Appendixes: pp 5
Statement of the problem studied : pp 6
Summary of the most important results: pp 7-27
Bibliography: pp 32-35
Appendixes: pp 36-41

Final ARO Report
5
List of Appendixes
Page 36: Figure 1
Page 37: Figure 2
Page 38: Figure 3
Page 39: Figure 4
Page 40: Figure 5
Page 41: Figure 6
Final ARO Report
6
Statement of the problem studied
Although it is agreed that physico-chemical features of molecules determine their
perceived odor, the rules governing this relationship remain unknown. A significant
obstacle to such understanding is the high dimensionality of features describing both
percepts and molecules. We applied a statistical method to reduce dimensionality in both
odor percepts and physico-chemical descriptors for a large set of molecules. We found
that the primary axis of perception was odor pleasantness, and critically, that the primary
axis of physico-chemical properties reflected the primary axis of olfactory perception.
This allowed us to predict the pleasantness of novel molecules by their physico-chemical
properties alone. Olfactory perception is strongly shaped by experience and learning.
However, our findings suggest that olfactory pleasantness is also partially innate,
corresponding to a natural axis of maximal discriminability amongst biologically relevant
molecules.

Final ARO Report
7
Summary of the most important results
Materials and Methods
Subjects
One hundred and eighty five subjects (96 F) between the ages of 19 and 39 participated in
the experiments after providing informed consent to procedures approved by the UC
Berkeley Committee for the Protection of Human Subjects. Subjects were generally
healthy, with no history of neurological disease, nasal passage disease, broken nose or
septoplasty.
Location and stimuli
Experiments 1-6 were conducted in stainless-steel-coated rooms designed to minimize
olfactory contamination. Experiment 7 was conducted in a well ventilated concrete room
in the Arab village of Dir El Asad in the Northern Galilee part of Israel. All odorants
were from Aldrich Chemicals, of the highest purity available, and matched for perceived
intensity by dilution with mineral oil or deionized distilled water as appropriate. The
odorants used are detailed in Supplementary Tables 5 and 6, and referenced in the results
section per experiment. Intensity-matching dilution procedures used a group of 10
experienced subjects used only for that purpose. Intensity matching was obtained by first
identifying those odorants that were perceived as least intense in their undiluted form by
2 experimenters. Diluted samples were prepared for each more intense odor by the 2
experimenters and judged to be of the same intensity as the least intense odors. These
prepared odors were then presented to each of the 10 rating subjects, who rated their

Final ARO Report
8
intensity using a visual-analog scale (VAS). Pairwise differences between odors were
tested using paired t-tests. For any odor pair showing a significant difference in intensity,
the more intense odor was diluted and was re-rated by the group of 10 rating subjects
until no significant differences in perceived intensities were evident.
Perceptual estimation studies
Perceptual estimates were obtained by rating the applicability of the property of interest
onto a given odorant using a visual-analog scale (VAS). All interactions with subjects
during experiments were by computer, with an experimenter viewing behavior from a
neighboring room via video monitor and one-way window. Odorants were sniffed from
jars marked arbitrarily (e.g., Jar A001). Experimental instructions were provided by
computer using digitized voice, and perceptual estimates were obtained through mouse
clicks on a visual-analog scale (VAS) 20 cm long. For example, in an experiment on
odorant pleasantness, in a given trial the subject would hear a digitized voice reading:
"Please sniff jar A001 at the tone, three, two, one, TONE", then the subject would hear:
"Please rate odorant pleasantness". At this time a 20 cm long VAS line would appear on
the monitor, with the labels "extremely pleasant" at one end of the line, and "extremely
unpleasant" at the other. Subjects would initiate a mouse-click at a point along the line
that reflected their perception. For the different experiments, scale extremes were "low
similarity" vs. "high similarity", "extremely pleasant" vs. "extremely unpleasant", “edible
(foods)” vs. “inedible (toxic items)”, "Not at all flowery" vs. "Extremely flowery" and
"Not at all sweet" vs. "Extremely sweet". In every experiment subjects also rated
intensity ("very low intensity" vs. "extremely high intensity"), and in any case where,
Final ARO Report
9
despite the initial intensity-matching procedure, an odorant was an outlier in terms of
perceived intensity (>2STD), it was deleted from further analysis (this occurred for only
4 odorants out of the 90 odorants tested across experiments). VAS values (in mm) were
Z-scored for every subject across odorants. All inter-stimulus-intervals ranged from 30 to
45 seconds. Odorant presentation order was counter-balanced across subjects.
Reaction time study
We used a 40 trial forced choice same-different discrimination task (4 second inter-sniff
interval) using 5 odorants. Stimuli were presented using an olfactometer that delivered
odorants into a nasal mask with ~2 ms temporal resolution (Johnson et al., 2003; Johnson
and Sobel, 2007). On every trial, subject heard a digitized voice instructing to sniff at the
tone, followed by a second sniff instruction 4 seconds later. Subjects then had to respond
within 2.5 seconds by pressing one of two buttons that denoted either "same" or
"different". The response interval ended with a buzzer if no response was recorded. The
ITI was set to 45s so as to minimize adaptation. Each odorant was presented 8 times, 4
times paired with itself, and once paired with each of the other 4 odorants. After pooling
all the same-same pairs as one condition ("same"), this matrix generated 11 possible
pairings.
PCA analysis for dimension reduction
To reduce the dimensionality of perceptual descriptors previously obtained by Dravnieks
(Dravnieks, 1982, 1985), and of physico-chemical descriptors obtained using Dragon
software (Talete srl, Milano, Italy), we used the principal component function in the

Final ARO Report
10
Statistics Toolbox of MATLAB (The Mathworks Inc., Natick MA, USA). In brief, PCA
takes a data set consisting of N points in an M-dimensional space (for example, 160
odorants in the 146-dimensional odor descriptor space in the case of the Dravnieks data)
and finds a rotation matrix which rotates the N points onto a new M-dimensional space
with certain special properties. These are 1) that the new dimensions are orthogonal and
2) that the new dimensions, called principal components, e.g. PC[1], PC[2], …, PC[M],
are ordered so that each successive PC has the maximal possible variance. Thus PC[1]
explains the most variance of any linear transform of the original data space, PC[2]
explains the next biggest amount of variance, and so on. Because the PCs are orthogonal,
they explain mutually exclusive sets of variance. The entire set of M PCs thus accounts
for all the variance in the original data set. In practice, for data spaces in which the
apparent dimensionality exceeds the intrinsic dimensionality (as is the case, for example,
when many of the dimensions are intercorrelated or redundant) relatively few PCs will
capture most of the variance in the original data space. A notable difference between
PCA and other methods of multivariate analysis such as "factor analysis" is that in PCA
the does not depend upon the user to specify a particular data model, or to make a priori
decisions regarding which data is to be included or excluded.
Because Dragon generated a very large number of physico-chemical descriptors
(1513, Supplementary table 4, available at
http://www.weizmann.ac.il/neurobiology/worg/materials.html), we did not apply PCA to
only the 144 Dravnieks odorants, but rather to 1565 odorants commonly used in olfactory
experiments and the fragrance industry (Supplementary Table 8). This assured that all
principal components could be estimated, and robustly. Each descriptor was normalized

Final ARO Report
11
by z-scoring to prevent descriptors with larger ranges from artefactually dominating the
dimensionality of the descriptor space.
After PCA, one can generate a subspace onto which one can project the data. For
example, figure 1b contains the 144 monomolecular odorants from Dravnieks projected
onto a subspace made of the first 4 PCs (although only two are shown in the two-
dimensional graph). In other words, each odorant is now described by 4 numbers rather
than the original 146. Distances between odors using these 4 numbers were calculated
using a Euclidean distance metric, i.e.
D = sqrt(∑ (xi - yi)2)
where x and y are the vectors for 2 different odors and i ranges over 1,2,..4.
Building a model from physico-chemical onto perceptual olfactory space
We modeled each perceptual PC independently as a linear combination of the
physico-chemical PCs plus an error term:
Yi = Xbt + ei
where Yi is the vector of the ith perceptual descriptor (or ith PC of the perceptual space), X
is a matrix of the predictive physico-chemical descriptors and b is the weighting on X to
fit Y and ei is Gaussian noise. Fitting was done by least squares.

Final ARO Report
12
We used a step-wise cross-validation procedure to determine inclusion of
physico-chemical PCs. We increased the number of physico-chemical PCs to predict
perceptual PC1 until an increase resulted in no increase in predictive power. Predictive
power of each model was tested as follows: we randomly divided the set of 144 odorants
into 2 sets of 72, a model-building set and a test set. A model was built using the current
number of physico-chemical PCs and then this model was applied to the 72 odorants in
the test set. The correlation between the predicted and actual values in the test set
measures the power of the model. This cross-validation procedure was repeated1000
times for each size of model, and a distribution of each predictive measure was obtained.
This procedure resulted in a model including the first 7 physico-chemical PCs.
Results
Constructing a perception-based space
We constructed a perceptual odor space using data from Dravnieks’ Atlas of Odor
Character Profiles, wherein ~150 experts (perfumers and olfactory scientists) ranked
(from 0 to 5, reflecting "absent" to "extremely" representative) 160 odorants (144
monomolecular species, and 16 mixtures) against each of the 146 verbal descriptors
(Dravnieks, 1985) (the lists of odorants and descriptors are in Tables 1 and 2 of the
supplementary materials).
We applied principal components analysis (PCA), a well-established method for
dimension reduction, that generates a new set of dimensions (principal components or
PCs) for the profile space in which: 1) each successive dimension has the maximal
possible variance and 2) all dimensions are uncorrelated. Figure 1A shows the

Final ARO Report
13
percentage of the variance in the perceptual feature space explained by each of the first
10 PCs. As can be seen, the effective dimensionality of the odor profile space was much
smaller than 146, with the first 2 PCs accounting for 40.1% of the total variance in the
odor profiles, and the first 4 accounting for 54%. The full weighting of all 146
descriptors on the first four PCs is listed in Table 1 of the supplementary materials.
By selecting a number of PCs we can define a perceptual space. Figure 1b
contains a 2-dimensional projection of the odorants onto the subspace formed by the first
and second PCs. In such a space, similar odorants are understood to be close to one
another and dissimilar odorants are understood to be distant from one another (a
navigable version of this space is available at
http://www.weizmann.ac.il/neurobiology/worg/odorspace/Ptplot5.5/ptolemy/plot/demo/F
ourierSeries.htm).
Validating the perception-based space
To test our perceptual feature space, in Experiment 1 we obtained pairwise perceived
similarity ratings from 21 subjects for each of 9 odorants that were pseudo-randomly
selected to span the space of the first 4 PCs (detailed in Fig 1b). Pairwise similarities for
each of the 36 possible odorant pairs were compared to pairwise Euclidean distances in
our perceptual PC space using the first 1, 2, 3, 4, and 5 PCs. The addition of each
successive component increased the correlation with the explicit pairwise similarity
ratings until the 5th, which showed no statistically significant improvement in the
correlation. Figure 1c shows the near linear relationship between the Euclidean distance
over the first 4 PCs and the average pairwise similarity of our raters (r = -0.71

Final ARO Report
14
F(1,34)=34.37, p<0.0001). Pairwise similarity values for the odors can be found in
Supplementary Table 3.
In Experiment 2 we tested our perceptual space using an implicit similarity task.
Using 5 of the 9 previously used odorants (detailed in Fig 1b), we presented 21 subjects
with a forced choice speeded reaction time task in which subjects were presented with 2
odorants in succession and required to indicate as quickly as possible whether they were
the same or different. As expected (Wise and Cain, 2000; Abraham et al., 2004; Rinberg
et al., 2006), subjects took longer to make correct judgments for more similar odorant
pairs than for dissimilar odorant pairs (Figure 1d), where similarity was derived from our
4 dimensional perceptual space (F(1,9)=36.48, r = .80, p<0.0002). Thus, in both explicit
and implicit similarity tasks our derived perceptual space corresponded to subjects’
judgments of similarity.
Identifying the primary dimension of the perception-based space: Pleasantness
The descriptors that flank the first PC of perceptual space ranged from "sweet" and
"floral" at one end, to "sickening" and "rancid" at the other (Figure 2a, and Table 1 in
supplementary materials), suggesting that the first PC of perceptual space may be
pleasantness (referring to the continuum from unpleasant to pleasant, also referred to as
perceptual valence or hedonic tone).
To test this, in Experiment 3, 10 subjects rated the pleasantness and intensity of
the 9 odorants used in Experiment 1. To compare these results with the PCA results, for
each pair of odorants we computed a pleasantness distance (the absolute difference
between their ratings) and regressed this against their distance based on the first PC.

Final ARO Report
15
Whereas these two measures were strongly correlated (see Figure 2b, F(1,34) = 55.1, r=
0.79, p<0.0001), a similar analysis on the intensity estimates revealed no significant
correlation (F(1,34) = .46, r= -0.12, p > .5).
As an second test of whether perceptual PC1 reflects odor pleasantness, we
compared previously published pleasantness ratings for each of the 146 perceptual
descriptors used (Dravnieks et al., 1984) (note, these are pleasantness ratings associated
with the descriptors, not the odorants), to the component weights on the first PC. Figure
2c shows the component weights, sorted by value for the first PC. Figure 2d shows the
previously collected pleasantness ratings plotted against component weights. The
relationship between rated pleasantness and component weights was clearly not linear, so
in order to assess the relationship we first transformed the component weights with a
sigmoid transform, which we then regressed against the pleasantness ratings. The
correspondence between descriptor pleasantness and the first PC weighting was quite
strong (r=0.74, F(1,144)= , p<0.0001).
As a third test, we asked whether the term “pleasantness” is better at capturing the
first PC of perception when compared to individual related descriptors such as
"sweetness" or 'floweriness", both of which had the among the highest weight on
perceptual PC1 (see Figure 2a). In Experiment 4, 22 subjects rated the "pleasantness",
"floweriness", and "sweetness" of 22 odorants randomly selected from the 144 odorants
used by Dravnieks. As predicted, ratings of all three labels were significantly correlated
with PC1 values (Pleasantness, r = 0.83, p<0.0001; Sweetness r = 0.73, p<0.0016;
Floralness, r = 0.63, p<0.0138), but the correlation of PC1 with "pleasantness" was
significantly higher than the correlations for "sweetness" and "floweriness" (binomial

Final ARO Report
16
sign test on difference in r scores across subjects: Pleasantness vs. Sweetness, p < 0.0262;
Pleasantness vs. Floralness, p < 0.0001; Sweetness vs. Floralness, p < 0.0022), suggesting
that this label captures significantly more of the variance in PC1 than do even closely
related terms (see Figure 2e).
Experiments 3 and 4, combined with several additional analyses detailed in the
supplementary materials, and an additional test of "edibility" as an alternative label to
perceptual PC1 (to be described later in the results), all supported our observation that the
first PC reflected odor pleasantness.
Building a Physico-chemical Molecular Descriptor Space
To relate this perceptual space to physico-chemical properties of molecules, we used a
similar procedure to reduce the dimensionality of the physico-chemical space. We
obtained 1514 physico-chemical descriptors for each of 1565 odorants. These descriptors
were of many types, e.g., atom counts, functional group counts, counts of types of bonds,
molecular weights, topological descriptors and so on. Applying PCA revealed that the
effective dimensionality of the space of descriptors was much lower than the apparent
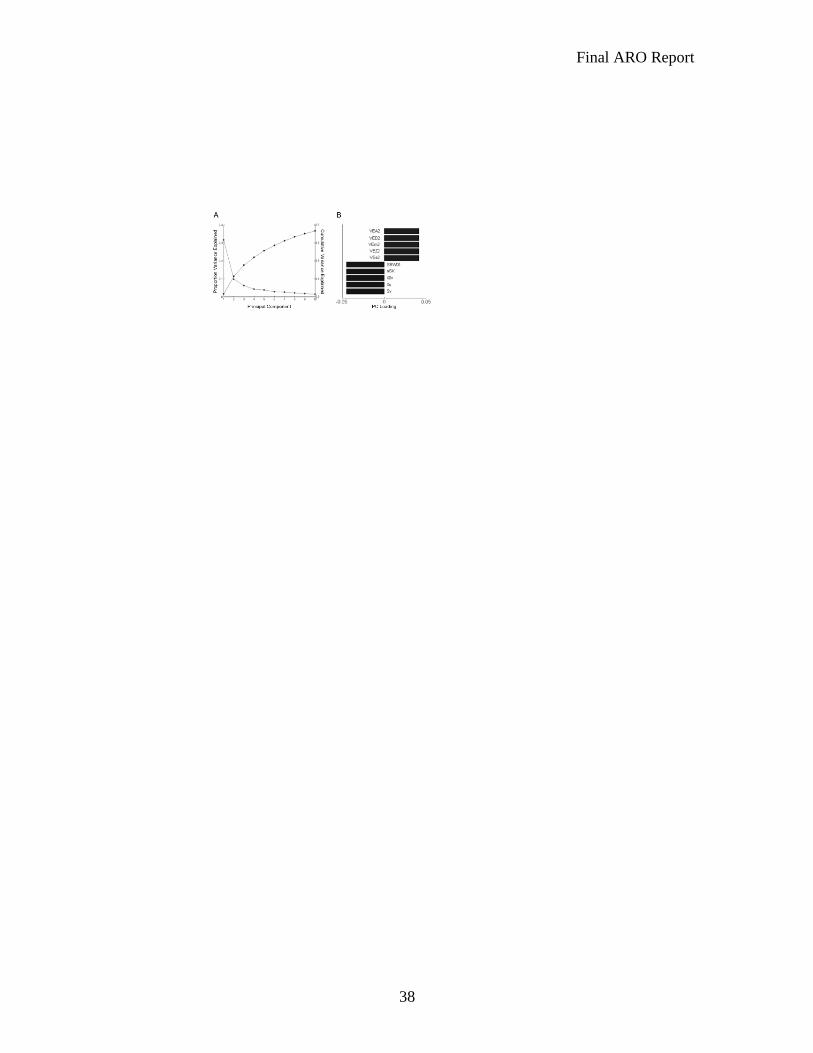
dimensionality of 1514. Figure 3a shows the percent variance explained by each of the
first 10 PCs. The first PC accounted for ~32% of the variance, and the first 10 accounted
for ~70% of the variance. Figure 3b shows the 5 descriptors that anchor the first PC of
the space (the full names of these physico-chemical descriptors are listed in the legend of
Figure 3 and in Supplementary Table 4, that also lists the full weighting of all 1513
descriptors on the first five PCs, available at
http://www.weizmann.ac.il/neurobiology/worg/materials.html).
Final ARO Report
17
Identifying the primary dimension of physico-chemical space
Characterizing the primary dimension of the PCA space of the physico-chemical
descriptors is more complex than the task for the perceptual space, both because of the
set-size and the variety of descriptors involved. The first physico-chemical PC was
weighted at one end by factors which are reasonable proxies for molecular size or weight:
the sum of the atomic van der Waals volumes is essentially a crude count of atoms, as is
the count of the number of non-hydrogen atoms, and the self-returning walk count of
order one for non-hydrogen atoms (which is actually identical to a count of the non-
hydrogen atoms). The characterization of these descriptors as indices of “weight” is
borne out by the very high weighting that “molecular weight” itself has on this side of the
first PC: -0.044 (Supplementary Table 4, available at
http://www.weizmann.ac.il/neurobiology/worg/materials.html).
At the other end of the dimension, are a series of topological descriptors that vary
with the “extent” of a molecule. In fact, all 5 of the descriptors are average eigenvectors
of distance or adjacency matrices, normalized in slightly different ways: average
eigenvector coefficient sum from electronegativity weighted distance matrix, average
eigenvector coefficient sum from Z weighted distance matrix (Barysz matrix), average
eigenvector coefficient sum from mass weighted distance matrix, average eigenvector
coefficient sum from distance matrix, average eigenvector coefficient sum from
adjacency matrix. Each of these measures increases as the denseness of the atomic
connections increases, i.e. as the number of atoms is packed more closely together. In
combination then, these two extremes anchor a dimension which characterizes the

Final ARO Report
18
amount and distribution of mass within a molecule. That said, unlike the case of the
perceptual data where we also applied an intuitively simple label to PC1 (pleasantness),
we have no equally valid label for PC1 of physico-chemical organization, and
characterization of the true nature of this dimension awaits detailed analysis of all the
relevant physico-chemical features involved in its construction. Supplementary Figure 4
shows some representative molecules arranged in the space of the first and second
physico-chemical PCs.
Building a Model from Physical to Perceptual Space
We have used PCA to construct two spaces: a perceptual space and a physico-chemical
space. PCA generates ordered sets of orthogonal axes, constructed to maximize the
variance they capture in the original feature space. Because the axes are uncorrelated
(orthogonal) we can compare them independently.
For each of the four perceptual PCs we asked whether they were correlated with
any of the first few physico-chemical PCs. Each of the 4 panels in Figure 4A
corresponds to one of the first 4 perceptual PCs. Each panel shows the correlation of a
single perceptual PC with the first 7 physico-chemical PCs. Error bars represent 1 std
error of the mean derived from 1000 bootstrap replicates. Strikingly, the strongest
correlation was between the first perceptual PC and the first physico-chemical PC (for
1000 bootstrap replicates, this correlation (r = .49, p < 0.001) was significantly stronger
than correlations between the 1st physico-chemical PC and the 2nd (r = .11, p < .001), 3rd
(r = .12, p < .001), and 4th (r = .20, p < .001) PCs of perception. This correlation was
also significantly stronger than the correlation between the 1st perceptual PC and the 2nd

Final ARO Report
19
physico-chemical PC (r = .11, p < .001)). In other words, there was a privileged
relationship between PC1 of perception and PC1 of physico-chemical organization. The
single best axis for explaining the variance in the physico-chemical data was the best
predictor of the single best axis for explaining the variance in the perceptual data. The
higher order, and lower variance dimensions of the perceptual space were more
correlated with higher order, and lower variance physico-chemical dimensions.
Having established that the physico-chemical space is related to the perceptual
space, we next built linear predictive models through a cross-validation procedure.
Figure 4B shows the correlation between the first perceptual PC and its predicted values
resulting from the model based on the first 7 physico-chemical components (r = 0.59,
(F(1,136)=10.62, p<0.0001). In other words, we generated a model that predicted odor
perception from odorant structure.
Experimental Validation: Predicting the Perceptual Qualities of Novel Molecules
To test the predictive power of our model, we obtained physico-chemical parameters for
52 odorants commonly used in olfaction experiments, but not present in the set of 144
used in the foregoing experiments and model building (Table 5 in the Supplementary
Materials). We applied our model to the 52 new molecules so that for each we had
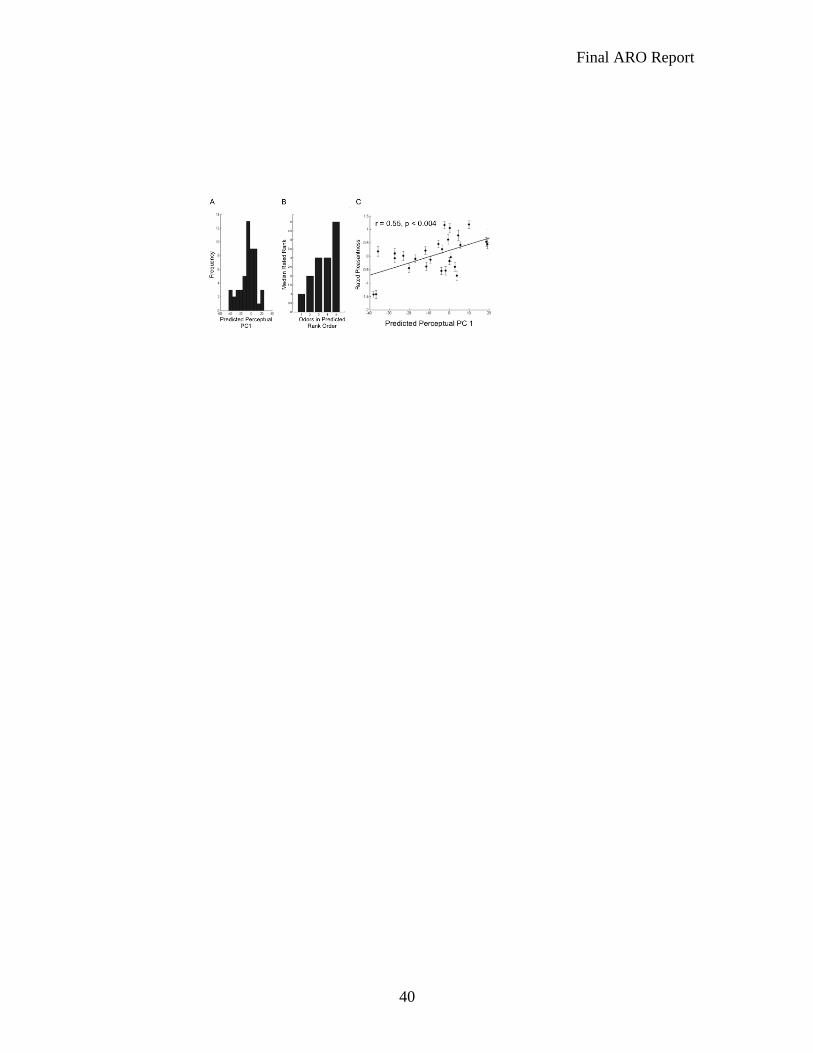
predicted values for the 1st PC of perceptual space. The distribution of predicted 1st PC
values is shown in Figure 5a.
As an initial test, in Experiment 5 we pseudo-randomly selected a subset of 5 of
the 52 odorants which spanned the range of 1st PC values and asked 14 subjects to rank
these 5 odorants (equated for intensity) in order of pleasantness-unpleasantness. The

Final ARO Report
20
median ranking for each of the 5 odorants sorted by expected ranking from our model is
shown in Figure 5b. As can be seen, subjects’ rankings of the 5 odorants matched the
predicted ordering from our model (Spearman Rank correlation r = 0.72, p<0.0004).
In Experiment 6 we selected 27 of the 52 molecules at random and asked 20
subjects to rate the pleasantness-unpleasantness of each. Figure 5c shows a plot of the
predicted first PC value against the average pleasantness rating. The two measures were
significantly correlated (r = 0.55, F(1,25)=10.64, p < 0.004). These results confirm those
of the cross-validation procedure: a model based upon physico-chemical properties of
molecules can provide a good prediction of the perceived pleasantness-unpleasantness of
those molecules.
Cross-Cultural Validation
Judgments of pleasantness and other olfactory properties can vary across cultures
(Wysocki et al., 1991; Ayabe-Kanamura et al., 1998; Hudson, 1999). Given that
molecules are universal but that olfactory perceptions may be culturally specific, in
Experiment 7, we tested our predictive model in 3 different cultures: among Americans
in California, Muslim-Arab Israelis, and Jewish Israelis. To test our model, we selected
27 new odorants (not in the Dravnieks set and not tested in the previous prediction
experiments) that were 1) odorous and 2) were used very infrequently in human olfaction
experiments (details in supplementary Table 7) so as to minimize any bias towards
commonly used odors. Finally, we addressed the possibility that an alternative
characterization of the first PC might be “edibility” or food-like vs. nonfood-like odors.

Final ARO Report
21
In addition to rating pleasantness, subjects from all three cultures also rated edibility of
odorants for which we predicted PC1 values.
Figure 6a-c shows plots of the mean ratings of pleasantness and Figure 6d-f show
mean ratings of edibility from each of the 3 cultural groups plotted against predicted PC 1
values from our physico-chemical model. In all cases the model predictions were better
correlated with the pleasantness than the edibility judgments (Americans: Pleasantness r
= 0.53, F(1,25) = 9.99, p < 0.004, Edibility r = 0.27, F(1,25) =1.9, p > 0.05; Muslim
Arab-Israelis: Pleasantness r = 0.57, F(1,25) = 12.14, p < 0.002, Edibility r = 0.38,
F(1,25) = 4.32, p < 0.048; Jewish-Israelis: Pleasantness r = 0.49 F(1,21) = 6.65, p <
0.018, Edibility r = 0.26, F(1,21) = 1.47, p > 0.05) indicating that our predictions were
valid across cultures, and that perceptual PC 1 better reflects pleasantness than edibility.
In addition, judgments of pleasantness were more consistent across cultures than
judgments of edibility: Americans and Arab-Israeli judgments of pleasantness were
correlated r = 0.70 (F(1,25) = 24.17, p < 0.0001) whereas judgments of edibility were
correlated r = 0.46 (F(1,25) = 6.70, p <0.02). Similarly, Americans and Jewish-Israeli
judgments of pleasantness were correlated r = 0.71 (F(1,21) = 21.24, p < 0.0002). The
correlation in judgments of edibility was higher than that between Americans and Arab-
Israelis (r = 0.69 (F(1,21) = 19.41, p < 0.0002) possibly reflecting the more European
eating habits of Jewish Israelis compared to Arab Israelis.
Discussion
We first reduced the dimensionality of olfactory perception, and observed that
pleasantness is the principal perceptual aspect of olfaction. This characterization of the

Final ARO Report
22
first PC as pleasantness is in agreement with previous research (Richardson and Zucco,
1989). Pleasantness is the primary perceptual aspect humans use to discriminate odorants
(Schiffman, 1974; Godinot and Sicard, 1995), or combine them into groups (Berglund et
al., 1973; Schiffman et al., 1977). Pleasant and unpleasant odorants are evaluated at
different speeds (Bensafi et al., 2002), and by dissociable neural substrates, as evidenced
in both electrophysiological recordings (Kobal et al., 1992; Pause and Krauel, 2000;
Masago et al., 2001) and functional neuroimaging studies (Zald and Pardo, 1997; Royet
et al., 2000; Gottfried et al., 2002; Anderson et al., 2003; Rolls et al., 2003). Finally,
studies with newborns suggest that at least some aspects of olfactory pleasantness may be
innate (Steiner, 1979; Soussignan et al., 1997). Thus, our initial finding here is consistent
with the view that "it is clearly the hedonic meaning of odor that dominates odor
perception" (Engen, 1982).
We next reduced the dimensionality of physico-chemical properties, and
identified a primary axis of physico-chemical space. This axis was weighted at on end by
measures reflecting molecular weight, and at the other end by measures reflecting
molecular extent. Although it is temting to label such a continuam, for the main finding
of this manuscript, the importance lies in identifying a first PC of physico-chemical space
(i.e., an ordering of 1513 molecular descriptors), and not in its label.
The key finding of this manuscript was that 144 molecules were similarly ordered
by these two independently obtained principal axes, one for perception and one for
physico-chemical structure. In other words, when physico-chemical measures with no a
priori connection to any particular percepts were analyzed, those physico-chemical
measures that were best at discriminating a set of molecules were found to be those that

Final ARO Report
23
were most correlated with the perception of olfactory pleasantness. In other words, when
one orders a set of odorants based on the variance in their physico-chemical properties
alone, they end up roughly ordered by perceptual pleasantness as well. This phenomenon
allowed us to predict (r = ~.5, p < ~.004) odorant pleasantness of more than 50 molecules
that we didn’t smell before (and that were not part of our model building set), that were
here tested in more than 80 subjects spanning three cultures. This ability to predict
perceptual properties of novel odorants was a critical aspect of this manuscript. One may
argue that the odorants selected by Dravnieks were somehow skewed, or that our choice
of method for dimension-reduction (PCA) has limitations, or that our model building was
somehow erroneous. Such concerns would gain increased weight if all we did was
predict within the test set, that is, from one portion of the modeled data onto another
portion of the modeled data (as in Figure 4B). However, considering that we made
predictions on novel odorants outside of the test set (Figure 5B, 5C, 6A, 6C, 6E) suggests
that we have revealed a genuine mechanism that is independent of the odorants used to
build the model, or the particular methods of dimension reduction and model-building
that we applied.
A main consequence of these results is that they provide a perceptually validated
and physico-chemically constrained metric for probing the olfactory system. For
example, this result suggests a framework for selecting candidate ligands to test for
affinity to particular olfactory receptors, and for axes of spatial encoding in olfactory bulb
and cortex. One can simply select odorants from the olfactory perceptual space (a
navigable version of this space is available at
http://www.weizmann.ac.il/neurobiology/worg/odorspace/Ptplot5.5/ptolemy/plot/demo/F

Final ARO Report
24
ourierSeries.htm), and test the hypothesis that extent of distance within the space reflects
extent of difference in neural response, whether amplitude, rate, or location.
All that said, it is important to stress the limitations of our claim. First, one
qualifier to our predictive abilities is that they relate to odorants that have been equated
for perceived intensity. Intensity and pleasantness interact in complex ways (Henion,
1971; Doty, 1975; Moskowitz et al., 1976), and our model requires additional refinement
to reflect this complexity. Furthermore, as in other senses, the perception of odor, and of
pleasantness, is a complex process involving both innately tuned and learned
components. We do not suggest that there is a rigid transform from odorant structure to
odor perception that will ultimately explain all of perception. Olfactory perception and
subsequent neural representations are significantly influenced by several aspects clearly
unrelated to physico-chemical structure, such as context (Schoenbaum and Eichenbaum,
1995; Kay and Laurent, 1999; Herz and von Clef, 2001), expectation (de Araujo et al.,
2005; Zelano et al., 2005), multisensory convergence (Haberly, 2001; Gottfried and
Dolan, 2003; Rolls, 2004) and various top-down state-dependent modulatory influences
(Pager, 1983; Critchley and Rolls, 1996; Kay and Freeman, 1998; Murakami et al.,
2005). Furthermore, olfactory perception is a heavily learned process (Brennan and
Keverne, 1997; Wilson and Stevenson, 2006), that critically depends on past and ongoing
experience and exposure (Keverne, 1995; Wilson, 2003; Davis, 2004). The dynamics of
this dominant aspect of olfactory perception will obviously not be reflected in physico-
chemical structure. However, a portion of olfactory perception is innate and hard-wired
(Dielenberg and McGregor, 2001), and our results concern this part.

Final ARO Report
25
A final important caveat about our results is the relatively simple nature of our
predictive model. We were able to predict the pleasantness of new odors using a simple
linear model on physico-chemical descriptors. While a linear model is a useful
simplification of a complex problem, and was able to account for ~30% of the variance in
the data, it is unlikely that real olfactory systems will be linear. No doubt, more complex,
nonlinear models of the mapping from physico-chemical to perceptual space, which will
require much larger datasets to develop and independently test, will have significantly
more explanatory power.
That perceptual pleasantness is a reflection of optimal physico-chemical
discrimination may at first appear at odds with the notion that olfactory pleasantness is
both variable across individuals and cultures (Wysocki et al., 1991; Ayabe-Kanamura et
al., 1998), and also malleable within individuals over time (Cain and Johnson, 1978;
Hudson, 1999; Stevenson and Repacholi, 2003). Thus, given our result, how does one
explain existing variance in perceived pleasantness? Even when the pleasantness scale
reflects an organizational aspect of the physical world, an initial rigid encoding of odor
pleasantness may be recoded at later stages of processing to reflect changing
contingencies obtained through experience and learning (Brennan and Keverne, 1997;
Wilson and Stevenson, 2006). Indeed, the olfactory system is known for plasticity at
multiple levels (Graziadei et al., 1979; Wilson et al., 2004; Barkai, 2005; Mandairon et
al., 2006), that reflects an advantageous evolutionary mechanism. To automatically
reject food that smells fermented is generally a safe bet. However, if through experience
one learns that exceptions exist, and for example fermented fish can be both tasty and
healthy, than its pleasantness representation may shift. This is what allows Swedes to

Final ARO Report
26
enjoy their Surströmming Herring (a dish not for the faint of heart), although even they
won't say they like the odor per se. Finally in this respect, it is notable that although our
predictive power for pleasantness was significant (p < .004), we explained only a portion
of the variance. This leaves open the possibility that individual differences and plasticity
in olfactory hedonics make important contributions to olfactory perception.
In this study we probed the link between physico-chemical properties and odor
perception. Past studies have approached this by varying stimuli along a single and
simple physico-chemical dimension such as carbon chain length (Laska and Teubner,
1999), or a single and simple perceptual descriptor (Rossiter, 1996) such as "bitter
almond like" (Zakarya et al., 1993). Here, rather than moving from chemistry to
perception, we went from perception to chemistry, and probed a large set of physico-
chemical descriptors using an unbiased statistical approach. In this, we have followed in
the footsteps of Schiffman, Amoore, Dravnieks, and others, that together laid the
groundwork for this approach between the early 1950s to late 1970s (Amoore, 1963;
Laffort and Dravnieks, 1973; Schiffman, 1974). In this respect, the contribution of the
current work is in observing that the perception of pleasantness corresponded to a
physico-chemical axis that was the best single discriminator of molecules that have a
smell. This enabled a critical component of this manuscript, namely, predicting
perceptual aspects of a novel odorants that were not in the original test set.
In conclusion, we generated an olfactory perceptual space, and a molecular
physicochemical space. Relating these spaces to each other allowed us to predict a
moderate portion of the variance in olfactory perception, but more critically, led us to
conclude that the major axis of perception reflects the major axis of physico-chemical

Final ARO Report
27
organization. Whereas the particular labels applied to the primary axes of perception and
physico-chemical organization may be modified through future research, or interpreted
differently by different researchers, we suggest that the privileged link between PC1 of
perception and PC1 of physico-chemical organization reflects an organizational property
of the sense of smell.

Final ARO Report
28
Figure Legends
Figure 1. Olfactory perceptual space. A: The proportion of variance in perceptual
descriptions explained by each of the PCs (starting at ~0.3), and the cumulative variance
explained (starting at ~0.05). B: The 144 odorants projected into a 2-dimentional space
made of the first and second PCs. The 9 odorants used in Experiment 1(acetophenone,
amyl acetate, diphenyl oxide, ethyl butyrate, eugenol, guaiacol, heptanal, hexanoic acid,
and phenyl ethanol) are in enlarged cirles, and the 5 odorants used in Experiment 2
(acetophenone, amyl acetate, ethyl butyrate, eugenol, guaiacol) are in further enlarged
circles. C: For the 9 odorants, the correlation between explicit perceived similarity
ratings and PCA-based distance for all pairwise comparisons. Odorants closer in the
perceptual space were perceived as more similar. D: Reaction time for correct trials in a
forced-choice same-different task using 5 of the 9 odorants. Error bars reflect SE.
Reaction time was longer for odorant-pairs that were closer in PCA-based space, thus
providing an implicit validation of the perceptual space.
Figure 2. Identifying pleasantness as the first PC of perception. A. The 5 descriptors
that flanked each end of PC1 of perception. We should stress that here, and in Figure 3B,
we show the 5 extreme descriptors only to help give a sense of the PC. This does not
reflect a cutoff in any stage of the analysis, but only an esthetic cutoff for the figure.
B. For the 9 odorants, the correlation between the pairwise difference in pleasantness and
the pairwise distance along the first PC. Distance along the first PC was a strong
predictor of difference in pleasantness . C: The 146 perceptual descriptors plotted as a

Final ARO Report
29
function of their weighting on the first PC of perception. D: The previously published
pleasantness associated with each one of the 146 perceptual descriptors. The descriptors
clearly weighted on the first PC of perception in accordance with their pleasantness .
E: We randomly selected 21 odorants previously tested by Dravnieks (Acetyl Pyridine,
Benzaldehyde, Amyl Acetate, Camphor dl, Celeriax, Citral, Dimethyl Pyrrole2,5,
Eugenol, Heptanal, Hexanoic acid, Hexanol1, Hexanol3, Indole, Methyl-iso-Borneol2,
Methyl Quinolinepara, Octanol1, Octenol-1-3-OL, Phenyl Ethanol, Skatole, Vanillin) and
had 22 subjects rate all odorants using 3 scales with VAS extremes of "Not at all
flowery" vs. "Extremely flowery", "Not at all sweet" vs. "Extremely sweet", and
"extremely unpleasant" vs. "extremely pleasant". Order of VAS scales was counter
balanced. Judgments were converted to z-scores for each subject, and scores for odorants
averaged across subjects. We then regressed these normalized ratings against the PC1
values for these odorants.
Figure 3. Reducing dimensionality of physico-chemical space. A: The proportion of
variance in physico-chemical descriptors explained by each of the PCs (starting at ~0.32),
and the cumulative variance explained (starting at ~0.01). B: The 5 descriptors that
weighted most heavily at the ends of PC1 of physico-chemical space. The descriptors
are: sV = 'sum of atomic van der Waals volumes (scaled on Carbon atom)'; Xu = 'Xu
index'; Xov = 'pleasantness connectivity index chi-0'; nSK = 'number of non-H atoms';
SRW01 = 'self-returning walk count of order 01 (number of non-H atoms, nSK)'; VEe2 =
'average eigenvector coefficient sum from electronegativity weighted distance matrix';

Final ARO Report
30
VEZ2 = 'average eigenvector coefficient sum from Z weighted distance matrix (Barysz
matrix)'; Vem2 = 'average eigenvector coefficient sum from mass weighted distance
matrix'; VEA2 = 'average eigenvector coefficient sum from adjacency matrix'; VED2 =
'average eigenvector coefficient sum from distance matrix.
Figure 4. Relating physico-chemical space to perceptual space. A: The correlation
between the 1st to 4th (descending in the figure) perceptual PC and each of the first 7
physico-chemical PCs for the 144 odorants. Error bars reflect SE from 1000 bootstrap
replicates. The best correlation was between the first PC of perception and the first PC of
physico-chemical space. This correlation was significantly larger than all other
correlations. B: For the 144 odorants, the correlation between their actual first perceptual
PC value and the value our model predicted from their physico-chemical data.
Figure 5. Predicting perception of novel odorants.. A: The distribution of predicted first
PC values for 52 novel odorants. B: The median pleasantness ranking for each of 5
odorants that spanned the first predicted PC, sorted by expected ranking from our model.
C: The correlation between the rated pleasantness of 27 out of the 52 odorants and the
first PC value as predicted by our model.
Figure 6. A-C: Cross-cultural validation. Twenty-seven odorous molecules not
commonly used in olfactory studies, and not previously tested by us were presented to 3
cultural groups of naïve subjects: Americans (23 subjects), Arab-Israelis (22 subjects)
and Jewish-Israelis (20 subjects). In all cases, our predictions of odorant pleasantness

Final ARO Report
31
were in fact better than in the test data (Figure 4B). D-F. Ratings of edibility for the
same odorants and groups. Across all cultures, our predicted PC1 values were
significantly better correlated with judgments of pleasantness than judgments of
edibility.

Final ARO Report
32
Bibliography
Abraham NM, Spors H, Carleton A, Margrie TW, Kuner T, Schaefer AT (2004)
Maintaining accuracy at the expense of speed: stimulus similarity defines odor discrimination time in mice. Neuron 44:865-876.
Amoore JE (1963) Stereochemical theory of olfaction. Nature 198:271-272. Anderson AK, Christoff K, Stappen I, Panitz D, Ghahremani DG, Glover G, Gabrieli JD,
Sobel N (2003) Dissociated neural representations of intensity and valence in human olfaction. Nat Neurosci 6:196-202.
Ayabe-Kanamura S, Schicker I, Laska M, Hudson R, Distel H, Kobayakawa T, Saito S (1998) Differences in perception of everyday odors: a Japanese-German cross-cultural study. Chem Senses 23:31-38.
Barkai E (2005) Dynamics of learning-induced cellular modifications in the cortex. Biol Cybern 92:360-366.
Bensafi M, Pierson A, Rouby C, Farget V, Bertrand B, Vigouroux M, Jouvent R, Holley A (2002) Modulation of visual event-related potentials by emotional olfactory stimuli. Neurophysiol Clin 32:335-342.
Berglund B, Berglund U, Engen T, Ekman G (1973) Multidimensional Analysis of 21 Odors. Scandinavian Journal of Psychology 14:131-137.
Brennan PA, Keverne EB (1997) Neural mechanisms of mammalian olfactory learning. Prog Neurobiol 51:457-481.
Cain WS (1969) Odor Intensity . Differences in Exponent of Psychophysical Function. Perception & Psychophysics 6:349-&.
Cain WS, Johnson F, Jr. (1978) Lability of odor pleasantness: influence of mere exposure. Perception 7:459-465.
Critchley HD, Rolls ET (1996) Hunger and satiety modify the responses of olfactory and visual neurons in the primate orbitofrontal cortex. J Neurophysiol 75:1673-1686.
Davis RL (2004) Olfactory learning. Neuron 44:31-48. de Araujo IE, Rolls ET, Velazco MI, Margot C, Cayeux I (2005) Cognitive modulation of
olfactory processing. Neuron 46:671-679. Dielenberg RA, McGregor IS (2001) Defensive behavior in rats towards predatory odors:
a review. Neurosci Biobehav Rev 25:597-609. Doty RL (1975) An examination of relationships between the pleasantness, intensity and
concentration of 10 odorous stimuli. Perception and Psychophysiology:492-496. Dravnieks A (1982) Odor quality: semantically generated multi-dimensional profiles are
stable. Science 218:799-801. Dravnieks A (1985) Atlas of odor character profiles. PA: ASTM Press. Dravnieks A, Masurat T, R.A. L (1984) Hedonics of odors and odor descriptors. J AIR
POLLUT CONTROL ASSOC 34:752-776. Engen T (1982) The perception of odors. New York: Academic Press. Godinot N, Sicard G (1995) Odor categorization by human-subjects - an experimental
approach. Chem Senses 20:101. Gottfried JA, Dolan RJ (2003) The nose smells what the eye sees: crossmodal visual
facilitation of human olfactory perception. Neuron 39:375-386.

Final ARO Report
33
Gottfried JA, Deichmann R, Winston JS, Dolan RJ (2002) Functional heterogeneity in human olfactory cortex: an event-related functional magnetic resonance imaging study. J Neurosci 22:10819-10828.
Graziadei PP, Levine RR, Monti Graziadei GA (1979) Plasticity of connections of the olfactory sensory neuron: regeneration into the forebrain following bulbectomy in the neonatal mouse. Neuroscience 4:713-727.
Haberly LB (2001) Parallel-distributed processing in olfactory cortex: New insights from morphological and physiological analysis of neuronal circuitry. Chemical Senses 26:551-576.
Henion KE (1971) Odor pleasantness and intensity: A single dimension? Journal of Experimental Psychology 90:275-279.
Herz RS, von Clef J (2001) The influence of verbal labeling on the perception of odors: evidence for olfactory illusions? Perception 30:381-391.
Hudson R (1999) From molecule to mind: the role of experience in shaping olfactory function. J Comp Physiol [A] 185:297-304.
Johnson BN, Sobel N (2007) Methods for building an olfactometer with known concentration outcomes. J Neurosci Methods 160:231-245.
Johnson BN, Mainland JD, Sobel N (2003) Rapid olfactory processing implicates subcortical control of an olfactomotor system. J Neurophysiol.
Kay LM, Freeman WJ (1998) Bidirectional processing in the olfactory-limbic axis during olfactory behavior. Behav Neurosci 112:541-553.
Kay LM, Laurent G (1999) Odor- and context-dependent modulation of mitral cell activity in behaving rats. Nat Neurosci 2:1003-1009.
Keverne EB (1995) Olfactory learning. Curr Opin Neurobiol 5:482-488. Kobal G, Hummel T, Vantoller S (1992) Differences in human chemosensory evoked-
potentials to olfactory and somatosensory chemical stimuli presented to left and right nostrils. Chemical Senses 17:233-244.
Laffort P, Dravnieks A (1973) An approach to a physico-chemical model of olfactory stimulation in vertebrates by single compounds. J Theor Biol 38:335-345.
Laska M, Teubner P (1999) Olfactory discrimination ability for homologous series of aliphatic alcohols and aldehydes. Chemical Senses 24:263-270.
Mandairon N, Stack C, Kiselycznyk C, Linster C (2006) Broad activation of the olfactory bulb produces long-lasting changes in odor perception. Proc Natl Acad Sci U S A 103:13543-13548.
Masago R, Shimomura Y, Iwanaga K, Katsuura T (2001) The effects of hedonic properties of odors and attentional modulation on the olfactory event-related potentials. J Physiol Anthropol Appl Human Sci 20:7-13.
Moskowitz HR, Dravnieks A, Klarman LA (1976) Odor intensity and pleasantness for a diverse set of odorants. Perception and Psychophysiology:122-128.
Murakami M, Kashiwadani H, Kirino Y, Mori K (2005) State-dependent sensory gating in olfactory cortex. Neuron 46:285-296.
Ohloff G (1986) Chemistry of odor stimuli. Experientia 42:271-279. Pager J (1983) Unit responses changing with behavioral outcome in the olfactory bulb of
unrestrained rats. Brain Res 289:87-98. Pause BM, Krauel K (2000) Chemosensory event-related potentials (CSERP) as a key to
the psychology of odors. Int J Psychophysiol 36:105-122.

Final ARO Report
34
Richardson JT, Zucco GM (1989) Cognition and olfaction: a review. Psychol Bull 105:352-360.
Rinberg d, Koulakov A, Gelperin A (2006) Speed-accuracy tradeoff in olfaction. Neuron 3:351-358.
Rolls ET (2004) Convergence of sensory systems in the orbitofrontal cortex in primates and brain design for emotion. Anat Rec A Discov Mol Cell Evol Biol 281:1212-1225.
Rolls ET, Kringelbach ML, de Araujo IE (2003) Different representations of pleasant and unpleasant odours in the human brain. Eur J Neurosci 18:695-703.
Rossiter KJ (1996) Structureminus signOdor Relationships. Chem Rev 96:3201-3240. Royet JP, Zald D, Versace R, Costes N, Lavenne F, Koenig O, Gervais R (2000)
Emotional responses to pleasant and unpleasant olfactory, visual, and auditory stimuli: a positron emission tomography study. J Neurosci 20:7752-7759.
Schiffman S, Robinson DE, Erickson RP (1977) Multidimensional-scaling of odorants - examination of psychological and physiochemical dimensions. Chemical Senses & Flavour 2:375-390.
Schiffman SS (1974) Physicochemical correlates of olfactory quality. Science 185:112-117.
Schoenbaum G, Eichenbaum H (1995) Information coding in the rodent prefrontal cortex. I. Single-neuron activity in orbitofrontal cortex compared with that in pyriform cortex. J Neurophysiol 74:733-750.
Soussignan R, Schaal B, Marlier L, Jiang T (1997) Facial and autonomic responses to biological and artificial olfactory stimuli in human neonates: Re-examining early hedonic discrimination of odors. Physiology & Behavior 62:745-758.
Steiner JE (1979) Human facial expressions in response to taste and smell stimulation. Adv Child Dev Behav 13:257-295.
Stevenson RJ, Repacholi BM (2003) Age-related changes in children's hedonic response to male body odor. Dev Psychol 39:670-679.
Tetko IV, Gasteiger J, Todeschini R, Mauri A, Livingstone D, Ertl P, Palyulin VA, Radchenko EV, Zefirov NS, Makarenko AS, Tanchuk VY, Prokopenko VV (2005) Virtual computational chemistry laboratory--design and description. J Comput Aided Mol Des 19:453-463.
Wilson DA (2003) Rapid, experience-induced enhancement in odorant discrimination by anterior piriform cortex neurons. Journal of Neurophysiology 90:65-72.
Wilson DA, Stevenson RJ (2006) Learning to smell. Baltimore: Johns Hopkins University Press.
Wilson DA, Best AR, Sullivan RM (2004) Plasticity in the olfactory system: lessons for the neurobiology of memory. Neuroscientist 10:513-524.
Wise PM, Cain WS (2000) Latency and accuracy of discriminations of odor quality between binary mixtures and their components. Chemical Senses 25:247-265.
Wysocki CJ, Pierce JD, Gilbert AN (1991) Geographic, cross-cultural, and individual variation in human olfaction. In: Smell and Taste in Health and Disease (Getchell TV, ed), pp 287-314. New York: Raven Press.
Zakarya D, Yahiaoui M, Fkih-Tetouani S (1993) Structure-odour relations for bitter almond odorants. Journal of Physical Organic Chemistry 6:627-633.

Final ARO Report
35
Zald DH, Pardo JV (1997) Emotion, olfaction, and the human amygdala: amygdala activation during aversive olfactory stimulation. Proc Natl Acad Sci U S A 94:4119-4124.
Zelano C, Bensafi M, Porter J, Mainland J, Johnson B, Bremner E, Telles C, Khan R, Sobel N (2005) Attentional modulation in human primary olfactory cortex. Nat Neurosci 8:114-120.

Final ARO Report
36
Appendixes

Final ARO Report
37
Final ARO Report
38

Final ARO Report
39
Final ARO Report
40

Final ARO Report
41