Embed Size (px)
Citation preview

REPORT DOCUMENTATION PAGE Form Approved OMB No. 0704-0188
The public reporting burden for this collection of information is estimated to average 1 hour per response, including the time for reviewing instructions, searching existing data sources, gathering and maintaining the data needed, and completing and reviewing the collection of information. Send comments regarding this burden estimate or any other aspect of this collection of information, including suggestions for reducing this burden, to Department of Defense, Washington Headquarters Services, Directorate for information on Operations and Reports (0704-0188), 1215 Jefferson Davis Highway, Suite 1204, Arlington, VA 22202-4302. Respondents should be aware that notwithstanding any other provision of law, no person shall be subject to any penalty for failing to comply with a collection of information if it does not display a currently valid OMB control number. PLEASE DO NOT RETURN YOUR FORM TO THE ABOVE ADDRESS.
1. REPORT DATE (DD-MM-YYYY) 10-05-2012
2. REPORT TYPE Final
3. DATES COVERED (From - To)
4. TITLE AND SUBTITLE Test Operations Procedure (TOP) 02-2-603A Vehicle Fuel Consumption
5a. CONTRACT NUMBER
5b. GRANT NUMBER 5c. PROGRAM ELEMENT NUMBER
6. AUTHORS
5d. PROJECT NUMBER
5e. TASK NUMBER
5f. WORK UNIT NUMBER
7. PERFORMING ORGANIZATION NAME(S) AND ADDRESS(ES) Automotive Instrumentation Division US Army Aberdeen Test Center 400 Colleran Road Aberdeen Proving Ground, MD 21005-5059
8. PERFORMING ORGANIZATION REPORT NUMBER TOP 02-2-603A
9. SPONSORING/MONITORING AGENCY NAME(S) AND ADDRESS(ES) Range Infrastructure, Test Management Directorate (CSTE-TM) US Army Test and Evaluation Command 2202 Aberdeen Boulevard Aberdeen Proving Ground, MD 21005-5001
10. SPONSOR/MONITOR’S ACRONYM(S)
11. SPONSOR/MONITOR’S REPORT NUMBER(S) Same as item 8
12. DISTRIBUTION/AVAILABILITY STATEMENT Distribution Statement A: Approved for public release; distribution unlimited. 13. SUPPLEMENTARY NOTES Defense Technical Information Center (DTIC), AD No.: This TOP supersedes TOP 02-2-603, dated 1 February 1986. Marginal notations are not used in this revision to identify changes, with respect to the previous issue, due to the extent of the changes. 14. ABSTRACT The procedures in this TOP describe the vehicle preparation and test methods used to measure and present the fuel consumption characteristics for wheeled and tracked vehicles. Specific facilities, instrumentation, test controls, and analysis techniques are presented.
15. SUBJECT TERMS fuel consumption traction battery hybrid electric vehicle tactical vehicle combat vehicle performance test endurance test Roadway Simulator Aberdeen Test Center 16. SECURITY CLASSIFICATION OF: 17. LIMITATION OF
ABSTRACT SAR
18. NUMBER OF PAGES
58
19a. NAME OF RESPONSIBLE PERSON a. REPORT B. ABSTRACT C. THIS PAGE
Unclassified Unclassified Unclassified 19b. TELEPHONE NUMBER (include area code)
Standard Form 298 (Rev. 8-98) Prescribed by ANSI Std. Z39-18

(This page is intentionally blank.)

U.S. ARMY TEST AND EVALUATION COMMAND TEST OPERATIONS PROCEDURE
*
DTIC AD No. Test Operations Procedure 02-2-603A 10 May 2012
VEHICLE FUEL CONSUMPTION
Page Paragraph 1. SCOPE ................................................................................................. 2 2. FACILITIES AND INSTRUMENTATION ....................................... 2 2.1 Facilities .............................................................................................. 2 2.2 Instrumentation .................................................................................... 7 2.3 Instrumentation Application ................................................................ 8 2.4 Specialized Equipment ........................................................................ 9 3. REQUIRED TEST CONDITIONS ..................................................... 13 3.1 Preparation for Test ............................................................................. 13 3.2 Test Controls ....................................................................................... 14 3.3 Restrictions .......................................................................................... 15 4. TEST PROCEDURES ........................................................................ 16 4.1 Performance Tests ............................................................................... 16 4.2 Endurance Operations ......................................................................... 22 4.3 Usable Fuel Capacity ........................................................................... 22 4.4 Hybrid Electric Vehicle Test ............................................................... 23 4.5 Roadway Simulator (RWS) Test ......................................................... 24 5. DATA REQUIRED ............................................................................. 25 5.1 Performance Tests ............................................................................... 25 5.2 Endurance Operations ......................................................................... 27 5.3 Usable Fuel Capacity ........................................................................... 27 5.4 Hybrid Electric Vehicle Test ............................................................... 27 5.5 Roadway Simulator Test ..................................................................... 29 6. PRESENTATION OF DATA ............................................................. 29 6.1 Performance Tests ............................................................................... 29 6.2 Endurance Operations ......................................................................... 38 6.3 Usable Fuel Capacity ........................................................................... 38 6.4 Hybrid Electric Vehicle ....................................................................... 38 6.5 Fuel Consumption Computations ........................................................ 39 APPENDIX A. RECOMMENDED OPERATING SCHEDULES .............................. A-1 B. BURETTE FUEL CONSUMPTION TEST METHOD ..................... B-1 C. COMPACT ELECTRICAL LOAD BANK CAPABILITIES (ON-THE-MOVE) .............................................................................. C-1
Approved for public release; distribution unlimited.

TOP 02-2-603A 10 May 2012
2
APPENDIX D. HYPOTHESIS TESTING FOR SMALL SAMPLE SIZE ................. D-1 E. ABBREVIATIONS ............................................................................. E-1 F. REFERENCES .................................................................................... F-1 G. APPROVAL AUTHORITY ................................................................ G-1
1. SCOPE. This Test Operations Procedure (TOP) describes the test methods utilized to measure and evaluate wheeled and tracked vehicle fuel consumption characteristics during both performance and endurance type operating conditions. Test methods are applicable to land and amphibious vehicles with internal combustion or turbine engines, and hybrid electric drivelines. 2. FACILITIES AND INSTRUMENTATION. 2.1 Facilities.
Item Requirement Level, Paved Road (Dynamometer Test Course, Perryman 3-mile Straightaway, Phillips Army Airfield)
A straight, level, paved road with a lane width of not less than 3.7 meters (m) (12.0 feet (ft)), a longitudinal gradient ≤ 1 percent, and a super elevation of ≤ 2 percent.
Munson Test Area (MTA) Standard Fuel Course
This course consists of a combination of gravel and paved surfaces, and longitudinal grades, and has historically been used to measure and compare vehicle fuel consumption. It is located within the MTA of the US Army Aberdeen Test Center (ATC). A pictorial view of the course is presented in Figure 1.
Harford Loop Test Course The Harford Loop is a paved, closed loop
course comprised of local highways located north of the ATC. It is 30 kilometers (km) (18.5 miles) in length and is generally described as gentle rolling hills with grades ranging from 2 to 10 percent. The course includes three stop signs and one traffic light. It is driven at posted speed limits ranging between 48 and 80 kilometers per hour (km/hr) (30 and 50 miles per hour (mph)). A map of the course, outlined in blue, is presented in Figure 2.

TOP 02-2-603A 10 May 2012
3
Item Requirement Conowingo Loop Test Course The Conowingo Loop is a paved, closed loop
course, 75 km (46.5 miles) in length, comprised of segments of local and federal public highways located north of the Churchville Test Area (CTA) of ATC. The course is selected to satisfy requirements of Society of Automotive Engineers (SAE) procedures J12641, J13212, and J15263, which are used to assess medium to heavy duty in-service vehicles. A map of the course, outlined in red, is presented in Figure 2.
Level Course, Off-Road Rough and well-used cross-country roadway
with minimal grade: e.g., Perryman Test Area (PTA) courses No. 2 and 3 and MTA gravel course. Figure 3 shows the Perryman off road courses.
Hilly Course, Off-Road Cross-country; moderate to rough native soil
and stone with various grades less than 30 percent; e.g., CTA course B. An aerial view is presented in Figure 4.
Secondary road; improved gravel road with
grades less than 10 percent; e.g., CTA course C.
Automotive Test and Evaluation Facility (ATEF)
ATEF is specifically engineered as a concentric multi-surface, paved and gravel high-speed test track. The 7.2 km (4.5 mile) long and 61 m (200 ft) wide tri-oval track includes generous safety run-off areas and wireless monitoring of every vehicle for real-time data capture. The track is flat by design. Longitudinal grades do not exceed 0.5 percent and the 1 mile straightaway has a longitudinal gradient of 0.1 percent. Curves are also relatively flat with a super-elevation of only 2 percent to allow water drainage from the track surface. The military specific road bed will support vehicle weights in excess of 120 tons. Figure 5 shows the track.
*Superscript numbers correspond to Appendix F, References.

TOP 02-2-603A 10 May 2012
4
Item Requirement Mile Loop The mile loop is a multi-function test area
comprised of a level concrete course, oval in shape, and is used for continuous speed operation of test vehicles. The 1 mile course is covered with hot-mixed bituminous concrete, and has a parallel outside oval of gravel. Turns are lightly banked at 5 percent.
Roadway Simulator (RWS) The ATC Roadway Simulator is a chassis
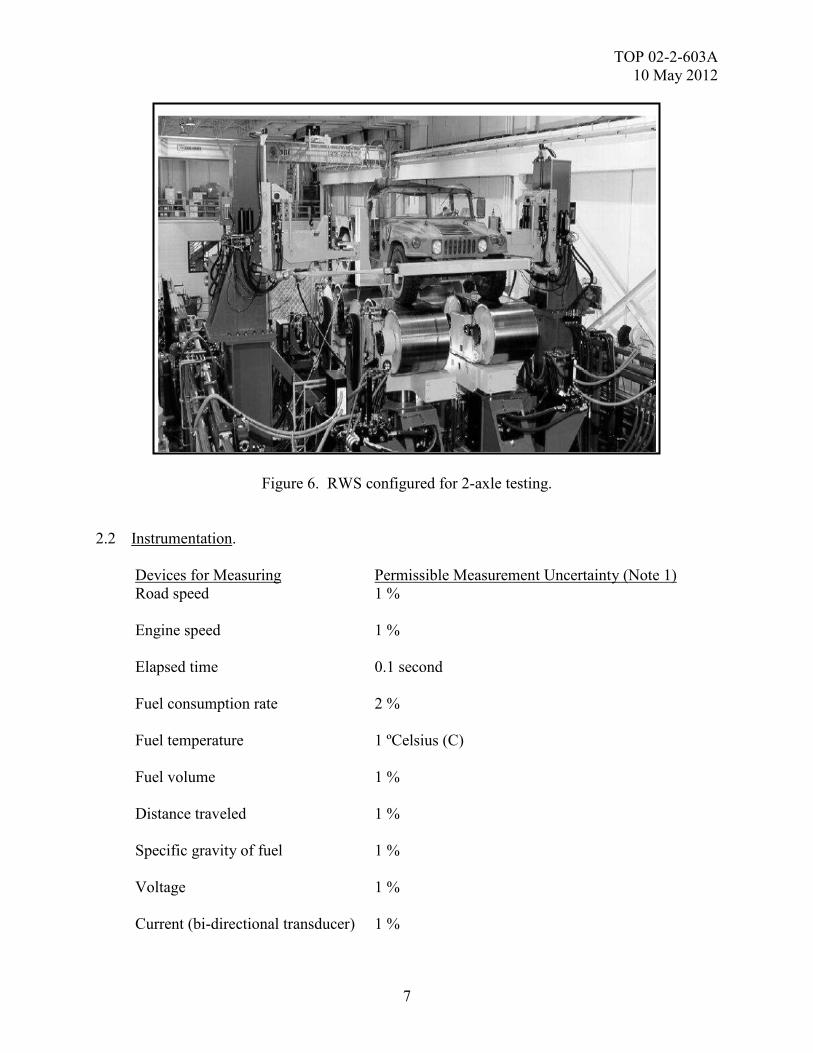
dynamometer facility capable of full power-train, steering, and handling tests. The vehicle is restrained in the longitudinal, lateral, and yaw directions, but allows freedom of movement in the pitch and roll axes, and vertically. Figure 6 shows a two axle vehicle mounted on the RWS.
Figure 1. MTA Standard Fuel Course.

TOP 02-2-603A 10 May 2012
5
Figure 2. Harford Loop and Conowingo Loop map locations.
Figure 3. PTA, No. 2 and 3 Courses.

TOP 02-2-603A 10 May 2012
6
Figure 4. CTA, B and C Courses.
Figure 5. ATEF aerial photograph.
TOP 02-2-603A 10 May 2012
7
Figure 6. RWS configured for 2-axle testing. 2.2 Instrumentation.
Devices for Measuring Permissible Measurement Uncertainty (Note 1) Road speed 1 % Engine speed 1 % Elapsed time 0.1 second Fuel consumption rate 2 % Fuel temperature 1 ºCelsius (C) Fuel volume 1 % Distance traveled 1 % Specific gravity of fuel 1 % Voltage 1 % Current (bi-directional transducer) 1 %

TOP 02-2-603A 10 May 2012
8
Devices for Measuring Permissible Measurement Uncertainty (Note 1) Traction battery temperatures 2 ºC Meteorological data: Atmospheric pressure 1 % Ambient temperature 1 ºC Humidity 3 % Wind speed 5 % Wind direction 50 milliradians (mrad)
NOTE 1: The permissible measurement uncertainty is the two-standard deviation value for normally distributed instrumentation calibration data. Thus, 95 percent of all instrumentation calibration data readings will fall within two standard deviations from the known calibration value. 2.3 Instrumentation Application. a. Controlled (Performance) Tests. Instrument the vehicle to measure fuel consumed, elapsed time, engine speed, road speed, and fuel temperature. The instrumentation commonly used consists of a calibrated burette, auxiliary fuel tank, flow-meter, timing device, engine tachometer, road speed, and a Type T thermocouple to measure fuel temperature. b. Operational (Endurance) Tests. (1) Minimally, no special instrumentation is required to measure fuel consumption during endurance tests, or other tests representative of service operating conditions. To measure fuel consumed during these tests, carefully make all refills of vehicle fuel tanks to the same level. Before the tests are started, select a level that will assure no loss of fuel through spillage from vehicle movement or from thermal expansion. Factors influencing the level sensitivity of the fill volume of the tank, such as tank geometry and free surface area at the designated fill mark should be considered when determining the fill mark location. Determine total distance traveled and total operating time from instrumentation that is typically installed for endurance tests. (2) Alternate methods to obtain vehicle fuel consumption characteristics during endurance operations are to install a specialized fuel measurement system described in paragraph 2.4.a or from the J1708 or J1939 engine control data buses when the fuel rate is available. Typically, a Global Positioning System (GPS) is used to measure distance traveled. Care must be utilized when integrating the fuel rate to determine total fuel consumed to minimize integration errors.
TOP 02-2-603A 10 May 2012
9
c. Hybrid Electric Vehicles. (1) For vehicles utilizing hybrid electric technology, access to high voltage electrical components is required for measurement of bi-directional current and voltage following the defined sign convention. (2) For a propulsion system utilizing traction batteries, battery pack performance will be determined using current and voltage measurements. The Net Energy Change (NEC) of the traction batteries will be determined by calculating amp-hour integration based upon measurements from an externally installed current transducer independent from the vehicle systems. The traction batteries will provide variable proportions of power necessary for propulsion depending on the vehicles environmental and/or driver demands, and the initial state of charge (SOC) of the batteries. Sign convention for current flow will be referenced to the main electrical bus, with positive current defined as current flow to the bus, and negative current defined as current from the bus. Thus, negative battery current indicates power from the bus into the battery pack while positive battery current indicates battery discharging to the bus, either from the Prime Power Unit (PPU) or as a result of traction motor regeneration. 2.4 Specialized Equipment. Specialized equipment/instrumentation that may be required for testing are as follows: a. Fuel Burettes. The installation procedure to follow when using the burette method is shown in Appendix B. The fuel burette should be sized according to the type of test being conducted and the expected fuel consumption rate, length of the test run, and required measurement accuracy. There are three burette volumes 7.6 liter (L) (2.0 gallon), 20 L (5.3 gallon), and 118 L (31.1 gallon) available for use. The accuracy of the burettes is 100 cubic centimeters (cc), 250 cc, and 2000 cc, respectively. Greater measurement accuracy can be achieved using interpolation techniques. b. Fuel Flow Measurement System. (1) This system in principle is the electronic version of the fuel burette. ATC currently uses two different sized systems, depending on the engine power requirements of the test item and the fuel supply and return flow rates. Each system is engineered to provide test stand accuracy in a portable, vehicle-powered, in-vehicle unit. The systems provide a measurement solution to the many inherent problems involved in the accurate measurement of vehicle fuel consumption. These include: vapor elimination, high return fuel temperatures, pressure regulation, and overall plumbing considerations. The fuel measurement system includes a filter, vapor eliminator, flow meter, level controller, heat exchanger, two fuel pumps, two pressure regulators, pressure relief valves, pressure gauges, and a resistance-temperature detector (RTD) probe. The display provides flow rate indication, a totalizer (total flow passed in an amount of time), temperature/specific gravity data, and an analog output proportional to the rate display.

TOP 02-2-603A 10 May 2012
10
(2) The vapor eliminator removes entrained vapors, which form in fuels that are pumped or warmed. By removing these vapor bubbles, the volumetric delivery of the fuel pump remains stable and the maximum accuracy of the flow meter is achieved. The high-resolution flow meter has an idle-to-full throttle range and is insensitive to changes in the fuel viscosity or density. A fuel-to-fuel heat exchanger on the return fuel line stabilizes the supply fuel temperature throughout the testing. Pumping and pressure regulation are designed into the measurement system to work with any fuel pump location and pressure. A level controlled recirculation tank collects return fuel from the engine and re-circulates this fuel back to the engine instead of returning it to the vehicle’s fuel tank. This recirculation loop allows the use of a single meter to measure make-up fuel as it replaces the fuel consumed by the engine. The level controller can be affected by fuel movement as a function of the geometry of the day tank and dynamic effects of the vehicle. Dynamic effects on the fuel that cause level controller variations are due to negotiating grades, and to a lesser extent, forces due to lateral acceleration. With respect to the longitudinal axis of the vehicle, the orientation of the fuel meter system day tank shall be such that effects from operating on grades and in sustained turns will be minimized based on the test scenario being conducted.
(3) The Max Machinery model 710** is generally used for test items employing engine power ratings of 246 kilowatt( kW) (330 horse-power (Hp)) or less, although supply and return fuel flow rates may dictate use of the larger unit. Figure 7 shows the model 710 fuel unit. The Max Machinery model 910 is used on test items with larger engine displacement/power ratings (up to 1500 Hp). Figure 8 shows the model 910 fuel unit. Figure 9 shows a schematic of the principal components and their integration into a typical test setup.
Figure 7. Model 710 fuel flow measurement system.
**The use of brand names does not constitute endorsement by the Army or any other agency of the Federal Government, nor does it imply that it is best suited for its intended application.

TOP 02-2-603A 10 May 2012
11
Figure 8. Model 910 Fuel Flow Measurement System installed on Hybrid Refuse Truck
Figure 9. Schematic for fuel flow measurement system.

TOP 02-2-603A 10 May 2012
12
c. Auxiliary Fuel Tank. When using a portable fuel tank for fuel measurement, the tank should have a minimum capacity of 61 L (16 gallons) and should be mounted on the vehicle close to the engine and fuel supply system. The tank should be equipped with quick disconnect fittings attached in a manner that can accommodate the fuel flow required by the engine and fuel return. Hoses must be disconnected from the portable tanks within 5 seconds of engine shutdown at the end of each test run. Disconnect the return line first. Failure to do this may result in unequal drain back, particularly from the fuel return line. The outside of the fuel tanks should be wiped clean of fuel and dirt each time they are weighed. The fuel temperature in the portable weighing tanks should be kept below 71 ºC (160 ºFahrenheit (F)). Fuel coolers can be used to maintain the temperature below this value, but positioning the portable weigh tank in an area of good air flow is preferable. Fuel heaters should not be used unless required by low ambient temperatures. At least 11 L (3 gallons) of fuel should remain in the portable tank at the end of each test run to reduce fuel heating. d. Flowmeter. If vehicles are fitted with on-board flowmeters, the meters must be capable of temperature density compensation and must be calibrated to a minimum accuracy of + 1 percent at a flow rate consistent with the vehicle being tested. The use of flow meters is the least desirable method for measurement of fuel usage. e. Electrical System Tester. ATC currently uses the AeroVironment ABC-150 and AV-900 Power Processing Systems. These are bi-directional, computer controlled direct current (dc) power supplies used to apply a specific charging profile to measure the capacity of traction batteries and to test integrated drive trains and subsystems of hybrid and electrical vehicles. They are also capable of simulating vehicle energy storage systems such as the battery, flywheel, drive motor/inverter, auxiliary power unit, or fuel cell. The ABC-150 offer capabilities up to 400 amps capacity, while the AV-900 has an increased capability to 900 amps. f. Portable Electrical Load Banks. Resistive and reactive load banks of various capacities are used to simulate parasitic electrical loads associated with communications, active protection, and other ac and dc electrical loads experienced while operating combat and tactical vehicles. Appendix C provides detailed capabilities of the load banks. g. American Petroleum Industry (API) Hydrometer. The API Hydrometer is used for accurate determination of the density, relative density (specific gravity), or API gravity of petroleum. Its products are necessary for the conversion of measured volumes to volumes or masses, or both, at the standard reference temperatures. American Society for Testing Materiel (ASTM) D12984 is the method used for the measurement process.

TOP 02-2-603A 10 May 2012
13
h. Scales. The scale for the weight measurement method must be calibrated in maximum increments of 45 gram (g) (0.1 pound (lb)) or 28.4 g (1 ounce (oz)) when the portable tank weight method is used. All auxiliary fuel tanks used in the test should be weighed on the same scale. The scales will be checked with a known deadweight of approximately 45.4 kilogram (kg) (100.0 lb) before each series of readings. 3. REQUIRED TEST CONDITIONS. 3.1 Preparation for Test. a. Review all instructional material issued with the test vehicle by the manufacturer, contractor, or government, as well as reports of previous similar tests on the same types of vehicles. b. Select the appropriate test facilities to be used based on the requirements documents and purpose of the test. c. Select the tests needed to satisfy the requirements document for the specific item to be tested. Use the vehicle operational mode summary/mission profile (OMS/MP), if referenced, and/or Appendix A of this TOP as a guide in determining appropriate mission profiles in terms of vehicle function, terrain severity, test speed(s), and percent of test time. d. Prepare data collection sheets to record all pre-test information, conditions of test, test results, observations, and measurements that would be valuable in the analysis and assessment. These include: (1) Vehicle identification. (2) Type, model, and serial number of each significant component (engine, transmission, traction battery, final drive, etc.). (3) Vehicle payload and corresponding weight distribution. (4) Tire characteristics (size, load range, operating pressure, etc.). (5) Track characteristics (including track tension). (6) Fuel specification/type ,and its specific gravity.
(7) Accessory loads employed. e. Ensure that all test personnel are familiar with the required technical and operational characteristics of the item and with the required test procedures. If Soldiers are desired, ensure a

TOP 02-2-603A 10 May 2012
14
Test Schedule and Review Committee (TSARC) request is submitted within one year from the start of testing or as early as possible. 3.2 Test Controls. a. Prior to testing, ensure that the vehicle has been inspected and serviced in accordance with TOP 02-2-5055 to insure its condition for optimum performance. If equipped with a hybrid electric driveline, use TOP 02-1-0036 for service and inspection procedures. Pay particular attention to the engine, transmission, tire inflation setting, and track tension. Specific checks and/or adjustments are as follows: (1) Engine governor set to manufacturer’s recommendation. (2) New air cleaner elements and/or fuel filters installed, if deemed necessary. (3) Vehicle is reasonably clean. (4) Cab side window position (open or closed) remains the same for the entire test. (5) Accessory electrical loads for the test vehicle must be as consistent as possible throughout the test; e.g., air conditioner on/off, lights on/off, etc. The battery should be fully charged to minimize alternator loading. (6) Trailer/towed loads free of damage to exterior surfaces that would affect aerodynamic drag. (7) Wheel alignment checked and properly adjusted. Trailer axle alignment should be checked. (8) Vehicle properly lubricated prior to test. All fluid levels should be checked and set to prescribed levels. (9) Temperature controlled fan drives locked in same operating mode (on/off) throughout the test. (10) Belts and hoses are tight. (11) A stall check made and correct shift points verified on vehicles with automatic transmissions and torque converters. (12) For vehicles with electronic controls, absence of diagnostic codes should be verified. (13) Brakes properly adjusted, which requires that there be no lining-to-drum/rotor contact with the brakes released.

TOP 02-2-603A 10 May 2012
15
(14) The vehicle is payloaded in accordance with the test plan. The rollover threshold, and/or theoretical tipping angle of the vehicle, is measured or known for the specific vehicle configuration under test. The tilt table test is conducted in accordance with SAE Recommended Practice J21807. This procedure allows for the determination of the test vehicle’s maximum side slope angle and simulated lateral acceleration prior to rollover. The theoretical tipping angle is determined using the guidelines in TOP 02-2-8008. b. Record meteorological conditions for all periods of operation. Conditions should be monitored in no fewer than 15-minute intervals. c. Perform periodic lubrication and maintenance services throughout testing in accordance with the applicable lubrication orders and technical manuals. The vehicle warm-up period should include at least one hour of typical operation prior to testing to insure stabilized temperatures of tires, bearings, hubs, gear-cases, etc. Unless the testing is specifically evaluating the lubricant effects of fuel economy, care should be taken to ensure that lubricant changes or additions do not take place over the duration of the test. d. All of the tires must have operated on a road or track at least 160 km (100 miles) prior to the test. Tires must have at least 75 percent of the tread remaining, and the tread must be in good condition. Tire pressures should be verified for the intended operation, and the Central Tire Inflation System (CTIS) should be set for the terrain, if so equipped. Tracked vehicles should follow the recommended track break-in procedure for the vehicle type, and the track tension should be adjusted prior to the start of the test. e. Unless otherwise specified, use referee grade fuels to simulate the lowest acceptable quality of fuel that meets the specific fuel quality standards. The fuel temperature in the fuel measurement system should be kept below 71 ºC (160 ºF). Fuel coolers can be used to maintain the temperature below that value, but positioning the instrumentation in an area of good air flow is the best solution. Fuel heaters should not be used unless required by low ambient temperatures. f. For hybrid vehicles, measure the battery SOC and maintain the traction battery capacity as required in the test plan. 3.3 Restrictions. Tests are not conducted at night or during inclement weather. Test course safety and operational procedures will be carefully followed. Desirable operational conditions for test conduct are as follows: a. Wind speed: ≤ 16 km/hr (10 mph) average and 24 km/hr (15 mph) gusts b. Ambient temperature: 0 ºC (32 ºF) ≤ Temperature ≤ 32 ºC (90 ºF) c. Fuel temperature: ≤ 71 ºC (160 ºF)

TOP 02-2-603A 10 May 2012
16
d. Humidity: ≤ 95 % 4. TEST PROCEDURES. 4.1 Performance Tests. The following series of controlled tests are conducted to determine fuel consumption characteristics for vehicles used to transport personnel, cargo, or weapon systems. Data are measured based on gear range, road speed, engine speed, and vehicle weight. This category also includes some multifunctional vehicles (e.g., amphibious vehicles) requiring separate fuel consumption measurements for each function. 4.1.1 Road Load Test. a. Operate the vehicle at constant speeds on a level, paved test course (unless otherwise specified) at not less than four equal speed increments over the operating range of the vehicle in each gear. b. Monitor engine speed to insure adequate coverage of engine operation to include peak torque and rated power. c. Measure the fuel consumed for each speed increment. Follow the guidelines in Appendix D to determine the adequate number of test runs needed. 4.1.2 Full Load Test. a. Conduct full-load, full-throttle fuel consumption tests simultaneously with drawbar pull tests on level, paved surfaces as described in TOP 02-2-6049. b. Monitor engine speed to ensure adequate coverage of engine operation to include peak torque and rated power. c. Measure fuel consumption at several points within the engine speed range. Follow the guidelines in Appendix D to determine the adequate number of test runs needed. 4.1.3 No Load Test (Transmission in Neutral Gear). a. With the vehicle stationary and the transmission in neutral, operate the engine at speeds ranging from idle speed to governed engine speed. b. Measure fuel consumption for each engine speed enough times to ensure reproducibility. Follow the guidelines in Appendix D to determine the adequate number of test runs needed.

TOP 02-2-603A 10 May 2012
17
4.1.4 Standard Course Tests. a. General Operating Instructions. (1) Vehicles equipped with manual transmissions will be operated in the following manner: idles will be made in gear, clutch disengaged. Decelerations will be made in gear, and the clutch will be disengaged at 24 km/hr (15 mph) on any required stops. All cruise operations should be in the highest gear that will prevent engine lugging. Downshifts are permitted, as needed, to maintain the specific speed over the operating terrain. (2) Vehicles with overdrive transmissions, where the overdrive unit engages automatically, are to be driven with the actuator switch in a position that ensures engagement when conditions for operation are met. On vehicles where overdrive is engaged manually (such as a designated overdrive gear), upshift to overdrive at the manufacturer’s recommended speed for smooth operation. Where specified accelerations cannot be maintained in overdrive, make the complete acceleration in the conventional gear and engage overdrive upon reaching the specified speed. (3) On vehicles with automatic transmission, the service brakes should be applied to maintain the requested speed if the engine idle results in vehicle speed greater than that specified (see SAE J108210). b. Standard Fuel Consumption Course (Figure 1). Operate the test vehicle on ATC’s standard fuel consumption course in each direction of travel at various increments of speed, that span its normal operating speed range up to the maximum safe speed. Using discretion when ascending and descending grades and during steering maneuvers, the driver attempts to maintain the requested speed for all continuous laps of each test run. Perform each test run at a sustained road speed for a sufficient number of laps (each lap is 1.5 miles in length) to minimize the error incurred at the start and end of the run. Five laps are generally conducted at each speed. Maximum speed is determined when one or more of the following criteria are met: (1) Maximum test course speed is reached. Munson paved is 72 km/hr (45 mph) with 40 km/hr (25 mph) in the turns, and Munson gravel is 56 km/hr (35 mph). Refer to ATC Automotive Test Courses Standing Operating Procedure (SOP) 385-517611 for additional guidance. (2) When the measured lateral acceleration reaches 75 percent of the predetermined rollover threshold value. The roll over value is determined from a tilt table test or calculated from the center of gravity (CG) height and tread measurement of the test item. (3) The average ground speed from the previous run is not significantly different from the current attempt.

TOP 02-2-603A 10 May 2012
18
c. Harford Loop Course (Figure 2). This course is used when a paved rolling road scenario is required. Fuel consumption parameters are measured as the vehicle is operated over the course in both directions at the posted speed limits. All traffic signs and signals are followed. d. Conowingo Loop Course (Figure 2). This course provides a standard road load duty cycle for comparing the fuel economy provided by vehicle components or systems of the type that can be switched from one vehicle to another in a short period of time. This course is also ideally suited for comparing the fuel consumption characteristics of one vehicle to another, and a vehicle combination equipped with a particular component to another vehicle combination with the same component. SAE J1526 should be used as a guide for test controls and conduct. e. Level Off-Road Course (Figure 3). Operate the vehicle on ATC’s Level Cross Country 2 and 3 Courses (located at PTA) at various increments of speed that span its normal operating speed range, up to the maximum achievable safe speed. Using discretion when traversing sections of rough terrain, the driver attempts to maintain the requested speed for all continuous laps of each test run. Perform each test run at a sustained road speed for a sufficient number of laps (each combined lap is 5.1 miles in length) to minimize the error incurred at the start and end of the run. The maximum speeds for each test course are 40 km/hr (25 mph) for PTA 2, and 32 km/hr (20 mph) for PTA 3. f. Hilly Off-Road Course (Figure 4). Operate the vehicle on ATC’s Hilly Cross-country B-Course (located at CTA) in each direction at various increments of speed that span its normal operating speed range, up to the maximum achievable safe speed. Using discretion when ascending and descending grades and during steering maneuvers, the driver attempts to maintain the requested speed for all continuous laps of each test run. Perform each test run at a sustained road speed for a sufficient number of laps (each lap is 3.6 miles in length) to minimize the error incurred at the start and end of the run. The maximum speed for CTA B-Course is 56 km/hr (35 mph). CTA C-Course is used to simulate hilly secondary road operations, and the maximum speed for CTA C-Course is 56 km/hr (35 mph), and 32 km/hr (20 mph) in the upper and lower turnarounds.
g. Automotive Test & Evaluation Facility (ATEF) (Figure 5). ATEF is used when sustained high speeds are needed to simulated operations on improved gravel roads. The test course design allows high speed operations up to 80 km/hr (50 mph) on a compacted gravel surface for indefinite time periods.

TOP 02-2-603A 10 May 2012
19
h. Mile Loop. The mile loop is used for continuous operations at low/moderate speeds. Speeds not to exceed 72 km/hr (45 mph) on paved are permitted. Continuous operation at 56 km/hr (35 mph) is permitted on the outer gravel loop. i. Roadway Simulator (RWS). The RWS allows precision control of a vehicle’s operating environment by robotic vehicle operation and load, and/or speed control at each wheel location. Since the test vehicle remains stationary and the simulated road environment moves beneath the vehicle, opportunity exists to conduct dynamic vehicle tests in a stationary, controlled setting. Simulation of gradeability, tractive effort, and road load operations are conducted with robotic control of the normal driver demands. The RWS facility provides an excellent setting to develop vehicle level fuel consumption maps, determination of powertrain budget and parasitic losses, and to determine the interaction of the vehicle powertrain and stationary and transient electrical power demands. j. Measure fuel consumption parameters for each speed and course direction traveled. Repeat each measurement a sufficient number of times to ensure representative results. Follow the guidelines in Appendix D to determine the adequate number of test runs needed. 4.1.5. Performance Test Data Calculations. a. Fuel economy and fuel consumption will be calculated for each performance or standard course test point using the measured fuel volume, the elapsed time, true road speed, and the measured fuel temperature. The following three relationships are used for the fuel economy and fuel consumption calculations:
𝑭𝒖𝒆𝒍 𝑬𝒄𝒐𝒏𝒐𝒎𝒚𝒎𝒑𝒈 =�𝑨𝒗𝒆𝒓𝒂𝒈𝒆 𝑽𝒆𝒉𝒊𝒄𝒍𝒆 𝑺𝒑𝒆𝒆𝒅𝒊𝒏 𝒎𝒑𝒉�(𝑬𝒍𝒂𝒑𝒔𝒆𝒅 𝑻𝒊𝒎𝒆 𝒊𝒏 𝒔𝒆𝒄𝒐𝒏𝒅𝒔)(𝟏.𝟎𝟓)
𝑴𝒆𝒂𝒔𝒖𝒓𝒆𝒅 𝑭𝒖𝒆𝒍 𝑽𝒐𝒍𝒖𝒎𝒆𝒊𝒏 𝒄𝒖𝒃𝒊𝒄 𝒄𝒆𝒏𝒕𝒊𝒎𝒆𝒕𝒆𝒓𝒔
where:
mpg = miles per gallon mph = true road speed
𝐴𝑣𝑒𝑟𝑎𝑔𝑒 𝐹𝑢𝑒𝑙 𝑈𝑠𝑎𝑔𝑒 𝑅𝑎𝑡𝑒𝑖𝑛 𝑔𝑝ℎ = (𝑀𝑒𝑎𝑠𝑢𝑟𝑒𝑑 𝐹𝑢𝑒𝑙 𝑉𝑜𝑙𝑢𝑚𝑒𝑖𝑛 𝑐𝑢𝑏𝑖𝑐 𝑐𝑒𝑛𝑡𝑖𝑚𝑒𝑡𝑒𝑟𝑠)(0.952)
𝐸𝑙𝑎𝑝𝑠𝑒𝑑 𝑇𝑖𝑚𝑒𝑖𝑛 𝑠𝑒𝑐𝑜𝑛𝑑𝑠
where: gph = gallons per hour
TOP 02-2-603A 10 May 2012
20
𝐴𝑣𝑒𝑟𝑎𝑔𝑒 𝐹𝑢𝑒𝑙 𝑈𝑠𝑎𝑔𝑒 𝑅𝑎𝑡𝑒𝑖𝑛 𝑝𝑝ℎ = (𝑀𝑒𝑎𝑠𝑢𝑟𝑒𝑑 𝐹𝑢𝑒𝑙 𝑉𝑜𝑙𝑢𝑚𝑒𝑖𝑛 𝑐𝑢𝑏𝑖𝑐 𝑐𝑒𝑛𝑡𝑖𝑚𝑒𝑡𝑒𝑟𝑠)(𝑆𝐺)(7.92)𝐸𝑙𝑎𝑝𝑠𝑒𝑑 𝑇𝑖𝑚𝑒𝑖𝑛 𝑠𝑒𝑐𝑜𝑛𝑑𝑠
where:
pph = pounds per hour sg = specific gravity of fuel (function of temperature) b. Comparison of fuel volumes among vehicles and multiple test points can be accomplished by correcting to a standard temperature. Fuel consumption measurements from the installation fuel pump (uncorrected for fuel temperature) can be corrected for temperature to an equivalent volume at a standard temperature of 60 ºF using the following formula:
𝑉𝐹60 =𝑆𝐺𝑇𝑇𝑆𝐺60
𝑉𝐹𝑇𝑇
where:
𝑉𝐹60 = The equivalent volume of fuel if it was measured at 60 ºF 𝑆𝐺𝑇𝑇 = The specific gravity of the fuel at a given temperature 𝑆𝐺60 = The specific gravity of the fuel at 60 ºF 𝑉𝐹𝑇𝑇 = The volume of fuel pumped into the tank at a given fuel temperature
c. Comparison of fuel mass among vehicles and multiple test points can be accomplished through a direct weight measurement as an alternative to using a flow measurement system. The mass method of measurement is most useful and practical when conducting standard course or long duration tests for which the most pertinent value for comparison purposes will be the number of pounds of fuel per hour used, since this measurement factors out the influence of fuel temperature differences in the data. d. For road load and full load testing it is important to know the operating state of the torque converter, if the test item is equipped with an automatic transmission. Using the measured engine speed, overall gear ratios (transmission, transfer case, drive axle, hub), the loaded tire rolling distance and ground speed, the converter speed ratio is computed. If wheel/tire track slip are present, then the wheel or sprocket speed must be used in lieu of the true road speed. This ratio provides the relative speed of the engine and transmission input and presents that operating condition as percent slip or converter locked or unlocked.
𝐶𝑜𝑛𝑣𝑒𝑟𝑡𝑒𝑟 𝑆𝑝𝑒𝑒𝑑 𝑅𝑎𝑡𝑖𝑜 = �𝑅𝑜𝑎𝑑 𝑠𝑝𝑒𝑒𝑑 × 88𝑅𝑜𝑙𝑙𝑖𝑛𝑔 𝑑𝑖𝑠𝑡𝑎𝑛𝑐𝑒 × 𝑂𝐺𝑅�
𝐸𝑛𝑔𝑖𝑛𝑒 𝑠𝑝𝑒𝑒𝑑 × 100
where:
TOP 02-2-603A 10 May 2012
21
Road speed = mph Rolling distance = feet per revolution (ft/rev) OGR = Overall Gear Ratio Engine speed = rev/min e. Hypothesis Testing. (1) Very often in fuel consumption testing, customers are seeking an improvement in the amount of fuel consumed by a vehicle system. Hypothesis testing is a useful method to compare two sets of test data to determine if there is a statistically significant difference between the two sets. Often the two sets of data are made up of small sample sizes (5 test trials are very typical for sets of fuel consumption data). Therefore, calculations will consider only hypothesis tests for the differences between two sample means for small (the number of samples is less than 30) sample sizes. (2) Hypothesis testing relies on establishment of a sample mean and standard deviation from the acquired fuel consumption data, and relies on the evaluator to provide an expected level of confidence in the results. Typically, the level of confidence is established at 95 or 99 percent, which means that once the hypothesis test is conducted and the statistics are calculated, a 95 or 99 percent confidence level exists that the statistical test provides a correct decision. Appendix D provides discussion and examples of hypothesis testing using small sample sizes. 4.1.6 Work Function Test (Engineer Type Vehicles). a. This test is conducted to evaluate the fuel consumption characteristics of engineering equipment and other vehicles whose performance cannot be rationally measured as a function of distance traveled, but usually as a function of operating time. Included in this group are such items as construction machinery, earthmoving equipment, materials handling equipment, and some multifunctional equipment requiring separate fuel consumption measurements for each function. b. Measure fuel consumption and operating time while the vehicle is performing each work function for which it is designed. 4.1.7 On-Board Electrical Export Power Test. a. Vehicle on-board electrical requirements for powering components such as headlights, air conditioning units, etc, can be simulated through the use of power absorption systems (paragraph 2.4.e), which both controls and measures the discharged current. Current is drawn through the North Atlantic Treaty Organization (NATO) slave receptacle or other approved vehicle connection. With the vehicle stationary and the transmission in neutral, operate the engine at incremental speeds ranging from rated idle speed to governed engine speed. At each engine speed condition, vary the electrical load (current draw) incrementally from a low level up to levels that do not draw battery power.

TOP 02-2-603A 10 May 2012
22
b. At each engine speed/electrical load condition, the fuel rate is allowed to stabilize before fuel consumption characteristics (current output at the alternator and battery voltage) are measured, from which alternator power can be calculated. Repeat each measurement as necessary to assure reproducibility. c. When required, electrical export power and fuel consumption characteristics can be measured during vehicle on-the-move operations on any designated test course. Component current draw is simulated by the use of on-board load banks (paragraph 2.4.f). Appendix C describes the performance characteristics of the load banks. Pertinent measurements are made during vehicle steady-state operations at various predetermined road speeds. 4.2 Endurance Operations. a. To determine fuel consumption characteristics during vehicle endurance testing, fill the fuel tanks at the beginning and end of test operations on each course and record the amount of fuel consumed, mileage traveled, and hours of operation on the driver’s log or other suitable recording device. Also fill the tanks at the start and finish of operations for each different test condition, such as with and without towed load, change in payload, change in vehicle components, etc. Clearly mark the “fill” point for filling the fuel tanks before each test as described in paragraph 2.3.b. b. A data acquisition system capable of recording data signals from a GPS for distance, time, and road speed, and either the J1708 or J1039 data bus for both average and instantaneous fuel consumption rate are used. Calibration of the fuel consumption related data bus parameters are required to determine if the data are representative of actual fuel consumption of the vehicle. Care must be exercised to insure complete GPS coverage for the geographic area and a thorough understanding of the fuel system parameters available of the data bus. Utilizing a driver’s log, the test driver is required to enter a series of meta data for each course operation to include test course location, description and condition, vehicle payload, trailer payload, time, mileage, and fuel consumed. c. When an operational range is specified for vehicle operations on OMS/MP terrain, the vehicle is instrumented with a fuel flow measurement system to measure fuel consumed when operated through the representative mission profile matrix, at its’ prescribed payload and towed load configurations. Utilizing the fuel consumed and the distance traveled in conjunction with the vehicle’s useable fuel capacity, the operational range is determined for vehicle operations on each prescribed test course. 4.3 Usable Fuel Capacity. a. It is preferable to initiate this test when the vehicle fuel level is low from previous testing. Operate the vehicle until the engine stalls from lack of fuel. Insure that fuel tank selections are understood and all tanks are empty (do not pump out or drain tanks). b. Refill fuel tank(s) to the established full point.

TOP 02-2-603A 10 May 2012
23
c. When required, determine the maximum refueling rate for each fill port using a calibrated flowmeter and a fuel line with a variable rate nozzle. 4.4 Hybrid Electric Vehicle Test. Determination of fuel consumption characteristics of hybrid electric vehicles is accomplished by subjecting the test vehicle to a series of individual tests and operational duty cycles designed to address the full range of vehicle performance. During each test the vehicle performance data are measured by the use of installed transducers and/or the vehicle data bus. a. For a propulsion system utilizing traction batteries, battery pack performance will be determined using current and voltage measurements, and SOC utilizing information from the manufacturer supplied battery management system. The NEC of the traction batteries will be determined by calculating amp-hour integration based upon measurements from an externally installed current transducer independent from the vehicle manufacturer systems. The traction batteries provide variable proportions of power necessary for propulsion depending on the test course being traversed, and/or driver demands, and the initial SOC of the batteries. b. Vehicle performance to include fuel consumption characteristics, electric energy use and/or storage, and traction motor output (battery voltage, current, and SOC) will be determined during vehicle operations at predetermined road speeds over various designated test courses. Testing is typically initiated at 8 km/hr (5 mph) and increased incrementally to maximum safe speed. For each trial the road speed will be held as constant as possible while data are obtained. Multiple trials will be conducted at each speed to characterize control strategy behavior and Electrical Energy Storage System (EESS) characteristics. Testing at each speed will be conducted at predetermined initial high and low SOC. Additional trials will be performed within the manufacturer SOC limits to achieve statistical confidence interval goals. A sufficient number of test course laps at each speed will be conducted to adequately characterize the status (increasing, decreasing, or steady state) of traction battery SOC. c. A variety of testing scenarios are available and should be used to fully characterize the fuel consumption performance of hybrid electric vehicles. These include road load testing (paragraph 4.1.1), full load testing (paragraph 4.1.2), standard course testing (paragraph 4.1.4), level cross-country operations (i.e., PTA courses No. 2 and 3), and hilly cross-country operations (i.e., CTA course B). d. To determine the relationship between the change in battery SOC and fuel economy, the procedure is summarized as follows: (1) For each designated test course, test trials are performed at discrete road speeds incrementally from 8 km/hr (5 mph) to maximum safe speed. (2) For each road speed, perform multiple test runs at various initial SOC’s including, if they exist, those at or near SOC equilibrium points.

TOP 02-2-603A 10 May 2012
24
(3) For all test runs at each target road speed, calculate a delta SOC by subtracting the initial SOC from the final SOC. (4) Calculate net battery energy expended (kW-hr) and net battery capacity (amp-hr) for each individual test run by integrating the total. (5) Determine the relationship between fuel economy (mpg) and the various battery parameters (delta SOC, net kW-hr, and net amp-hr) using Analysis of Variance techniques. (6) For each discrete speed, determine the estimated value of fuel economy that is statistically equivalent to the point at which there is no change in net battery energy from the start to the end of the run (delta zero SOC). (7) Conduct individual test runs such that at least one test run has a net positive energy change (+ΔSOC) and at least one test run has a net negative energy change (-ΔSOC) to ensure SOC corrections are interpolated values rather than extrapolated. (8) Per Recommended Practice SAE J271112: “Because using the SOC correction procedure effectively turns multiple test values into a single value, the coefficient of determination, R2, of the linear best fit is used to determine whether the collected data are valid. For the purposes of this recommended practice the data are considered acceptable if the R2, which compares the predicted and actual values of the linear regression, is equal to or greater than 0.80”. 4.5 Roadway Simulator (RWS) Test. Fuel consumption maps at all operating states of a wheeled vehicle can be produced by sweeping through a matrix of force and speed states and allowing the vehicle to achieve a steady-state condition at each point. Shift points of the transmission bound the operating states in each gear. a. To produce fuel consumption maps, the procedure is summarized as follows: (1) Select a gear in the park, reverse, neutral, and drive (PRND) gear selector. (2) Set throttle position. (3) Run vehicle at maximum speed for the gear (which ensures that the vehicle shifts to the selected gear). (4) Hold the speed for at least 30 seconds. (5) Reduce the speed to next speed increment. Hold speed. (6) Repeat step 5 until vehicle downshifts or reaches zero speed (for 1st gear).

TOP 02-2-603A 10 May 2012
25
(7) Repeat steps 2 through 6 for the range of throttle positions. (8) Repeat steps 1 through 7 for all the desired gears. b. Averages of drawbar force (tractive effort - rolling resistance), speed, and fuel consumption measurements are calculated for each state from the data. 5. DATA REQUIRED. 5.1 Performance Tests. 5.1.1 Road Load Test.
a. Test course.
b. Vehicle test weight.
c. Fuel type.
d. Vehicle road and engine speeds for each measurement.
e. Fuel consumed per test condition.
f. Time to consume fuel.
g. Change in battery energy and power for hybrid vehicles.
h. Fuel temperature.
i. Air temperature, humidity, wind speed, wind direction, and pressure. 5.1.2 Full Load Test. Reference paragraph 5.1.1. 5.1.3 No Load Test.
a. Fuel consumed for each engine speed.
b. Time to consume fuel.
c. Fuel type.
d. Fuel temperature.
e. Air temperature, humidity, wind speed, wind direction, and atmospheric pressure.

TOP 02-2-603A 10 May 2012
26
5.1.4 Standard Course Test. a. Vehicle weight. b. Center of gravity location. c. Rollover threshold. d. Test course and vehicle direction on course. e. Fuel type. f. Fuel consumed per test condition. g. Time to consume fuel. h. Distance traveled. i. Fuel temperature. j. Air temperature, humidity, wind speed, wind direction, and atmospheric pressure. 5.1.5 Work Function Test. a. Work function performed. b. Time for each function. c. Fuel consumed per work function. d. Fuel type. e. Fuel temperature. f. Road and engine speed, where applicable. g. Air temperature, humidity, wind speed, wind direction, and atmospheric pressure. 5.1.6 On-Board Electrical Export Power Test. a. Fuel consumed for each test condition (engine speed and electrical load). b. Time to consume fuel. c. Engine speed.

TOP 02-2-603A 10 May 2012
27
d. Alternator drive ratio. e. Fuel type. f. Fuel temperature. g. Ancillary electrical current draw and corresponding voltage. h. Battery voltage. i. Alternator current. j. Calculated power. k. Air temperature, humidity, wind speed, wind direction, and atmospheric pressure. 5.2 Endurance Operations.
a. Vehicle description, payload, and weight. b. Trailed vehicle description, payload, and weight, if applicable. c. Test area/course. d. Course condition. e. Fuel type. f. Fuel consumed per test area/course or condition. g. Distance traveled per test area. h. Average road speed and/or operating time for each test condition. 5.3 Usable Fuel Capacity.
a. Measured fuel capacity.
b. Refueling rate, if required. 5.4 Hybrid Electric Vehicle Test.
a. Vehicle configuration to include test weight.
b. Test course and vehicle direction of travel.

TOP 02-2-603A 10 May 2012
28
c. Distance traveled. d. Elapsed time. e. Target road speed. f. True road speed. g. Engine speed. h. Throttle position. i. PPU current and voltage. j. Traction motor(s) current and voltage. k. Auxiliary power converter current and voltage. l. Power consumed by electrically driven accessory loads. m. Fuel consumption rate. n. Fuel temperature. o. Initial/final battery SOC. p. Cumulative PPU energy. q. Cumulative battery energy. r. Power electronic component temperatures. s. Vehicle absolute position. t. Total fuel consumption. u. Traction battery power. v. Traction battery capacity. w. Traction motor speed. x. Generator power. y. Engine torque.

TOP 02-2-603A 10 May 2012
29
z. Bus voltage. 5.5 Roadway Simulator Test.
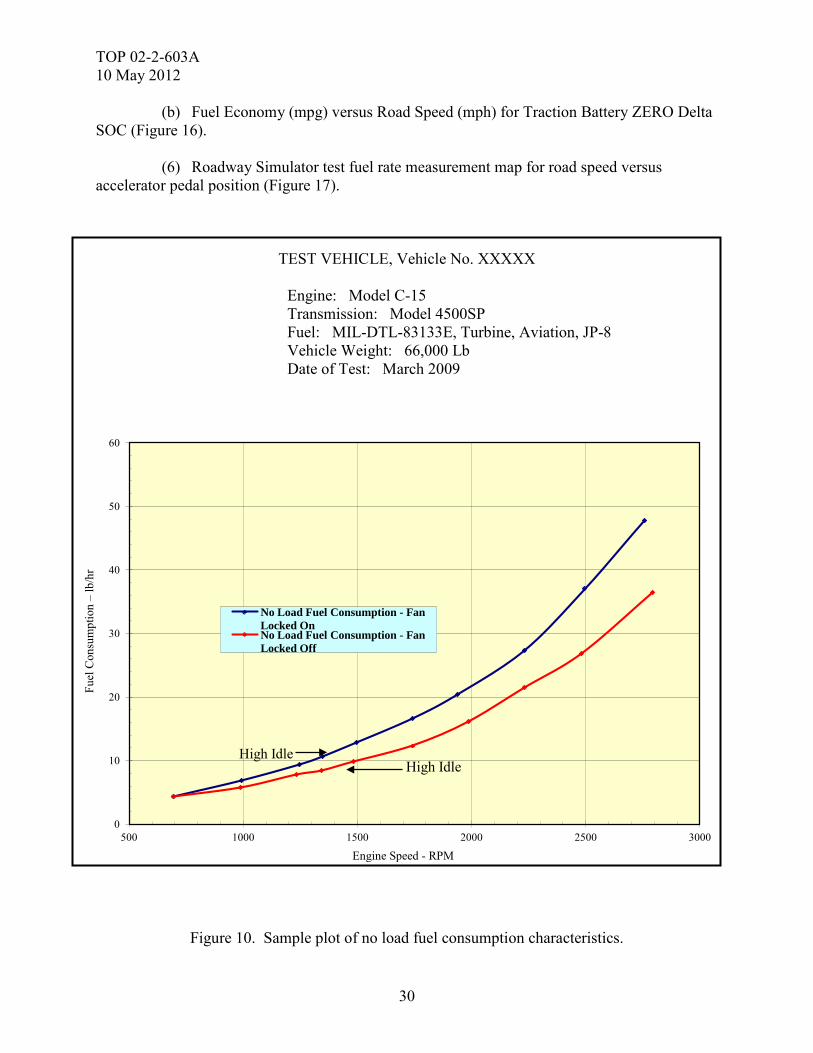
a. Fuel flow rate. b. Fuel temperature for calculation of fuel density. c. Resistance force = roadway restraint loadcells. d. Road speed = roadway belt speed. e. Throttle position from vehicle bus (% throttle). f. Engine speed. 6. PRESENTATION OF DATA. 6.1 Performance Tests. a. Graphic Format. (1) When fuel consumption is measured by weight; no-load, road load, and full load characteristics are presented in kilograms per hour (lb/hr) versus engine speed (Figure 10). (2) When fuel consumption is measured by volume; road load and full load characteristics are presented in liters per 100 kilometers (mpg) versus road speed in kilometers per hour (mph) (Figures 11 and 12). (3) Fuel consumption characteristics measured during operations on any of the standard fuel courses are presented in liters per 100 kilometers (mpg and/or ton/miles per gallon) versus road speed in kilometers per hour (mph) (Figure 13). (4) On board electrical power test characteristics measured during vehicle no load operation can be presented as follows: (a) Alternator power versus battery voltage at selected engine speeds (Figure 14). (b) Alternator power versus fuel consumption characteristics at selected engine speeds. (5) Hybrid Electric Vehicle Test: (a) Traction Battery ZERO Delta SOC versus fuel economy (mpg) at selected vehicle road speeds (Figure 15).
TOP 02-2-603A 10 May 2012
30
0
10
20
30
40
50
60
500 1000 1500 2000 2500 3000
No Load Fuel Consumption - Fan Locked On No Load Fuel Consumption - Fan Locked Off
High Idle High Idle
(b) Fuel Economy (mpg) versus Road Speed (mph) for Traction Battery ZERO Delta SOC (Figure 16). (6) Roadway Simulator test fuel rate measurement map for road speed versus accelerator pedal position (Figure 17).
TEST VEHICLE, Vehicle No. XXXXX
Engine: Model C-15 Transmission: Model 4500SP Fuel: MIL-DTL-83133E, Turbine, Aviation, JP-8 Vehicle Weight: 66,000 Lb Date of Test: March 2009
Figure 10. Sample plot of no load fuel consumption characteristics.
Engine Speed - RPM
Fuel
Con
sum
ptio
n –
lb/h
r

TOP 02-2-603A 10 May 2012
31
0
50
100
150
200
250
300
0 10 20 30 40 50 60 70 80 90 100
First Gear - Converter
Second Gear - Converter Second Gear - Lockup
Third Gear - Converter Third Gear - Lockup
TEST VEHICLE, Vehicle No. XXXXX
Engine: Model C-15 Transmission: Model 4500SP Fuel: MIL-DTL-83133E, Turbine, Aviation, JP-8 Vehicle Weight: 66,000 Lb Date of Test: March 2009
Figure 11. Sample plot of road load fuel consumption characteristics.
Fuel
Con
sum
ptio
n –
L/10
0km
Road Speed – km/hr

TOP 02-2-603A 10 May 2012
32
0
1
2
3
4
5
6
7
8
0 10 20 30 40 50 60
First Gear - Converter Second Gear - Converter Second Gear - Lockup
Third Gear - Converter Third Gear - Lockup
Fourth Gear - Lockup
TEST VEHICLE, Vehicle No. XXXXX
Engine: Model C-15 Transmission: Model 4500SP Fuel: MIL-DTL-83133E, Turbine, Aviation, JP-8 Vehicle Weight: 66,000 Lb Date of Test: March 2009
Figure 12. Sample plot of road load fuel consumption characteristics.
Fuel
Con
sum
ptio
n –
mpg
Road Speed – mph

TOP 02-2-603A 10 May 2012
33
0.00
0.50
1.00
1.50
2.00
2.50
3.00
3.50
0 5 10 15 20 25 30
GVW - Clockwise Test Direction GVW - Counter-clockwise Test Direction GCW - Clockwise Test Direction
TEST VEHICLE, Vehicle No. XXXXX
Engine: Model C-15 Transmission: Model 4500SP Fuel: MIL-DTL-83133E, Turbine, Aviation, JP-8 Vehicle Weight: 66,000 Lb Date of Test: March 2009
Figure 13. Sample plot of standard fuel course fuel consumption characteristics.
Fuel
Con
sum
ptio
n R
ate–
mpg
Road Speed – mph

TOP 02-2-603A 10 May 2012
34
TEST VEHICLE, Vehicle XXX
Engine: Model A Alternator: Model B, X-amp Fuel: MIL-DTL-83133E, Turbine, Aviation, JP-8 Vehicle Weight: 66,000 Lb Date of Test: March 2009
Figure 14. Sample plot of alternator power versus battery voltage at selected vehicle engine speeds.
0 1000 2000 3000 4000 5000 6000 7000 8000 9000
10000 11000 12000 13000 14000 15000 16000 17000 18000
23.0 23.5 24.0 24.5 25.0 25.5 26.0 26.5 27.0 27.5 28.0 28.5 29.0 29.5 30.0
Alte
rnat
or P
ower
(wat
ts)
Battery Voltage (VDC)
825 rpm (idle) 1000 rpm
1500 rpm

TOP 02-2-603A 10 May 2012
35
TEST VEHICLE, Vehicle XXX Engine: Model A Hybrid Configuration: Series, Electric Fuel: MIL-DTL-83133E, Turbine, Aviation, JP-8 Vehicle Weight: 10,000 Lb Date of Test: April 2009
Figure 15. Sample plot of traction battery ZERO delta SOC versus fuel economy (mpg) at selected vehicle road speeds.
MPG = -0.1768(DSOC05) + 7.5 MPG = -0.4076(DSOC10) + 10.9 MPG = -0.5207(DSOC15) + 12.5 MPG = -0.5955(DSOC20) + 13.4 MPG = -0.8507(DSOC25) + 14.2 MPG = -0.2677(DSOC30) + 11.9
0.0
2.0
4.0
6.0
8.0
10.0
12.0
14.0
16.0
18.0
20.0
-25 -20 -15 -10 -5 0 5 10 15 20 25
Fuel
Eco
nom
y (m
pg)
Traction Battery ΔSOC (percent)
5
10
15
20
25
30
Linear (5)
Linear (10) Linear (15) Linear (20) Linear (25) Linear (30)

TOP 02-2-603A 10 May 2012
36
TEST VEHICLE, Vehicle XXX
Engine: Model A Hybrid Configuration: Series, Electric Fuel: MIL-DTL-83133E, Turbine, Aviation, JP-8 Vehicle Weight: 10,000 Lb Date of Test: April 2009
Figure 16. Sample plot of fuel economy (mpg) versus road speed (mph) for traction battery ZERO delta SOC.
0
4
8
12
16
20
0.0 5.0 10.0 15.0 20.0 25.0 30.0 35.0
Fuel
Eco
nom
y (m
pg)
Road Speed (mph)

TOP 02-2-603A 10 May 2012
37
TEST VEHICLE, Vehicle No. XXXXX
Engine: Model 6.5L Turbo Diesel Transmission: 4L80E Fuel: MIL-DTL-83133E, Turbine, Aviation, JP-8 Vehicle Weight: 15,000 Lb Date of Test: March 2009
Figure 17. Representative fuel rate (g/s) measurement for a Light Tactical Vehicle in 1st gear. NOTE 2: Operating points above upshift curve were measured by setting PRND21 to 1st gear. b. Tabular Format. (1) No-load fuel consumption rates (kg/hr, lb/hr, and/or gal/hr) versus engine speed.
0 5 10 15 20 250
10
20
30
40
50
60
70
80
90
100
Road Speed (mph)
Thro
ttle
Pos
itio
n (%
)
0.1 0.1
0.25
0.250.250.5
0.5 0.511 1 1
2 2 2 2
3 33
3
4
4
44
4
5
5
5
55
6
6
6
6
6
6.5
6.56.5
6.5
6.5 7
7
7
7
7.5
7.5
7.5
7.5
8
8
8
8.5
8.5
8.5
9
9
9
9.5
9.5
10
10
10.5
10.5
11 11

TOP 02-2-603A 10 May 2012
38
(2) Road load and full load fuel consumption rates for each road and engine speed combination tested for specific gear ranges. When required, the calculated cruising range based on the measured useable fuel capacity will be presented. (3) Fuel consumption rates versus road speed measured during operations on various standard courses. Again, when required, present the vehicle cruising range for each speed tested. (4) For engineer type vehicles, the total fuel consumed and time required are presented for each work function performed. (5) For on-board electrical power testing, the fuel consumption rates (kg/hr, lb/hr, and/or gal/hr), battery voltage, alternator current, and resultant alternator output power are presented for each engine speed and electrical load (current draw) condition tested. 6.2 Endurance Operations. a. For each vehicle test condition (payload, towed load, etc), the fuel consumed and the distance traveled, and time elapsed during the measured fuel consumption are presented in tabular format for each test course/area negotiated. b. The data recorded should be reduced to L/100 km (mpg) or liters/hour (gal/hr) and used as required to compute operating range or service fuel consumption. c. When a cruising range for OMS/MP operations is specified, the mileage driven and fuel consumed by the vehicle/vehicle combination under test are presented versus each course traversed. These data are then used to compute the total fuel consumed to operate the required distance, which can then be compared to the useable fuel capacity. 6.3 Usable Fuel Capacity. Vehicle useable fuel capacity and refueling rate are presented as liters (gal) and liters (gal) per minute, respectively. 6.4 Hybrid Electric Vehicle. a. In graphical format, fuel consumption characteristics measured during operations on each of the designated test courses are presented in L/100 km (mpg) versus road speed in km/hr (mph). b. In tabular format: (1) For each test run at each road speed the total fuel consumed, battery voltage, current, power, energy expended and capacity, and SOC at the start and end of the run are presented.

TOP 02-2-603A 10 May 2012
39
(2) For each test course, the fuel consumption rates (mpg, gal/hr, and lb/hr) are shown for each road speed/engine speed combination tested. 6.5 Fuel Consumption Computations. 6.5.1 Operating Range. A vehicle’s fuel consumption operating range requirement is generally specified as either a “cruising range” distance or “battlefield day” time. To determine operating range, apply fuel consumption rates measured for the various courses and speeds during either the performance tests or endurance operations to a specified combination of operating conditions (speed, terrain, operating time, distance, etc.) and compute range based on the vehicle’s useable fuel capacity. When operating conditions are not specified, the schedules in Appendix A are recommended for comparison purposes. Computations are made using the following equation:
Operating range, km (miles) or hours = 𝑇
𝐶1𝐹1+𝐶2𝐹2+⋯⋯⋯⋯⋯𝐶𝑛𝐹𝑛
where: T = useable fuel capacity in liters (gal) C = fraction of specified operating condition F = fuel consumption rate for the associated operation condition in liters/100 km or liters/hr (gal/mile or gal/hr) 6.5.2 Service Fuel Consumption. To determine the average vehicle fuel consumption rate during typical endurance operations, apply the measured fuel consumption rates to a specified combination of operating conditions (OMS/MP, Appendix A, etc.). Computations of fuel consumption rate (FCR) are made using the following equation:
FCR, km (miles) or hours per liter (gal) = 1
𝐶1𝐹1+𝐶2𝐹2+⋯⋯⋯⋯𝐶𝑛𝐹𝑛
where: C and F are as defined in paragraph 6.5.1.

TOP 02-2-603A 10 May 2012
(This page is intentionally blank.)

TOP 02-2-603A 10 May 2012
A-1
APPENDIX A. RECOMMENDED OPERATING SCHEDULES.
Recommended operating schedules for typical vehicle missions are provided in Tables A-1 through A-4 so that comparisons can be made between similar vehicles when specific requirements are not stated. Conditions indicated are for guidance and should be altered to suit test requirements at the discretion of the test sponsor and/or test director. a. Tactical Support - role normally filled by wheeled vehicles with a high degree of off-road capability.
TABLE A-1. TACTICAL SUPPORT SCHEDULE
b. Logistical Support - a mission characterized by long-haul operations on identifiable roads, either paved or secondary.
TABLE A-2. LOGISTICAL SUPPORT SCHEDULE
Cruising Rangeand Service Battlefield Day
Fuel Consumption (% of Test Time)(% of Test Distance)
km/hr mphEngine idling . . . . . . . . . . . . . . 0 10Paved road 48 to 56 30 to 35 30 30Secondary road 24 to 32 15 to 20 30 30Cross-country 8 to 16 5 to 10 40 30
Operating Condition
Cruising Rangeand Service Battlefield Day
Fuel Consumption (% of Test Time)(% of Test Distance)
km/hr mphEngine idling . . . . . . . . . . . . . . 0 10Paved road 48 to 56 30 to 35 75 50Secondary road 24 to 32 15 to 20 20 30Cross-country 8 to 16 5 to 10 5 10
Operating Condition

TOP 02-2-603A 10 May 2012
A-2
APPENDIX A. RECOMMENDED OPERATING SCHEDULES. c. Combat - characteristically, armored and armed tracked vehicles engaged in actual combat duty.
TABLE A-3. COMBAT SCHEDULE
d. Combat Support - characteristically, tracked vehicles supporting combat by hauling supplies within the combat zone; self-propelled artillery in the combat support role is included.
TABLE A-4. COMBAT SUPPORT SCHEDULE
Cruising Rangeand Service Battlefield Day
Fuel Consumption (% of Test Time)(% of Test Distance)
km/hr mphEngine idling . . . . . . . . . . . . . . 0 40Paved road 32 to 40 20 to 25 18 0Secondary road 16 to 24 10 to 15 18 20Cross-country 3 to 13 2 to 8 64 40
Operating Condition
Cruising Rangeand Service Battlefield Day
Fuel Consumption (% of Test Time)(% of Test Distance)
km/hr mphEngine idling . . . . . . . . . . . . . . 0 5Paved road 32 to 40 20 to 25 23 0Secondary road 16 to 24 10 to 15 23 85Cross-country 3 to 13 2 to 8 54 10
Operating Condition

TOP 02-2-603A 10 May 2012
B-1
APPENDIX B. BURETTE FUEL CONSUMPTION TEST METHOD.
B.1 Instrumentation. a. Disconnect fuel line to vehicle fuel pump and return line. b. Connect burette fuel measurement system as indicated in Figure B-1.
Figure B-1. Diagram of set-up for burette fuel consumption test method.
B.2 Operation Procedure. a. Set the 3-way valve (V1) so fuel is supplied to engine from vehicle fuel tank. b. Set the 3-way valve (V2) so return line fuel is sent to vehicle fuel tank. c. Operate auxiliary fuel pump until burette is full. d. Operate vehicle at required road and engine speeds.

TOP 02-2-603A 10 May 2012
B-2
APPENDIX B. BURETTE FUEL CONSUMPTION TEST METHOD. e. Turn V1 and V2 simultaneously so that the burette both supplies fuel to the engine and receives return fuel from the engine. f. Perform test run, measuring time required for vehicle to consume designated volume of fuel. g. At the end of the run, turn V1 and V2 simultaneously so engine is once again supplied by and fuel is returned to the tank. Record data. h. Repeat steps a through g for each test run.

TOP 02-2-603A 10 May 2012
C-1
APPENDIX C. COMPACT ELECTRICAL LOAD BANK CAPABILITIES (ON-THE-MOVE).
C.1 Mosebach Model, No. SPB35/35SPH. Load Bank Resistive, 35-kW Capacity, 480/240/208-VAC, 3-Phase and 240/208/120-VAC 1-Phase voltage ranges, 218.75 amps max load, 4 load steps per range, 120-VAC blower and control power supplied externally, controls and meters front panel mounted. Dimensions: Length 23 inches Weight: To be determined (TBD)
Width 22.25 inches w/o connectors, 24 inches with connectors Height 20 inches
C.2 Mosebach, Model No. PB2828DC. Load Bank Resistive, 28-kW Capacity, 0 to 28-VDC voltage range, 1000-amps maximum load in 5-amp increments, 10 load steps, 120-VAC blower and control power supplied externally, controls and meters front panel mounted. Dimensions: Length 28.5 inches Weight: 148 lbs
Width 23 inches Height 20.25 inches
C.3 Mosebach, Model No. RR38.5/28.875. Load Bank, Resistive/Reactive, 38.5-kW/28.875-KVAR capacity, 208-VAC/3-phase voltage range, 133.5-amps max load, 5 resistive and 5 reactive load steps, 120-VAC blower and control power supplied externally, controls and meters front panel mounted. Dimensions: Length 24.5 inches Weight: TBD
Width 48.5 inches w/o connectors, 50 inches with connector Height 23.25 inches w/o lifting eyes, 25.75 inches with lifting eyes
C.4 Cannon, Model No. L-24-350. Load Bank Resistive, 28-VDC, 350-amps continuous load, 1500-amps decreasing load, 100amp & 200amp fixed load steps, 0-100amp adjustable load step, plug test pins for connecting test leads, 0-50VDC meter and 0-400ammeter on front panel, comes with carrying case. Dimensions: Length 22 inches Weight: 40 lbs
Width 8 inches Height 11 inches
TOP 02-2-603A 10 May 2012
C-2
APPENDIX C. COMPACT ELECTRICAL LOAD BANK CAPABILITIES (ON-THE-MOVE).
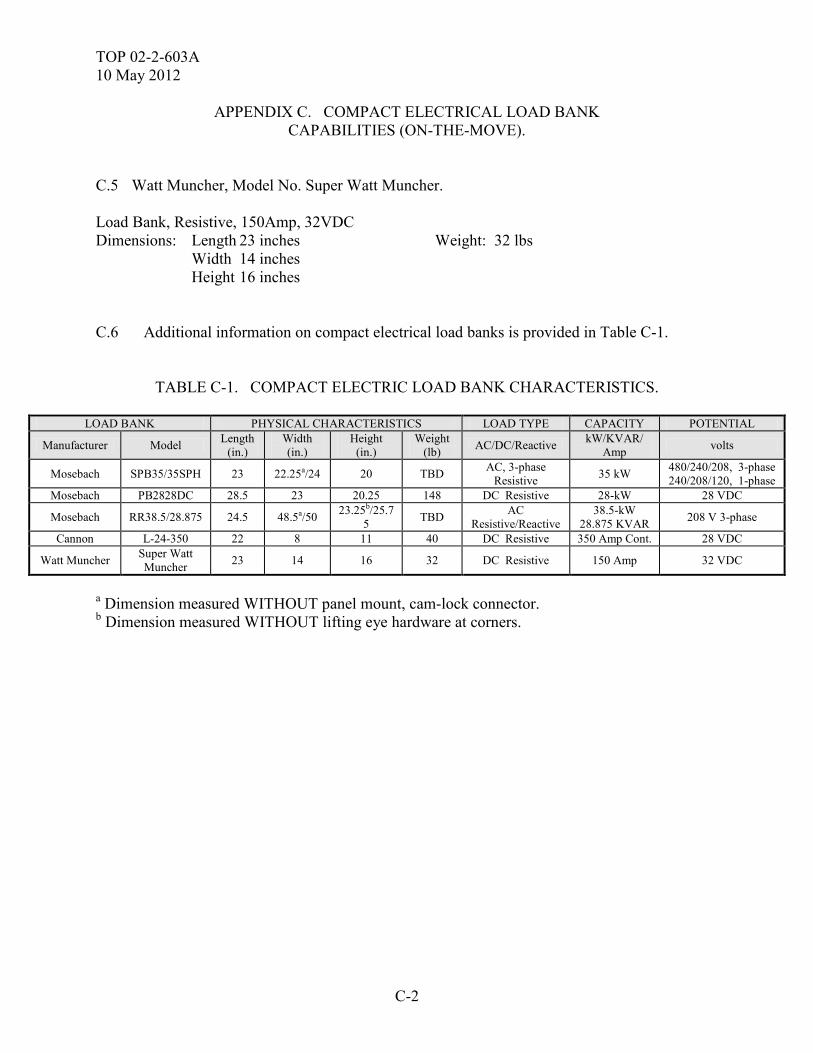
C.5 Watt Muncher, Model No. Super Watt Muncher. Load Bank, Resistive, 150Amp, 32VDC Dimensions: Length 23 inches Weight: 32 lbs
Width 14 inches Height 16 inches
C.6 Additional information on compact electrical load banks is provided in Table C-1.
TABLE C-1. COMPACT ELECTRIC LOAD BANK CHARACTERISTICS.
LOAD BANK PHYSICAL CHARACTERISTICS LOAD TYPE CAPACITY POTENTIAL
Manufacturer Model Length (in.)
Width (in.)
Height (in.)
Weight (lb) AC/DC/Reactive kW/KVAR/
Amp volts
Mosebach SPB35/35SPH 23 22.25a/24 20 TBD AC, 3-phase Resistive 35 kW 480/240/208, 3-phase
240/208/120, 1-phase Mosebach PB2828DC 28.5 23 20.25 148 DC Resistive 28-kW 28 VDC
Mosebach RR38.5/28.875 24.5 48.5a/50 23.25b/25.75 TBD AC
Resistive/Reactive 38.5-kW
28.875 KVAR 208 V 3-phase
Cannon L-24-350 22 8 11 40 DC Resistive 350 Amp Cont. 28 VDC
Watt Muncher Super Watt Muncher 23 14 16 32 DC Resistive 150 Amp 32 VDC
a Dimension measured WITHOUT panel mount, cam-lock connector. b Dimension measured WITHOUT lifting eye hardware at corners.
TOP 02-2-603A 10 May 2012
D-1
APPENDIX D. HYPOTHESIS TESTING FOR SMALL SAMPLE SIZE.
D.1 Very often in fuel consumption testing, customers are seeking an improvement in the amount of fuel consumed by a vehicle system. Fuel use and resupply provisions are vital to all military combat operations, and any significant reduction in the amount of fuel required to sustain the force becomes a large tactical advantage for commanders. Developers have been seeking methods that offer even small gains in fuel economy. The challenge to the tester and evaluator is to determine if these small advances are relevant or merely normally expected test variation in the acquired fuel consumption parameters. D.2 Hypothesis testing is a useful method to compare two sets of test data to determine if there is a statistically significant difference between the two sets. Often the two sets of data are made up of small sample sizes (5 test trials are very typical for sets of fuel consumption data, based on historical tests). Therefore, for purposes of this discussion, we will consider only hypothesis tests for the differences between two sample means for small (the number of samples is less than 30) sample sizes. D.3 Because we deal with small sample sizes, we cannot assume that the test statistic for fuel consumption will be a normally distributed random variable, and we must use the Student’s t-distribution instead of the normal distribution. In many respects, the Student’s t-distribution is similar to the normal distribution, in that the distribution is bell shaped, but is much more appropriate for small sample sizes. We must assume that the population of fuel consumption data we are sampling from has an approximately normal probability distribution, and that the samples are selected independently (in other words, we acquire the data without changing the way we conduct the tests). D.4 Hypothesis testing relies on establishment of a sample mean and standard deviation from the acquired fuel consumption data, and relies on the evaluator to provide an expected level of confidence in the results. Typically, the level of confidence is established at 95 or 99 percent, which means that once the hypothesis test is conducted and the statistics are calculated, we are 95 or 99 percent confident that our statistical test provides a correct decision. D.5 For purposes of explanation, consider the following fuel consumption test data. A materiel developer wants to apply a fuel additive to the fuel system of a 5-ton truck and would like to know if the additive provides a statistically significant increase in fuel economy. The first set of five fuel consumption tests were run with the standard fuel mixture, and the second set were run in the same way with the fuel additive. Test results are as follows:
Without additive (in pounds per hour): 39.6, 41.1, 38.4, 39.7, 40.5.
With additive (in pounds per hour): 38.3, 40.6, 39.1, 38.8, 40.0.
TOP 02-2-603A 10 May 2012
D-2
APPENDIX D. HYPOTHESIS TESTING FOR SMALL SAMPLE SIZE.
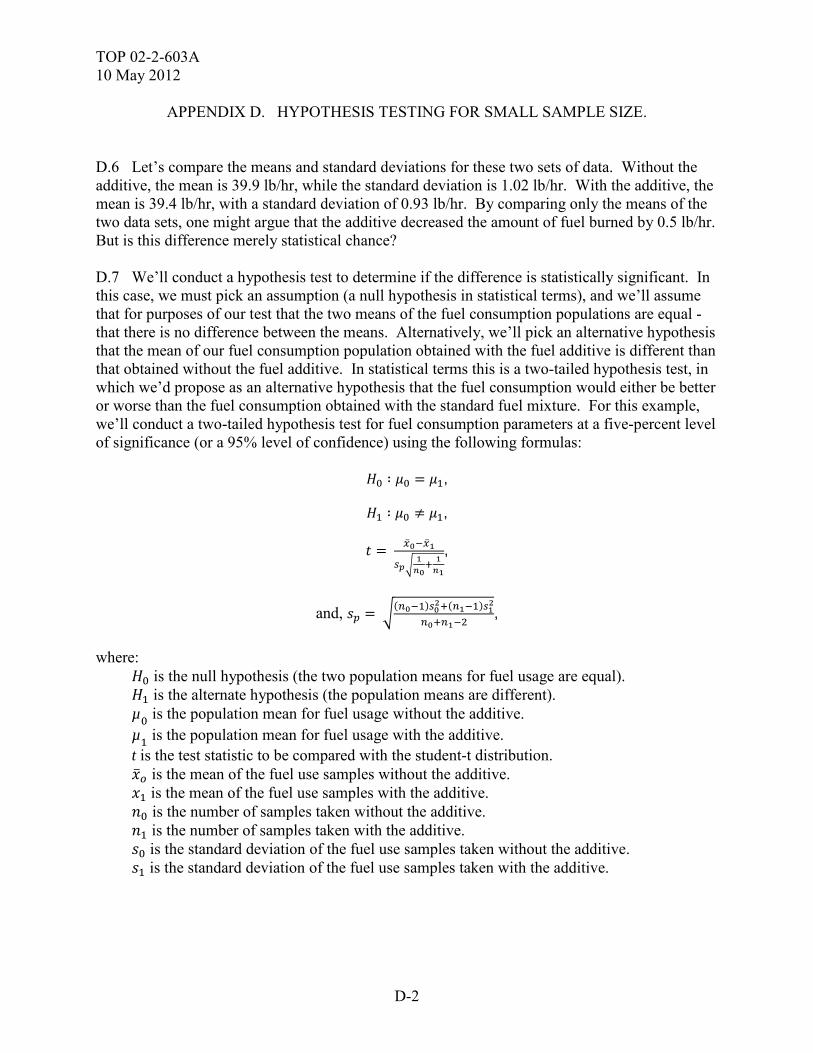
D.6 Let’s compare the means and standard deviations for these two sets of data. Without the additive, the mean is 39.9 lb/hr, while the standard deviation is 1.02 lb/hr. With the additive, the mean is 39.4 lb/hr, with a standard deviation of 0.93 lb/hr. By comparing only the means of the two data sets, one might argue that the additive decreased the amount of fuel burned by 0.5 lb/hr. But is this difference merely statistical chance? D.7 We’ll conduct a hypothesis test to determine if the difference is statistically significant. In this case, we must pick an assumption (a null hypothesis in statistical terms), and we’ll assume that for purposes of our test that the two means of the fuel consumption populations are equal - that there is no difference between the means. Alternatively, we’ll pick an alternative hypothesis that the mean of our fuel consumption population obtained with the fuel additive is different than that obtained without the fuel additive. In statistical terms this is a two-tailed hypothesis test, in which we’d propose as an alternative hypothesis that the fuel consumption would either be better or worse than the fuel consumption obtained with the standard fuel mixture. For this example, we’ll conduct a two-tailed hypothesis test for fuel consumption parameters at a five-percent level of significance (or a 95% level of confidence) using the following formulas:
𝐻0 ∶ 𝜇0 = 𝜇1,
𝐻1 ∶ 𝜇0 ≠ 𝜇1,
𝑡 = �̅�0−�̅�1
𝑠𝑝�1𝑛0+ 1𝑛1
,
and, 𝑠𝑝 = �(𝑛0−1)𝑠02+(𝑛1−1)𝑠12
𝑛0+𝑛1−2,
where: 𝐻0 is the null hypothesis (the two population means for fuel usage are equal). 𝐻1 is the alternate hypothesis (the population means are different). µ0 is the population mean for fuel usage without the additive. µ1 is the population mean for fuel usage with the additive. t is the test statistic to be compared with the student-t distribution. �̅�𝑜 is the mean of the fuel use samples without the additive. 𝑥1 is the mean of the fuel use samples with the additive. 𝑛0 is the number of samples taken without the additive. 𝑛1 is the number of samples taken with the additive. 𝑠0 is the standard deviation of the fuel use samples taken without the additive. 𝑠1 is the standard deviation of the fuel use samples taken with the additive.

TOP 02-2-603A 10 May 2012
D-3
APPENDIX D. HYPOTHESIS TESTING FOR SMALL SAMPLE SIZE.
D.8 Using the fuel consumption values, means and standard deviations listed above, we substitute into the equations to calculate the t-statistic.
𝑠𝑝 = �(5−1)(1.02)2+(5−1)(0.93)2
5+5−2 = 0.976
𝑡 = 39.9−39.4
0.976�15+15
= 0.81
D.9 The test statistic, t, for this test scenario is then compared to the Student’s t-distribution statistic at a one-percent level of significance (α = 0.010) using 𝑛0 + 𝑛1 − 2 degrees of freedom. Student’s t-distribution tables are available in statistical textbooks as charts listed by degrees of freedom and levels of significance. A 1-percent level of significance means we have a 1-percent chance of rejecting a null hypothesis when we should accept it. For the test scenario (five trials without the additive (𝑛0 = 5) and five trials with the additive (𝑛1 = 5)), there would be 8 degrees of freedom. Since we’re conducting a two-tailed hypothesis test, we divide our level of significance in half for each tail of the distribution, so our rejection region for the null hypothesis would be for values of t less than – 𝑡𝛼/2, and greater than 𝑡𝛼/2. By consulting a table of the Student’s t-distribution, the Student’s t-statistic for rejection of the null hypothesis (that the two sample means are equal) is established at 𝑡𝛼/2= 3.355. The null hypothesis would be rejected (the fuel usage with the additive was significantly different than the baseline condition) only if t is greater than 3.355 or less than -3.355. In our case, t was 0.81, so we cannot reject the null hypothesis that the fuel consumption with and without the additive is any different. We would then state that we cannot say that the additive had a statistically significant effect on the fuel consumption. D.10 In general, the ability to reject the null hypothesis and determine that two populations are statistically different is aided by increasing the sample size and decreasing the variability of the test statistic. Tests should be designed (if funding is available) with large numbers of samples, and variability in test methods should be minimized. D.11 For example, what if we were able to secure funding to do two more test runs with and without the additive, and we only tested the vehicle with the same driver for each test to reduce possible differences in driving through the test course. Maybe our data might look like this:
Without additive (in pounds per hour): 40.0, 40.1, 39.8, 39.7, 40.1, 39.8, 39.6.
With additive (in pounds per hour): 39.2, 39.2, 39.1, 39.2, 40.0, 39.5, 39.5.

TOP 02-2-603A 10 May 2012
D-4
APPENDIX D. HYPOTHESIS TESTING FOR SMALL SAMPLE SIZE. D.12 Let’s compare the means and standard deviations for these two sets of data. Without the additive, the mean is 39.9 lb/hr while the standard deviation is 0.20 lb/hr. With the additive, the mean is 39.5 lb/hr, with a standard deviation of 0.31 lb/hr. By comparing only the means, we would again think that the additive decreased the amount of fuel burned by 0.5 pph. We should also note that our standard deviations are now smaller. Let’s consider our hypothesis test and accompanying statistics. D.13 Using the fuel consumption values, means and standard deviations listed above, we substitute into the equations to calculate the t-statistic.
𝑠𝑝 = �(7−1)(0.2)2+(7−1)(0.31)2
7+7−2 = 0.263
𝑡 = 39.9−39.4
0.263�17+17
= 3.56
D.14 The test statistic, t, for this test scenario is then compared to the Student’s t-distribution statistic at a one-percent level of significance using 𝑛0 + 𝑛1 − 2 degrees of freedom. For the test scenario (seven trials without the additive (𝑛0 = 7) and seven trials with the additive (𝑛1 = 7)), there would be 12 degrees of freedom. Thus, by consulting a table of the Student’s t-distribution, the Student’s t-statistic for rejection of the null hypothesis (that the two sample means are equal) is established at 3.055. The null hypothesis would be rejected (the fuel usage with the additive was significantly less than the baseline condition) only if t is less than -3.055 or greater than 3.055. In our case, t is 3.56, so we can reject the null hypothesis, and accept the alternate hypothesis that the fuel additive decreases fuel consumption. You can see from this example, that increasing the sample size and decreasing variability in the results can make a small difference in means statistically significant.

TOP 02-2-603A 10 May 2012
E-1
APPENDIX E. ABBREVIATIONS.
ac alternating current API American Petroleum Industry ASTM American Society for Testing Materiel ATC US Army Aberdeen Test Center ATEF Automotive Test and Evaluation Facility C Celsius cc cubic centimeters CG center of gravity CTA Churchville Test Area CTIS Central Tire Inflation System dc direct current EESS Electrical Energy Storage System F Fahrenheit FCR fuel consumption rate ft feet ft/rev feet per revolution g gram gph gallons per hour GPS Global Positioning System Hp horse-power kg kilogram km kilometer km/hr kilometers per hour L liter lb pound mpg miles per gallon mph miles per hour mrad milliradian MTA Munson Test Area NATO North Atlantic Treaty Organization NEC Net Energy Change

TOP 02-2-603A 10 May 2012
E-2
APPENDIX E. ABBREVIATIONS.
OGR overall gear ratio OMS/MP operational mode summary/mission profile oz ounce PRND park, reverse, neutral, drive PPU Prime Power Unit PTA Perryman Test Area RCCC Regular Common Carrier Conference RTD resistence-temperature detector RWS Roadway Simulator SAE Society of Automotive Engineers sg specific gravity SOC state of charge SOP Standing Operating Procedure TBD to be determined TMC Truck Maintenance Council TOP Test Operations Procedure TSARC Test Schedule and Review Committee
TOP 02-2-603A 10 May 2012
F-1
APPENDIX F. REFERENCES.
1. SAE J 1264, Joint Regular Common Carrier Conference (RCCC)/SAE Fuel Consumption Test Procedure (Short Term in-Service Vehicle) Type I, 1 October 1986.
2. SAE J 1321, Joint Truck maintenance council (TMC)/SAE Fuel Consumption Test
Procedure - Type II, 1 October 1986.
3. SAE J 1526, Joint TMC/SAE Fuel Consumption In-Service Test Procedure Type III, 1 June 1987.
4. ASTM D1298 - 99(2005) Standard Test Method for Density, Relative Density (Specific Gravity), or API Gravity of Crude Petroleum and Liquid Petroleum Products by Hydrometer Method.
5. TOP 02-2-505, Inspection and Preliminary Operation of Vehicles, 4 February 1987.
6. TOP 02-1-003, Hybrid Electric Vehicles, 8 December 2008.
7. SAE J2180, Tilt Table Procedure for Measuring the Static Rollover Threshold for Heavy Trucks, 1 December 1998.
8. TOP 02-2-800, Center of Gravity, 26 September 2006.
9. TOP 02-2-604, Drawbar Pull, 26 September 2007.
10. SAE J 1082, Fuel Economy Measurement Road Test Procedure, 1 February 2008.
11. SOP 385-5176, Standing Operating Procedure for ATC Automotive Test Courses, 23 February 2011.
12. SAE J 2711, Recommended Practice for Measuring Fuel Economy and Emissions of Hybrid-Electric and Conventional Heavy-Duty Vehicles, 1 September 2002.

TOP 02-2-603A 10 May 2012
-2
(This page is intentionally blank.)

TOP 02-2-603A 10 May 2012
G-1
APPENDIX G. APPROVAL AUTHORITY.
CSTE-TM
MEMORANDUM FOR:
Commanders, All Test Centers Technical Directors, All Test Centers Directors, US Army Evaluation Center US Army Operational Test Command
6 June 2012
SUBJECT: Test Operations Procedure (TOP) 02-2-603A, Vehicle Fuel Consumption, Approved for Publication
1. TOP 02-2-603A, Vehicle Fuel Consumption, has been reviewed by the US Army Test and Evaluation Command (ATEC) Test Centers, the US Army Operational Test Command, and the US Army Evaluation Center. All comments received during the formal coordination period have been adjudicated by the preparing agency. An abstract ofthe document is as follows:
The procedures in this TOP describe the vehicle preparation and test methods used to measure and present the fuel consumption characteristics for wheeled and tracked vehicles. Specific facilities, instrumentation, test controls, and analysis techniques are presented.
2. This document is approved for publication and has been posted to the Reference Library of the ATEC Vision Digital Library System (VDLS). The VDLS website can be accessed at https :/ /vdls.atc.army.mill.
3. Comments, suggestions, or questions on this document should be addressed to US Army Test and Evaluation Command, 2202 Aberdeen Boulevard, ATTN: CSTE-TM, Aberdeen Proving Ground, MD 21005-5001; ore-mailed to [email protected].
Oig~ally signed by
ZVVl E BEL. M I CH A ~~~G~.M~;~;"~;~~~::.~~-Doo, EL. J.1229197289 :::=~·~~~~~CH,.LJ 1229197289
Date: 2012.06.11 17:50:45 ~04'CO'
MICHAEL J. ZWIEBEL Director, Test Management Directorate (G9)

TOP 02-2-603A 10 May 2012
G-2
(This page is intentionally blank.)

TOP 02-2-603A 10 May 2012
Forward comments, recommended changes, or any pertinent data which may be of use in improving this publication to the following address: Range Infrastructure Division (CSTE-TM), US Army Test and Evaluation Command, 2202 Aberdeen Boulevard, Aberdeen Proving Ground, MD 21005-5001. Technical information may be obtained from the preparing activity: Automotive Instrumentation Division, US Army Aberdeen Test Center, Aberdeen Proving Ground, MD 21005-5059. Additional copies can be requested through the following website: http://itops.dtc.army.mil/RequestForDocuments.aspx, or through the Defense Technical Information Center, 8725 John J. Kingman Rd., STE 0944, Fort Belvoir, VA 22060-6218. This document is identified by the accession number (AD No.) printed on the first page.