Embed Size (px)
Citation preview

Report Card Grades on the Physical Activity of Children and YouthComparing 30 Very High Human Development Index Countries
Salomé Aubert, Joel D. Barnes, Nicolas Aguilar-Farias, Greet Cardon, Chen-Kang Chang,Christine Delisle Nyström, Yolanda Demetriou, Lowri Edwards, Arunas Emeljanovas, Aleš Gába,
Wendy Y. Huang, Izzeldin A.E. Ibrahim, Jaak Jürimäe, Peter T. Katzmarzyk, Agata Korcz,Yeon Soo Kim, Eun-Young Lee, Marie Löf, Tom Loney, Shawnda A. Morrison, Jorge Mota,
John J. Reilly, Blanca Roman-Vinas, Natasha Schranz, John Scriven, Jan Seghers,Thomas Skovgaard, Melody Smith, Martyn Standage, Gregor Starc, Gareth Stratton, Tim Takken,Tuija Tammelin, Chiaki Tanaka, David Thivel, Richard Tyler, Alun Williams, Stephen H.S. Wong,
Paweł Zembura, and Mark S. Tremblay
Background: To better understand the childhood physical inactivity crisis, Report Cards on physical activity of children andyouth were prepared concurrently in 30 very high Human Development Index countries. The aim of this article was to present,describe, and compare the findings from these Report Cards. Methods: The Report Cards were developed using a harmonizedprocess for data gathering, assessing, and assigning grades to 10 common physical activity indicators. Descriptive statistics werecalculated after converting letter grades to interval variables, and correlational analyses between the 10 common indicators wereperformed using Spearman’s rank correlation coefficients. Results: A matrix of 300 grades was obtained with substantialvariations within and between countries. Low grades were observed for behavioral indicators, and higher grades were observedfor sources of influence indicators, indicating a disconnect between supports and desired behaviors. Conclusion: This analysissummarizes the level and context of the physical activity of children and youth among very high Human Development Indexcountries, and provides additional evidence that the situation regarding physical activity in children and youth is very concerning.Unless a major shift to a more active lifestyle happens soon, a high rate of noncommunicable diseases can be anticipated whenthis generation of children reaches adulthood.
Keywords: children physical activity, sedentary behavior, international comparison, Global Matrix
Aubert, Barnes, and Tremblay are with Healthy Active Living and Obesity Research Group, CHEO Research Institute, Ottawa, Ontario, Canada. Aguilar-Farias is with theDepartment of Physical Education, Sports and Recreation, Universidad de La Frontera, Temuco, Chile; and UFRO Actívate Research Group, Universidad de La Frontera,Temuco, Chile. Cardon is with the Department of Movement and Sports Sciences, Ghent University, Ghent, Belgium. Chang is with the Department of Sport Performance,National Taiwan University of Sport, Taichung, Taiwan. Delisle Nyström is with the Department of Biosciences and Nutrition, Karolinska Institutet, Huddinge, Sweden.Demetriou is with the Department of Sport and Health Sciences, Technical University of Munich, Munich, Germany. Edwards, Stratton, and Tyler are with Applied SportTechnology Exercise andMedicine Research Centre, Swansea University, Swansea, United Kingdom. Emeljanovas is with Lithuanian Sports University, Kaunas, Lithuania.Gába is with the Faculty of Physical Culture, Palacký University Olomouc, Olomouc, Czech Republic. Huang is with the Department of Sport and Physical Education, HongKong Baptist University, Hong Kong, China. Ibrahim is with Aspetar Orthopedic and Sports Medicine Hospital, Doha, Qatar. Jürimäe is with the Faculty of Medicine,Institute of Sport Sciences and Physiotherapy, University of Tartu, Tartu, Estonia. Katzmarzyk is with Pennington Biomedical Research Center, Baton Rouge, LA, USA.Korcz is with the Department of Didactics of Physical Activity, PoznańUniversity of Physical Education, Poznań, Poland. Kim is with the Department of Physical Education,Seoul National University, Seoul, South Korea; and the Seoul National University Institute of Sports Science, Seoul, Republic of Korea. Lee is with the School of Kinesiologyand Health Studies, Queen’s University, Kingston, Ontario, Canada. Löf is with GroupMLÖ, Department of Biosciences and Nutrition, Karolinska Institutet, Solna, Sweden;and the Department of Medicine and Health Sciences, Linköping University, Linköping, Sweden. Loney is with the College of Medicine, Mohammed Bin Rashid Universityof Medicine and Health Sciences, Dubai, United Arab Emirates. Morrison is with the Faculty of Health Sciences, University of Primorska, Izola, Slovenia. Mota is with theCentro de Investigação em Atividade Física Saúde e Lazer (CIAFEL-FADEUP), University of Porto, Porto, Portugal. Reilly is with the Physical Activity for Health Group,University of Strathclyde, Glasgow, Scotland. Roman-Vinas is with Nutrition Research Foundation, Barcelona, Spain; the School of Health and Sport Sciences (EUSES),Universitat de Girona, Salt, Spain; and the CIBER Physiopathology of Obesity and Nutrition (CIBEROBN), Instituto de Salud Carlos III, Madrid, Spain. Schranz is with theAlliance for Research in Exercise, Nutrition and Activity, School of Health Sciences, University of South Australia, Adelaide, South Australia, Australia. Scriven is withJersey Sport Foundation, Jersey, United Kingdom. Seghers is with the Department ofMovement Sciences, KULeuven, Leuven, Belgium. Skovgaard is with the Research andInnovation Centre for HumanMovement and Learning, University of Southern Denmark, Odense, Denmark; and the Research Unit for Active Living, Department of SportsScience and Clinical Biomechanics, University of Southern Denmark, Odense, Denmark. Smith is with the School of Nursing, The University of Auckland, Auckland, NewZealand. Standage is with the Department for Health, Centre for Motivation and Health Behaviour Change, University of Bath, Bath, United Kingdom. Starc is with theFaculty of Sport, University of Ljubljana, Ljubljana, Slovenia. Takken is withWilhelmina Children’s Hospital, UniversityMedical Center Utrecht, Utrecht, The Netherlands.Tammelin is with the LIKES Research Centre for Physical Activity and Health, Jyväskylä, Finland. Tanaka is with the Division of Integrated Sciences, J. F. OberlinUniversity,Machida, Japan. Thivel is with the Laboratory ofMetabolic Adaptations to Exercise Under Physiological and Pathological Conditions (AME2P), Research Centerfor HumanNutrition (CRNHAuvergne), Clermont AuvergneUniversity, Clermont-Ferrand, France.Williams is with Guernsey Education Services, St. Peter Port, Guernsey.Wong is with the Department of Sport and Physical Education, The Chinese University of Hong Kong, Hong Kong, China. Zembura is with Social Challenges Unit, TheRobert B. Zajonc Institute of Social Science, University of Warsaw, Warsaw, Poland. Tremblay ([email protected]) is corresponding author.
S298
Journal of Physical Activity and Health, 2018, 15(Suppl 2), S298-S314https://doi.org/10.1123/jpah.2018-0431© 2018 Human Kinetics, Inc. ORIGINAL RESEARCH
Unauthenticated | Downloaded 01/26/22 11:20 AM UTC

A compelling body of empirical work shows moderate to highlevels of physical activity to be associated with a lower risk ofcardiovascular disease and all-cause mortality among adults.1 Con-versely, physical inactivity has been recognized by some as “thebiggest public health problem of the 21st century.”2,3 Among school-aged children and adolescents, meeting physical activity guidelinesis associated with positive physical, psychological, social, andcognitive health indicators,4,5 while physical inactivity, defined asnot meeting physical activity guidelines, is associated with adversephysical, mental, social, and cognitive health outcomes.4–7
The Human Development Index (HDI) is a composite index,ranging from 0 to 1, calculated using education, life expectancy,and per capita income.8 This index was created by the UnitedNations Development Programme to rank countries on a scale ofhuman development conceptualized in terms of capabilities ofhumans within the countries to function.9 To be classified asvery high HDI, the score of a country must be equal or superiorto 0.80. Among children living in countries categorized as beingvery high by the HDI, moderate- to vigorous-intensity physicalactivity (MVPA) was positively related to markers of cardiovas-cular health10–13 and self-reported health-related quality of life.14
Physical inactivity has been estimated to be responsible for at least10% and 9% of all-cause mortality in North American and inEuropean countries, respectively.15 Furthermore, very high-incomecountries bear the largest proportion of economic burden ofphysical inactivity worldwide (81% of health care costs and60% of indirect costs).16 However, the majority of children17–21
and youth19–25 do not meet the current recommendations of60 minutes of MVPA per day26 in very high HDI European andNorth American countries and regions. Similar findings wereobserved among children and/or adolescents from other veryhigh HDI countries or regions such as Australia,6 Chile,27 ChineseTaipei (Taiwan),28 Hong Kong,29 Japan,30 South Korea,31 Qatar,32
and the United Arab Emirates.32–34 Very high HDI countries sharesimilar characteristics in terms of education, life expectancy, andincome; however, differences also exist geographically, politically,culturally, religiously, and environmentally that may influencephysical activity behavior differently across the very high HDIcountries. Cooper et al35 found that there was substantialbetween-country variation in objectively measured MVPAin the International Children’s Accelerometry Database, evenbetween apparently similar countries, and concluded that furtherresearch is needed to explore environmental and socioculturalexplanations for these differences.
To develop a better understanding of childhood physicalactivity and inactivity across countries, the first Global Matrix(Global Matrix 1.0) of Report Card grades on physical activity waslaunched in 2014.36 Report Cards, based on the Canadian ReportCard model,37 were developed by research teams from 15 countries(including 8 very high HDI countries) using a harmonized processfor data gathering, assessing, and assigning grades.36 For eachparticipating country, grades were assigned to 9 common physicalactivity indicators: Overall Physical Activity, Organized SportParticipation, Active Play, Active Transportation, Sedentary Be-haviors, Family and Peers, School, Community and Environment,and Government Strategies and Investments. Global Matrix 1.0grades provided new information upon which researchers, advo-cates, practitioners, and policy-makers could reflect and deriveinspiration for children’s physical activity research projects andpromotion activities around the world.36
Building on the Global Matrix 1.0, investigators from eachparticipating country committed to repeat and further develop the
Global Matrix initiative along with teams of researchers from 23new countries. The Global Matrix 2.0, which was released in 2016in Bangkok, presented a comprehensive summary of the physicalactivity behaviors and sources of influence indicators from 38countries (including 24 very high HDI countries).38 Findingssuggested the presence of a complex variety of strengths andlimitations across the participating countries, with some universalpatterns emerging when comparing countries by continent, HDI, orincome inequality. For example, a strong positive correlationwas found between the source of influence grades (combiningthe grades from Family and Peers, School, Community andEnvironment, and Government Strategies and Investments)and HDI.38
In 2017, the Active Healthy Kids Global Alliance39 (AHKGA)called for more countries to participate in the Global Matrix 3.0.Forty-nine countries registered and followed the harmonized stepsto develop their country’s Report Card. Out of the 49 participatingcountries, 30 (61%) were very high HDI countries, from 5 differentcontinents: Asia (n = 6), Europe (n = 19), North America (n = 2),Oceania (n = 2), and South America (n = 1). The aim of this articleis to present, describe, and compare the Report Card grades fromthe very high HDI countries and regions participating in the GlobalMatrix 3.0: Australia, Belgium (Flanders), Canada, Chile, Taiwan,Czech Republic, Denmark, England, Estonia, Finland, France,Germany, Guernsey, Hong Kong, Japan, Jersey, Lithuania, TheNetherlands, New Zealand, Poland, Portugal, Qatar, Scotland,Slovenia, South Korea, Spain, Sweden, the United Arab Emirates,the United States, and Wales. Companion papers published in thisissue of the Journal of Physical Activity and Health present thecollective results from the low and medium HDI countries, and thehigh HDI countries.
MethodsThe AHKGA distributed an open call through established networksfor interested countries and opened registration for the GlobalMatrix 3.0 in April 2017. As a result, 49 countries from 5 differentcontinents fully participated in the Global Matrix 3.0. Workgroupsconsisting of experts and stakeholders were established in eachcountry to gather the highest quality and most recently publishedand unpublished evidence. The workgroups critically appraisedthe available evidence and reported on 10 common indicators(Overall Physical Activity, Organized Sport and Physical Activity,Active Play, Active Transportation, Sedentary Behaviors, PhysicalFitness, Family and Peers, School, Community and Environment,and Government) for school-aged children and youth (∼5–17 yold). Through a harmonized and transparent Report Card develop-ment process, each country’s workgroup compiled the availableevidence from local, national, or international studies, nationalsurveys, and official reports, and then synthesized findings andreached consensus for the grading of each indicator. Full details ofthe Report Card development process based on the CanadianReport Card model37 have been previously described and thedetailed methods for the Global Matrix 3.0 are described in acompanion paper published in this issue of the Journal of PhysicalActivity and Health.40
For each of the 49 registered countries, up to 3 joint ReportCard leaders were charged with forming a multidisciplinaryresearch workgroup (including physical activity experts, stake-holder groups, and communication specialists) to manage theReport Card project, and to ensure the effective communicationbetween AHKGA and the Report Card team. The workgroups
JPAH 15 Supplement 2, 2018
Very High HDI Country Physical Activity Grades for Children and Youth S299
Unauthenticated | Downloaded 01/26/22 11:20 AM UTC

identified and finalized the list of indicators to be graded (ie, the 10common indicators and potential additional ones that would beincluded in their national Report Card but not in the Global Matrix3.0), and compiled potentially relevant data sets and documentsthat would be used to inform the grades. Countries were advised toconsider and synthesize the best available evidence from approxi-mately the past 5 years for each indicator. Common benchmarks,presented in Table 1, and a common grading scheme, shown inTable 2, were provided by the AHKGA to the 49 Report Cardworkgroups. Experts in each country evaluated the compiledevidence and reached consensus on the grade assigned for eachindicator. Draft country Report Card grades were submitted alongwith their rationale and were audited by the members of theAHKGA Executive Committee to ensure that the grades wereconsistent with the harmonized benchmarks and grading scheme.The Report Card leaders were also asked to report details
concerning the data sets used to inform their overall physicalactivity grade (ie, subjective or objective measures, representative-ness, instrument used, age range, and sample size).
For analysis purposes, the 49 participating countries andregions were divided into 3 categories using the United Nations’HDI groupings (low or medium, high, and very high). The resultsand analyses presented in this article are on the 30 very high HDIparticipating countries.
Descriptive statistics (average grade and SD) were calculatedafter converting categorical variables (letter grades) to intervalvariables (see corresponding numbers in Table 2), and the incom-plete grades (INC) converted into “No Grade”which was treated asa missing value. Averages were calculated from the interval valuesand the floor (for a given value, the greatest integer less than orequal to the average value) was converted back to a letter grade.Three scores were computed for analysis: (1) overall score,
Table 1 Global Matrix 3.0 Indicators and Benchmarks Used to Guide the Grade Assignment Process
Indicator Benchmark
Overall PhysicalActivity
% of children and youth who meet the Global Recommendations on Physical Activity for Health, which recommend thatchildren and youth accumulate at least 60 minutes of moderate- to vigorous-intensity physical activity per day on average.Or % of children and youth meeting the guidelines on at least 4 days a week (when an average cannot be estimated).
Organized Sport andPhysical Activity
% of children and youth who participate in organized sport and/or physical activity programs.
Active Play % of children and youth who engage in unstructured/unorganized active play at any intensity for more than 2 hours a day. % ofchildren and youth who report being outdoors for more than 2 hours a day.
Active Transportation % of children and youth who use active transportation to get to and from places (eg, school, park, mall, friend’s house).
Sedentary Behaviors % of children and youth who meet the Canadian Sedentary Behaviour Guidelines (5- to 17-year-olds: no more than 2 hours ofrecreational screen time per day). Note: the Guidelines currently provide a time limit recommendation for screen-relatedpursuits, but not for non-screen-related pursuits.
Physical Fitness Average percentile achieved on certain physical fitness indicators based on the normative values published by Tomkinsonet al.41
Family and Peers % of family members (eg, parents, guardians) who facilitate physical activity and sport opportunities for their children(eg, volunteering, coaching, driving, paying for membership fees and equipment). % of parents who meet the GlobalRecommendations on Physical Activity for Health, which recommend that adults accumulate at least 150minutes of moderate-intensity aerobic physical activity throughout the week or do at least 75 minutes of vigorous-intensity aerobic physical activitythroughout the week or an equivalent combination of moderate- and vigorous-intensity physical activity. % of family members(eg, parents, guardians) who are physically active with their kids.% of children and youth with friends and peers who encourage and support them to be physically active.% of children and youth who encourage and support their friends and peers to be physically active.
School % of schools with active school policies (eg, daily PE, daily physical activity, recess, “everyone plays” approach, bike racks atschool, traffic calming on school property, outdoor time).% of schools where the majority (≥ 80%) of students are taught by a PE specialist.% of schools where the majority (≥ 80%) of students are offered the mandated amount of PE (for the given state/territory/region/country). % of schools that offer physical activity opportunities (excluding PE) to the majority (>80%) of their students.% of parents who report their children and youth have access to physical activity opportunities at school in addition to PEclasses. % of schools with students who have regular access to facilities and equipment that support physical activity(eg, gymnasium, outdoor playgrounds, sporting fields, multipurpose space for physical activity, equipment in good condition).
Community andEnvironment
% of children or parents who perceive their community/municipality is doing a good job at promoting physical activity(eg, variety, location, cost, quality). % of communities/municipalities that report they have policies promoting physicalactivity.% of communities/municipalities that report they have infrastructure (eg, sidewalks, trails, paths, bike lanes) specificallygeared toward promoting physical activity.% of children or parents who report having facilities, programs, parks and playgrounds available to them in their community.% of children or parents who report living in a safe neighborhood where they can be physically active.% of children or parents who report having well-maintained facilities, parks and playgrounds in their community that are safeto use.
Government Evidence of leadership and commitment in providing physical activity opportunities for all children and youth. Allocatedfunds and resources for the implementation of physical activity promotion strategies and initiatives for all children and youth.Demonstrated progress through the key stages of public policy making (ie, policy agenda, policy formation, policyimplementation, policy evaluation and decisions about the future).
JPAH 15 Supplement 2, 2018
S300 Aubert et al
Unauthenticated | Downloaded 01/26/22 11:20 AM UTC

(2) behavioral score (Overall Physical Activity, Organized Sportand Physical Activity Participation, Active Play, Active Transpor-tation, and Sedentary Behaviors), and (3) sources of influence score(Family and Peers, School, Community and Environment, andGovernment). Scores for each group of indicators were calculatedby summing the relevant interval data. INC grades were removedand the scores were reweighted accordingly. Categorical variables(letter grades) were grouped into 1 of 4 levels (“A–B,” “C,” “D–F,”and “No Grade”) based on the overall score. These categories werethen used to rank countries by letter grade/score and category levelin scatter plot data visualizations. Correlational analyses betweenthe 10 common indicators were performed using Spearman’s rankcorrelation coefficients. Pairwise deletion was used to treat missingdata (INC) instead of other techniques (eg, listwise deletion) inorder to minimize the number of cases excluded from the analysis.All statistical analyses were performed using R (version 3.4.1; TheR Foundation for Statistical Computing, Vienna, Austria). Severalpackages were loaded to extend base R including corrplot,42
ggplot2,43 UpSetR,44 and VIM.45 In addition, descriptive statisticsof the qualitative information regarding the measurement of overallphysical activity were performed.
ResultsThe sociodemographic characteristics of the 30 very high HDIcountries are presented in Table 3. The HDI scores ranged from0.840 for the United Arab Emirates to 0.985 for Jersey. Chile wasthe country with the lowest gross national income per capita, thehighest Gini index (highest income inequality), and the highestchild poverty rate (0.225). Qatar had the highest gross nationalincome per capita, the lowest relative public health expenditure,and the highest Gender Inequality Index. Slovenia had the lowestGini index (least income inequality) and the lowest percentage ofurban population (49.8%). The life expectancy at birth was above80 years for most of the countries (23 countries, 77%), with amaximum of 84.2 years for Hong Kong. Lithuania had a notablylower life expectancy of 73.5 years compared with other countries.The mean years of schooling ranged from 8.9 years in Portugal to
13.3 years in the United Kingdom nations (England, Scotland, andWales). Finally, population density ranged from 3.2 people/km2 ofland area for Australia, to 6987.2 people/km2 of land area for HongKong. In summary, despite all 30 countries being within the veryhigh HDI category, countries varied substantially in othercharacteristics.
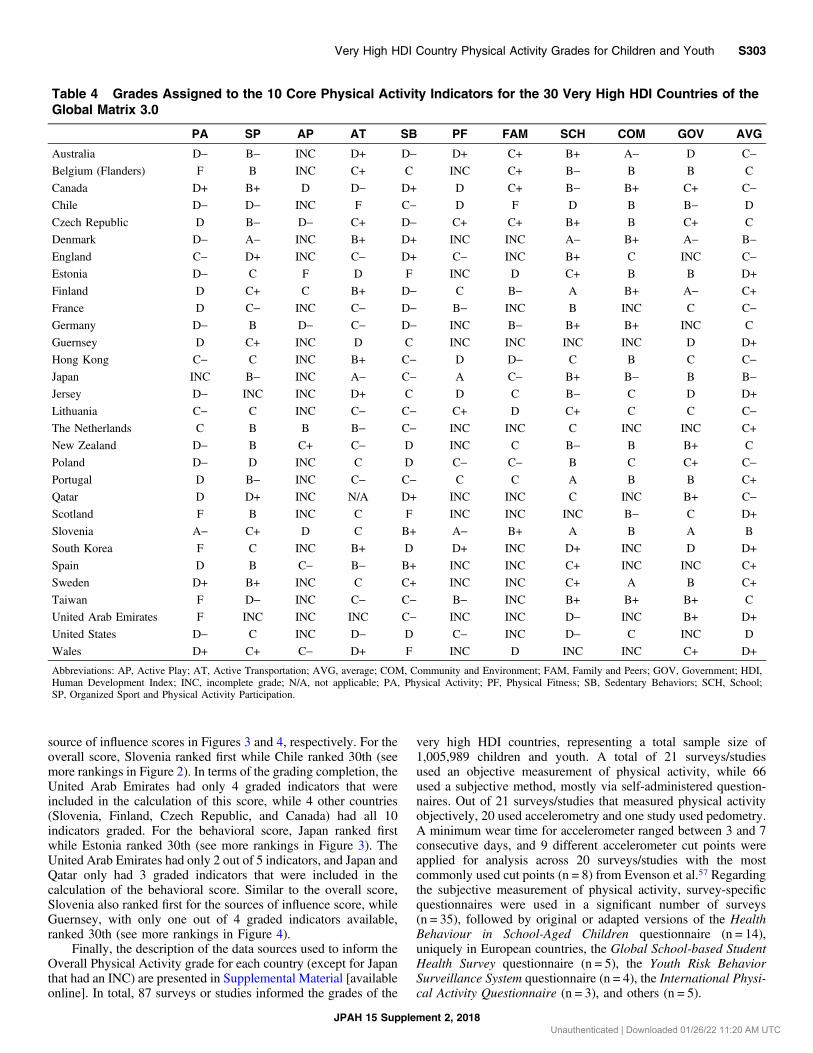
The 30 country grades for the 10 core Report Card indicators(300 grades or INC in total) and the average grades for each countryare shown in Table 4, and the corresponding descriptive informa-tion is presented in Table 5. In total, 233 letter grades and 67 INCgrades were assigned (Table 4). The country with the highestaverage grade was Slovenia with “B,” and the countries with thelowest average grade were Chile and the United States with “D.”All 30 countries assigned a grade to Sedentary Behaviors, 29countries (97%) to Overall Physical Activity, and 28 countries(93%) to Organized Sport and Physical Activity and to ActiveTransportation. Active Play was the indicator with the largestnumber of INC grades (n = 20), followed by Physical Fitness(n = 13), and Family and Peers (n = 13). The indicator with thehighest average grade was Community and Environment with “B−,” while the indicator with the lowest average grade was OverallPhysical Activity with “D−.” An average grade of “D+” wasobtained for the behavioral indicators combined, “C+” for thesource of influence indicators combined, and “C−” was the overallaverage for the 233 grades. Qatar’s Report Card workgroupdecided not to evaluate Active Transportation and considered it“not applicable” because of unsafe road conditions and the hotclimate during most times of the year.56 Correlation analysesshowed that there were no relationships between the OverallPhysical Activity grade and any of the other 9 core indicator grade(results not shown). Frequency plots illustrating the distribution ofthe overall 233 grades as well as the behavioral and the sources ofinfluence indicators are presented in Figures 1A and 1B, respec-tively. A normal distribution of the letter grades is evident in bothFigures 1A and 1B, with the mode being “C” for the 233 lettergrades overall, “D” for the behavioral indicators, and “B” for thesources of influence indicators.
A plot for the overall score for each country estimated from the10 indicators is presented in Figure 2, and the behavioral and the
Table 2 Global Matrix 3.0 Grading Rubric
Grade InterpretationCorresponding number
for analysis
A+ 94%–100% 15
A We are succeeding with a large majority of children and youth (87%–93%) 14
A− 80%–86% 13
B+ 74%–79% 12
B We are succeeding with well over half of children and youth (67%–73%) 11
B− 60%–66% 10
C+ 54%–59% 9
C We are succeeding with about half of children and youth (47%–53%) 8
C− 40%–46% 7
D+ 34%–39% 6
D We are succeeding with less than half but some children and youth (27%–33%) 5
D− 20%–26% 4
F We are succeeding with very few children and youth (<20%) 2
INC Incomplete—insufficient or inadequate information to assign a grade No Grade
JPAH 15 Supplement 2, 2018
Very High HDI Country Physical Activity Grades for Children and Youth S301
Unauthenticated | Downloaded 01/26/22 11:20 AM UTC

Tab
le3
Sociodem
ographic
Inform
ationofthe30
VeryHighHDICountriesin
theGlobal
Matrix3.0
Country
HDIa
GNIper
capitaa
Public
hea
lth
expen
diture
(%ofGDP)a
GIIa
Life
expec
tancy
atbirth
a
Mea
nye
arsof
schoolin
ga
Gini
index
b
Global
foodse
curity
index
c
Child
pove
rty
rate
d
Urban
population
perce
ntagee
Population
den
sity
(peo
ple/km
2)f
Australia
0.939
42,822
6.3
0.12
82.5
13.2
34.7
83.3
0.13
89.4
3
Belgium
0.896
41,243
8.3
0.073
81.0
11.4
27.7
79.8
0.11
97.5
374
Canada
0.92
42,582
7.4
0.098
82.2
13.1
34.0
82.2
0.171
80.8
4
Chile
0.847
21,665
3.9
0.322
82.0
9.9
47.7
74.7
0.225
89.4
24
Czech
Republic
0.878
28,144
6.3
0.129
78.8
12.3
25.9
75.8
0.105
73.4
137
Denmark
0.925
44,519
9.2
0.041
80.4
12.7
28.2
80.3
0.029
87.1
136
England
0.909
37,931
7.6
0.131
80.8
13.3
33.2
84.2
0.112
79.7
271
Estonia
0.865
26,362
5.0
0.131
77.0
12.5
32.7
0.121
69.5
31
Finland
0.895
38,868
7.3
0.056
81.0
11.2
27.1
81.0
0.037
83.8
18
France
0.897
38,085
9.0
0.102
82.4
11.6
32.7
82.3
0.113
86.4
122
Germany
0.926
45,000
8.7
0.066
81.1
13.2
31.7
82.5
0.095
74.1
236
Guernseyf
0.975
82.6
40.0
850
HongKong
0.917
54,265
84.2
11.6
100.0
6987
Japan
0.903
37,268
8.6
0.116
83.7
12.5
32.1
79.5
91.9
348
Jersey
g0.985
81.9
41.0
845
Lith
uania
0.848
26,006
4.4
0.121
73.5
12.7
37.4
0.191
67.2
46
The
Netherlands
0.924
46,326
9.5
0.044
81.7
11.9
29.3
82.8
0.102
83.6
506
New
Zealand
0.915
32,870
9.1
0.158
82.0
12.5
81.0
0.141
86.3
18
Poland
0.855
24,117
4.5
0.137
77.6
11.9
31.8
74.1
0.134
60.8
124
Portugal
0.843
26,104
6.2
0.091
81.2
8.9
35.5
79.0
0.155
61.6
113
Qatar
0.856
129,916
1.9
0.542
78.3
9.8
73.3
98.9
221
Scotland
0.909
37,931
7.6
0.131
80.8
13.3
33.2
84.2
0.112
79.7
271
Slovenia
0.89
28,664
6.6
0.053
80.6
12.1
25.4
49.8
103
South
Korea
0.901
34,541
4.0
0.067
82.1
12.2
31.6
0.071
83.5
526
Spain
0.884
32,779
6.4
0.081
82.8
9.8
36.2
78.1
0.221
77.6
93
Sweden
0.913
46,251
10.0
0.048
82.3
12.3
29.2
81.7
0.091
85.4
24
Taiwan
h0.885
45,582
80.2
33.6
UnitedArabEmirates
0.84
66,203
2.6
0.232
77.1
9.5
70.9
84.7
111
UnitedStates
0.92
53,245
8.3
0.203
79.2
13.2
41.5
84.6
0.199
82.6
35
Wales
0.909
37,931
7.6
0.131
80.8
13.3
33.2
84.2
0.112
79.7
271
Abbreviations:GDP,Gross
Dom
estic
Product;GII,GenderInequalityIndex;
GNI,Gross
NationalIncome;
HDI,Hum
anDevelopmentIndex.
Sources
ofinform
ation:
a UnitedNations
DevelopmentP
rogram
me.8b,fThe
World
Bank.46,47c The
EconomistIntellig
ence
Unit.4
8dOrganisationforEconomicCo-operationandDevelopmentC
hild
(OECD)Well-
Being
DataPortal.4
9e U
nitedNations,D
epartm
ento
fEconomicandSocialA
ffairs.50f For
Guernsey,
theHDIsourcedfrom
theUnitedNations
EconomicandSocialC
ommission
forAsiaandthePacific,51thelife
expectancy
atbirth,populatio
nsize,and
thepopulatio
ndensity
sourcedfrom
theUnitedStatesCentralIntelligenceAgency,52andtheGiniindex
sourcedfrom
theStateof
Guernsey.53gFor
Jersey,the
HDIsourced
from
theUnitedNations
EconomicandSocialC
ommission
forAsiaandthePacific,51andthelifeexpectancy
atbirth,populatio
nsize,and
thepopulatio
ndensity
sourcedfrom
theUnitedStatesCentralIntelligence
Agency,52andtheGiniindexsourcedfrom
theState
ofJersey.54hFor
Taiwan,theHDI,theGNIpercapita,thelifeexpectancy
atbirth,
andtheGiniindexcomefrom
theNationalStatistics,Republic
ofChina
(Taiwan).55For
England,Scotland,andWales,theofficial
data
fortheUnitedKingdom
werereported.
S302 JPAH 15 Supplement 2, 2018Unauthenticated | Downloaded 01/26/22 11:20 AM UTC
source of influence scores in Figures 3 and 4, respectively. For theoverall score, Slovenia ranked first while Chile ranked 30th (seemore rankings in Figure 2). In terms of the grading completion, theUnited Arab Emirates had only 4 graded indicators that wereincluded in the calculation of this score, while 4 other countries(Slovenia, Finland, Czech Republic, and Canada) had all 10indicators graded. For the behavioral score, Japan ranked firstwhile Estonia ranked 30th (see more rankings in Figure 3). TheUnited Arab Emirates had only 2 out of 5 indicators, and Japan andQatar only had 3 graded indicators that were included in thecalculation of the behavioral score. Similar to the overall score,Slovenia also ranked first for the sources of influence score, whileGuernsey, with only one out of 4 graded indicators available,ranked 30th (see more rankings in Figure 4).
Finally, the description of the data sources used to inform theOverall Physical Activity grade for each country (except for Japanthat had an INC) are presented in Supplemental Material [availableonline]. In total, 87 surveys or studies informed the grades of the
very high HDI countries, representing a total sample size of1,005,989 children and youth. A total of 21 surveys/studiesused an objective measurement of physical activity, while 66used a subjective method, mostly via self-administered question-naires. Out of 21 surveys/studies that measured physical activityobjectively, 20 used accelerometry and one study used pedometry.A minimum wear time for accelerometer ranged between 3 and 7consecutive days, and 9 different accelerometer cut points wereapplied for analysis across 20 surveys/studies with the mostcommonly used cut points (n = 8) from Evenson et al.57 Regardingthe subjective measurement of physical activity, survey-specificquestionnaires were used in a significant number of surveys(n = 35), followed by original or adapted versions of the HealthBehaviour in School-Aged Children questionnaire (n = 14),uniquely in European countries, the Global School-based StudentHealth Survey questionnaire (n = 5), the Youth Risk BehaviorSurveillance System questionnaire (n = 4), the International Physi-cal Activity Questionnaire (n = 3), and others (n = 5).
Table 4 Grades Assigned to the 10 Core Physical Activity Indicators for the 30 Very High HDI Countries of theGlobal Matrix 3.0
PA SP AP AT SB PF FAM SCH COM GOV AVG
Australia D− B− INC D+ D− D+ C+ B+ A− D C−
Belgium (Flanders) F B INC C+ C INC C+ B− B B C
Canada D+ B+ D D− D+ D C+ B− B+ C+ C−
Chile D− D− INC F C− D F D B B− D
Czech Republic D B− D− C+ D− C+ C+ B+ B C+ C
Denmark D− A− INC B+ D+ INC INC A− B+ A− B−
England C− D+ INC C− D+ C− INC B+ C INC C−
Estonia D− C F D F INC D C+ B B D+
Finland D C+ C B+ D− C B− A B+ A− C+
France D C− INC C− D− B− INC B INC C C−
Germany D− B D− C− D− INC B− B+ B+ INC C
Guernsey D C+ INC D C INC INC INC INC D D+
Hong Kong C− C INC B+ C− D D− C B C C−
Japan INC B− INC A− C− A C− B+ B− B B−
Jersey D− INC INC D+ C D C B− C D D+
Lithuania C− C INC C− C− C+ D C+ C C C−
The Netherlands C B B B− C− INC INC C INC INC C+
New Zealand D− B C+ C− D INC C B− B B+ C
Poland D− D INC C D C− C− B C C+ C−
Portugal D B− INC C− C− C C A B B C+
Qatar D D+ INC N/A D+ INC INC C INC B+ C−
Scotland F B INC C F INC INC INC B− C D+
Slovenia A− C+ D C B+ A− B+ A B A B
South Korea F C INC B+ D D+ INC D+ INC D D+
Spain D B C− B− B+ INC INC C+ INC INC C+
Sweden D+ B+ INC C C+ INC INC C+ A B C+
Taiwan F D− INC C− C− B− INC B+ B+ B+ C
United Arab Emirates F INC INC INC C− INC INC D− INC B+ D+
United States D− C INC D− D C− INC D− C INC D
Wales D+ C+ C− D+ F INC D INC INC C+ D+
Abbreviations: AP, Active Play; AT, Active Transportation; AVG, average; COM, Community and Environment; FAM, Family and Peers; GOV, Government; HDI,Human Development Index; INC, incomplete grade; N/A, not applicable; PA, Physical Activity; PF, Physical Fitness; SB, Sedentary Behaviors; SCH, School;SP, Organized Sport and Physical Activity Participation.
JPAH 15 Supplement 2, 2018
Very High HDI Country Physical Activity Grades for Children and Youth S303
Unauthenticated | Downloaded 01/26/22 11:20 AM UTC

DiscussionThe objective of this paper was to present, describe, and comparethe Report Card grades from the 30 very high HDI countries andnations participating in the Global Matrix 3.0. A wide range ofgrades was observed for most indicators across countries. These30 countries are geographically distributed across Asia, Europe,North America, Oceania, and South America and have verydifferent climatic, geographic, demographic, and cultural charac-teristics. Despite these contextual differences, most of these coun-tries shared concerning low grades for Overall Physical Activityand Sedentary Behaviors. No country was consistently leading norfalling behind the others across the 10 common indicators, how-ever, some countries showed greater or less success than others.
The characteristics of the most and the least successful countries arediscussed below, followed by a discussion of the findings for eachindicator, and an integrated discussion of the findings including thestrengths and limitations of this study.
Most Successful Countries
Slovenia had sufficient data to inform the 10 indicators andobtained the best grades for Overall Physical Activity (“A−”),Family and Peers (“B+”), and Government (“A”), as well as onaverage (“B”); and shared the best grades for Sedentary Behaviorswith Spain (“B+”), and for School (“A”) with Finland and Portugal.A notable feature of Slovenia is the importance of sport for theculture of this almost 30-year old country as “Slovenes tend to view
Table 5 Descriptive Statistics of the Grades by Indicator and Group of Indicators for the Very High HumanDevelopment Index Countries of the Global Matrix 3.0
Gradecount
Incompletegrades
Mean numbergrade SD
Mean lettergrade Range
Overall Physical Activity 29 1 4.9 2.2 D− F to A−
Organized Sport and Physical Activity Participation 28 2 9 2.4 C+ D− to A−
Active Play 10 20 6.2 2.7 D+ F to B
Active Transportation 28 2 7.8 2.7 C− F to A−
Sedentary Behaviors 30 0 6.1 2.4 D+ F to B+
Physical Fitness 17 13 7.9 2.7 C− D to A
Family and Peers 17 13 7.5 2.6 C− F to B+
School 27 3 9.9 2.9 C+ D− to A
Community and Environment 22 8 10.7 1.7 B− C to A
Government 25 5 9.6 2.7 C+ D to A
Behavioral indicators 30 0 6.8 1.6 D+ D− to B−
Sources of influence indicators 30 0 9.3 2 C+ D to A−
All indicators 30 0 7.9 1.5 C− D+ to B
Note: Behavioral indicators = average of Overall Physical Activity, Organized Sport Participation, Active Play, Active Transportation, and Sedentary Behavior indicatorgrades; source of influence indicators = average of Family and Peers, School, Community and Environment, and Government Strategies and Investments indicator grades.Physical fitness was not included in the behavioral indicators cluster. There are no missing grades for the bottom 3 rows because these scores are adjusted formissing grades.
Figure 1 — Frequency plot by letter grade among 30 very high Human Development Index countries in the Global Matrix 3.0. (A) For the 10 coreindicators. (B) For the behavioral indicators and for the source of influence indicators. Note: Behavioral indicators = average of Overall Physical Activity,Organized Sport Participation, Active Play, Active Transportation, and Sedentary Behavior indicator grades; source of influence indicators = average ofFamily and Peers, School, Community and Environment, and Government Strategies and Investments indicator grades. Physical fitness was not includedin the behavioral indicators cluster.
JPAH 15 Supplement 2, 2018
S304 Aubert et al
Unauthenticated | Downloaded 01/26/22 11:20 AM UTC

sports as an effective tool in fostering national identity amongcitizens and making successful global identity claims.”58 EveryApril since 1987, a national school-based surveillance system ofphysical fitness (named Slofit) takes place, targeting the majority of
Slovenian school children and youth aged 6–19 years.59 Negativetrends in motor skills and physical fitness were observed for over2 decades in Slovenia, but since 2011, these trends have beenreversed after the implementation of a health-oriented physical
Figure 2 — Plot of the overall score estimated for the 10 core indicators for the 30 very high Human Development Index countries of the Global Matrix3.0. Note: The overall score was adjusted for missing and incomplete grades. The number in parenthesis shows the number of grades available for thecalculation of the score.
Figure 3 — Plot of the behavioral score estimated for the very high Human Development Index countries of the Global Matrix 3.0. Note: The overallscore was adjusted for missing and incomplete grades. The number in parenthesis shows the number of grades available for the calculation of the score.
JPAH 15 Supplement 2, 2018
Very High HDI Country Physical Activity Grades for Children and Youth S305
Unauthenticated | Downloaded 01/26/22 11:20 AM UTC

activity intervention program, which offers children 2 (optional)additional hours of physical activity per week.60 The estimatedproportion of Slovenian children and youth meeting the recom-mended levels of daily physical activity is now high (over 80%),and this encouraging outcome seems to be the result of thecollective support for childhood physical activity from the govern-ment, the educational system, and the parents themselves.61
The next 2 most successful countries were Denmark and Japanwith an average grade of “B−.” The positive result for these 2countries should be interpreted with caution as both had “INC”grades for some indicators. Active Play, Physical Fitness, andFamily and Peers for Denmark, and Overall Physical Activity andActive Play for Japan were not graded due to the lack of data.Nonetheless, Denmark was the country with the best grade forOrganized Sport and Physical Activity (“A−”), and also obtained agrade of “A−” for both School and Government indicators. Sport isan important part of the Danish culture, and considered importantnot only for individual and population health, but also in relation toissues such as social inclusion and community cohesion.62 DespiteDenmark performing rather well on the strategic and politicallevels, low grades were attributed to Overall Physical Activity(“D−”) and Sedentary Behaviors (“D+”), indicating an implemen-tation gap between the governmental and individual levels.63
Japan had the best grades for Active Transportation (“A−”)and Physical Fitness (“A”), and had no grades lower than “C−.” Infact, Japan has a highly established “walking to school practice”that has been implemented since the School Education Act enforce-ment order, enacted in 1953, stating that public elementary schoolsshould be sited within no more than 4 km, and for public juniorhigh schools no more than 6 km from the student’s home. Thispolicy is still successful today at promoting active transportation
among Japanese children and youth.64 The Physical Fitness gradewas assigned based on the performance of Japanese children andyouth on the 20-m shuttle run test. On average, Japanese childrenwere in the 90th percentile,65 based on age- and sex-specificinternational normative data.41 The Organized Sport and PhysicalActivity Participation (graded “B−”) and the favorable Schoolenvironment (graded “B+”) may explain this high level of physicalfitness; however, this is speculative and more research is necessary.It was observed that only a minority of time in physical educationclasses was spent in MVPA (27.3%/45 min/class) in Japaneseprimary school students.66
Least Successful Countries
Chile and the United States were the 2 countries with the lowestaverage grade: “D.” They were followed by Guernsey, Jersey,Scotland, South Korea, the United Arab Emirates, and Wales, whoobtained an average grade of “D+.” Chile had the lowest grades forActive Transportation (“F”), Family and Peers (“F”), and sharedthe lowest grades for Organized Sport and Physical Activity withTaiwan (“D−”), and for Physical Fitness with Canada, Hong Kong,and Jersey (“D”). In Chile’s first Report Card (2016), all indicatorshad low grades, and data from different surveys indicated that therewere consistent disparities across genders, socioeconomic status,and school types.67 In 2018, Chile’s grades remained low incomparison with the first Report Card in 2016 but progress wasmade on environmental and policy aspects,68 raising hope thatthese improvements will positively affect behavioral indicators inthe future.
The low average grade of the United States should be inter-preted carefully because 3 indicators were assigned an “INC”
Figure 4 — Plot of the source of influence indicators score for the very high Human Development Index countries of the Global Matrix 3.0. Note: Theoverall score was adjusted for missing and incomplete grades. The number in parenthesis shows the number of grades available for the calculation ofthe score. These estimates of sources of influence score are interpreted with a high degree of caution as they are likely imprecise estimates of sourcesof influence due to the level of missing data used to determine this score.
JPAH 15 Supplement 2, 2018
S306 Aubert et al
Unauthenticated | Downloaded 01/26/22 11:20 AM UTC

grade: Active Play, Family and Peers, and Government. The UnitedStates shared the lowest grades with the United Arab Emirates forSchool (“D−”), and the Community and Environment (“C”) withEngland, Jersey, Lithuania, and Poland. Overall, none of theindicators were graded above “C” in the United States. This isthe third Report Card for the United States, and the grade forOverall Physical Activity (“D−”) remained consistent with the2014 and 2016 Report Card.69,70 Similarly to Chile, major dis-parities in physical activity participation across gender, race/eth-nicity, age, and socioeconomic status were observed.71
Overall Physical Activity
Among the 30 very high HDI countries, only Japan assigned an“INC” grade for Overall Physical Activity. The grades ranged from“F” to “A−” for this indicator; however, Slovenia was the onlycountry with a “good” grade (“A−”), and all the other countries’grades fell between “F” and “C.” Five countries received an “F”(Flanders, Scotland, South Korea, Taiwan, and the United ArabEmirates), 4 countries assigned “C” grades (England, Hong Kong,Lithuania, and The Netherlands), and all the remaining countrieshad a “D−,” “D,” or “D+.”The comparison and interpretation of theOverall Physical Activity grades should be conducted carefullygiven the important variation in the methods used to measureOverall Physical Activity between the countries, as seen inSupplemental Material [available online]. In fact, objective datawere used in 13 of 29 countries with an Overall Physical Activityletter grade, and subjective data in 27 countries (11 countriescombined subjective and objective data to inform their OverallPhysical Activity indicator). In addition, even among the subjectiveor the objective data, the methods differed largely in terms ofinstruments, analysis, age range, sample size, and representative-ness of samples.
The correlational analyses showed that there was no relation-ship between Overall Physical Activity and the physical activity-related indicators (Organized Sport and Physical Activity, ActivePlay, and Active Transportation). For example, only 56% ofchildren and 33% of adolescents met the international physicalactivity recommendations in The Netherlands despite a high levelof Organized Sport and Physical Activity, Active Play, and ActiveTransportation (graded “B,” “B,” and “B−,” respectively).72 Asimilar pattern was observed in Belgium (Flanders), Denmark,Scotland, South Korea, and Spain where Overall Physical Activitywas graded “F” or “D/D−” despite the fact that grades between “A”and “C” were assigned to Organized Sport and Physical Activity,Active Play, and Active Transportation (note: an “INC” grade wasassigned to Active Play for Flanders, Denmark, Scotland, andSouth Korea).63,73–76 The opposite situation was observed inSlovenia where Overall Physical Activity was graded “A−,” whileOrganized Sport and Physical Activity, Active Play, and ActiveTransportation were graded “C+,” “D,” and “C,” respectively.
The absence of a relationship between Overall Physical Activ-ity and other behavioral indicators can potentially be explained bythe aforementioned differences in methods used to measure theseindicators and the diversity of benchmarks between countries. Therecommended benchmark for physical activity was “% of childrenand youth [ . . . ] who accumulate at least 60 minutesMVPA per dayon average, or % of children and youth meeting the guidelines on atleast 4 days a week (when an average cannot be estimated)”(Table 1). The available data in each country did not necessarilyallow them to use either of these benchmarks strictly whenestimating the prevalence of physically active children and youth
in their sample. For example, in France, a “high level of physicalactivity” corresponded to engage in physical activity 5 or moredays a week, and the regular use of active transportation, for 6- to10-year olds (reported by the parents); and practicing a MVPA atleast 5 days a week for 11- to 17-year olds (self-reported).77 Whilein England’s 2018 Report Card, the percentage of children andyouth accumulating at least 1 hour of MVPA 7 days a week wasevaluated.78 In addition, among the countries where objectivemethods were used to measure physical activity, the estimatednumber of children meeting the physical activity guidelines couldalso have been significantly affected by the cutoff point that definesthe count per minute threshold for MVPA.79 Although the majorityof studies included in the Global Matrix 3.0 used the Evensoncutoff point,57 several studies used different ones. For example, theFreedson cutoff point80 was used in Hong Kong, while the Puyaucutoff point81 was used in Canada (Supplemental Material [avail-able online]).
Notwithstanding the presented methodological issues acrosscountries, 29 out of 30 very high HDI countries assigned a lettergrade to the Overall Physical Activity indicator, and for 28 of them,this grade was between “C” and “F,” with an average of “D−.”These results are consistent with the current literature. A systematicreview of physical activity in European children and adolescentsfound that 5% to 47% of children and adolescents when measuredsubjectively, or 0% to 60% of children and adolescents whenmeasured objectively, achieved the recommended levels of physi-cal activity.82 In another study describing objectively measuredphysical activity and sedentary time patterns in children and youthin 10 countries (9 very high HDI countries and Brazil), only 9% ofboys and 2% of girls accumulated ≥60 minutes of MVPA on allmeasured days.35 The present study provides additional evidencethat the situation regarding the physical activity of children andyouth is very concerning in very high HDI countries, and publicinvestment to implement effective interventions for increasingphysical activity opportunities is needed urgently. Unless a majorshift to a more active lifestyle happens soon, a high rate ofpremature noncommunicable diseases can be anticipated whenthis generation of children will reach adulthood.
Organized Sport and Physical Activity
Most of the countries assigned a letter grade to Organized Sport andPhysical Activity, excepting Jersey and the United Arab Emirates.With an average grade of “C+,” Organized Sport and PhysicalActivity was the most successful behavioral indicator in the veryhigh HDI countries. Only 3 countries had a low grade for thisindicator: Chile (“D−”), Taiwan (“D−”), and France (“C−”); while12 countries had relatively higher grades (“B+,” “B,” and “B−”)behind the lead of Denmark (“A−”). In Canada, Organized Sportand Physical Activity was the only behavioral indicator with a highgrade (“B+”),83 in which the high participation rate (77%) has beenrelatively stable since 2005.84 Similarly, Organized Sport andPhysical Activity was also the highest graded indicator in Swe-den.85 In relation to its geographical and population size, Sweden isconsidered as one of the world’s most sporting nations: out of the 7million inhabitants between the ages of 7 and 70, more than 3million were active members of sport clubs and more than 2 millionwere competing regularly in 2012.86 However, as presented before,these high rates of sport participation were not associated with asufficient level of physical activity in the population.
Given that the benchmark for Organized Sport and PhysicalActivity (“% of children and youth who participate in organized
JPAH 15 Supplement 2, 2018
Very High HDI Country Physical Activity Grades for Children and Youth S307
Unauthenticated | Downloaded 01/26/22 11:20 AM UTC

sport and/or physical activity programs”) does not specify inten-sity, duration, or frequency, we are missing important contextualinformation of this indicator. These characteristics should beevaluated to estimate the dose of physical activity associatedwith sport participation among children and youth. However,the popularity of sport among children and youth from veryhigh HDI countries suggests that increasing organized sport op-portunities and accessibility could be a strategic solution to addressthe prevalence of childhood physical inactivity in these countries.Further research focusing on this indicator is needed to evaluate ifthe available organized physical activity opportunities are indeedsaturated. Moreover, are all countries providing free or affordableand appealing physical activity and sport participation opportu-nities for the entire youth population including different age,gender, socioeconomic, ethnic, and special population groups(eg, children with learning and/or physical disabilities)?
Active Play
The main finding concerning Active Play was the amount ofmissing data: 20 out of the 30 very high HDI countries assignedan “INC” grade to this indicator. Among the 10 countries with aletter grade, The Netherlands attained the highest grade (“B”);Estonia the lowest grade (“F”); and the 8 remaining countries had“C”s or “D”s. The average grade of “D+” for this indicator suggeststhat there is a low level of engagement in this behavior, and/or thatresearchers were not able to detect it with the measurementinstruments they used. Indeed, valid and reliable tools to assessactive play are largely limited.87 In the Czech Republic, ActivePlay was measured using self-reports of unstructured/unorganizedactive play for at least 2 hours per day88; while in New Zealand,surveys asked parents/guardians or youth report to indicate if thechildren or youth had been active while playing (on their own orwith others) in the last 7 days, if they had been active while playingfor at least 7 hours in the last 7 days, and if they were allowed to goout on their own in the neighborhood.89 The development ofstandardized tools for the measurement of Active Play is chal-lenged by the need for consensus on a definition. In a recentsystematic review synthesizing the literature to identify key con-cepts used to define and describe active play among youngchildren, Truelove et al87 proposed the following definition: “aform of gross motor or total body movement in which youngchildren exert energy in a freely chosen, fun, and unstructuredmanner.” But a consensus definition needs to be officially interna-tionally agreed upon and acknowledged to advance the develop-ment and acceptance of standardized measurement tools.
Active Transportation
For Active Transportation, the grades ranged from “A−” (Japan) to“F” (Chile), with an average of “C−.” Qatar and the United ArabEmirates were the only 2 countries that did not assign a letter gradeto this indicator. Interestingly, 3 of the 4 countries from EasternAsia are leading this indicator: Japan (“A−”), Hong Kong (“B+”),and South Korea (“B+”). The successful school policy that hasbeen identified underlying this high prevalence of active transpor-tation among children and youth in Japan was discussed previouslyin this paper. In Hong Kong, a high proportion of children usingactive transportation can be explained by the very high populationdensity of the city: most districts are highly self-contained sochildren usually attend schools close to their home.90 Similarly,because most students live within 10-minute walking distance to/
from school, national data showed that active commuting isprevalent in South Korea: 79.4% of children and youth reportedthat they take active modes of transport to/from places.75 Previousresearch has shown that active transportation is associated withincreased physical activity91; however, the Active Transportationindicator was not correlated with Overall Physical Activity amongchildren in very high HDI countries in this study. Similar toOrganized Sport and Physical Activity and Active Play, thebenchmark for this indicator does not indicate duration or intensityof activity. Therefore, it is not possible to evaluate the extent towhich this indicator is contributing to the Overall Physical Activityof children and youth.
Sedentary Behaviors
Sedentary behavior corresponds to any waking behavior charac-terized by an energy expenditure ≤1.5 metabolic equivalents, whilein a sitting, reclining, or lying posture.92 For example, in childrenand youth, it includes to the use of electronic devices while sitting,reclining, or lying, as well as reading, writing, or drawing whilesitting.92 While reading is associated with positive outcomes suchas higher academic achievement, screen time, often used as a proxyfor sedentary behavior in research, has been shown to be associatedwith a variety of negative health outcomes among children andyouth.93 For this reason, guidelines focusing specifically on screentime were developed for the first time in Canada in 2011, recom-mending limiting screen time to 2 hours daily for the 5- to 17-yearolds.94 Consistent with the current guidelines, the benchmark forSedentary Behaviors was solely based on screen time: “% ofchildren and youth who meet the Canadian Sedentary BehaviourGuidelines (5- to 17-year-olds: no more than 2 hours of recreationalscreen time per day).”
Sedentary Behaviors was the only indicator without any“INC” grades. Estonia, Scotland, and Wales were the 3 countrieswith the lowest grade for this indicator (“F”), while Slovenia andSpain had the highest grade (“B+”). The remaining countries allhad “C”s or “D”s, and the average for this indicator was “D+.” Intotal, only 5 out of the 30 very high HDI countries had a grade of“C” or higher. A small methodological difference was observedbetween the very high HDI as few countries such as Estonia,France, and Sweden reported the percentage of children and youthwho had less than 2 hours (<2 h/d) of daily screen time, while mostof the countries reported those spending 2 hours or less (≤2 h/d) infront of a screen. Another potential source of bias was not takinginto account the potential multitasking use of screens (eg, using aphone while watching a movie) as it was the case for France, whichcould have led to an overestimation of screen time.77 Despite thesepotential methodological issues, the grades observed for thisindicator are extremely concerning among the very high HDIcountries. In Estonia, the prevalence of children meeting the screentime recommendation was estimated as low as 7%.95 The devel-opment of more effective interventions targeting the reduction ofscreen time among children and youth in very high HDI countriesshould be a public health priority.
Physical Fitness
This is the first time that Physical Fitness has been evaluated in theGlobal Matrix. Physical fitness corresponds to a state characterizedby an ability to perform daily activities with vigor, and a demon-stration of traits and capacities that are associated with a lower riskof the premature development of diseases associated with physical
JPAH 15 Supplement 2, 2018
S308 Aubert et al
Unauthenticated | Downloaded 01/26/22 11:20 AM UTC

inactivity.96 The health-related components of physical fitness arecardiorespiratory endurance, muscular endurance, muscularstrength, body composition, and flexibility.97 A recent systematicreview of the relationship between the 20-m shuttle run perfor-mance and health indicators among children and youth found thatperformance on this test was associated with favorable indicators ofadiposity, and some indicators of cardiometabolic, cognitive, andpsychosocial health in boys and girls, and concluded that physicalfitness can be used as a holistic indicator of population health inchildren and youth.98
The benchmark for this indicator was the average percentileachieved on certain health-related physical fitness componentbased on the normative values published by Tomkinson et al.41
On average, Physical Fitness was graded “C−.” The highest gradewas obtained by Japan (“A”), closely followed by Slovenia (“A−”);and 4 other countries (Canada, Chile, Hong Kong, and Jersey)shared the lowest grade (“D”). An “INC” grade was assigned toPhysical Fitness in 13 countries. Various health-related physicalfitness components and different normative values were used tocalculate the percentile achieved by their sample of children andyouth and inform this indicator from one country to another. Forexample, in Hong Kong this indicator was graded based on peakoxygen consumption, estimated with the performance on the 20-mshuttle run performance among 9- to 17-year olds99; Jersey had dataon cardiorespiratory fitness, muscular strength, muscular endur-ance, flexibility, and motor fundamental movement skills develop-ment for school-aged children.100 Lithuania had data on endurance,lower-body muscular power, upper-body muscular endurance, andlower-body muscular endurance for 11- to 18-year olds. Giventhese significant variations, the comparison of the Physical Fitnessindicator between very high HDI countries is compromised and thishighlights the need for developing international standardized mea-surements of health-related physical fitness components.
Family and Peers
Similarly to Physical Fitness, 13 countries assigned an “INC” gradeto the Family and Peers indicator. On average, this indicator wasgraded “C−,” with Slovenia having the highest grade (“B+”) andChile having the lowest grade (“F”). Parental support and significantothers support has been identified as 2 of the 16 correlates that areconsistently associated with physical activity of children and/oradolescents in a systematic review of reviews.101 Because of thecomplexity of this indicator, several benchmarks were proposed forits evaluation (Table 1), andmeasurement variations were observed.In Poland, the grade was based on self-report of their parents’(material, emotional) support to their physical activity participation,on self-report of their parents’ regular participation in physicalactivity, and on the prevalence of youth who declared beingregularly physically active with their father, their mother, and theirsiblings.102 In Germany, the prevalence of parents regularly partici-pating in physical activity and the prevalence of children feeling thatthey receive positive support from their parents and friends to bephysically active informed the Family and Peers indicator.103 Thesefindings show that there is still a need for an established definition ofFamily and Peer Influence, and then standardized and validatedmethods of measurement for the Family and Peers indicator.
School
The School indicator had an average of “C+,” and only 3 countrieshad an “INC” grade for this indicator: Guernsey, Scotland, and
Wales. The United Arab Emirates and the United States had thelowest grade (“D”), and Finland and Portugal shared the best gradefor School (“A”). A variation in data was used to inform thisindicator within the countries. In Finland, 87% of the schoolsparticipated in the national Finnish Schools on the Move program.This program aims at achieving more pleasant and active school-days for children and encourages schools to increase physicalactivity during the schoolday as well as commuting.104 In Portugal,physical education classes are mandatory for all students frompreschool to 12th grade. The time allocated to physical educationclasses ranges from 90 to 150 minutes per week over 2 or3 sessions/wk, and these classes are taught by a certified physicaleducation teacher. In addition, 85% of Portuguese schools offerschool clubs under the supervision of a physical education teacher,including competitions within and between schools.105 The corre-lational analyses did not find an association between the School andthe Overall Physical Activity indicators, but similarly to otherindicators, the heterogeneity of data used to inform the Schoolindicator is potentially affecting this relationship.
A review of the relationship between academic performanceand participation in school-based physical activities, includingphysical education, free school-based physical activity, and schoolsports, found that adding time to academic or curricular subjects bytaking time from physical education programs does not enhancegrades in the corresponding academic subjects, and could bedetrimental to health.106 On the contrary, the authors also suggestedthat more time can be allocated to physical activity from othersubjects without the risk of hindering students’ academic achieve-ment.106 These findings suggest that the school environment,policy, and curriculum have the potential to increase physicalactivity among children and youth, and more specific interventionstargeting the creation of daily physical opportunities at school needto be developed in very high HDI countries.
Community and Environment
With an average of “B−,” Community and Environment was thehighest graded indicator of the 10 core indicators among the 30very high HDI countries. The lowest grade for this indicator was“C,” shared by 5 countries (England, Jersey, Lithuania,Poland, and the United States), and the highest grade, “A,” wasassigned by Sweden. Eight countries assigned an “INC” grade forthis indicator. With an “A−,” Australia was the second mostsuccessful country for this indicator. In the Australia’s 2018 ReportCard, parent-report data showed that most of youth were not facedwith problematic traffic in their home or school neighborhood, hadaccess to good roads and footpaths and to public transport in theirneighborhood, had a park or playground near their home, and livedin a safe neighborhood.107 In Taiwan, where this indicator wasgraded “B+,” 81% of 13- to 17-year olds felt that there weresufficient exercise facilities in their neighborhood, and they re-ported spending an average of 9.7 minutes to reach their primaryexercise facilities.108 The lack of significant correlation betweenthis indicator and the Overall Physical Activity does not align withsome of the research available on access to facilities.101 ForCommunity and Environment, in accordance with previous GlobalMatrices,36,38 the available evidence from this indicator maysuggest that the characteristics of the built environment potentiallyinfluencing the physical activity of children are already meeting thecriteria to be considered favorable in the very high HDI countries.This indicates that having favorable environmental infrastructurealone is not sufficient to promote physical activity in very high HDI
JPAH 15 Supplement 2, 2018
Very High HDI Country Physical Activity Grades for Children and Youth S309
Unauthenticated | Downloaded 01/26/22 11:20 AM UTC

countries. Social factors such as family, home, school, and com-munity are also important to promote physical activity amongchildren and youth.
Government
The average grade for the Government indicator was “C+,” and thegrades ranged from “A” (Slovenia) to “D” (Australia, Guernsey,Jersey, and South Korea). Five countries assigned an “INC” gradeto this indicator. With the exception of the 4 countries with a “D,”all the other very high HDI countries obtained a favorable grade(“C” or higher) for the Government indicator. Despite the recom-mended benchmark for this indicator, Government grades wereinformed by different types of data in different countries. Forexample, in Wales, 21 policy documents assessed across differentsectors including Health, Sport, Education, Environment, Trans-port, and Urban Design/Planning were evaluated using the Health-Enhancing Physical Activity Policy Audit Tool, obtaining a finalscore of 54% that was converted to a letter grade of “C+.”109
In some other countries that did not have relevant quantitative data,a letter grade was graded primarily based on expert opinion.Although most countries reported government physical activitystrategies and policies, the absence of a relationship between theGovernment grades and the Overall Physical Activity grades andthe mostly low behavioral grades suggest that these actions are notsingularly effective at increasing the prevalence of MVPA amongchildren and youth.
Integrated Discussion
Generally, higher grades were reported for the source of influenceindicators in comparison with the behavioral indicators among the30 very high HDI countries integrated in this study. The averagegrade for the behavioral indicators was “D+” (ranging from “B−” to“D−”), while the average grade for the sources of influenceindicators was “C+” (ranging from “A” to “D”). This finding isconsistent with previous Global Matrices,36,38 and may be partiallyexplained by the fact that more than half of the countries thatparticipated in the Global Matrix 1.0 and 2.0 belonged to the veryhigh HDI category.
Japan, The Netherlands, and Slovenia had the highest behav-ioral score, while Estonia, Chile and the United Arab Emirates hadthe lowest score (Figure 3). This score was calculated based on thegrades for 5 indicators, and most of the countries had 4 to 5 lettergrades to inform the score, with the exception of the United ArabEmirates with only 2 letter grades, and Qatar, Jersey, and Japanwith only 3 letter grades. The amount of “INC” grades for these 4countries questions the accuracy of their ranking, in particular forJapan, in the leading position. For the sources of influence score,Slovenia, Denmark, and Finland led the ranking, while the UnitedStates, South Korea, and Guernsey ranked at the bottom (Figure 4).While the calculation of the source of influence score was based onthe letter grades for 4 indicators, 8 countries had only 2 letter gradesto inform this score, and Guernsey, The Netherlands, and Spain hadonly one. The amount of “INC” grades challenges the correctnessof this classification, in particular for the 3 countries with only onesource of influence indicator graded. The comparison of thesegroups of indicators suggests that the adequate to good gradesobserved for the source of influence indicators are not translated ingood behavioral grades for the very high HDI countries.
In total, 24 countries had 3 or less “INC” grades, but 6countries were missing data to grade 4 to 6 indicators. Including
countries with a significantly large number of “INC” grades in theGlobal Matrix 3.0 is a limitation to this study as it limits thecomparisons. For example, the United Arab Emirates had 6 “INC”grades,110 Guernsey had 5 “INC” grades,111 and Qatar had 4 “INC”grades, and a “not applicable” for Active Transportation.56 Anothermajor limitation of this study is the diversity of the data that wasused to inform the 10 core indicators, challenging the compara-tiveness of the grades within the same indicator. Two identicalgrades for the same indicator can potentially reflect very differentsituations from one country to another. An alternative approachwould have been to exclude the countries with insufficient datafrom the Global Matrix 3.0, and to have assigned “INC” grades toall the countries with data that were not fitting exactly with thebenchmarks for each indicator. Yet, this strategy would haveconsiderably reduced the number of countries and indicatorsincluded in the analyses of this study and decrease the relevanceof conducting international comparisons within an HDI category.Finally, a loss of information potentially occurs when translatingoriginal data to a letter grade, as letter grades provide less infor-mation than continuous variables.
The main strength of this study is the large number ofparticipating countries who adopted the harmonized data gathering,assessing, and grading process, and the quantity of data that areinforming the international physical activity comparisons. This waspossible as a result of the inclusive strategy adopted by AHKGA.This project offers the opportunity to paint a picture of thecharacteristics of childhood physical activity in each country, asdetermined and explained by a diverse group of experts within eachcountry. In addition, despite the presented methodological issues,this study allows the identification of major trends concerning thecharacteristics of the physical activity of children and youth amongvery high HDI countries. The need for the development and theinternational adoption of standardized methods to conceptualizeand measure the 10 indicators was also highlighted in this paper.An “INC” grade can be useful for advocacy in individual countriesin future cards, and the Global Matrix project has the potential toinfluence the physical activity national surveillance systems in theshort to long term. Finally, the development of a national ReportCard of physical activity for children and youth, and the participa-tion in the Global Matrix initiative, contributes to raising awarenesson the childhood physical inactivity issue nationally and interna-tionally, building capacity within participating countries, andpotentially influencing the creation of physical activity opportu-nities in the future.
ConclusionThis analysis and comparison of the Global Matrix 3.0 gradesprovide a comprehensive summary of the level and context of thephysical activity of children and youth among the participatingvery high HDI countries. While methodological limitations andresearch gaps were identified, this work allowed the portrayal ofmajor trends across the 10 physical activity indicators. The major-ity of very high HDI countries had better grades on the sources ofinfluence levels, but this was not translated in positive outcomesconcerning childhood physical activity and sedentary behavior,indicating an implementation gap between the policy/governmen-tal and individual level. This paper provides additional evidencethat the situation regarding physical activity in children and youthliving in very high HDI countries is extremely concerning. Strate-gic public investments to implement effective interventions withinfamilies, communities, and schools to increase physical activity
JPAH 15 Supplement 2, 2018
S310 Aubert et al
Unauthenticated | Downloaded 01/26/22 11:20 AM UTC

opportunities are needed. Unless a major shift to a more activelifestyle happens soon, a high rate of noncommunicable diseasescan be anticipated when this generation of children will reachadulthood.
Acknowledgments
The authors would like to acknowledge the then Active Healthy KidsCanada (now ParticipACTION) for developing the Report Card method-ology, and the AHKGA for modifying and standardizing the benchmarksand grading rubric. The authors are indebted to each country’s Report Cardleaders, ResearchWork Group, and all other members of their Report CardCommittees.
References
1. Nocon M, Hiemann T, Müller-Riemenschneider F, Thalau F, Roll S,Willich SN. Association of physical activity with all-cause andcardiovascular mortality: a systematic review and meta-analysis.Eur J Cardiovasc Prev Rehabil. 2008;15(3):239–246. PubMedID: 18525377 doi:10.1097/HJR.0b013e3282f55e09
2. Trost SG, Blair SN, Khan KM. Physical inactivity remains thegreatest public health problem of the 21st century: evidence,improved methods and solutions using the ‘7 investments thatwork’ as a framework. Br J Sports Med. 2014;48(3):169–170.PubMed ID: 24415409 doi:10.1136/bjsports-2013-093372
3. Blair SN. Physical inactivity: the biggest public health problem ofthe 21st century. Br J Sports Med. 2009;43(1):1–2. PubMed ID:19136507
4. Poitras VJ, Gray CE, Borghese MM, et al. Systematic review of therelationships between objectively measured physical activity andhealth indicators in school-aged children and youth. Appl PhysiolNutr Metab. 2016;41(6 suppl 3):S197–S239. PubMed ID: 27306431doi:10.1139/apnm-2015-0663
5. Janssen I, LeBlanc AG. Systematic review of the health benefits ofphysical activity and fitness in school-aged children and youth. Int JBehav Nutr Phys Act. 2010;7(1):40. doi:10.1186/1479-5868-7-40
6. Kremer P, ElshaugC, Leslie E, Toumbourou JW, PattonGC,WilliamsJ. Physical activity, leisure-time screen use and depression amongchildren and young adolescents. J SciMedSport. 2014;17(2):183–187.PubMed ID: 23648221 doi:10.1016/J.JSAMS.2013.03.012
7. McMahon EM, Corcoran P, O’Regan G, et al. Physical activity inEuropean adolescents and associations with anxiety, depression andwell-being. Eur Child Adolesc Psychiatry. 2017;26(1):111–122.PubMed ID: 27277894 doi:10.1007/s00787-016-0875-9
8. United Nations Development Programme. Human DevelopmentIndex (HDI) Human Development Reports. 2016 http://hdr.undp.org/en/content/human-development-index-hdi. Accessed April 7,2018.
9. Land KC. TheHumanDevelopment Index: objective approaches (2).In: W. Glatzer, L. Camfield, V. Møller, & M. Rojas (Eds.), GlobalHandbook of Quality of Life. Dordrecht, The Netherlands: Springer;2015:133–157.
10. FastingMH, Nilsen TI, Holmen TL, Vik T. Life style related to bloodpressure and body weight in adolescence: cross sectional data fromthe Young-HUNT study, Norway. BMC Public Health. 2008;8(1):111. doi:10.1186/1471-2458-8-111
11. Ekelund U, Luan J, Sherar LB, et al. Moderate to vigorous physicalactivity and sedentary time and cardiometabolic risk factors inchildren and adolescents. JAMA. 2012;307(7):704. PubMed ID:22337681 doi:10.1001/jama.2012.156
12. Andersen LB, Harro M, Sardinha LB, et al. Physical activity andclustered cardiovascular risk in children: a cross-sectional study (TheEuropean Youth Heart Study). Lancet. 2006;368(9532):299–304.PubMed ID: 16860699 doi:10.1016/S0140-6736(06)69075-2
13. Ekelund U, Anderssen SA, Froberg K, et al. Independent associa-tions of physical activity and cardiorespiratory fitness with metabolicrisk factors in children: the European Youth Heart Study. Diabeto-logia. 2007;50(9):1832–1840. PubMed ID: 17641870 doi:10.1007/s00125-007-0762-5
14. Dumuid D, Maher C, Lewis LK, et al. Human Development Index,children’s health-related quality of life and movement behaviors: acompositional data analysis. Qual Life Res. 2018;27(6):1473–1482.PubMed ID: 29362939 doi:10.1007/s11136-018-1791-x
15. Lee I-M, Shiroma EJ, Lobelo F, Puska P, Blair SN, Katzmarzyk PT.Effect of physical inactivity on major non-communicable diseasesworldwide: an analysis of burden of disease and life expectancy.Lancet. 2012;380(9838):219–229. PubMed ID: 22818936 doi:10.1016/S0140-6736(12)61031-9
16. Ding Ding M, Lawson KD, Kolbe-Alexander TL, et al. The eco-nomic burden of physical inactivity: a global analysis of major non-communicable diseases. Lancet. 2016;388(10051):1311–1324.PubMed ID: 27475266 doi:10.1016/S0140-6736(16)30383-X
17. Konstabel K, Veidebaum T, Verbestel V, et al. Objectively measuredphysical activity in European children: the IDEFICS study. Int JObes. 2014;38(suppl 2):S135–S143. doi:10.1038/ijo.2014.144
18. Sheldrick M, Tyler R, Mackintosh K, Stratton G. Relationshipbetween sedentary time, physical activity and multiple lifestylefactors in children. J Funct Morphol Kinesiol. 2018;3(1):15. doi:10.3390/jfmk3010015
19. Baptista F, Santos DA, Silva AM, et al. Prevalence of the Portuguesepopulation attaining sufficient physical activity. Med Sci SportsExerc. 2012;44(3):466–473. doi:10.1249/MSS.0b013e318230e441
20. Mielgo-Ayuso J, Aparicio-Ugarriza R, Castillo A, et al. Physicalactivity patterns of the Spanish population are mostly determined bysex and age: findings in the ANIBES study. PLoS ONE. 2016;11(2):e0149969. doi:10.1371/journal.pone.0149969
21. Kokko S, Mehtälä A, Vasankari T, et al. Lasten ja nuorten liikunta-käyttäytyminen Suomessa–LIITU-tutkimuksen tuloksia 2016. Hel-sinki: Valtion liikuntaneuvosto; 2016;4.
22. Kalman M, Inchley J, Sigmundova D, et al. Secular trends inmoderate-to-vigorous physical activity in 32 countries from 2002to 2010: a cross-national perspective. Eur J Public Health. 2015;25(suppl 2):37–40. doi:10.1093/eurpub/ckv024
23. Tabak I, Mazur J, Nałecz H. Family and individual predictors andmediators of adolescent physical activity.Health Psychol Rep. 2017;4(4):333–344. doi:10.5114/hpr.2017.67522
24. Sigmund E, Sigmundová D, Badura P, Kalman M, Hamrik Z,Pavelka J. Temporal trends in overweight and obesity, physicalactivity and screen time among Czech adolescents from 2002 to2014: a national health behaviour in school-aged children study. Int JEnviron Res Public Health. 2015;12(9):11848–11868. PubMed ID:26393638 doi:10.3390/ijerph120911848
25. JodkowskaM,Mazur J, Oblacińska A. Perceived barriers to physicalactivity among polish adolescents. Przegl Epidemiol. 2015;69(1):73–78. PubMed ID: 25862451 http://www.przeglepidemiol.pzh.gov.pl/perceived-barriers-to-physical-activity-among-polish-adolescents?lang=pl. Accessed May 30, 2018.
26. World Health Organization. Global Recommendation on PhysicalActivity for Health. 2010. http://www.who.int/dietphysicalactivity/factsheet_recommendations/en/. Accessed January 11, 2018.
27. Aguilar-Farias N, Martino-Fuentealba P, Carcamo-Oyarzun J, et al.A regional vision of physical activity, sedentary behaviour and
JPAH 15 Supplement 2, 2018
Very High HDI Country Physical Activity Grades for Children and Youth S311
Unauthenticated | Downloaded 01/26/22 11:20 AM UTC

physical education in adolescents from Latin America and theCaribbean: results from 26 countries. Int J Epidemiol. 2018. 976–986. doi:10.1093/ije/dyy033
28. Chiang P-H, Huang L-Y, LeeM-S, Tsou H-C,Wahlqvist ML. Fitnessand food environments around junior high schools in Taiwan and theirassociation with body composition: gender differences for recrea-tional, reading, food and beverage exposures.PLoSONE. 2017;12(8):e0182517. PubMed ID: 28771561 doi:10.1371/journal.pone.0182517
29. Wong SH, Huang WY, He G. Longitudinal changes in objectivelymeasured physical activity differ for weekdays and weekends amongChinese children in Hong Kong. BMC Public Health. 2015;15(1):1310. doi:10.1186/s12889-015-2618-0
30. Tanaka C, Tanaka M, Okuda M, Inoue S, Aoyama T, Tanaka S.Association between objectively evaluated physical activity andsedentary behavior and screen time in primary school children.BMC Res Notes. 2017;10(1):175. PubMed ID: 28464957 doi:10.1186/s13104-017-2495-y
31. Lee E-Y, Spence JC, Tremblay MS, Carson V. Meeting 24-HourMovement Guidelines for Children and Youth and associationswith psychological well-being among South Korean adolescents.Ment Health Phys Act. 2018;14:66–73. doi:10.1016/J.MHPA.2018.02.001
32. Sharara E, Akik C, Ghattas H, Makhlouf Obermeyer C. Physicalinactivity, gender and culture in Arab countries: a systematic assess-ment of the literature. BMC Public Health. 2018;18(1):639. PubMedID: 29776343 doi:10.1186/s12889-018-5472-z
33. Haroun D, ElSaleh O, Wood L. Dietary and activity habits in adoles-cents living in the UnitedArab Emirates: a cross-sectional study.Arab JNutr Exerc. 2017;1(2):85–100. https://knepublishing.com/index.php/AJNE/article/view/1226/2672. Accessed May 24, 2018.
34. Zaabi MA, Shah SM, Sheek-Hussein M, Abdulle A, Junaibi AA,Loney T. Results from the United Arab Emirates’ 2016 Report Cardon Physical Activity for Children and Youth. J Phys Act Health.2016;13(11 suppl 2):S299–S306. doi:10.1123/jpah.2016-0312
35. Cooper AR, Goodman A, Page AS, et al. Objectively measuredphysical activity and sedentary time in youth: the InternationalChildren’s Accelerometry Database (ICAD). Int J Behav NutrPhys Act. 2015;12(1):113. doi:10.1186/s12966-015-0274-5
36. Tremblay MS, Gray CE, Akinroye K, et al. Physical activity ofchildren: a global matrix of grades comparing 15 countries. J Phys ActHealth. 2014;11(suppl 1):S113–S125. doi:10.1123/jpah.2014-0177
37. Colley RC, Brownrigg M, Tremblay MS. A model of knowledgetranslation in health. Health Promot Pract. 2012;13(3):320–330.PubMed ID: 22447666 doi:10.1177/1524839911432929
38. Tremblay MS, Barnes JD, González SA, et al. Global Matrix 2.0:Report Card grades on the physical activity of children and youthcomparing 38 countries. J Phys Act Health. 2016;13(11 suppl 2):S343–S366. doi:10.1123/jpah.2016-0594
39. Active Healthy Kids Global Alliance. About us. 2016. https://www.activehealthykids.org/about-us/. Accessed May 27, 2018.
40. Aubert S, Barnes JD, Adbeta C, Tremblay MS. Physical activityReport Card grades for children and youth: result and analysis from49 countries. J Phys Act Health. 2018;15(suppl 2):S251–S273. doi:10.1123/jpah.2018-0472
41. Tomkinson GR, Carver KD, Atkinson F, et al. European normativevalues for physical fitness in children and adolescents aged 9–17 years: results from 2 779 165 Eurofit performances representing30 countries [published online ahead of print November 30, 2017].Br J Sports Med. doi:10.1136/bjsports-2017-098253
42. Wei T, Simko V, Levy M, Xie Y, Jin Y, Zemla J. Visualization of acorrelation matrix: corrplot. 2017. https://github.com/taiyun/corrplot. Accessed July 5, 2018
43. Wickham H. ggplot2: Elegant Graphics for Data Analysis (2nd ed.).New York, NY: Springer-Verlag; 2016.
44. Conway JR, Lex A, Gehlenborg N. UpSetR: an R package for thevisualization of intersecting sets and their properties. Bioinformatics.2017;33(18):2938–2940. PubMed ID: 28645171 doi:10.1093/bioinformatics/btx364
45. Kowarik A, Templ M. Imputation with the R package VIM. J StatSoftw. 2016;74(7):1–16. doi:10.18637/jss.v074.i07
46. The World Bank. GINI index (World Bank estimate) | Data. 2017.https://data.worldbank.org/indicator/SI.POV.GINI?view=map.Accessed April 7, 2018.
47. TheWorld Bank. Population density (people per sq. km of land area)| Data. 2016. https://data.worldbank.org/indicator/EN.POP.DNST.Accessed June 27, 2018.
48. The Economist Intelligence Unit. Global Food Security Index:overview. 2017. https://foodsecurityindex.eiu.com/Index.Accessed June 27, 2018.
49. Organisation for Economic Co-operation and Development. Povertyrate. 2017. https://data.oecd.org/inequality/poverty-rate.htm.Accessed June 27, 2018.
50. United Nations Department of Economic and Social Affairs. Socialindicators/population growth and distribution. 2012. https://unstats.un.org/unsd/demographic/products/socind/. Accessed June 27, 2018.
51. Hastings DA. Filling gaps in the Human Development Index:findings for Asia and the Pacific. 2009. https://www.unescap.org/sites/default/files/wp-09-02.pdf. Accessed July 17, 2018.
52. The United States Central Intelligence Agency. The World Fact-book, guide to country profiles. 2018. https://www.cia.gov/library/publications/resources/the-world-factbook/docs/profileguide.html.Accessed July 17, 2018.
53. State of Guernsey. Guernsey household income. 2015. https://www.gov.gg/CHttpHandler.ashx?id=110715&p=0.Accessed July17,2018.
54. State of Jersey. Jersey household income distribution 2014/15.2015. https://www.gov.je/SiteCollectionDocuments/Governmentand administration/R Income Distribution Survey Report 2014-1520151112 SU.pdf. Accessed July 17, 2018.
55. National Statistics Republic of China (Taiwan). Report on the surveyof family income and expenditure. 2017. https://eng.stat.gov.tw/ct.asp?xItem=3417&CtNode=1596&mp=5. Accessed June 28, 2018.
56. Ibrahim I, Al Hammadi E, Sayegh S, et al. Results fromQatar’s 2018Report Card on Physical Activity for Children and Youth. J Phys ActHealth. 2018;15(suppl 2):S400–S401. doi:10.1123/jpah.2018-0502
57. Evenson KR, Catellier DJ, Gill K, Ondrak KS, McMurray RG.Calibration of two objective measures of physical activity forchildren. J Sports Sci. 2008;26(14):1557–1565. PubMed ID:18949660 doi:10.1080/02640410802334196
58. Topič MD, Coakley J. Complicating the relationship between sportand national identity: the case of post-socialist Slovenia. Sociol SportJ. 2010;27(4):371–389. doi:10.1123/ssj.27.4.371
59. SLOfit. What is SLOfit. 2017. http://en.slofit.org/. Accessed July 23,2018.
60. Sember V, Starc G, Jurak G, et al. Results from the Republic ofSlovenia’s 2016 Report Card on Physical Activity for Children andYouth. J Phys Act Health. 2016;13(11, suppl 2):S256–S264. doi:10.1123/jpah.2016-0294
61. Sember V, Morrison SA, Jurak G, et al. Results from Slovenia’s2018 Report Card on Physical Activity for Children and Youth.J Phys Act Health. 2018;15(suppl 2):S404–S405. doi:10.1123/jpah.2018-0542
62. The official website of Denmark. Sports for everyone. 2016. https://web.archive.org/web/20170706132240/http://denmark.dk/en/lifestyle/sport/sports-for-everyone/. Accessed July 24, 2018.
JPAH 15 Supplement 2, 2018
S312 Aubert et al
Unauthenticated | Downloaded 01/26/22 11:20 AM UTC

63. Nørager Johansen DL, Neerfeldt Christensen BF, Fester M, et al.Results from Denmark’s 2018 Report Card on Physical Activity forChildren and Youth. J Phys Act Health. 2018;15(suppl 2):S341–S343. doi:10.1123/jpah.2018-0509
64. Mori N, Armada F, Willcox DC. Walking to school in Japan andchildhood obesity prevention: new lessons from an old policy. Am JPublic Health. 2012;102(11):2068–2073. PubMed ID: 22994195doi:10.2105/AJPH.2012.300913
65. Tanaka C, Tanaka S, Inoue S, et al. Results from Japan’s 2018 ReportCard on Physical Activity for Children and Youth. J Phys Act Health.2018;15(suppl 2):S375–S376. doi:10.1123/jpah.2018-0460
66. Tanaka C, Tanaka M, Tanaka S. Objectively evaluated physicalactivity and sedentary time in primary school children by gender,grade and types of physical education lessons. BMC Public Health.2018;18(1):948. PubMed ID: 30068319 doi:10.1186/s12889-018-5910-y
67. Aguilar-Farias N, Cortinez-O’Ryan A, Sadarangani KP, et al.Results from Chile’s 2016 Report Card on Physical Activity forChildren and Youth. J Phys Act Health. 2016;13(11 suppl 2):S117–S123. doi:10.1123/jpah.2016-0314
68. Aguilar-Farias N, Miranda-Marquez S, Sadarangani KP, et al.Results from Chile’s 2018 Report Card on Physical Activity forChildren and Youth. J Phys Act Health. 2018;15(suppl 2):S331–S332. doi:10.1123/jpah.2018-0553
69. Dentro KN, Beals K, Crouter SE, et al. Results from the UnitedStates’ 2014 Report Card on Physical Activity for Children andYouth. J Phys Act Health. 2014;11(suppl 1):S105–S112. doi:10.1123/jpah.2014-0184
70. Katzmarzyk PT, Denstel KD, Beals K, et al. Results from the UnitedStates of America’s 2016 Report Card on Physical Activity forChildren and Youth. J Phys Act Health. 2016;13(11, suppl 2):S307–S313. doi:10.1123/jpah.2016-0321
71. Katzmarzyk PT, Denstel KD, Beals K, et al. Results from the UnitedStates 2018 Report Card on Physical Activity for Children andYouth. J Phys Act Health. 2018;15(suppl 2):S422–S424. doi:10.1123/jpah.2018-0476
72. Takken T, de Jong N. Results from the Netherlands’s 2018 ReportCard on Physical Activity for Children and Youth. J Phys Act Health.2018;15(suppl 2):S388–S389. doi:10.1123/jpah.2018-0513
73. Seghers J, De Baere S, Verloigne M, Cardon G. Results fromFlanders’ 2018 Report Card on Physical Activity for Childrenand Youth. J Phys Act Health. 2018;15(suppl 2):S357–S359. doi:10.1123/jpah.2018-0458
74. Hughes AR, Johnstone A, Bardid F, Reilly JJ. Results fromScotland’s 2018 Report Card on Physical Activity for Childrenand Youth. J Phys Act Health. 2018;15(suppl 2):S402–S403. doi:10.1123/jpah.2018-0516
75. Oh J-W, Lim J, Lee S-H, et al. Results from South Korea’s 2018Report Card on Physical Activity for Children and Youth. J Phys ActHealth. 2018;15(suppl 2):S409–S410. doi:10.1123/jpah.2018-0518
76. Roman-Vinas B, Zazo F, Martínez-Martínez J, Aznar-Laín S, Serra-Majem L. Results from Spain’s 2018 Report Card on PhysicalActivity for Children and Youth. J Phys Act Health. 2018;15(suppl 2):S411–S412. doi:10.1123/jpah.2018-0464
77. Aubert S, Aucouturier J, Ganière C, et al. Results from France’s 2018Report Card on Physical Activity for Children and Youth. J Phys ActHealth. 2018;15(suppl 2):S360–S362. doi:10.1123/jpah.2018-0511
78. Standage M, Sherar L, Curran T, et al. Results from England’s 2018Report Card on Physical Activity for Children and Youth. J Phys ActHealth. 2018;15(suppl 2):S347–S349. doi:10.1123/jpah.2018-0537
79. Gába A, Dygrýn J, Mitáš J, Jakubec L, Frömel K. Effect ofaccelerometer cut-off points on the recommended level of physical
activity for obesity prevention in children. PLoS ONE. 2016;11(10):e0164282. doi:10.1371/journal.pone.0164282
80. Dowda M, Pate RR, Sallis J, Freedson PS. Accelerometer (CSA)count cut points for physical activity intensity ranges in youth. MedSci Sports Exerc. 1997;29(5):72. https://journals.lww.com/acsm-msse/pages/articleviewer.aspx?year=1997&issue=05001&article=00412&type=fulltext. Accessed July 26, 2018.
81. Puyau MR, Adolph AL, Vohra FA, Zakeri I, Butte NF. Predictionof activity energy expenditure using accelerometers in children.MedSci Sports Exerc. 2004;36(9):1625–1631. doi:10.1249/01.MSS.0000139898.30804.60
82. Van Hecke L, Loyen A, Verloigne M, et al. Variation in populationlevels of physical activity in European children and adolescentsaccording to cross-European studies: a systematic literature reviewwithin DEDIPAC. Int J Behav Nutr Phys Act. 2016;13(1):70. doi:10.1186/s12966-016-0396-4
83. Barnes JD, Cameron C, Carson V, et al. Results from Canada’s 2018Report Card on Physical Activity for Children and Youth. J PhysAct Health. 2018;15(suppl 2):S328–S330. doi:10.1123/jpah.2018-0454
84. Canadian Fitness and Lifestyle Research Institute. Bulletin 02:participation in organized physical activity and sport. 2016.http://cflri.ca/document/bulletin-02-participation-organized-physical-activity-and-sport. Accessed July 26, 2018.
85. Delisle Nyström C, Larsson C, Alexandrou C, et al. Results fromSweden’s 2018 Report Card on Physical Activity for Children andYouth. J Phys Act Health. 2018;15(suppl 2):S413–S414. doi:10.1123/jpah.2018-0519
86. RiksidrottsFörbundet. Sport in Sweden. 2012. www.rf.se. AccessedJuly 26, 2018.
87. Truelove S, Vanderloo LM, Tucker P. Defining andmeasuring activeplay among young children: a systematic review. J Phys Act Health.2017;14(2):155–166. doi:10.1123/jpah.2016-0195
88. Gába A, Rubín L, Badura P, et al. Results from the Czech Republic’s2018 Report Card on Physical Activity for Children and Youth.J Phys Act Health. 2018;15(suppl 2):S338–S340. doi:10.1123/jpah.2018-0508
89. Smith M, Ikeda E, Hinckson E, et al. Results from New Zealand’s2018 Report Card on Physical Activity for Children and Youth.J Phys Act Health. 2018;15(suppl 2):S390–S392. doi:10.1123/jpah.2018-0463
90. Huang WY, Wong SH, Wong MC, Sit CH, Sum RK, He G. Resultsfrom Hong Kong’s 2016 Report Card on Physical Activity forChildren and Youth. J Phys Act Health. 2016;13(11 suppl 2):S169–S175. doi:10.1123/jpah.2016-0302
91. Larouche R, Saunders TJ, John Faulkner GE, Colley R, TremblayM.Associations between active school transport and physical activity,body composition, and cardiovascular fitness: a systematic review of68 studies. J Phys Act Health. 2014;11(1):206–227. doi:10.1123/jpah.2011-0345
92. Tremblay MS, Aubert S, Barnes JD, et al. Sedentary BehaviorResearch Network (SBRN)—terminology Consensus Project pro-cess and outcome. Int J Behav Nutr Phys Act. 2017;14(1):75.PubMed ID: 28599680 doi:10.1186/s12966-017-0525-8
93. Carson V, Hunter S, Kuzik N, et al. Systematic review of sedentarybehaviour and health indicators in school-aged children and youth:an update. Appl Physiol Nutr Metab. 2016;41(6, suppl 3):S240–S265.doi:10.1139/apnm-2015-0630
94. Tremblay MS, LeBlanc AG, Janssen I, et al. Canadian SedentaryBehaviour Guidelines for children and youth. Appl Physiol NutrMetab. 2011;36(1):59–64. PubMed ID: 21326378 doi:10.1139/H11-012
JPAH 15 Supplement 2, 2018
Very High HDI Country Physical Activity Grades for Children and Youth S313
Unauthenticated | Downloaded 01/26/22 11:20 AM UTC

95. Mäestu E, Kull M, Mooses K, et al. Results from Estonian’s 2018Report Card on Physical Activity for Children and Youth. J Phys ActHealth. 2018;15(suppl 2):S350–S352. doi:10.1123/jpah.2018-0456
96. Pate RR. The evolving definition of physical fitness. Quest. 1988;40(3):174–179. doi:10.1080/00336297.1988.10483898
97. Caspersen CJ, Powell KE, Christenson GM. Physical activity,exercise, and physical fitness: definitions and distinctions forhealth-related research. Public Health Rep. 1985;100(2):126–131.http://www.ncbi.nlm.nih.gov/pubmed/3920711. Accessed May 13,2018.
98. Lang JJ, Belanger K, Poitras V, Janssen I, Tomkinson GR, TremblayMS. Systematic review of the relationship between 20m shuttle runperformance and health indicators among children and youth. J SciMed Sport. 2018;21(4):383–397. PubMed ID: 28847618 doi:10.1016/j.jsams.2017.08.002
99. Huang WY, Wong SH, Sit CH, et al. Results from Hong Kong’s2018 Report Card on Physical Activity for Children and Youth. JPhys Act Health. 2018;15(suppl 2):S370–S372. doi:10.1123/jpah.2018-0468
100. Scriven J, Cabot J, Mitchell D, Kennedy D. Results from Jersey’s2018 Report Card on Physical Activity for Children and Youth.J Phys Act Health. 2018;15(suppl 2):S377–S378. doi:10.1123/jpah.2018-0554
101. Sterdt E, Liersch S, Walter U. Correlates of physical activityof children and adolescents: a systematic review of reviews.Health Educ J. 2014;73(1):72–89. doi:10.1177/0017896912469578
102. Zembura P, Korcz A, Cieśla E, Gołdys A, Nałecz H. Results fromPoland’s 2018 Report Card on Physical Activity for Children andYouth. J Phys Act Health. 2018;15(suppl 2):S395–S397. doi:10.1123/jpah.2018-0540
103. Demetriou Y, Hebestreit A, Reimers AK, et al. Results fromGermany’s 2018 Report Card on Physical Activity for Childrenand Youth. J Phys Act Health. 2018;15(suppl 2):S363–S365. doi:10.1123/jpah.2018-0538
104. Kämppi K, Aira A, Halme N, et al. Results from Finland’s 2018Report Card on Physical Activity for Children and Youth. J Phys ActHealth. 2018;15(suppl 2):S355–S356. doi:10.1123/jpah.2018-0510
105. Mota J, Santos R, Coelho-e-Silva MJ, Raimundo AM, Sardinha LB.Results from Portugal’s 2018 Report Card on Physical Activity forChildren and Youth. J Phys Act Health. 2018;15(suppl 2):S398–S399. doi:10.1123/jpah.2018-0541
106. Trudeau F, Shephard RJ. Physical education, school physical activ-ity, school sports and academic performance. Int J Behav Nutr PhysAct. 2008;5(1):10. doi:10.1186/1479-5868-5-10
107. Schranz N, Glennon V, Evans J, et al. Results from Australia’s 2018Report Card on Physical Activity for Children and Youth. J Phys ActHealth. 2018;15(suppl 2):S315–S317. doi:10.1123/jpah.2018-0418
108. Chang C-K, Wu C-L. Results from Chinese Taipei (Taiwan)’s 2018Report Card on Physical Activity for Children and Youth. J Phys ActHealth. 2018;15(suppl 2):S415–S416. doi:10.1123/jpah.2018-0555
109. Edwards LC, Tyler R, Blain D, et al. Results from Wales’ 2018Report Card on Physical Activity for Children and Youth. J Phys ActHealth. 2018;15(suppl 2):S430–S432. doi:10.1123/jpah.2018-0544
110. Paulo MS, Nauman J, Abdulle A, et al. Results from the United ArabEmirates’ 2018 Report Card on Physical Activity for Children andYouth. J Phys Act Health. 2018;15(suppl 2):S419–S421. doi:10.1123/jpah.2018-0543
111. Williams A, Whitman L, Le Page Y, Le Page C, Chester G, Sebire SJ.Results from theBailiwick ofGuernsey’s 2018Report Card on PhysicalActivity for Children and Youth. J Phys Act Health. 2018;15(suppl 2):S368–S369. doi:10.1123/jpah.2018-0539
JPAH 15 Supplement 2, 2018
S314 Aubert et al
Unauthenticated | Downloaded 01/26/22 11:20 AM UTC