Embed Size (px)
Citation preview
REPORT Approved FINAL B4008314
CESI S.p.A.
Via Rubattino 54
I-20134 Milano - Italy
Tel: +39 02 21251
Fax: +39 02 21255440
e-mail: [email protected]
www.cesi.it
Capitale sociale € 8.550.000 interamente versato
C.F. e numero iscrizione Reg. Imprese di Milano 00793580150
P.I. IT00793580150
N. R.E.A. 429222
© Copyright 2014 by CESI. All rights reserved
Mod.
RA
PP
v.
6
Client Arab Fund for Economic and Social Development (AFESD)
Subject Feasibility Study of the Electrical Interconnection and Energy Trade
Between Arab Countries
Executive Summary
Order Agreement between AFESD and CESI –Ref. Ref T/05-04-00/359 date 1.02.2012
Notes
Partial reproduction of this document is permitted only with the written permission from CESI.
N. of pages 25 N. of pages annexed
Issue date 12 March 2014
Prepared Kostandin Robo, Søren Lovstad Christensen, Donald Milligan, Ulderico Bagalini
Verified Bruno Cova
Approved Antonio Ardito
REPORT Approved FINAL B4008314
Page 2/25
REVISION HISTORY
Revision
Number
Date Protocol List of modified paragraphs
00 05/02/2014 B4002505 Pre-Final
01 12/03/2014 B4008314 Final
REPORT Approved FINAL B4008314
Page 3/25
Consultancy Services Related to the Feasibility Study of
the Electrical Interconnection and Energy Trade
between the Arab Countries
Table of Content of the Complete Report
Main Report
Executive Summary
Volume I Demand Forecast Generation Supply Options
- Volume I Appendix 1 Countries Demand Forecast and Generation Data
- Volume I Appendix 2 Natural Gas Data
- Volume I Appendix 3 Planning Memorandum Electricity
- Volume I Appendix 4 Planning Memorandum Gas
Volume II Electrical and NG Interconnections
- Volume II Appendix 1 Reviewing the outcomes of interconnection studies
Volume III Pan-Arab Interconnection Scenarios
- Volume III Appendix 1 Results BAU Scenario
- Volume III Appendix 2 Results Interconnection IC Scenario
- Volume III Appendix 3 Results Interconnection ICr Scenario
- Volume III Appendix 4 Results Interconnection NG Scenario
- Volume III Appendix 5 Definition of Preferred Scenario
- Volume III Appendix 6 Alternate Scenarios
- Volume III Appendix 7 Country Reports
Volume IV Electricity Trade and NG Feasibility (1st part)
- Volume IV Annex 1 Results Power Flow Analysis
Volume V Electricity Trade and NG Feasibility (2nd part)
- Volume V Part 1 Financial Analysis
- Volume V Part 2 Trade Model Electricity and NG
- Volume V Part 3 Implementation Plan
- Volume V Appendix 1 Trade Model
REPORT Approved FINAL B4008314
Page 4/25
EXECUTIVE SUMMARY
The main objectives and scope of this study include establishing a strategy and master plan to develop
the trade of energy among Arab countries, and determine the trade-offs between export of electricity
and/or natural gas. The objective was to address the adequacy of the planned generation system and
interconnected network to deliver the economic amount of electricity and gas trade necessary to fulfil
the objectives of the pan-Arab electricity trading market.
To this purpose, the best options for new electricity and gas interconnections were identified on the
basis of the electricity markets in the Arab countries, the investigation of practical scenarios for its
development, supported by techno-economic feasibility analysis of those scenarios. The study
investigated, evaluated and ranked all possible alternative scenarios to expand, expedite and reinforce
the interconnections among Arab countries. It clearly identified each economically feasible electrical
and natural gas project and estimated its cost. The horizon year of the analysis is 2030 and the study
period is 2012-2030.
The beneficiaries of the study are the members of the League of Arab States, the Electrical and
Natural Gas Authorities of the Arab Countries as well as policy makers, producers and consumers, in
the energy markets of the Arab Countries. Some Arab Countries, such as Syria and Lebanon did not
participate during the study development, but their power and NG sectors were part of the analysis.
The Pan Arab interconnected model of generation and interconnection expansion includes both
countries up to horizon year 2030.
DATA COLLECTION FOR ELECTRIC POWER, DEMAND AND
GENERATION SUPPLY OPTIONS AND FORMULATION OF PLANNING
CRITERIA
The study was based on an extensive data collection phase for electricity, natural gas national
generation and transmission development plans. Different activities were performed for data
consolidation including validation of provided data, site visits, and interactions with the focal points
and using reasonable assumptions for missing information.
Starting from the data base containing the up-to-date information of actual and expansion plans of the
generation system, electrical energy consumption profiles, the existing, under-construction and any
planned electrical interconnection projects, the current infrastructure for NG and information on NG
reserves in the region, four main study directions were pursued: demand forecast, transmission
network analysis, NG infrastructures characterization and power generation system planning. The
databases prepared at the end of data collection represented the basis for the execution of the
subsequent activities.
Electric Power System Sector
The collected information regarding the operation and planning of the transmission network and
generation system was based on the data gathered by planning questionnaires filled out by the Arab
countries. The Consultant performed a review of the existing national demand forecast available in the
Arab countries, the adopted forecast methodologies, key assumptions and overall results. The aim of
the electricity demand forecast was to determine the amounts of electricity demand in terms of energy

REPORT Approved FINAL B4008314
Page 5/25
consumption and peak demand, starting from year 2012 up to year 2030, as a key driver in planning
the generation capacity investment and the estimation of economic electricity exchanges.
The electricity demand forecast study provided the system peak power projections (MW) and the
electric energy projections (GWh) for each Arab Country. Under the baseline scenario, the Pan Arab
non-coincident peak power is expected to grow from 179,660 MW in 2012, to 446,481 MW in 2030,
with a compound annual growth rate (CAGR) of 5.12% during the 2012-2030 period. The gross
electric energy demand is expected to increase from 956,132 GWh in 2012, up to 2,458,519 GWh in
2030, a compound annual growth rate CAGR of 5.39%.
The Consultant also developed a planning memorandum, where the agreed and common to all
countries generation and transmission planning criteria are stated. The planning criteria of generation
system were based on least cost generation and interconnection expansion under NG supply
constraints.
The national generation master plans of each Arab country, partially provided for the planning period
(2012-2030), were revised and cross-checked for each country. Furthermore, the adequacy of the
expected capacity development plans was assessed over the planning period in order to validate the
input data of the least cost generation and interconnection expansion study.
Preliminary investigations were carried out to review the existing, under construction and potential
electric interconnections with the final objective of determining their adequacy to support the amount
of electricity trade up to horizon year 2030. The purpose of this screening analysis was to avoid the
iterations between the least-cost generation planning and the examination of the various electrical and
NG interconnection candidates, in order to achieve the best electric energy and NG trade scenario for
all Arab countries. Before conducting the screening analysis, which addresses the economic feasibility
of all identified new electrical interconnections, an assessment of the potential use of existing
interconnections for economic electricity exchanges was performed, adopting a simplified approach
based on the calculation of the average levelized cost of electricity production of each system. The
simulation results were used to evaluate the opportunity to exchange power and electrical energy
between interconnected countries. The selection was based on judgments regarding the expected
benefits of interconnection candidates related to reliability improvements, economics and operation
benefits.
After discussions with the country focal point representative about the feasibility of the
interconnection candidates, the list shown in Table 1 was agreed upon. The table lists the set of new
interconnections composing the Pan Arab interconnected system, the feasibility of which is examined
more in-depth in the subsequent analyses.
Table 1 List of the New Interconnection Links Included in the Model
Additional Interconnections/reinforcements Commissioning
year
1 Libya (Tobruk) - Egypt (Saloum) 500/400kV BtB + AC OHL 500 kV 2017
2 Tunisia (Bouchemma) - Libya (Rowis) AC OHL 400kV 2020
3 Saudi Arabia (Qurayyat) – Jordan (Qatranah) BtB + AC double circuit OHL 400 kV 2020
4 Saudi Arabia (Kudmi) – Yemen (Bani Hoshish) BtB + AC double circuit OHL 400 kV 2025
5 Iraq (Faw) - Kuwait (Subiya) AC double circuit OHL 400 kV 2020
6 Second circuit of Egypt (Taba) - Jordan (Aqaba) AC link 400 kV 2020
7 Second circuit of Jordan (Amman North) - Syria (Dir Ali) AC OHL 400 kV 2020
Natural Gas Sector
The interconnections in terms of both gas and electricity depend on the availability of adequate gas
resources to be consumed in power plants or exported for consumption in other countries.

REPORT Approved FINAL B4008314
Page 6/25
The first part of the study was focused on determining the availability of gas and, to this purpose
questionnaires were drafted, approved, and sent out to each participating country. To complement the
questionnaires visits were made in some of the key countries in the analysis, namely Kingdom of
Saudi Arabia and Qatar. Finally, whenever information in questionnaires was missing or not
submitted, evaluation was made by the Consultant relying on experience and publicly available and
renowned data sources.
The collection of data was focused on establishing an overview of the potential country reserves and
to make credible gas balances for each country taking production, export, import, and consumption
into account. The reserve data was found to be hard to obtain from producing countries, instead the
data obtained for the study showed very few differences indicating that all data at the end of the day in
all likelihood originated from one or few sources. Gas balance data were compiled from
questionnaires and public sources and showed that, many if not most non-producing countries would
experience gas deficits in the years to come. This would force electricity generation to use other
potentially more polluting and expensive fuels. If import could be made available this situation could
be alleviated. However, the study found that interconnections were restricted by a number of key
factors, such as local gas supply/demand and government policies on gas export. In particular the
government positions to export in the form of the moratorium on gas export in Qatar and the “no
connection policy” in Saudi Arabia restricted the potential set of opportunities for interconnections as
the two countries are the largest reserve holders in the Arab countries. Keeping the two countries’
reservations implied that the set of potential interconnections decrease and remain limited to gas
interconnections connecting Libya and Iraq with their neighbors. In these two countries production is
expected to surpass demand in only a few years leaving room for export of gas to the neighboring
Arab States.
The second part of the gas data analysis aimed for determine credible gas prices in each individual
Arab country for use in the simulation of the integrated electricity model. Estimation of the gas prices
relied on international gas prices in Japan, EU, and the US with the relevant transportation costs in the
transport chain to these markets deducted. This approach gives an estimate of the alternative
value/price of gas in the region.
Prices were found to follow the availability, thus high availability implied low prices and vice versa,
with the exception of prices in the North African countries, where countries are linked by pipelines to
the European markets.
The current infrastructure was used as a basis for both the gas balance and the price calculations. A
survey initiated at the beginning of the gas study revealed that the level of gas interconnections
between the countries is very limited. Only two interconnections existed, the Arab Gas Pipeline,
connecting Egypt, Jordan, Syria, Lebanon, and the Dolphin Pipeline connecting Qatar, the UAE, and
Oman. Based on the restrictions in gas interconnections and availability, the Consultant selected the
following interconnections for further analysis. The reduced list of interconnection projects includes
the following:
Algeria-Libya
Libya-Tunisia
Libya-Egypt
Egypt-Sudan
Iraq-Jordan
Iraq-Kuwait
Qatar-Egypt (only relevant when Moratorium in Qatar is lifted)
Qatar-Bahrain-Kuwait (only relevant when Moratorium in Qatar is lifted)
Morocco LNG
Bahrain LNG
REPORT Approved FINAL B4008314
Page 7/25
The above links were tested one by one along with the proposed electricity interconnections and the
projects giving the highest regional benefits were: Libya-Egypt, Iraq-Kuwait, and Bahrain LNG.
These links underwent a closer review in order to arrive at a preferred list of projects consisting of
five projects. In order to do this, a multi criteria model was utilized comparing the projects against
each other on four different categories: demand/supply, market development, maturity, and security of
supply.
The screening analysis of feasibility of the candidate of NG interconnection pipelines identified the
NG projects to be included in the regional priority plan of Pan-Arab Pipelines. The analysis resulted
in the recommendation of the following projects
Libya-Tunisia
Libya-Egypt
Iraq-Kuwait
Morocco LNG
Bahrain LNG
In the case of the Libya-Egypt pipeline the largest identified barrier at the moment is the lack of
incentives to produce gas. Gas is believed to be in abundance in Libya, and in order to exploit these
resources it is recommended to introduce a feed-in price for gas export to Egypt.
In the case of a pipeline Iraq-Kuwait to enable export from Iraqi fields to Kuwait would most likely
require some treatment.
PAN-ARAB ELECTRIC POWER AND NG INTERCONNECTION SCENARIOS
The Pan Arab Electrical and NG interconnected model was prepared considering existing and future
generation units and electrical and NG interconnections. The model includes 1,450 thermal power
plants of different technologies; 74 hydro power plants, 180 RES power plants of different
technologies, 39 electrical interconnections and 5 NG cross-border infrastructures. The simulations
were carried out with OPTGEN software package for the definition of the least cost planning as the
sum of investment plus expected value of operation costs of the Pan Arab interconnected power
system.
The Consultant elaborated five main scenarios and two additional scenarios as sensitivity cases. The
outcome of the analysis allowed the identification of a target scenario named the “Preferred
Scenario”, which represents the NG-constrained least cost investment schedule - sum of investment
plus expected value of operation costs - for the construction of new generation capacity and of
Electrical and NG interconnections. Two sensitivity scenarios were simulated, namely:
Alternative NG scenario based on the assumption of growth in the NG supply to Arab
countries by implementation of the Pan Arab Pipeline (PAP) in addition to an optimist
assumption that Qatar lifts the Moratorium;
Alternative ICr scenario based on a different strategic development of the Generation
Expansion Plan in Saudi Arabia making nuclear power and renewable energy an integral
part of a national sustainable energy mix.
The Business As Usual (BAU) Scenario was formulated as a self-sufficient national approach to
electricity power supply based on a strategy of using primarily national resources and maintaining the
current levels of NG consumption for power generation, i.e. no extra expansion on NG feed stocks
and electric regional interconnections. BAU scenario represented NG constrained least cost
generation investment plans based on the national expansion plans to meet national loads only. BAU
REPORT Approved FINAL B4008314
Page 8/25
scenario considered the base case load forecast assuming that no electricity exchanges occur between
the interconnected countries. The results of BAU scenario were used to establish a base point against
which the investment needs of all Arab countries were, and were compared combined in order to
maximize the use of their gas resources.
The Electrical Interconnection Scenario (IC Scenario) consists of NG constrained least cost
generation investment plans considering the economic usage of the existing and already decided
electric interconnections with emphasis on regional electricity trade and electricity import/export
without expanding or reinforcing the existing regional NG supply infrastructures.
The reinforced Electrical Interconnection Scenario (ICr Scenario) consists of NG constrained
least cost generation and electric interconnection investment planning considering the economic usage
of the existing, additional reinforcements, and new electrical interconnections with emphasis on
regional electricity trade and electricity import/export without expanding or reinforcing the existing
regional NG supply infrastructures.
The technical and economic evaluation of candidates allowed the selection the most profitable new
electrical interconnections given in Table 1, as part of the Pan Arab interconnected system for further
analysis.
The economic evaluation of the Tunisia – Libya interconnection line demonstrated that the project
was highly viable with an Economic IRR of 322%.
The economic evaluation of the Libya – Egypt electrical interconnection link demonstrated that the
project was highly viable with an Economic IRR of 91%.
The economic evaluation of the Saudi Arabia – Jordan electrical interconnection link demonstrated
that the project was viable with an Economic IRR of 40%.
The economic evaluation of the Iraq – Kuwait electrical interconnection line demonstrated that the
project was very viable with an Economic IRR of 1,201%.
The economic evaluation of the second circuit Egypt – Jordan interconnection link demonstrated that
the project was very viable with an Economic IRR of 184%. The extension of the second circuit from
Jordan to Syria was justified due to reliability improvements and extension of the electricity market in
the region.
The Natural Gas Interconnection Scenario (NG scenario) consists of NG constrained least cost
generation and NG cross-border infrastructures (pipelines and/or LNG) investment planning, with
emphasis on best options of power generation inside a country using the additional NG resources and
existing electric interconnections.
The optimum search for the “Preferred Scenario” was a combination of the simulation results of Pan
Arab Electrical and NG interconnected model and techno-economic feasibility analysis of a set of
near-optimum scenarios (ICr + pipelines and/or LNG).
The “Preferred Scenario” considered the benefits originating from economic electricity exchanges and
viable economic NG transport projects. In order to arrive at the optimal solution of NG and electricity
scenario, the NG projects were introduced one by one into the electricity scenario finding the best
match. This meant that 11 different simulations were run with various combinations of gas
interconnections. The interconnection combination yielding the highest benefit to the Arab countries
was found to be:
“Integrated electricity” scenario (ICr) and the following NG projects:
NG cross-border Libya-Egypt pipeline in 2018.
NG cross-border Iraq-Kuwait pipeline in 2017.
LNG Terminal in Bahrain in 2018
REPORT Approved FINAL B4008314
Page 9/25
These projects were investigated further with a focus on potential trade model, financing, and
implementation.
The Economic evaluation of the Libya – Egypt Project is demonstrated to be highly feasible with an
Economic IRR of 106%. The NG Project has an inter-regional impact on Arab power sector.
The Economic evaluation of the Iraq-Kuwait Project demonstrated that the NG Project has a regional
impact and is highly feasible with an Economic IRR of 226%.
The Economic evaluation of the LNG Terminal Project in Bahrain demonstrated that it is feasible
with an Economic IRR of 49.5%. The NG Project is an important project not only for the country but
also for the entire GCC region.
The comparison of capital cost and operation costs for power generation projects such as future
thermal, hydro and renewable energy projects and including the interconnection projects was carried
out for all scenarios.
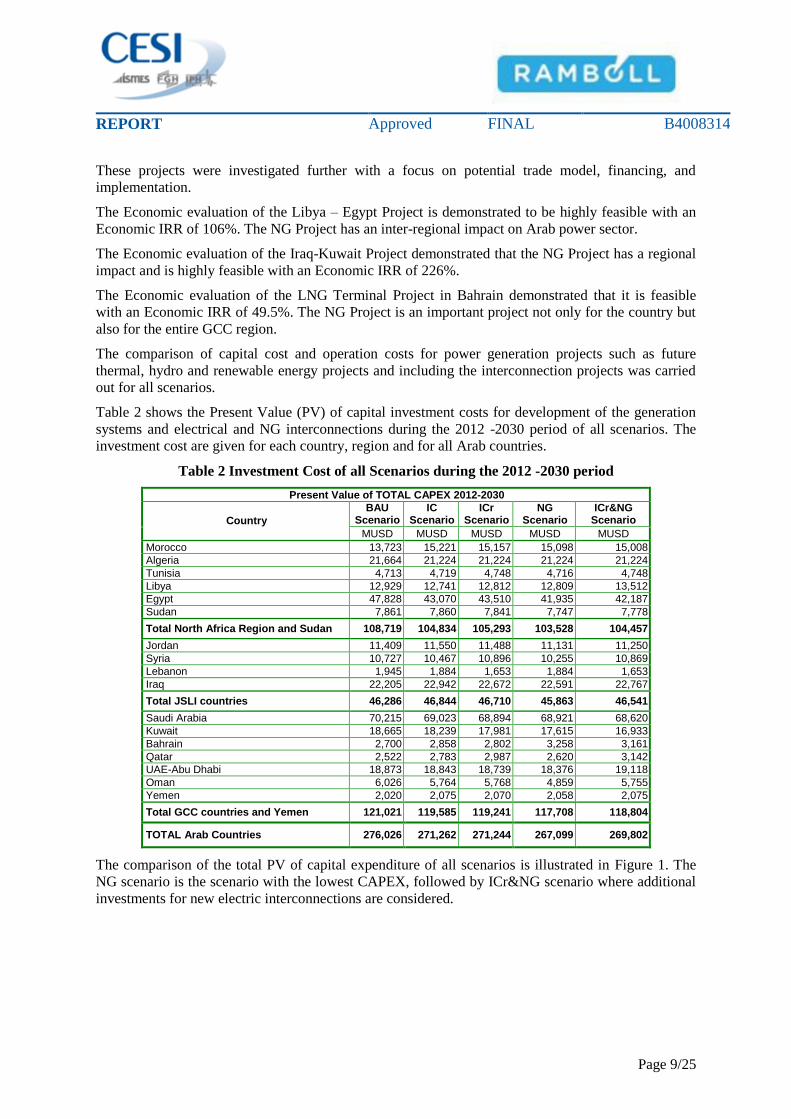
Table 2 shows the Present Value (PV) of capital investment costs for development of the generation
systems and electrical and NG interconnections during the 2012 -2030 period of all scenarios. The
investment cost are given for each country, region and for all Arab countries.
Table 2 Investment Cost of all Scenarios during the 2012 -2030 period
Present Value of TOTAL CAPEX 2012-2030
Country
BAU Scenario
IC Scenario
ICr Scenario
NG Scenario
ICr&NG Scenario
MUSD MUSD MUSD MUSD MUSD
Morocco 13,723 15,221 15,157 15,098 15,008
Algeria 21,664 21,224 21,224 21,224 21,224
Tunisia 4,713 4,719 4,748 4,716 4,748
Libya 12,929 12,741 12,812 12,809 13,512
Egypt 47,828 43,070 43,510 41,935 42,187
Sudan 7,861 7,860 7,841 7,747 7,778
Total North Africa Region and Sudan 108,719 104,834 105,293 103,528 104,457
Jordan 11,409 11,550 11,488 11,131 11,250
Syria 10,727 10,467 10,896 10,255 10,869
Lebanon 1,945 1,884 1,653 1,884 1,653
Iraq 22,205 22,942 22,672 22,591 22,767
Total JSLI countries 46,286 46,844 46,710 45,863 46,541
Saudi Arabia 70,215 69,023 68,894 68,921 68,620
Kuwait 18,665 18,239 17,981 17,615 16,933
Bahrain 2,700 2,858 2,802 3,258 3,161
Qatar 2,522 2,783 2,987 2,620 3,142
UAE-Abu Dhabi 18,873 18,843 18,739 18,376 19,118
Oman 6,026 5,764 5,768 4,859 5,755
Yemen 2,020 2,075 2,070 2,058 2,075
Total GCC countries and Yemen 121,021 119,585 119,241 117,708 118,804
TOTAL Arab Countries 276,026 271,262 271,244 267,099 269,802
The comparison of the total PV of capital expenditure of all scenarios is illustrated in Figure 1. The
NG scenario is the scenario with the lowest CAPEX, followed by ICr&NG scenario where additional
investments for new electric interconnections are considered.

REPORT Approved FINAL B4008314
Page 10/25
Figure 1 Comparison of the Total Investment Cost (CAPEX)
Table 3 shows the PV of OPEX during the 2012 -2030 period of all scenarios. The operation costs are
given for each country, region and for all Arab countries.
Table 3 Operation Cost of all Scenarios during the 2012 -2030 period
Present Value of TOTAL OPEX 2012 - 2030
Country
BAU Scenario
IC Scenario
ICr Scenario
NG Scenario
ICr&NG Scenario
MUSD MUSD MUSD MUSD MUSD
Morocco 21,582 23,414 24,225 23,201 24,334
Algeria 50,882 46,537 46,613 46,547 46,663
Tunisia 16,768 16,564 16,684 16,790 16,635
Libya 45,629 46,687 47,880 46,743 47,657
Egypt 192,611 193,376 192,336 173,266 176,492
Sudan 7,184 7,096 7,042 6,160 6,450
Total North Africa Region and Sudan 334,657 333,675 334,781 312,707 318,231
Jordan 19,607 20,277 20,955 21,751 20,227
Syria 60,061 61,089 52,025 57,999 51,176
Lebanon 16,651 15,532 15,702 15,454 15,599
Iraq 56,600 58,125 63,706 61,652 63,631
Total JSLI countries 152,920 155,023 152,389 156,856 150,633
Saudi Arabia 360,965 355,726 353,558 325,321 352,321
Kuwait 97,732 87,420 85,075 79,096 79,294
Bahrain 19,413 21,511 17,884 17,358 14,938
Qatar 22,009 25,594 27,690 25,611 27,825
UAE Abu Dhabi 84,455 87,923 89,902 88,428 90,582
Oman 19,184 19,726 20,174 18,419 19,482
Yemen 21,184 20,070 20,058 19,181 20,026
Total GCC countries and Yemen 624,942 617,970 614,341 573,415 604,468
TOTAL OPEX of Arab Countries (BUSD)
1,112.5 1,107 1,102 1,043 1,073
Figure 2 illustrates the total operation costs in the five scenarios. A reduction of costs in all scenarios,
compared with the baseline scenario, can be noted, due to two main factors: a) reduction of operation
cost as a result of electricity exchanges, and b) reduction of operation costs resulting from the use of
additional NG.

REPORT Approved FINAL B4008314
Page 11/25
Figure 2 Comparison of the total PV of OPEX of scenarios
Figure 3 illustrates the total electric energy exchanges of the Arab countries for the 2012 – 2030
period in all scenarios. The impact of new investment in electric interconnections is noted in the
graphs as an increase of total electricity exchanges in the ICr and ICr&NG scenarios. The benefits
from using additional transfer capabilities of new interconnections for economic power exchanges are
quantified as saving from operation costs, improved utilization of the generation capacities, and
reduction of installed capacities.
Compared with the Integrated Electrical Scenario (IC and ICr), the Preferred Scenario shows a
remarkable reduction of total costs (operation costs and capital disbursement costs) related to least
cost generation expansion and development of cross-border interconnections (electrical and NG) of
the Arab countries.
Figure 3 Comparison of the Total Regional Exchanges in all Scenarios

REPORT Approved FINAL B4008314
Page 12/25
Figure 4 shows the total CO2 emissions due to electricity generation in the Arab countries during the
period 2012-2030. The total CO2 emission is lowest in NG scenario 17,457 Mton and highest in BAU
scenario 18,417 Mton. The distribution of the total CO2 emissions among the regions of the Arab
countries in ICr&NG scenario is as follows: 28.3% in the North Africa region (including Sudan),
14.5% in the JSLI region, and the remaining 57.2% in the GCC region (including Yemen). The
reduction of the total carbon dioxide emissions constitutes one of the additional benefits of the
economic exchanges of electricity among countries and interconnection mode of operation in the
preferred scenario.
Figure 4 Total CO2 emissions by Power Generation in Arab Power Sector
The “Preferred Scenario” showed outstanding advantages, with respect to the IC scenario, that were
quantified in 35,493 MUSD as reduction of total costs (PV of OPEX and capital disbursement costs)
over the study period 2012-2030. The largest share of savings derives from the OPEX
(33,336 MUSD), coming from additional NG supplies and the increase of economic electric energy
exchanges. The reduction of CAPEX was quantified as 1,460 MUSD.
Furthermore, additional environmental benefits were assessed in terms of reduction of carbon dioxide
emissions, which are estimated in 708 millions of CO2 tons. Assuming the CO2 price at a level of 15
USD/t the total environmental benefit was quantified in 10,617 MUSD.
The least cost generation-interconnection expansion plan worked out in the “Preferred Scenario”
entails an increase in the consumption of NG, which attains 136,993 Tbtu with respect to 126,681
Tbtu estimated in the IC scenario.
The above benefits were achieved by constructing three new NG infrastructures and eleven new
electricity cross-border transmission lines.
Finally, it is worth mentioning that additional benefits from and integrated electricity and NG trade
with the Arab countries can be attained by adding new NG transport infrastructure as shown in the
NG scenario. Nevertheless the recommended scenario is the Preferred Scenario and not NG scenario.
The reason is because many of the assumptions made for the NG scenario, derived from available
public information and are outcomes of expert understanding, not validated or endorsed by the Arab
countries. Hence, the NG scenario should be rather considered as a challenge to evaluate the possible
evolution of the electricity production and electricity exchanges under improvement of NG supplies
REPORT Approved FINAL B4008314
Page 13/25
conditions in Arab countries. Instead the “Preferred Scenario” (ICr & NG Scenario) was agreed to be
the recommended scenario, being the related new electrical and NG infrastructures considered
feasible also from the implementation plan point of view.
FEASIBILITY OF ELECTRICAL ENERGY TRADING AND POWER
EXCHANGES BETWEEN THE ARAB COUNTRIES
The feasibility of electrical energy trading was carried out using as input data, the findings of the
Preferred Scenario. The feasibility of electrical energy trading and power exchanges between the Arab
countries and with the neighboring regions was investigated based on identified potential electrical
energy trading among Arab countries. Also assessment of the transmission adequacy was performed
investigating whether or not the transmission system is sufficiently sized to accommodate the
potential imports and exports resulting from the various national power balances, and the
recommendations to improve the reliability of the interconnected power system.
Market Simulations
The results of analysis regarding the optimal hourly operation schedule of the interconnected system
were obtained by Electricity Market Simulator calculating the optimal operation schedule of the
interconnected system for four target years: 2015, 2020, 2025 and 2030. Detailed market simulations
provided improvement of the planning solution because the operation of the power system was
investigated hour by hour; namely the impact on the electrical system of hourly demand profile and
hourly power exchanges, RES production and technical restrictions of power plants. The PROMED
software tool was used for detailed analysis on an hourly basis.
Simulations of annual operation of selected years allowed the Consultant to quantify the expected
annual energy and power exchanges (hourly based) between the Arab countries and with the
neighboring regions. Thanks to the simulations, the Consultant updated the generation investments
plan, previously obtained with OPTGEN, in target year 2030 for Algeria, Morocco, Sudan and Syria.
The simulation results underlined the need for additional generation in these 4 countries. These
updates were necessary to manage the non-programmable production of RES and the most stressing
peaks of load. Market simulations showed that the most remarkable events in the pan-Arab power
system are:
Investments in Nuclear power plants lead to a decrease in the cost of energy. Countries that
benefit from these investments were Egypt and Jordan.
Investments in renewable energies lead to a decrease in the cost of energy. Nevertheless, it is
important to underline that a high share of RES generation requires more investments in new
additional thermal generation, in order to manage uncertainty and variability of the primary
resources.
Investments in new electrical interconnections and NG infrastructures lead to a decrease in the
energy prices and costs of electricity.
The sensitivity analyses were performed for four additional scenarios starting from the ICr&NG year
2030 scenario, investigating the interconnection of the pan-Arab region to other countries, such as
Spain, Turkey and Iran.
Model of Pan Arab interconnected system
The objective of the Consultant was to set up a common data base for the transmission network
including all Arab data bases for the target years 2015, 2020, 2025 and 2030. The transmission network
REPORT Approved FINAL B4008314
Page 14/25
models for year 2015, 2020, 2025 and horizon year 2030 constituted reference base cases for network
analysis and the evaluation of technical alternatives of interconnection developments regarding
adequacy and security of the interconnected transmission systems.
A detailed model of transmission network in PSS/E computation tool was set up representing the Pan
Arab interconnected grid from Morocco to GCCIA and Yemen, while considering the location of the
load centers and the power plants. The model of the network was enhanced passing from super-nodes
model representing each Arab country with its demand, the generation mix and its interconnections
used in OPTGEN simulations, to the explicit detailed transmission network model for interconnected
countries with thousands of nodes, loads, internal lines, transformers, generators, etc.
Power Flow Analysis
The reliability and security criteria of the Planning Memorandum, based on fundamental requirements
for planning reliable interconnected bulk electric systems, were adopted in the evaluation of the
adequacy of the transmission network in all Arab countries. At the regional level, the transmission
system adequacy analysis was focused on the interconnections and on the internal lines, which have a
direct effect on the power exchanges.
The power flow studies calculated active and reactive flows on transmission lines and transformers,
the overall voltage profile of the transmission network, bus voltage magnitudes and phase angles, line
currents, line losses, violation of generation capability limits, and other steady-state variables, related
to the expected characteristic network operating conditions for the target years.
The steady state power flow study addressed the implementation of economic dispatch of generation
units and its impact on the network model of Pan Arab interconnected system taking into account the
introduction of the new interconnections. The study assessed the expected cross-border power
exchanges in peak load conditions.
The analysis of the future national networks showed that, in general, the branches of EHV/HV
network were loaded typically less than their thermal limits. In some countries reinforcements of the
internal network would be needed, such as in case of Saudi Arabia, Abu Dhabi, Kuwait, Bahrain and
Iraq. Some corrections to the optimal power dispatch, for example in Egypt, Bahrain, Jordan and
Iraq, were necessary to make the dispatch feasible in compliance with the transmission network
constraints.
Transfer Capacity of Interconnection Corridors among Arab Countries
The Consultant performed the Transmission Transfer Limit Analysis in order to evaluate the adequacy
of the national and regional transmission systems and their ability to transport the power from
exporting to receiving countries. This was done to estimate the maximum level of power that can be
transferred across a network from identified sending and receiving areas or systems. Limits were
estimated for both normal and contingency conditions.
The analysis quantified the Total Transfer Capacities (TTC) for each pair of interconnected Arab
countries in target years, 2020, 2025 and 2030 for two situation of the internal network of each Arab
country: in N condition and in N-1 condition.
For determination of network response, the increased generation in exporting country was simulated;
its impact on transmission line flows was monitored, and the maximum transfer was found as the
limiting solution that satisfied the thermal criteria. This was done for the base case with normal limits
enforced (N conditions), plus all specified contingencies with emergency limits enforced (N-1
conditions).
The values of TTCs were reported for each pair of interconnected Arab Countries. The estimated
transfer capacity took in consideration the initial power transferred between two countries, the
REPORT Approved FINAL B4008314
Page 15/25
maximum incremental power transfer from country A to country B (and vice-versa) and the network
element which constrains the transfer due to its overload.
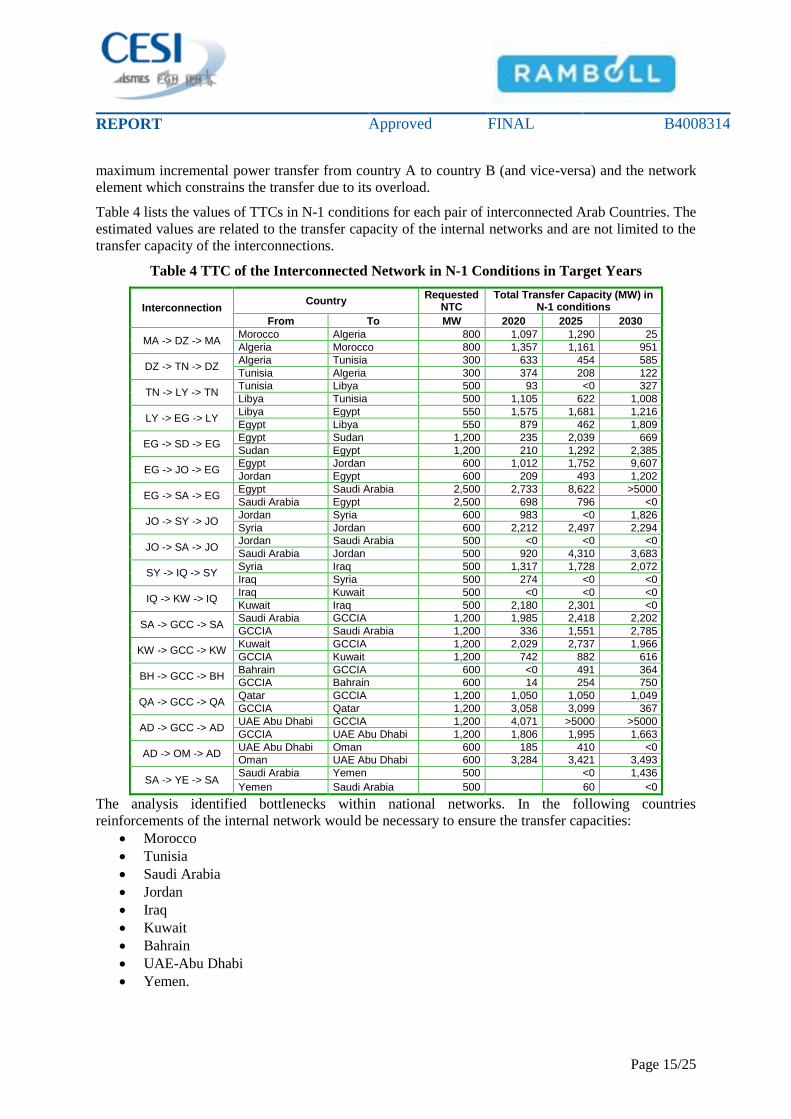
Table 4 lists the values of TTCs in N-1 conditions for each pair of interconnected Arab Countries. The
estimated values are related to the transfer capacity of the internal networks and are not limited to the
transfer capacity of the interconnections.
Table 4 TTC of the Interconnected Network in N-1 Conditions in Target Years
Interconnection Country
Requested NTC
Total Transfer Capacity (MW) in N-1 conditions
From To MW 2020 2025 2030
MA -> DZ -> MA Morocco Algeria 800 1,097 1,290 25
Algeria Morocco 800 1,357 1,161 951
DZ -> TN -> DZ Algeria Tunisia 300 633 454 585
Tunisia Algeria 300 374 208 122
TN -> LY -> TN Tunisia Libya 500 93 <0 327
Libya Tunisia 500 1,105 622 1,008
LY -> EG -> LY Libya Egypt 550 1,575 1,681 1,216
Egypt Libya 550 879 462 1,809
EG -> SD -> EG Egypt Sudan 1,200 235 2,039 669
Sudan Egypt 1,200 210 1,292 2,385
EG -> JO -> EG Egypt Jordan 600 1,012 1,752 9,607
Jordan Egypt 600 209 493 1,202
EG -> SA -> EG Egypt Saudi Arabia 2,500 2,733 8,622 >5000
Saudi Arabia Egypt 2,500 698 796 <0
JO -> SY -> JO Jordan Syria 600 983 <0 1,826
Syria Jordan 600 2,212 2,497 2,294
JO -> SA -> JO Jordan Saudi Arabia 500 <0 <0 <0
Saudi Arabia Jordan 500 920 4,310 3,683
SY -> IQ -> SY Syria Iraq 500 1,317 1,728 2,072
Iraq Syria 500 274 <0 <0
IQ -> KW -> IQ Iraq Kuwait 500 <0 <0 <0
Kuwait Iraq 500 2,180 2,301 <0
SA -> GCC -> SA Saudi Arabia GCCIA 1,200 1,985 2,418 2,202
GCCIA Saudi Arabia 1,200 336 1,551 2,785
KW -> GCC -> KW Kuwait GCCIA 1,200 2,029 2,737 1,966
GCCIA Kuwait 1,200 742 882 616
BH -> GCC -> BH Bahrain GCCIA 600 <0 491 364
GCCIA Bahrain 600 14 254 750
QA -> GCC -> QA Qatar GCCIA 1,200 1,050 1,050 1,049
GCCIA Qatar 1,200 3,058 3,099 367
AD -> GCC -> AD UAE Abu Dhabi GCCIA 1,200 4,071 >5000 >5000
GCCIA UAE Abu Dhabi 1,200 1,806 1,995 1,663
AD -> OM -> AD UAE Abu Dhabi Oman 600 185 410 <0
Oman UAE Abu Dhabi 600 3,284 3,421 3,493
SA -> YE -> SA Saudi Arabia Yemen 500 <0 1,436
Yemen Saudi Arabia 500 60 <0
The analysis identified bottlenecks within national networks. In the following countries
reinforcements of the internal network would be necessary to ensure the transfer capacities:
Morocco
Tunisia
Saudi Arabia
Jordan
Iraq
Kuwait
Bahrain
UAE-Abu Dhabi
Yemen.

REPORT Approved FINAL B4008314
Page 16/25
FINANCIAL ANALYSIS OF SELECTED INTERCONNECTIONS
The objective of the task was to highlight the financial aspects of the selected NG and electric
interconnection options. For this purpose the input data are the findings of the Preferred Scenario
simulations.
Financial Analysis of Selected NG Project
As a result of the multi-criteria analysis (demand & supply balance, security of supply, market
development and maturity of the project), and following analysis of synergies between the identified
NG projects and the electricity interconnection scenario, three NG projects were identified for further
studies:
An interconnection between Libya and Egypt, with investment costs 1,980 MUSD;
An interconnection between Iraq and Kuwait with investment costs 330 MUSD; and
A LNG import terminal in Bahrain with investment costs 611 MUSD.
For the gas projects it is evident that in order to succeed, intergovernmental agreements must be made
between the involved countries. To achieve this detailed feasibility studies must be carried out.
The financing structure of these projects was discussed and presented, with focus on the sources of
financing and the applied practice in financing of other gas infrastructure projects. It was found that
several regional banks, Arab developments funds, and international finance institutions already have
participated in financing of the existing regional pipelines, the Arab Gas Pipeline and the Dolphin
pipeline. These experiences where utilized in defining the potential financing structure. The applied
financing structure assumes a 70/30 debt/equity split and real returns of 4% and 10% respectively.
Regarding ownership of the pipelines it was recommended that the national companies took a
majority share and role in the projects - potentially supplemented by participation from regional or
international companies with interests in, and benefits from transport of gas.
The projects are at a relatively early stage in the project cycle thus, the financing analysis for the
natural gas projects were aimed at demonstrating feasibility with respect to the following points:
generate sufficient revenues to cover operating costs, financing costs and the costs of on-
going maintenance/asset replacements;
meet necessary returns for equity holders and lenders;
implement the project and maintain acceptable tariffs to end users
For each project, balancing tariffs were calculated with the objective of limiting project costs and
impacts on the end-users to the greatest extent possible. In this context a NPV=0 approach was
deemed most appropriate in determining tariff levels. That is, a breakeven surcharge (per MMBTU
gas) that allows for full cost recovery of all annual operating, maintenance and debt service costs
throughout the planning period and allows for sufficient returns to equity providers. Based on costs of
approximately 2,000 MUSD, 330 MUSD, and 611 USD, respectively for Libya-Egypt, Iraq-Kuwait,
and LNG import terminal in Bahrain, the tariffs for usage of the infrastructure for the projects were
estimated to 0.44 USD/MMBTU (Libya-Egypt), 0.12 USD MMBTU (Iraq-Kuwait), and 0.65
USD/MMBTU (LNG terminal Bahrain). At the end of the day, the projects’ feasibility will depend on
the ability of end users to pay tariffs within these ranges. Compared to the economic prices of gas, the
above transportation costs were found to be small. Thus it is anticipated that the three projects will be
feasible in terms of affordability. Both the cost and the exact transport volume must, however, be
further detailed and updated in a full scale feasibility studies.

REPORT Approved FINAL B4008314
Page 17/25
Regarding the structure and ownership of the pipelines both pipelines are envisaged to start out with a
special purpose vehicle structure and later to be divided into two coordinated national projects.
However, in the startup phase it is of importance that the companies on both sides of the borders come
together to take the necessary decisions and define the project structure and the feasibility study to be
undertaken. In order to maximize the probability of the projects being implemented, a strong leading
partner preferably with upstream interests is needed.
Financial Analysis of Selected Electrical Interconnections
The analysis of the financial schemes for cross-border interconnector investment covered alternative
project financing plans, and determined for each project its’ financial rate of return and the overall
financial performance for the involved parties, as well as the return on equity in order to ensure the
financial/commercial viability of the projects.
The electrical alternatives were selected and analyzed in previous tasks, which showed that they were
economically and socially beneficial, but this does not mean that interconnection links will be built
unless proper financial incentives that adequately remunerate the project are put in place.
In case of constructing a new interconnector, the basic question is the decision to find financing
resources and the distribution of costs of the interconnection between different parties through
transmission and/or national grid tariffs. The study indicated several alternative ways to find a solution.
We recommend making use of the regulated investment approach for new interconnectors between the
Arab countries. Under the regulated investment approach, generally the organizations responsible for the
development of the cross-border capacity are the Transmission System Operators (TSOs) which
following appropriate cost-benefit analysis, decide to build interconnection links to mitigate the
congestion in transfer capacities for cross-border trade. The investment should be approved by the
relevant national Authorities (Ministry and/or Regulators) who determine the amount of the investment
that is subject to the "regulated" remuneration (Regulated Asset Base -RAB) and the Rate of Return
(RoR, or WACC) applied to the RAB. The cost of a project is usually recovered through regulated
tariffs charged to users of the whole system.
There are a number of International Financial Institutions (IFIs) which could be interested in co-
financing the electrical interconnection infrastructure. In particular, one of the priorities of the AFESD
is to promote electricity trade by energy exchanges and the loans to finance Inter-Arab Projects in the
past included several electric power cross-border interconnection projects.
The Consultant developed a financial model for analyzing the financial performance for each of the
interconnection projects. The financial analysis examined the financial viability and financial
performance of the identified interconnection projects. The financial model takes into account the
capital structure (debt /equity), annual required revenues, financing charges and taxes paid. The
project profitability and its financials indices such as financial IRR, NPV expected return on equity
and PBP that were evaluated over the lifetime of each interconnection projects.
For a given interconnection project the initiative to build new infrastructure may come from two
involved TSOs of both countries. The new interconnector can be realized as a public-private
partnership (PPP) as a mix of public investment and private investment. The ownership of the
interconnection should optimally be a mix of the private investment that holds something less than
simple majority, two involved TSOs of both countries and possibly International Financing
Institutions. The model was implemented in the form of Consortium or Joint Venture through the
establishment of a dedicated company, a Special Purpose Vehicle (SPV) among Private Investors and
TSO(s) and International Financing Institutions that participate directly as shareholder of the SPV.
Table 5 shows the main outputs of the Differential Financial Analysis. For each project the table shows
the estimated investment cost and its financials indices such as financial IRR, NPV expected return on

REPORT Approved FINAL B4008314
Page 18/25
equity and PBP. All the projects are financially viable and the financial projection for each project
shows values of Equity IRR higher than the Expected Equity Remuneration (12%).
Table 5 Results of Financial Analysis of Selected Electrical Interconnections
Nr New Interconnections / reinforcements CAPEX
IRR Before-Finance, Pre
Tax
IRR Before Finance, Post Tax
Average Debt Service
Cov. Rate
Equity NPV
Equity IRR
PBP
MUSD % % % MUSD % Year
1 Libya (Tobruk) - Egypt (Saloum) BtB + AC OHL 500 kV
267.45 11.19% 10.07% 126.90% 357.71 15.14% 14.2
2 Tunisia (Bouchemma) - Libya (Rowis) AC OHL 400kV
112.00 11.23% 10.06% 126.61% 138.41 15.49% 13.7
3 Second circuit of Egypt (Taba) - Jordan (Aqaba) AC link 400 kV
61.42 14.80% 12.74% 197.05% 79.36 24.27% 6.2
4 Second circuit of Jordan (Amman North) - Syria (Dir Ali) AC OHL 400 kV
60.41 11.12% 9.74% 124.62% 60.36 18.12% 13.3
5 Iraq (Faw) - Kuwait (Subiya) AC double circuit OHL 400 kV
60.015 12.14% 10.81% 148.85% 188.26 18.04% 10.7
6 Saudi Arabia (Qurayyat) – Jordan (Qatranah) BtB + AC double circuit OHL 400 kV
134.44 12.14% 10.81% 148.85% 188.26 18.04% 10.7
7 Saudi Arabia (Kudmi) – Yemen (Bani Hoshish) BtB + AC double circuit OHL 400 kV
383.27 10.70% 9.56% 121.39% 405.81 13.77% 10.6
BILATERAL AND MULTILATERAL TRADE MODEL
Electricity Cross-border Trading Model
The Consultant presented a model for fair compensation of the TSO facing power transits deriving from
the electric energy trade between Arab countries, and provided rules for congestion management. The
results of a “dry-run” implementation of the proposed Inter TSO Compensation (ITC) mechanism were
presented for a sample year.
The definition of a bilateral/multilateral trading model is of paramount importance. Indeed, so far the
lack of clear trading models between Arab Countries (especially in the Mediterranean Arab Countries)
hindered the exchange of electricity causing poor exploitation of the existing interconnections. The
exploitation rate of interconnections between the Mediterranean Arab Countries in the actual situation
is below 10% of their NTC (Net Transfer Capacity). Furthermore, in some cases interconnections are
exploited only for mutual support with remuneration in kind.
As a matter of fact, the lack of common rules was considered as the major barrier for Cross Border
Trading (CBT) among Arab Countries. Lengthy negotiations for power wheeling across a third
country delayed or even prevented cross border trading and actually, the agreements are negotiated
separately between the concerned parties. In general, to foster CBT, clear rules are needed for:
Inter-TSO compensation
Capacity allocation (CA) across interconnectors;
Congestion Management (CM).
Actually, in the Arab region, just the Gulf Cooperation Council (GCC) is nearing the “launch pad” of
the Electricity Market integrating the power systems of Saudi Arabia, Kuwait, Bahrain, Qatar, the
United Arab Emirates and Oman. To this purpose, an initial analysis of the market was proposed in
this study referring to the previous studies performed by the GCC Interconnection Authority.

REPORT Approved FINAL B4008314
Page 19/25
Concerning equal access to information and transparency, it is worth recalling that at present, not even
the NTC between countries are published. Thus, some steps can be undertaken immediately, e.g.:
publishing of the NTC, the hourly power flows and the procedure adopted for network access.
The final objective is the identification of a CBT model applicable to the Arab countries for the
trading of electric energy. After examination of the possible models for bilateral/multilateral energy
trading, the Consultant elaborated a model for the fair compensation of the TSO facing power transits
deriving from the electric energy trade between the Arab countries. This model takes into account the
use of the network assets affected by the energy transactions as well as their annualized cost and
including their depreciation. The mechanism for the settlement of the inter-TSO compensations was
also addressed.
The Consultant recommended that, considering the geographical proximity and the trend towards the
full integration of the Arab regional power systems with Europe, the experience developed in Europe
since the year 2000 within ENTSO-E and its predecessors can be fruitfully exploited and taken as a
reference. It is worthwhile to mention that generally, when describing how the fund for the inter-TSO
compensation is financed, it may be necessary to define different types of countries for which
different fees could be proposed:
ITC Party – A country which is a member of the ITC Agreement.
Internal ITC Parties – An ITC Party not having any electrical border to any Perimeter
Country.
Perimeter Country – A country, which is not party to the ITC Agreement, but which has an
electrical border to an ITC Party.
Edge Country – An ITC Party which has at least one electrical border with a Perimeter
Country.
Perimeter flows should contribute to the fund by paying an annual, ex-ante defined fee for their
imports and exports of electricity into/from the ITC area.
In addition, to better define the framework fund for compensation, a financial institution that provides
clearing and settlement services for securing transactions, needs to be constituted. This institution,
where members of each Arab Country should be represented, will assume the role of a “clearing
house” with the obligation of guaranteeing the transfer of compensation to the recipient TSOs.
Finally, the Consultant proposed a time schedule of the setting up of rules for the cross-border trading
(CBT) of electricity based on the evolution of CBT procedures towards more market oriented
solutions (explicit actions, implicit auctions, market coupling, daily auctions, etc.).
NG Cross-border Trading Model
From a natural gas perspective, the most important part of a trade model is the creation of
fundamentals and institutions which facilitate a breakdown of the physical and institutional barriers
which today prevent gas from being produced and traded between countries.
In the case of the Libya-Egypt pipeline the largest identified barrier at the moment is the lacking
incentives to produce gas. Gas is believed to be in abundance in Libya and in order to utilize these
resources, which Libya is believed to possess, it is recommended to introduce a feed-in price for gas
export to Egypt. A price which at one hand gives an incentive for producers to engage in exploration
of gas and reduce flaring, and on the other hand allows the buying entity to earn a profit on
transporting and reselling the gas to shippers on the Egyptian side. It is recommended that the NOC
takes the role of national gas exporter, following the same practice applied in Algeria
(SONATRACH) and Russia (GAZPROM).
REPORT Approved FINAL B4008314
Page 20/25
In the case of Iraq-Kuwait to enable export from Iraqi fields to Kuwait, it would most likely require
some treatment. Current treatment possibilities in the south are limited to the treatment facilities
owned by Basrah Gas Company (BGC). It is not known whether any spare capacity exist at this
facility, furthermore third party access is in most likelihood not permitted. Thus for export to take
place treatment capacity must be made available.
The preferred contract structure for the pipelines is take or pay contracts ensuring income for a
minimum share of the capacity – this would lower risks and ensure cheaper financing. Sale of gas in
both pipeline projects should be made on commercial terms under the restrictions that the feed-in
price should be high enough to facilitate production of gas in both Libya and Iraq, while at the same
time low enough to compete with alternative sources of gas and energy in Egypt and Kuwait.
For the LNG terminal in Bahrain, it should be noted that work already is being undertaken with
regards to costing and siting of the terminal. The detailed feasibility study should build on this
information. The ownership of the terminal is best placed with the State but other commercial entities
such as shippers or large consumers may also have an interest in participating. International
companies could have a role since the construction and the operation of the terminal is relatively
complex and requires expert knowledge.
A key point to consider with regard to the ownership structure and the operational mode is the risk of
not selling enough capacity to cover the cost of the terminal. In particular it should be noted that the
project could be competing with pipeline import from Qatar, if the Moratorium on gas export is lifted.
In order for the project developers to alleviate this risk, it is recommended that long term capacity
contracts are signed. In this respect the state could have an important role - through one of its
subsidiaries it could place long term capacity bookings in the terminal and potential reserve some of
the storage capacity for security of supply and strategic purposes This could contribute both to project
economics but also to the security of supply in Bahrain, thus imposing a uniform security of supply
tariff on all consumers should be considered. The most appropriate operational mode of the terminal
was concluded to be a tolling facility. A tolling facility would be less risky than a merchant facility as
the operator does not own the gas but merely sells the capacity to interested parties. Due to the lower
level of risk financing would also become less expensive.
IMPLEMENTATION PLAN
Finally the study proposed suitable implementation plans estimating the total cost and time schedule
for various implementation stages of all proposed interconnections among Arab countries both
electric and NG.
Time Schedules of NG Cross-border Projects
The report presented a conceptual timeline for planning and constructing the natural gas pipelines and
the related facilities. The overall timeline spans several years, from the start of project planning to
mechanical completion, commissioning and commencement of commercial operations (first gas
deliveries). The plan is premised on a success-case schedule, i.e. it is based on the assumption that
each major activity will be successfully completed in a timely manner. The key underlying premises
to this schedule are:
Fast and clear definition of ownership of the projects.
There are no unanticipated delays in gaining access and obtaining key permits/approvals for
all components of the project scope; and
REPORT Approved FINAL B4008314
Page 21/25
project sanction, which triggers most procurement and construction spending, is contingent on
receiving access and key permits/approvals.
If some issues arise or unanticipated delays occur, the schedule would be extended accordingly.
During project planning, the participants need to do additional work to establish a more definitive
project timeline.
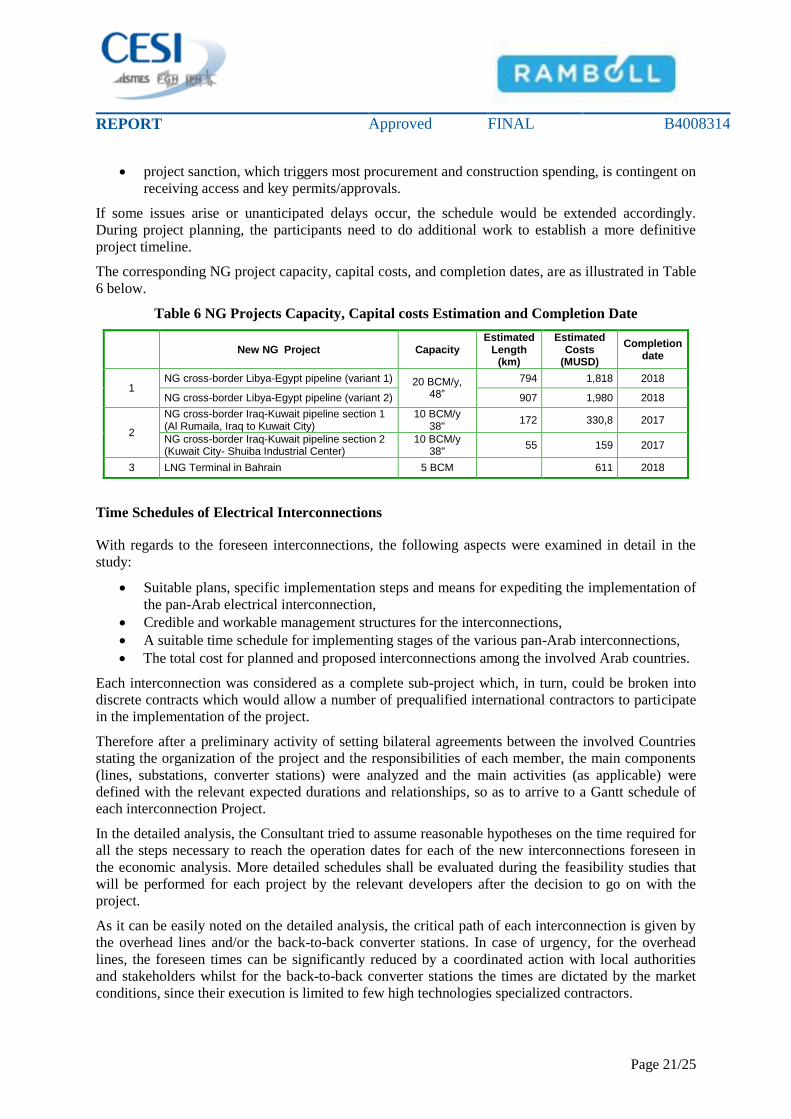
The corresponding NG project capacity, capital costs, and completion dates, are as illustrated in Table
6 below.
Table 6 NG Projects Capacity, Capital costs Estimation and Completion Date
New NG Project Capacity Estimated
Length (km)
Estimated Costs
(MUSD)
Completion date
1 NG cross-border Libya-Egypt pipeline (variant 1) 20 BCM/y,
48”
794 1,818 2018
NG cross-border Libya-Egypt pipeline (variant 2) 907 1,980 2018
2
NG cross-border Iraq-Kuwait pipeline section 1 (Al Rumaila, Iraq to Kuwait City)
10 BCM/y 38"
172 330,8 2017
NG cross-border Iraq-Kuwait pipeline section 2 (Kuwait City- Shuiba Industrial Center)
10 BCM/y 38"
55 159 2017
3 LNG Terminal in Bahrain 5 BCM 611 2018
Time Schedules of Electrical Interconnections
With regards to the foreseen interconnections, the following aspects were examined in detail in the
study:
Suitable plans, specific implementation steps and means for expediting the implementation of
the pan-Arab electrical interconnection,
Credible and workable management structures for the interconnections,
A suitable time schedule for implementing stages of the various pan-Arab interconnections,
The total cost for planned and proposed interconnections among the involved Arab countries.
Each interconnection was considered as a complete sub-project which, in turn, could be broken into
discrete contracts which would allow a number of prequalified international contractors to participate
in the implementation of the project.
Therefore after a preliminary activity of setting bilateral agreements between the involved Countries
stating the organization of the project and the responsibilities of each member, the main components
(lines, substations, converter stations) were analyzed and the main activities (as applicable) were
defined with the relevant expected durations and relationships, so as to arrive to a Gantt schedule of
each interconnection Project.
In the detailed analysis, the Consultant tried to assume reasonable hypotheses on the time required for
all the steps necessary to reach the operation dates for each of the new interconnections foreseen in
the economic analysis. More detailed schedules shall be evaluated during the feasibility studies that
will be performed for each project by the relevant developers after the decision to go on with the
project.
As it can be easily noted on the detailed analysis, the critical path of each interconnection is given by
the overhead lines and/or the back-to-back converter stations. In case of urgency, for the overhead
lines, the foreseen times can be significantly reduced by a coordinated action with local authorities
and stakeholders whilst for the back-to-back converter stations the times are dictated by the market
conditions, since their execution is limited to few high technologies specialized contractors.

REPORT Approved FINAL B4008314
Page 22/25
Figure 5 summarizes the time schedules coming from the detailed analysis of the single
interconnection projects.
Figure 5 Summary Time Schedule
Table 7 shows the key dates emerging from the time schedules simulating each interconnection
project indicating the element (or elements) representing the critical path, in addition to the
preliminary feasibility studies, which are always on the critical path.
It should be noted that, whilst for the majority of interconnection projects the starting date is assumed
as the maximum date assuring the respect of the final commissioning date expected in the economic
study, for the interconnections Libya – Egypt and Egypt – Saudi Arabia the starting date is considered
April 2014, being the minimum reasonable date for project commencement, and consequently the
completion date is later than the operation date assumed in the economic study.
Table 7 Summary of Execution Time / Dates / Critical Path
Additional
Interconnections/reinforcements
Operation year in
economic Study
Calculated schedule (months)
Starting date Completion
date Critical path
1 Tunisia - Libya 2020 57 April 2015 January 2020 400 kV OHL
2 Libya - Egypt 2017 50 January 2015 March 2019 500 kV OHL & BtB 3 Saudi Arabia – Jordan 2020 50 December 2015 January 2020 400 kV OHL & BtB
4 Egypt – Sudan 2025 86 November 2017 January 2025 500 kV OHL
5 Egypt – Saudi Arabia (*) 2017 69 January 2015 October 2020(*) 500 kV OHL & HVDC stations
6 Saudi Arabia – Yemen 2025 75 October 2018 January 2025 400 kV OHL
7 Iraq - Kuwait 2020 46 February 2016 January 2020 400 kV OHL
8 Second circuit of Egypt - Jordan 2020 49 December 2015 January 2020 Submarine cable
9 Second circuit of Jordan - Syria 2020 52 September 2015 January 2020 400 kV OHL
(*) actually, the implementation plan has already started and the completion date can be closer in time
depending on the actual progress of the implementation plan.
The analysis of the planned and proposed interconnections allows to estimate the total capital cost
(CAPEX) for the implementation of each interconnection project among the involved Arab countries,
which are presented in Table 8 below.

REPORT Approved FINAL B4008314
Page 23/25
The costs considered in the following analysis are based on average prevailing values present on
international market and are very preliminary. A more detailed estimation can be done in the
following stages of the feasibility studies, when the project characteristics and market conditions are
better defined and the financial and administrative costs (not considered in this estimation) are known
and can be added.
Table 8 Capital Costs Estimation
Description Length of
interconnection (km)
Total Cost
(MUS)
Single circuit 400 kV reinforcement Tunisia - Libya 280 111.97
Single circuit 500 kV AC reinforcement Egypt - Libya 165 267.45
Double circuit 400 kV Saudi Arabia - Jordan connection 127 134.43
Double circuit 500 kV AC Interconnection Egypt – Sudan 775 538.3
500 kV HVDC Interconnection Egypt - Saudi Arabia 1370 1,518
Double circuit 400 kV Saudi Arabia - Yemen 416 383.3
Double circuit 400 kV Iraq - Kuwait 110 65
Single circuit 400 kV Egypt - Jordan 24 61.4
Single circuit 400 kV Jordan – Syria 145 60.4

REPORT Approved FINAL B4008314
Page 24/25
CONCLUSIONS AND RECOMMENDATIONS
The main conclusion and recommendation for Arab countries is to adopt the least cost generation-
interconnection expansion plan worked out in the “Preferred Scenario” as the best option for new
electricity and natural gas interconnections for each country separately, and for all Arab countries
combined, in order to maximize the use of their gas resources.
To achieve the benefits identified in the “Preferred Scenario” and the subsequent analyses, a number
of actions and recommendations are suggested:
Recommendations on the necessary grid reinforcements upstream and downstream the
cross-border lines: The internal reinforcements needed within various Arab Countries should
be carefully identified through the elaboration of national (or regional) master plans. Once the
internal grid expansions will be identified, technical specifications and tender documents
should be prepared for a swift construction of the necessary transmission equipment.
Recommendations on the timely start of the various projects (see Construction
Implementation Plan): To avoid a delayed commissioning of the NG and electricity
infrastructures proposed in the “Preferred Scenario”, a number of issues should be addressed
such as financing schemes and procedure to recover the invested capital, preparation of
technical specifications, environmental impact study and, finally, preparation of tender
documents.
Recommendations on the setting up of rules for the cross-border trading of electricity
and NG: Particularly, for electricity, a number of steps can be undertaken:
o Starting as soon as possible, countries should, on periodical basis, publish the NTC at
the borders;
o Definition of clear, transparent and non-discriminatory rules for capacity allocation
on the cross-border lines; the explicit auction mechanism is the most appropriate
mechanism, at least in a first stage;
o Definition of clear, transparent and non-discriminatory rules for congestion
management;
o Agreement on Inter-TSO compensation mechanism for power transits. To this
purpose, a series of multilateral actions should be undertaken.
Recommendations on how to take the natural gas projects to the next stage:
o Ownership of the projects must be clarified;
o In depth feasibility studies should be undertaken to confirm estimates on gas market,
supply, routing/siting, and costs;
o A gas master plan for Libya is recommended to be carried out.
This study was performed based on a methodology of least cost integrated development of generation
and interconnections (electrical and natural gas) of the Arab countries. One of the achievements of the
study was the preparation of the Planning Memorandum and the implementation of the unified
planning criteria and methodology for the generation and the transmission network in all analyzed
countries. Based on the gained experience the Consultant proposes the following recommendations
for the preparation of similar studies in the future:
Recommendations on System Data for Planning Studies
Country databases: The data collection phase was challenging. Our recommendation is to set up and
keep updated country databases to be used as starting point for the elaboration of the master plans on
transmission and on generation expansion. Databases shall be as much as possible compatible with

REPORT Approved FINAL B4008314
Page 25/25
each other for an easy and efficient data exchange (see in Europe the adoption of CIM: Common
Interface Module).
Recommendations on Coordinated Planning Studies
The future of the Arab regional electricity market also depends on the ability to perform transmission
planning on a regional basis in order that network reinforcement projects not only benefit each
national interest, but also the region as a whole. Thus, we recommend, as a crucial need, to setup
regional transmission planning organizations to be eventually merged into a Pan-Arab association of
TSOs with the necessary databases, tools and procedures suitable for the changing conditions and the
growing interest in Arab countries for a common electricity market.
Generation and transmission plans: Harmonization among Arab countries regarding the periodical
updating of the generation and transmission plans based on coherent scenarios and adequacy criteria
for generation and transmission expansion analysis (see in Europe the TYNDP updated every 2
years).
In other regions of the world, common generation-transmission planning capabilities have proven to
be the technical promoter for improved regional electric planning standards, better understanding of
least cost solutions and the basis for the proposal of bankable projects.
Possible Planning Study Cycle:
Each year: update of the national transmission plans and generation adequacy outlook;
Every two years: update of regional transmission plans;
Every five years: update of Pan-Arab Strategic generation and transmission plan for the whole
study period (e.g. with a planning horizon 15 years in advance) accounting for economic,
technical and practical implementation considerations.
Grid Codes
In order to promote regional cooperation in transmission planning, the development of a regional grid
code is recommended. It implies the creation of a working group which will define rules for planning
and operation of the network on a regional level, especially addressing attention towards
interconnection lines and those internal lines that have a large impact on transfer capacities between
different countries.


![Kazakstan FINAL Approved 09[1]](https://img.dokumen.tips/doc/110x75/577dacc21a28ab223f8e56b5/kazakstan-final-approved-091.jpg)