Embed Size (px)
Citation preview

I " - 'r*~'r 1 •
"REPORT, ... .. A' < iT OP
........ C TECHNICAL REPORT 52-335
TITANIUM PHASE DIAGRAMS
HAROLD D. KESSLERWILLIAM ROSTOKER
ROBERT J. VAN THYNE
ARMOUR RESEARCH FOUNDATION
ILLINOIS INSTITUTE OF TECHNOLOGY
-6.J.J so
0 0
NOVEMBER 1953
.J 0J
Statement AApproved for Public Release
WRIGHT AIR DEVELOPMENT CENTER
w ia- ~~ca.a0
0
NOTICES
When Government drawings, specifications, or other data are usedfor any purpose other than in connection with a definitely related Govern.ment procurement operation, the United States Government thereby in-curs no responsibility nor any obligation whatsoever; and the fact thatthe Government may have formulated, furnished, or in any way suppliedthe said drawings, specifications, or other data, is not to be regardedby implication or otherwise as in any manner licensing the holder orany other person or corporation,or conveying any rights or permissionto manufacture, use, or sell any patented invention that may in anywaybe related thereto.
The information furnished herewith is made available for studyupon the-understanding that the Government's proprietary interests inand relating thereto shall not be impaired. It is desired that the JudgeAdvocate (WCJ), Wright Air Development Center, Wright-PattersonAir Force Base, Ohio, be promptly notified of any apparent conflict be-tween the Government's proprietary interests and those of others.
*UUSUUU=UUUCM0C
WADC TECHNICAL REPORT 52-335
TITANIUM PHASE DIAGRAMS
Harold D. KesslerWilliam Rostoker
Robert 1. Van Thyne
Armour Research FoundationIllinois Institute of Technology
November 1953
Materials LaboratoryContract No. AF 33(038)-8708
RDO No. 615-11
Wright Air Development CenterAir Research and Development Command
United States Air ForceWright-Patterson Air Force Base, Ohio
McGregor & Werner, Inc., Dayton, Ohio300 - Xpril, 195h
FOREWORD
This report was prepared by the Armour Research Foundation ofMl inois Institute of Technology, under USAF Contract No. AF 33(038)-8708.
The contract was initiated under Research and Development Order No. 615-11,"Titanium Metal and Alloys", and was administered under the direction ofthe Materials Laboratory, Directorate of Research, Wright Air DevelopmentCenter, with Lt. William R. Freeman acting as project engineer.
WADC TR 52-335

ABSTRACT
Using high purity arc melted alloys and micrographic analysis of annealedsamples as the principle method of investigation, titanium-rich, partialphase diagramns were determined for the following systems:
Ti-Cr-Fe: The titanium-rich portion of the diagram was studied in detailto 70 weight % titanium. The isotherm at 800*C was determined for the sec-tion bounded by Ti, TiFe2 , and TiCr 2 . The solubility of chromium and ironin alpha titanium is less than 1% total alloy content. There is a continuousspace of ternary beta solid solution between the Ti-Cr and Ti-Fe systems.A ternary eutectoid, P;cL + TiCr 2 + TiFe, occurs at approximately 8% Cr-13% Fe and about 540eC. The beta phase of alloys lying on the low titaniumside of a tie line between 7% chromium and 4% iron is retained upon waterquenching from the beta space. Hardness data are presented, illustratingthe marked effect of heat treatment.
Ti-Al-O and Ti-Al-N: Titanium-rich corners of the systems from 0 to10% aluminum and 0 to 1% oxygen or nitrogen were investigated. As aluminum,oxygen and nitrogen are alpha-stabilizers, the ternary alpha spaces extendto temperatures well above the transformation temperature of titanium (885*C).Nitrogen is more effective than oxygen in raising the P/a + A space boundaryof the Ti-Al system. Upon water quenching the alloys, the beta phase trans-forms to alpha prime. Oxygen and nitrogen additions increase the hardnessof the Ti-Al alloys.
Ti-Al-C: The phase diagram was determined using alloys containing 0to 10% aluminum and 0 to 1% carbon. A study of several as-cast carbon masteralloys penuitted an outline of the Ti-C diagram to be constructed. A highmelting compound, TiC, appears to exist over a range of compositions. Aeutectic occurs at about 30% carbon between TiC and carbon.
Aluminum raises the temperature of the peritectoid reaction of the Ti-Csystem, pfja + TiC (920eC). The maximum solubility of carbon in alpha titaniumis increased by aluminum additions from about 0.5% in the binary Ti-C systemto 1% at 10% aluminum. Aluminum and carbon increase the hardness of the alphasolid solution.
Ternary Oxide Phases: A family of ternary oxide phases isomorphouswith Fe W C was discovered in which titanium was associated with one of theelementý if the first transition series. The phase relationships betweenthese ternary phases and binary phases were investigated for the Ti-Cr-O,Ti-Fe-O and Ti-Ni-O systems. An isothermal section for the Ti-Mo-O systemwas constructed.
PUBLICATION REVIEW
This report has been reviewed and is approved.
FOR THE COMMANDER:
M. E. SORTE
Colonel, USAFChief, Materials Laboratory
WADC-TR-52-335 iii Directorate of Research

TABLE OF CONTENTS
Page
I. INTRODUCTION 1II. EXPER1NENTAL PFDCECURE . . . . . . . . . . .1
A. Materials . . . . . . . . . . . . . . .I............ . 1III. RESULTS AND DISCUSSION .... .......... . 2
A. The Ti-Cr-Fe System . . . . . . . .......... 21. Introduction . . . . .... . ..... . . 22. Experimental Procedure 3
a. Melting Practice. . . . . . . . . . . . .*. 3b. Annealing Treatments. . . . . . . . . . . 3c. Solidus Determinations. . . . .............. 4
3. Results and Discussion . . . ......... ............ 4a. The Phase Diagram.. .. .. ... .. . . 4b. Isothermal Sections . . . . .... .... 4C. Vertical Sections 14d. Melting Range Determinations . . . ... . 14e. Alloys Rich in Chromium and Iron. . . . ... . 14f. Microstructures . . . . . .... ........... . 26g. Hardness . . . .................. . . 30
B. The Ti-A1-O and TL-A1-N Systems . . . . . .. . . . 351. Experimental Procedure . . .. ... . ... 35
a. Alloy Preparation .............. 35b. Annealing Treatments ............ . 35
2. Discussion of Results ..... . ......... 36a. The Phase Diagrams ..... . ..... 36b. Hardness. . . . . . . . . . .. ...... 36
C. The Ti-A1-C System . . . . . . . ................... 421. Experimental Procedure .................. 42
a. Alloy Preparation............... 42b. Annealing Treatments ............... 42
2. Discussion of Results . . . . . . . ....... 42a. The Ti-C Diagram ..... ....... . 42b. The Ti-Al-C Diagram . . .. . . . . . . . 45c. Hardness .... . . ............. . 54
D. The Ti-O System. ........ 58E. Studies on a Family of Ternary Phases* in "Titanium*-
Base Systems. . . . . . . . . . ...... ........... 581. Identification of Ti X and Ti Type Phases
Isomorphous with Ti eN .. V. ......... 602. System Ti-Fe-O - Isithermal Section at iOOOOC .... 60
a. Miscibility Range of the Ternary (T) Phase... 63b. The (a + T) Phase Field . . . . . . . . . . . . 63C. The (TiO + T) Phase Field. . . ......... . 63d. The (a + TiO + T) Phase Field. .. . . 63e. The (TiO + T+ TiFe ) Phase Fields... . .d 63f. The (TiFe + T + Tie) Phase Field. . . . . . . 68g. The (T + TiFe) and (P + TiFe + T) Phase Fields, 68h. The (P + T) and (a + P + T) Phase Fields.... 68i. The (a + P) Phase Field . . ......... 68
WADC TR 52-335 iv
TABLE OF CONTENTS (Continued)
Page
3. System Ti-Cr-O - Isothermal Section at 1O00WC.... 68a. Miscibility Range of the Ternary (T) Phase... 72b. The (a + TiCr 2 ) Phase Field. . . . 72c. The (C + T) and (TiO + T) Phase Fields. * . . 72d. The (a + P) and (a + p + TiCr 2 ) Phase Fields. . 72e. Other Phase Fields . . ... ... .. 72
4. Isothermal Section at 900"C - System Ti-Ni-O . ... 75a. Miscibility Field of the Ti Ni Phase. . . . . . 75b. The (a + Ti Ni) Phase Field2 . ..... .. . 75c. The (TiO + ?i 2 Ni) and (a + TiO + Ti 2Ni) Phase
Fields. . . . . . . . .0 * 0 .* * 75d. The (TiO +'TNi÷ "+TNi ) Phase Field 75e. The (Ti Ni + E l3i) and?(TiNi + Ti 2Ni + TINi 3 )
Phase Fields. . . . . . . . . . . . . . . . . 75f. The (Ti Ni + TLNi) Phase Field. .... 79
5, Isothermal Section at lO00C - System Ti-no-O. . . 79IV. SUMMARY.*. . e # e * * .. . . . . . . . .................... 79
A. The Ti-Cr-Fe System . . . . . . . . . . . . . . .. . 79B. The Ti-Al-(O and N) Systems . ............. 82C. The Ti-Al-C System . .................... ................ 82D. The Ternary Oxide Phases. ..........................
BIBLIOGRAPHY.2
WADC TR 52-335 v
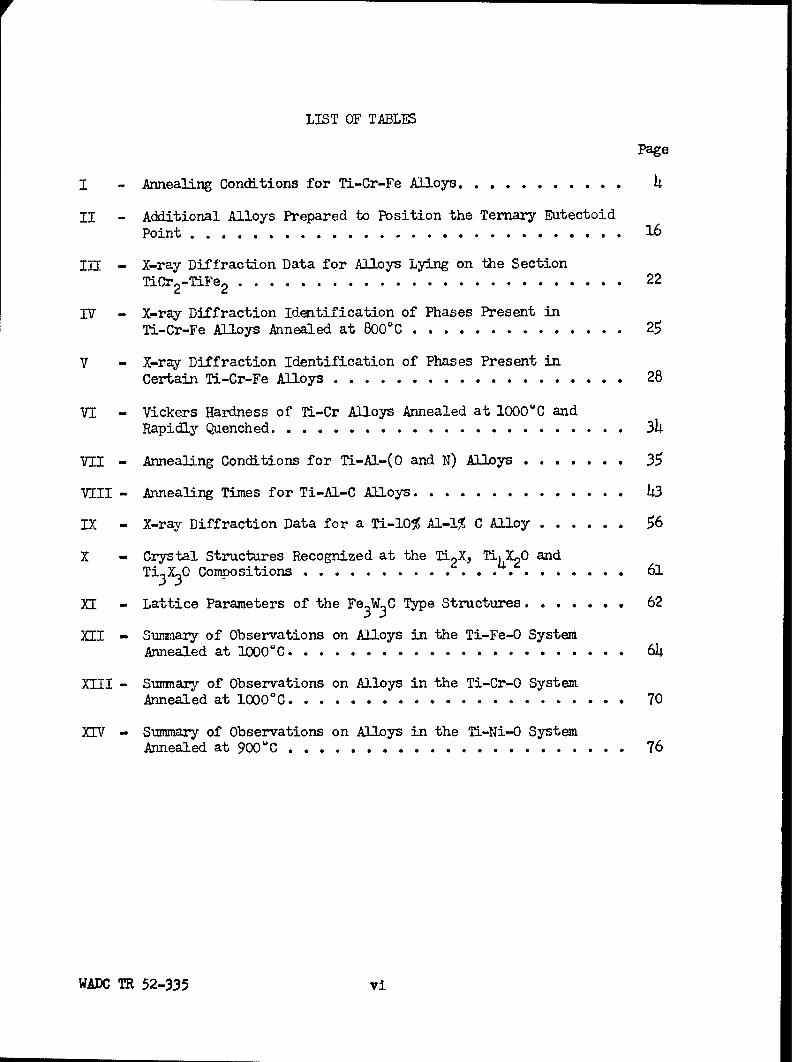
LIST OF TABLES
Page
I - Annealing Conditions for Ti-Cr-Fe Alloys ... ....... 4
II - Additional Alloys Prepared to Position the Ternary EutectoidPoint . . . . .................. .. ........................ . 16
Ii7 - X-ray Diffraction Data for Alloys Lying on the SectionTiCr 2 -TiFe2 . . . . . . . . . . . . . . . . . . . . .. . . . . . . . . . . . . . . . . . . 22
IV - X-ray Diffraction Identification of Phases Present inTi-Cr-Fe Alloys Annealed at 800"C ............. . . . . 25
V - X-ray Diffraction Identification of Phases Present inCertain Ti-Cr-Fe Alloys ...................... 28
VI - Vickers Hardness of Ti-Cr Alloys Annealed at 1OO0C and
Rapidly Quenched. . . . . . ......... .......... 34
VII - Annealing Conditions for Ti-Al-(O and N) Alloys . . . . . . . 35
VIII - Annealing Times for Ti-Al-C Alloys......... . . . . . . . 43
IX - X-ray Diffraction Data for a Ti-lO% Al-l% C Alloy . . . . . . 56
X - Crystal Structures Recognized at the Ti 2X, Tih020 andTi 3-X n Compositions ..... .................... . 61
XI - Lattice Parameters of the Fe3 W 3C Type Structures. . . . . . . 62
XII - Summary of Observations on Alloys in the Ti-Fe-O SystemAnnealed at 100 0 .C . . . . . . . . . . . . .. .. . . .. 64
XIII - Summary of Observations on Alloys in the Ti-Cr-O SystemAnnealed at 10000C . . . . . . . . . . ........... . 70
XIV - Summary of Observations on Alloys in the Ti-Ni-O SystemAnnealed at 900'C . . . . . . . ......... . . . . . . . 76
WADC TR 52-335 vi

LIST OF FIGUffS
Page
1 - Partial Isothermal Section at 900%C of the Ti-Cr-Fe System. . 5
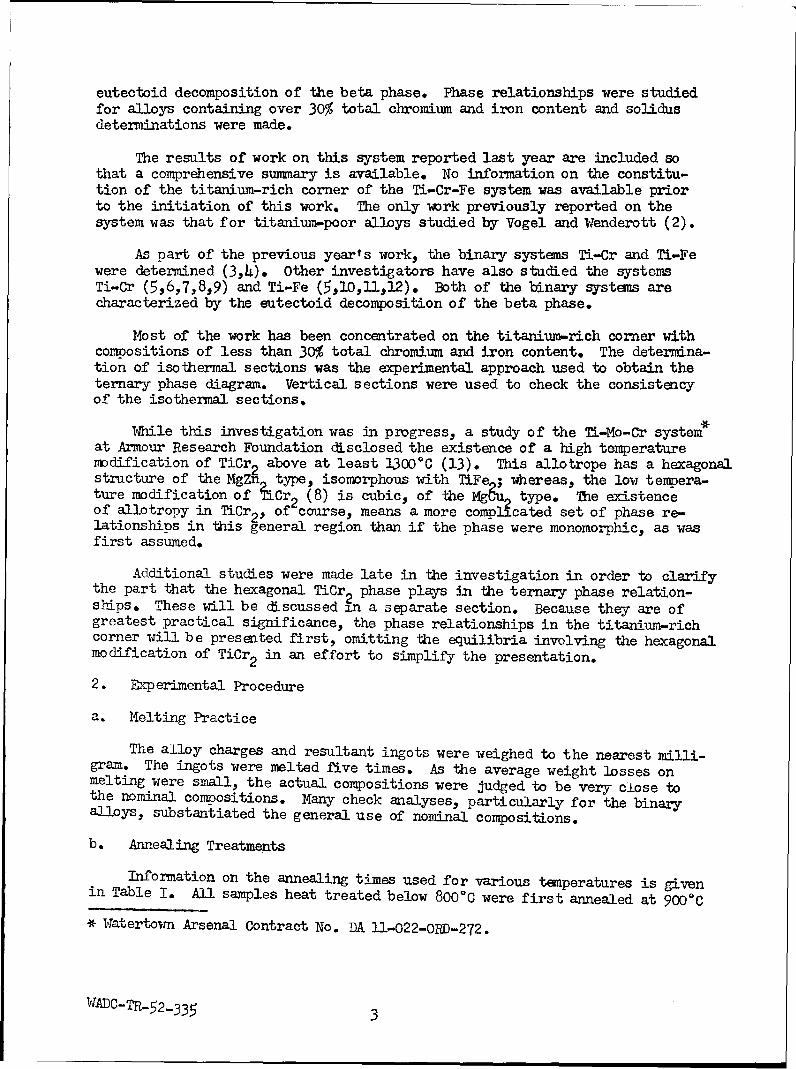
2 - Partial Isothermal Section at 8o00c of the Ti-Cr-Fe System. • 6
3 - Partial Isothermal Section at 750"C of the Ti-Cr-Fe System. • 7
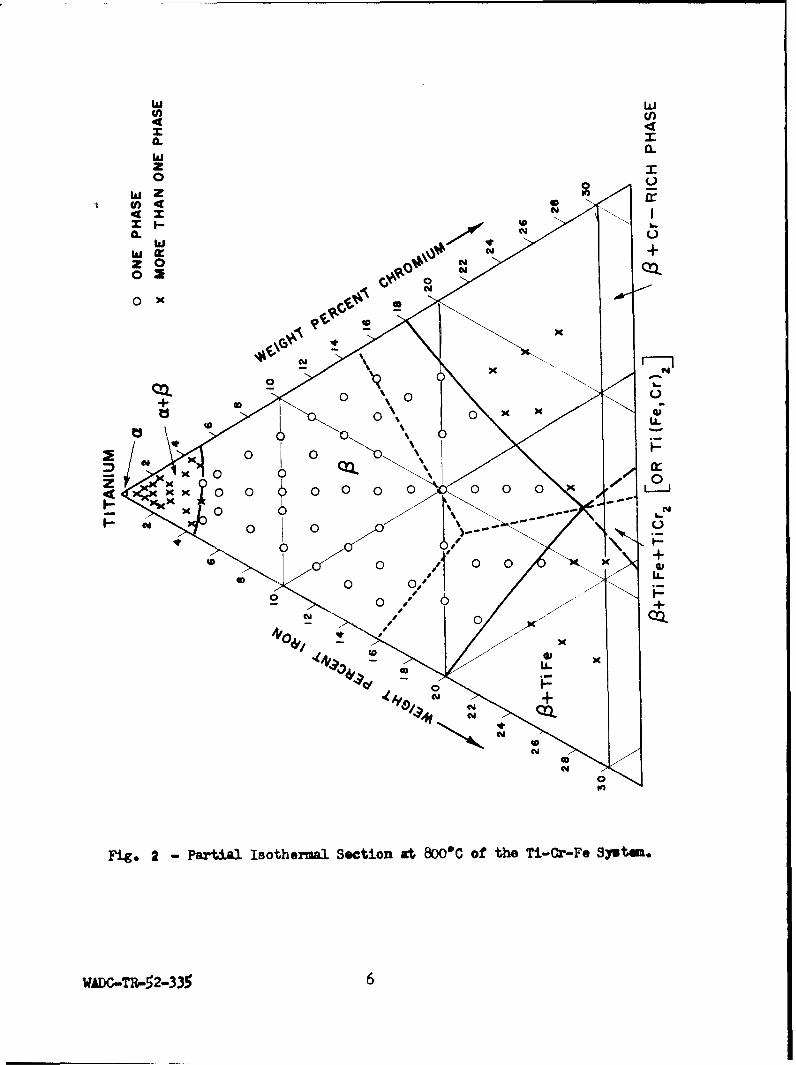
4 - Partial Isothermal Section at 700"C of the Ti-Cr-Fe System. • 8
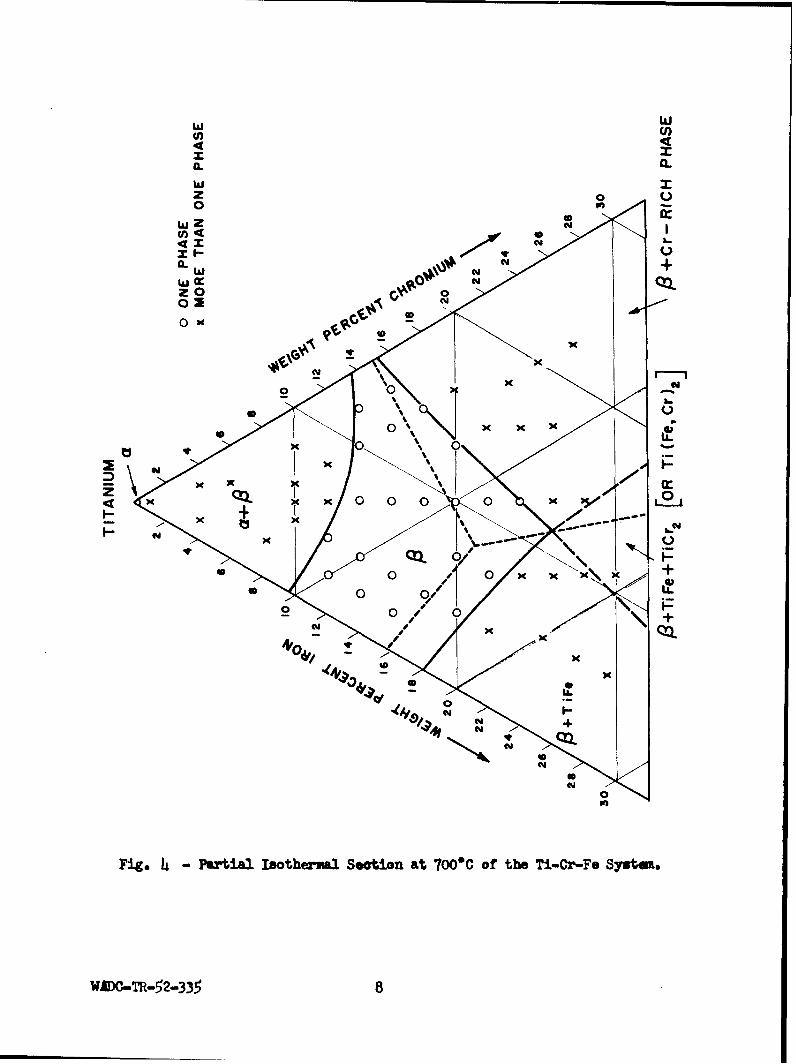
5 - Partial Isothermal Section at 6500c of the Ti-Cr-Fe System. • 9
6 - Partial Isothermal Section at 6000C of the Ti-Cr-Fe System. • 10
7 - Partial Isothermal Section at 550°C of the Ti-Cr-Fe System- • Ii
8 - Isotherms of the Lower Surfaces of the Beta Phase Space inthe Ti-Cr-Fe System . . . . . . . . . . . . . . . . ..... 15
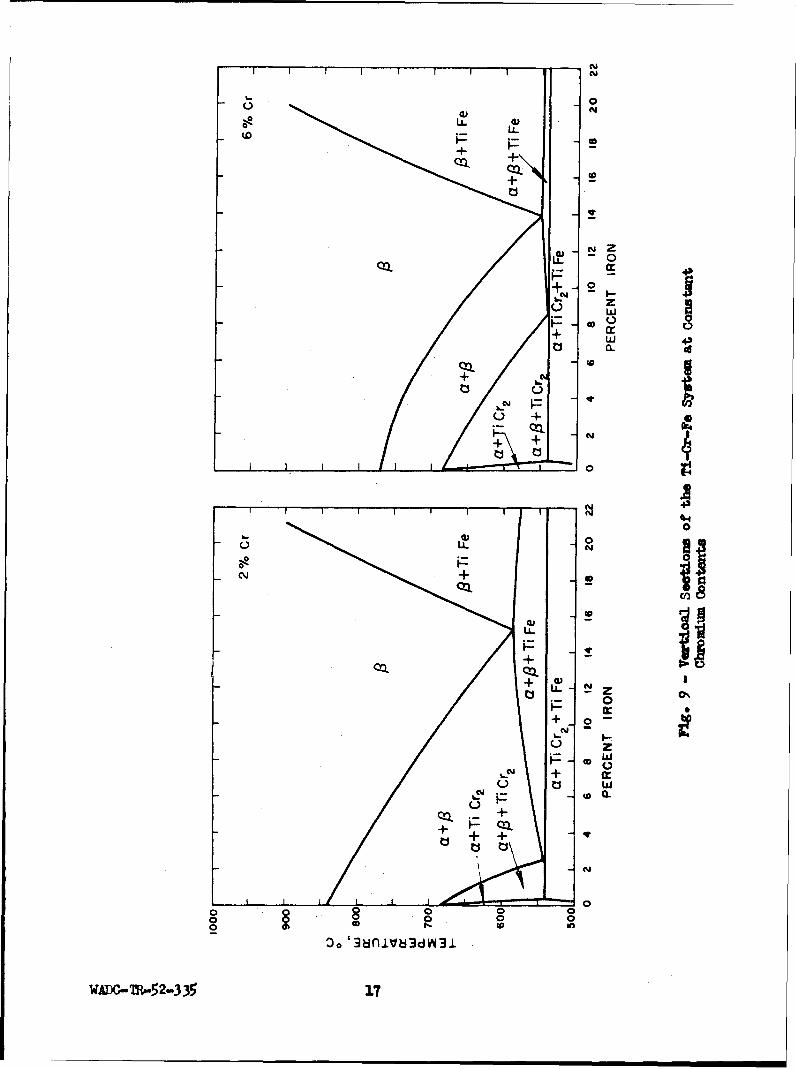
9 - Vertical Sections of the Ti-Cr-Fe System at ConstantChromium Contents .*. . .* . .* . . . . . . . . .* ... . . .. 17
10 - Vertical Sections of the Ti-Cr-Fe System at Oznstant
Chromium and Titanium Conteats. . . . . . . . . . . . . . * . 18
.1 - Isotherms of the Solidus Surface of the Ti-Cr-Fe System • . • 19
12 - Partial Isothermal Section at 800"C of the Ti-Cr-Fe System. . 21
13 - Lattice Parameters of the Hexagonal Ti(Fe ,Cr) 2 Phase. . . . . 23
14 - Vertical Section of the Ti-Cr-Fe System Through TiFe2 andTnCr2 .. .. .. .. .. .. .. .. .. .. .. .. .. .. 2
15 - Hypothetical Partial Isothermal Section at Some TemperatareBelow 8000C of the Ti-Cr-Fe System . . . . . . . . . ... . 27
16 - Hypothetical Partial Isothermal Section of the Ti-Cr-FeSystem at Some Temperature Between 675k and 5;401C . . . . .. 29
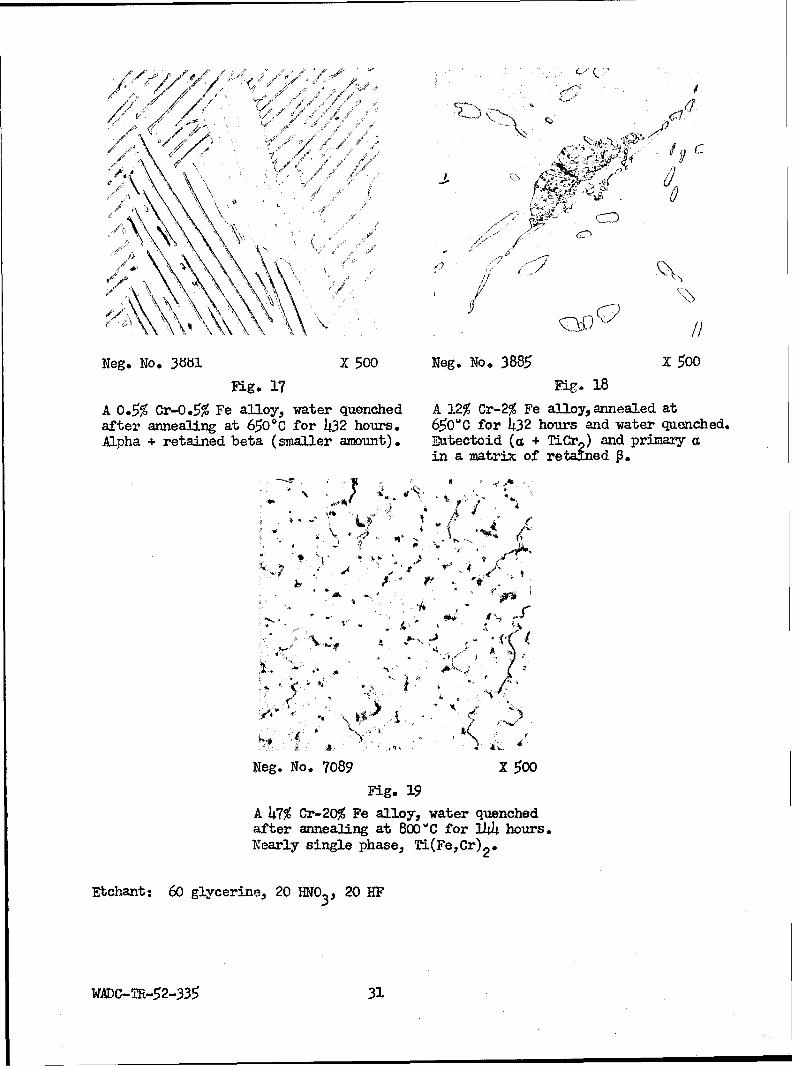
17 - Microstructure of a 0.5% Cr-0.5% Fe alloy,water quenchedafter annealing at 650"C for 432 hours . ........ ... 31
18 - Microstructure of a 12% Cr-2% Fe alloy, annealed at 6500Cfor 432 hours and water quenched . . . . . . . . . . . ... 31
19 - Microstructure of a 47% Cr-20% Fe alloy,water quenchedafter annealing at 800°C for 344 hours. . . . . . . . . . . . 31
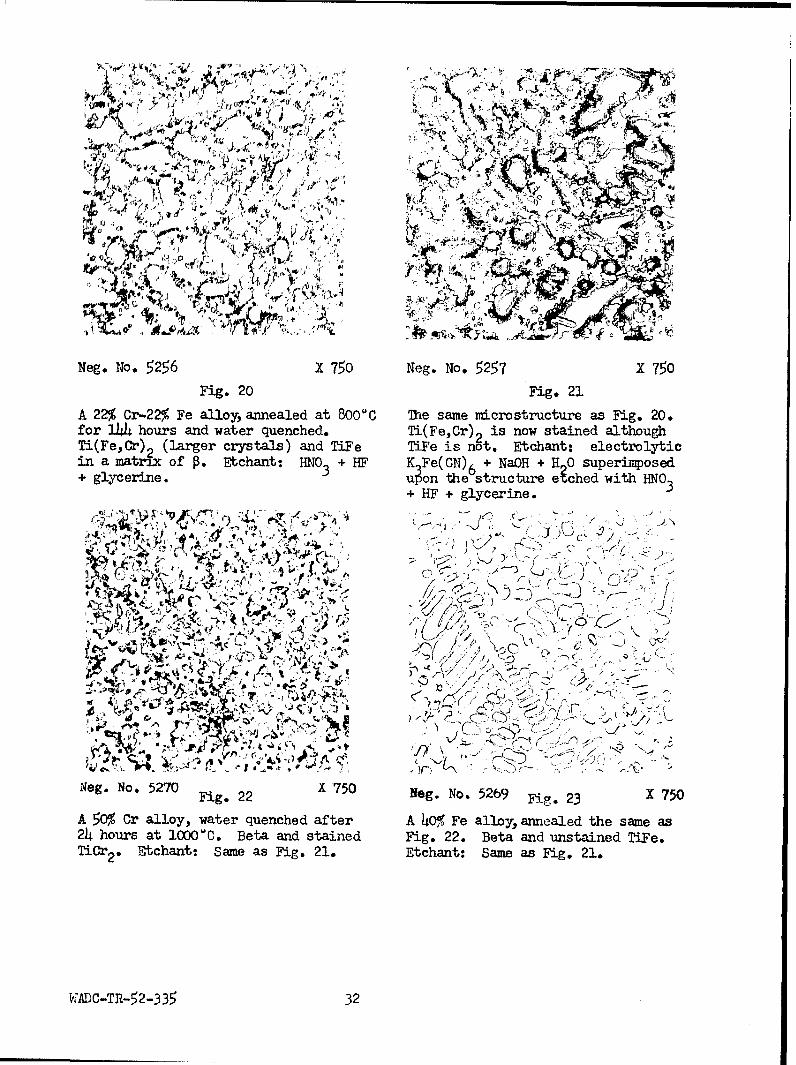
20 - Microstricture of a 22% Cr-22% Fe alloy,annealed at 8001Cfor 1I4 hours and water quenched .... . . . . . . . 32
WADC TR 52-335 vii
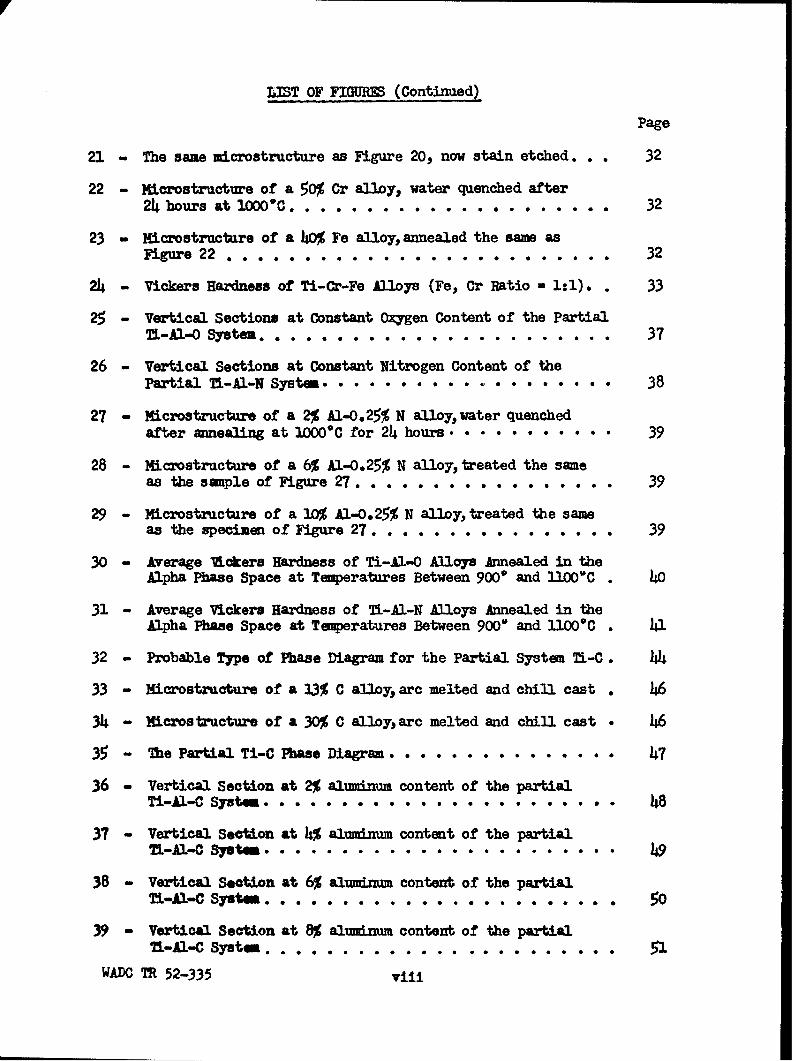
LIST OF FIGURS (Continued)
Page
21 - The same microstructure as Figure 20, now stain etched. . . 32
22 - Microstructure of a 50% Cr alloy, water quenched after24 hours at lOoOC . . . . . . . . . . . . . . . . .0 0 * 32
23 M Microstructure of a 40% Fe alloy, annealed the same asFigure 22 . . . . . . . . . . . . . . . . . . . . . . . . . 32
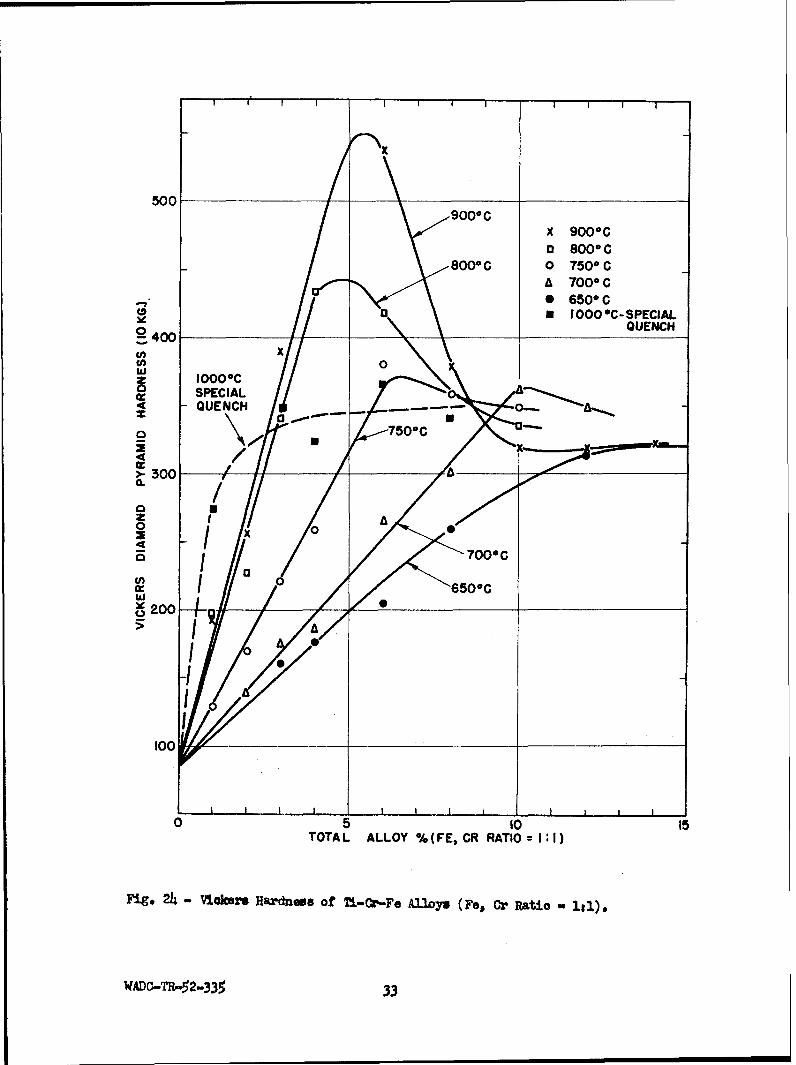
24 - Vickers Hardness of Ti-Cr-Fe Aloys (Fe, Cr Ratio - 1:1). . 33
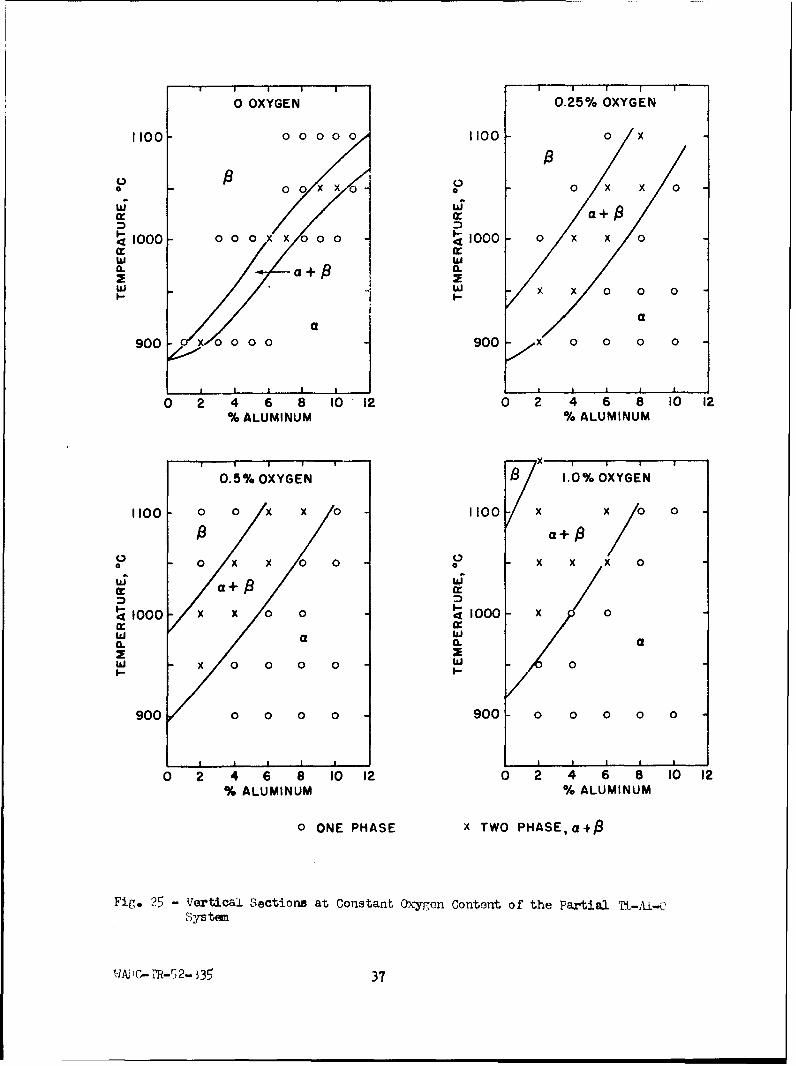
25 - Vertical Sections at Constant Oxygen Content of the PartialTL-Al-0 System . . . . . . . . . . . . . . . . . ...... 37
26 - Vertical Sections at Constant Nitrogen Content of thePartial TL-Al-N System .. .. •* . . a * .. * 0 * & 0 0 0 38
27 - Microstructure of a 2% AI-O.25% N alloywater quenchedafter annealing at JO09C for 24 hours * o. . . . . . .o . 39
28 - Microstrucmture of a 6% AI-0.25% N alloy, treated the sameas the sample of Figure 27 ..... . ...... .. . 39
29 - Microstructare of a 10% AI-0.25% N alloy, treated the sameas the specimen of Figure 27 ................. 39
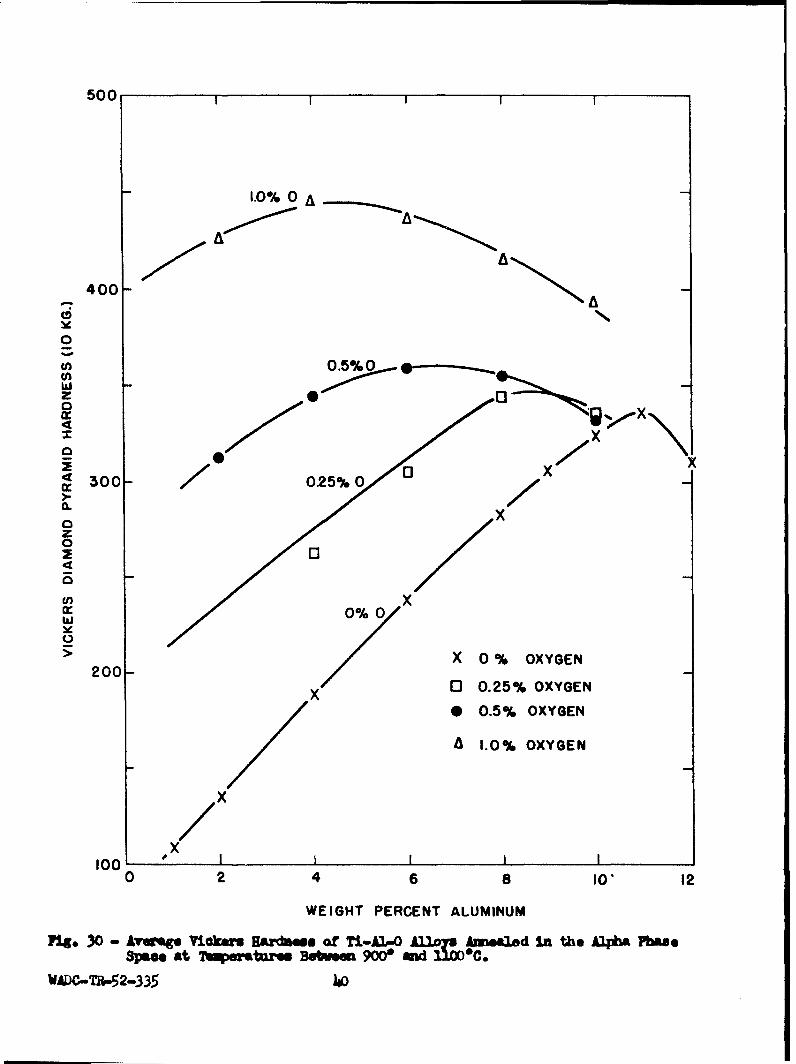
30 - Average &ckers Hardness of Ti-AI-O Alloys Annealed in theAlpha Phase Space at Temperatures Between 900' and 1100"C . 40
31 - Average Vickers Hardness of TL-AI-N Alloys Annealed in theAlpha Phase Space at Temperatures Between 900" and 11000C . 41
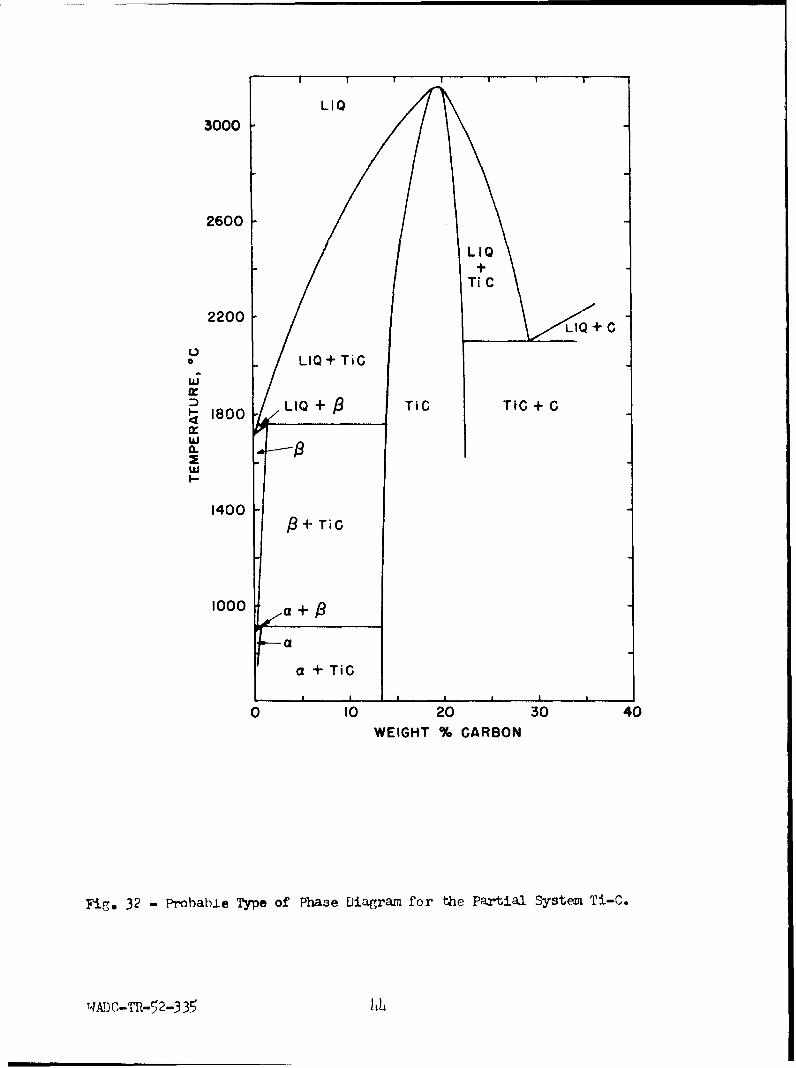
32 - Probable Type of Phase Diagram for the Partial System TIL-C. 44
33 - Microstructure of a 33% C alloy, arc melted and chill cast . 46
34 - Microstrmcture of a 30% C alloy,arc melted and chill cast • 46
35 - The Partial Ti-C Phase Diagram ....... ....... .. 47
36 - Vertical Section at 2% aluminum content of the partialTi-Al-C system. . . . . . . . . . . . . . . . . . . . . • . 48
37 - Vertical Section at 4% aluminum content of the partial
38 - Vertical Section at 6% aluminum content of the partial-A-c Sytem. . . . . . . ........... 5
39 - Vertical Section at 8% aluminum content of the partialL-Al-C System . . . . . . . . . .. .... 51
WADC TR 52-335 viii

LIST OF FIGURES (Continued)
Page
40 - Vertical Section at 10% Aluminm Content of the PartialTi-Al-C System .. .. .. . .. . . .. .. .. .. .. . .. 52
41 - Microstructure of a 10% AI-.% C alloy~water quenched afterannealing at 1500C for 16 hours ................ 53
42 - Microstructure of a 0.6% C alloy, annealed at 950"C for 48hours and water quenched ...... ... ........ . 53
43 - Microstructure of a 4% AI-0.6% C alloyannealed at 950*Cand water quenched . . . . .. . • . * . .* . . .* 53
44 - Microstructure of an8% Al-.O8% C alloy, water quenched afterannealing at 900% for 72 hours ... ............ 55
45 - Microstructure of a 10% AL-0o8% C alloy, treated the sameas the sample of Figure 44 . .. .. .. .. .. .. .. . .. 55
46 - Average Vickers Hardness of TL-Al-C Alloys Annealed in theAlpha Phase Space at Temperatures Between 600' and 1150%C 57
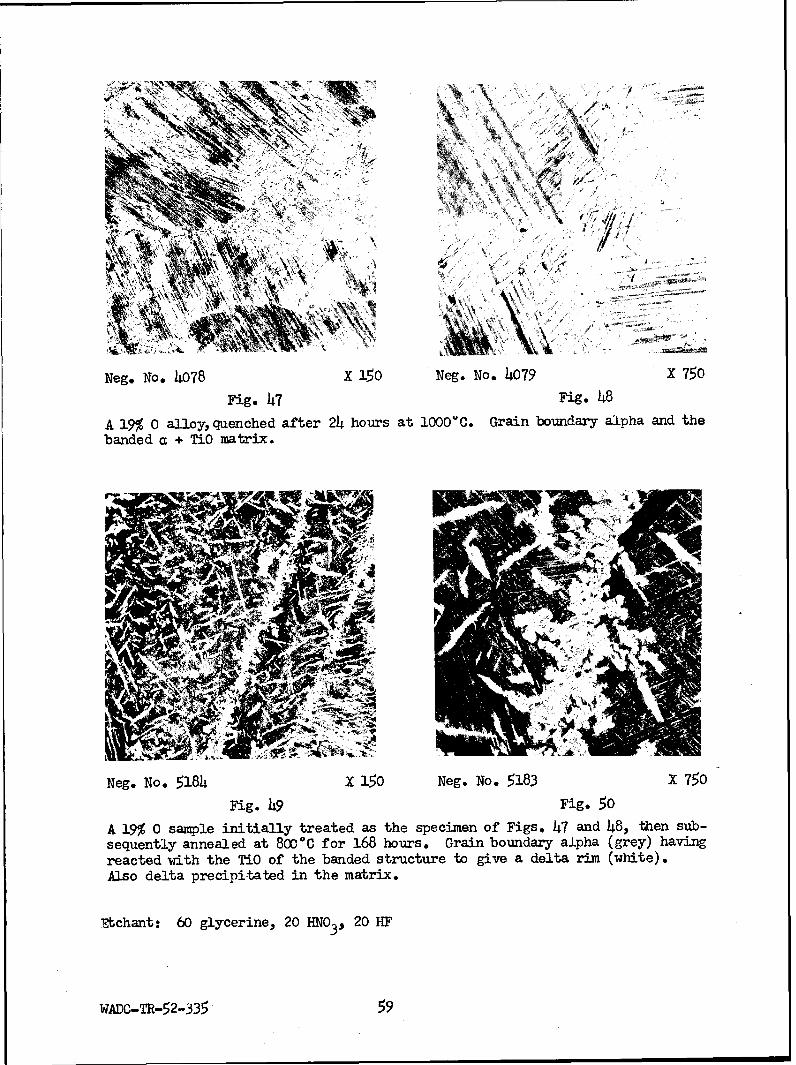
47 - Microstructures of a 19% 0 alloy, quenched after 24 hours48 at looo% .... 0.. 4 59
49 - Microstructures of a 19% 0 sample initially treated as the50 - specimen of Figures 47 and 148, then subsequently amnealed
at 800C for 168 hours . . ..... .* . . . . 59
51 - 10009C Isothermal for Partial Ti-Fe-O System . . . ... . 66
52 - Microstructure of a 15% 0-30% Fe Alloy, Annealed at 1ODO*Cand I.ter Quenched . . . . . . . . . . . . . . .0 0 .a 0 67
53 - Microstructure of a 15% 0-20% Fe Alloy, Annealed at 1000DCand Water Quenched* . .. . . . .. .. . . . . . . . . 67
54 - Microstructure of a 20% 0-25% Fe Alloy, Annealed at 1000"Cand Water Quenched . . . . . . . . ... . . .. . . . * 67
55 - Miczostructure of TiO-TiFe 2 Phase, Annealed at 10000 C andWater Quenched ... .. .*. * * * .* * * * * . 69
56 - Microstructure of a 8% 0-42% Fe Alloy, Annealed at Io00Cand Water Quenched. . . . . . .. . . •.. • 69
57 - 000'C Isothermal for Partial Ti-Cr-O System . ... . 71
58 - Microstructure of a 15% 0-20% Cr Alloy,Annealed at 1.000Cand Water Quenched . . . . .. . . . .. 73
WADC TR 52-335 ix

LIST OF FIGURES (Continued)
Page
59 - Microstructure of a 25% O-15% Cr Alloy, Annealed at lOO10Cand Water Quenched. . . . . . . . ................ . . . .. 73
60 - Microstructure of a 15% 0-35% Cr Alloy, Annealed at 1000°Cand Water Quenched . . . . . . . . . . . . . . . . .... 73
61 - Microstructure of a 10% 0-25% Cr Alloy, Annealed at l000"Cand Water Quenched . . . . . . . . . . . . . . . . . . . .. 73
62 - Microstructure of a 10% 0-55% Cr Alloy, Annealed at 1000"Cand Water Quenched ........... . . . ... ..................... 74
63 - 9009C Isothermal for Partial Ti-Ni-O System . . . . . . . . . 77
64 - Microstructure of a 5% 0-30% Ni Alloy, Annealed at 900'Cand Water Quenched . . . . . . . . . . . . . . . . . . . . . . 78
65 - Microstructure of a 10% 0-20% Ni Alloy, Annealed at 900°Cand Water Quenched . . . . . . . . . . . . 78
66 - Microstructure of a 25% 0-20% Ni Alloy, Annealed at 9000Cand Water Quenched . . . . . . . . . . . . . . . .. . . ... 78
67 - Microstructure of a 35% 0-5% Ni Alloy, Annealed at 9009Cand Water Quenched ............ . . .... ...................... 78
68 - Microstructure of a 25% 0-30% Ni Alloy, Annealed at 900'Cand Water Quenched . . ............. .................. . .. 80
69 - Miczostructure of a 5% 0-50% Ni Alloy, Annealed at 900Cand Water Quenched ..... ................. . . . . . . . 80
70 - Microstructure of a 5% 0-35% Ni Alloy, Annealed at 900'Cand Vater Quenched . . . . .... ............. . . . . . . 80
71 - 10009C Isothermal for Partial T¶-Mo-O System .... .. . 81
WADC TR 52-335 x
I. INTRODUCTION
This is a summary report of the third year, s work on Contract No. AF33(038)-8708 covering the period of November 8, 1951 to January 8, 1953.As Ti-Cr-Fe alloys were among the first to find commercial application, theconstitution of the system was investigated during last year's work on thisproject. The study of the system was expanded during this year's effort andis now completed.
Work on Contract No. AF 33(038)-22806 has shown that Ti-Al alloys showmuch promise for use at elevated temperatures. For this reason, the effectof the interstitially soluble contaminants, ox-Tgen, nitrogen and carbon, onthe Ti-Al system was investigated and partial phase diagrams were determinedfor the ternary systems.
A series of ternary oxide phases was investigated and isolated. As theseternary phases may be involved in the constitution of commercial titaniumalloys, single partial isothermal sections were constructed for the Ti-Fe-O,Ti-Cr-O, Ti-Ni-O, and Ti-Mo-O systems.
The principle method used to investigate the alloy systems was metallo-graphic analysis of arc melted samples, water quenched after annealing. Solidusdeterminations and x-ray diffraction analysis were also employed.
II. EXPERII4ETAL PROCEDURE
Alloy ingots weighing 10 to 20 grams were melted in a nonconsumable tungstenelectrode arc melting furnace using water-cooled copper hearths and a heliumatmosphere. The ingots were remelted enough times to insure homogeneity. Thetechniques of melting, annealing, solidus determinations, metallography, andx-ray diffraction were the same as those reported for the first yearl's workon this project (1). Where needed, details will be given in the sections ofthe report where they apply.
A. Materials
The titanium used in the preparation of the alloys was iodide crystalbar (99.9+% pure) produced by the New Jersey Zinc Company and Foote MineralCompany.
Vacuum melted chromium and iron were purchased from the National ResearchCorporation and the impurities were:
WAMC-TR-52-335 1
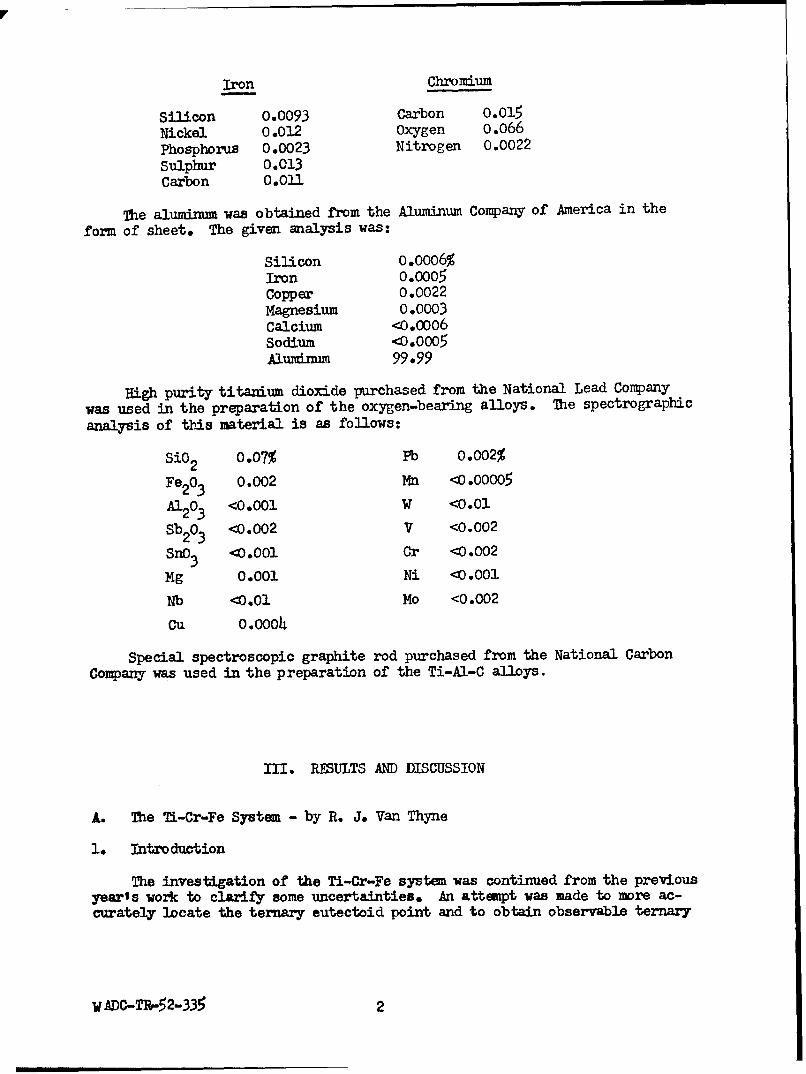
Iron Chromium
Silicon 0.0093 Carbon 0.015Nickel 0.012 Oxygen 0.066Phosphorus 0.0023 Nitrogen 0.0022Sulphur 0.013Carbon 0.011
The aluminum was obtained from the Aluminum Company of America in theform of sheet. The given analysis was:
Silicon 0.0006%Iron 0.0005Copper 0.0022Magnesium 0.0003Calcium <0.0006Sodium <0.0005Aluminum 99.99
High purity titanium dioxide purchased from the National Lead Companywas used in the preparation of the oxygen-bearing alloys. The spectrographicanalysis of this material is as follows:
SiO2 0.07% Pb 0.002%
Fe2 03 0.002 Mn <0.00005
A1203 <0.001 W <0.01
Sb 203 <0.002 V <0.002
SnO3 <0.001 Cr <0.002
Mg 0.001 Ni <0.001
Nb <0.01 Mo <0.002
Cu. o.oo4
Special spectroscopic graphite rod purchased from the National CarbonCompany was used in the preparation of the Ti-Al-C alloys.
III. RESULTS AND DISCUSSION
A. The TL-Cr-Fe System - by R. J. Van Thyne
1. Introduction
The investigation of the Ti-Cr-Fe system was continued from the previousyear's work to clarify some uncertainties. An attempt was made to more ac-curately locate the ternary eutectoid point and to obtain observable ternary
wADc-TR-52-335 2
eutectoid decomposition of the beta phase. Phase relationships were studiedfor alloys containing over 30% total chromium and iron content and solidusdeterminations were made.
The results of work on this system reported last year are included sothat a comprehensive summary is available. No information on the constitu-tion of the titanium-rich corner of the Ti-Cr-Fe system was available priorto the initiation of this work. The only wrk previously reported on thesystem was that for titanium-poor alloys studied by Vogel and Wenderott (2).
As part of the previous year' s work, the binary systems Ti-Cr and Ti-Fewere determined (3,4). Other investigators have also studied the systemsTi-Cr (5,6,7,8,9) and Ti-Fe (5,10,11,12). Both of the binary systems arecharacterized by the eutectoid decomposition of the beta phase.
Most of the work has been concentrated on the titanium-rich corner withcompositions of less than 30% total chromium and iron content. The determina-tion of isothermal sections was the experimental approach used to obtain theternary phase diagram. Vertical sections were used to check the consistencyof the isothermal sections.
While this investigation was in progress, a study of the Ti-Mo-Cr systemat Armour Research Foundation disclosed the existence of a high temperaturemodification of TiCr 2 above at least 130O'C (13). This allotrope has a hexagonalstructure of the MgZn type, isomorphous with TiFe ; whereas, the low tempera-ture modification of WiCr 2 (8) is cubic, of the Mgý 2 type. The existenceof allotropy in TiCr 2 , of course, means a more complicated set of phase re-lationships in this general region than if the phase were monomorphic, as wasfirst assumed.
Additional studies were made late in the investigation in order to clarifythe part that the hexagonal TiCr 2 phase plays in the ternary phase relation-ships. These will be discussed in a separate section. Because they are ofgreatest practical significance, the phase relationships in the titanium-richcorner will be presented first, omitting the equilibria involving the hexagonalmodification of TiCr 2 in an effort to simplify the presentation.
2. Experimental Procedure
a. Melting Practice
The alloy charges and resultant ingots were weighed to the nearest milli-gram. The ingots were melted five times. As the average weight losses onmelting were small, the actual compositions were judged to be very close tothe nominal compositions. Many check analyses, particularly for the binaryalloys, substantiated the general use of nominal compositions.
b. Annealing Treatments
Information on the annealing times used for various temperatures is givenin Table I. All samples heat treated below 8000C were first annealed at 9000C
* Watertown Arsenal Contract No. DA l1-022-ORD-272.
WADC-TR-52-335 3

TABLE I
ANNEALING CONDITIONS FOR Ti-Cr-Fe ALLOYS
Temperature, 'C Time, Hours Temperature, 'C Time, Hours
1300 1/2 750 192 - 288
1200 1/2 - 15 700 192 - 288
1100 1 - 30 65O 432
1050 24 600 576 - 600
1000 2 - 40 550 7o4
900 22 - 72 500 720
800 144 - 170
for 2 to 8 hours and then slowly cooled to the temperature of final anneal-ing. Coring was observed in some alloys containing over 5% total alloy contentof chromium and iron; therefore, these alloys were homogenization anneaLed at1050%C for 24 hours prior to the regular isothermal anneals.
c. Solidus Determinations
Metallographic analysis after isothermal annealing was used to outlinethe solidus surface. The annealing temperatures were selected by first deter-mining the temperature of visible melting upon heating as described previously(1). The accuracy of these data is estimated to be I 109C.
3. Results and Discussion
a. The Phase Diagram
The constitution of the titanium corner of the Ti-Cr-Fe system is of theternary eutectoid type. Curves of double saturation (PT-=c + TiCr anda + TiFe) descend into the space model from the two binary eutectoid pointsat 15% or - 685ýC and 16% Fe - 585wC, respectively, along with that express-ing saturation of the two compounds (P3:TiCr 2 + TiFe). These three spacecurves meet to form a ternary eutectoid point (P!;cL + TiCr2 + TiFe) at ap-proximately 8% Cr-13% Fe and 540ýc.
b. Isothermal Sections
Isothermal sections at temperatures between 900" and 550'C are presentedin Figures 1 to 7. At 900"C, Figure 1, the beta field extends over most ofthe composition area shown. The transition from transformed to retained betaafter water quenching these alloys from the beta state is shown as a shadedband. This appears to be a straight line joining the similar transition
WADC-TR-52-335 4

%000a14
I~ 1 W~
4 W 4
a. za.OzU w U 0C
0 30
4 F 0 00 ~yI- "c2
0 -
Fig.0 1 ata stemlScinat90 fteT-rF ytm
WAO-m~2-3+
w w•(A W
wz z0
04
w +
z0 004
S0 [ 0 0•0 ON 00 x Lx
+ OD
INIn
Fig. 2 - Partial Isothermal Section at 800C of the Ti-Cr-Fe Syutuu.
WAfG-TC-%52-330 6

w
(I))wz0 a..z
W4
U) 0
Cw-
v0,,
W~fC-i~~2%3 7
hi w
4 xz
cc0.
z01O m
04
x Cr.
xi.i X, Paxa 0stera 0eto at 0 0Co th .0-r 0F S .aU
WE+ Th-'0330,
IL
Lu wZ Cf)0 <
w0 0
410
0 .l+
W-
0~QOJ
+ -
Fig.~~~~~C 5 % ata ut~iu eto t60Co h iC-eSam
WA0 x -.- r3341

4t
IIJ
z0
IajZ
n. 00. W
0 w
o x o
**
+ % Q+40 %%
% to%L
Fi. -Patal Istezu %ato t60 fteT-rF yt
mA~-R~-3 1.0

wU)
C4zW0.
wz
C)f
W 0:
C,\N
Fig.7 *Partal sothrma Secionat %OC f th TiCr-F Syteu
WADC.TR-~233LO
compositions in the binary systems; that is, between 6 and 7% Cr and 3 and
4% Fe. The samples of lower alloy content transformed to an acicular product,
alpha prime, partially or completely during water quenching, and those of
higher alloy content consisted entirely of what appears microscopically to
be retained beta. The position of the three space curves of double satura-
tion have been shownL as dotted lines on all of the isotherms.
Sections through the space model at 800", 750", and 7000C (Figures 2
to 4) show the enlargement of the (C + P) and (P + compound) fields. In
general, the limits of the beta field in the isothermal sections were not
deter•ined by the data points obtained at a particular temperature alone.
After the data had been obtained for all temperature levels (900-550°C),graphical interpolation, using the isothermal and vertical sections, was
done, placing emphasis on the binary intercepts. Therefore, the isotherms
shown are an integration of all the data.
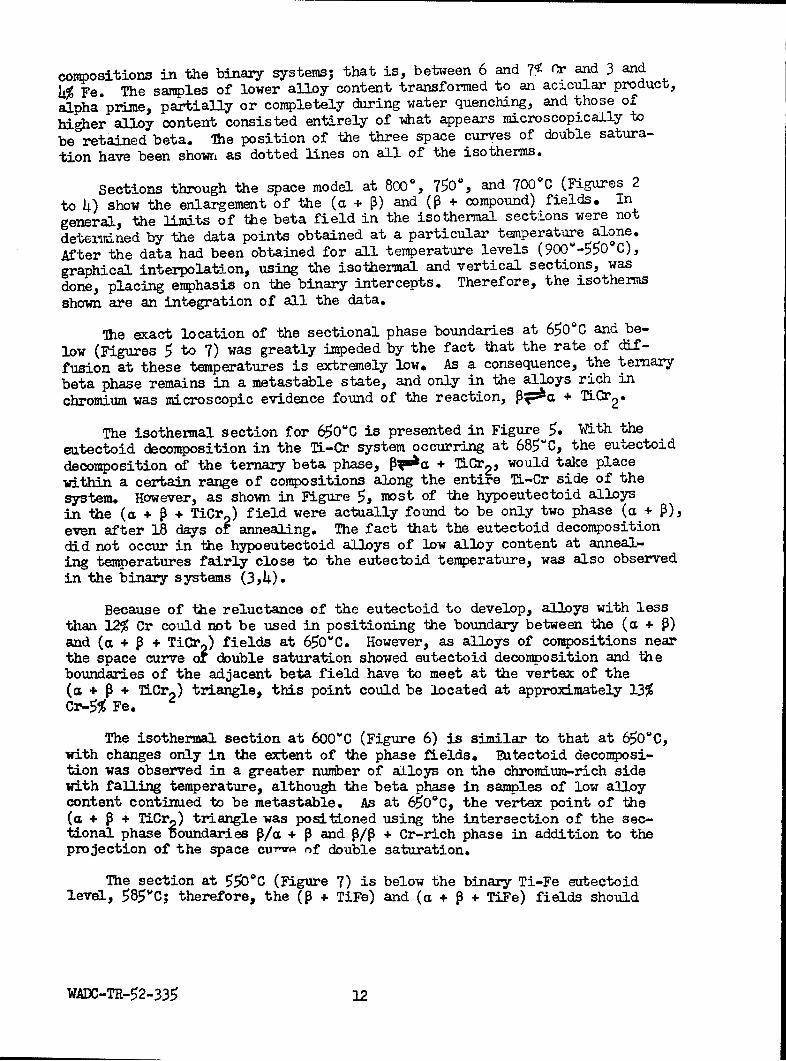
The exact location of the sectional phase boundaries at 6500C and be-
low (Figures 5 to 7) was greatly impeded by the fact that the rate of dif-
fusion at these temperatures is extremely low. As a consequence, the ternary
beta phase remains in a metastable state, and only in the alloys rich in
chromium was microscopic evidence found of the reaction, Poa + TiCr2.
The isothermal section for 650'C is presented in Figure 5. With the
eatectoid decomposition in the Ti-Cr system occurring at 685'C, the eutectoid
decomposition of the ternary beta phase, Pw3a + TiCr2, would take place
within a certain range of compositions along the entire Ti-Cr side of the
system. However, as shown in Figure 5, most of the hypoeutectoid alloysin the (a + P + TiCr ) field were actually found to be only two phase (a +
even after 18 days o? annealing. The fact that the eutectoid decompositiondid not occur in the hypoeutectoid alloys of low alloy content at anneal-
ing temperatures fairly close to the eutectoid temperature, was also observedin the binary systems (3,4).
Because of the reluctance of the eutectoid to develop, alloys with lessthan 12% Cr could not be used in positioning the boundary between the (a + P)and (a + P + TiCr ) fields at 650'C. However, as alloys of compositions nearthe space curve oi double saturation showed eutectoid decomposition and theboundaries of the adjacent beta field have to meet at the vertex of the(a + P + TiCr 2 ) triangle, this point could be located at approximately 13%Cr-5% Fe.
The isothermal section at 6001C (Figure 6) is similar to that at 650QC,with changes only in the extent of the phase fields. EDtectoid decomposi-tion was observed in a greater number of alloys on the chromium-rich sidewith falling temperature, although the beta phase in samples of low alloycontent continued to be metastable. As at 6500C, the vertex point of the
(a + P + TiCr ) triangle was positioned using the intersection of the sec-tional phase goundaries P/a + P and P/P + Cr-rich phase in addition to theprojection of the space c'vv of double saturation.
The section at 550*C (Figure 7) is below the binary Ti-Fe eutectoidlevel, 5851C; therefore, the (P + TiFe) and (a + P + TiFe) fields should
WADC-TR-52-335 12

now be evident. It can be seen from. the d(ta points that no eutectoid struc-tures were observed in ternary alloys on the iron side annealed at 5501Cfor 31 days although under similar annealing conditions the beta phase ofthe binary T1-Fe system started to decompose eutectoidally (3,D). In theiron-rich ternary alloys, the eutectoid decomposition Pqma + TiFe willstart below the eutectoid temperature of the Ti-Fe system. It is not surpris-ing, therefore, that at these low temperatures, equilibrium is approachedonly at a very low rate and that a definite indication of eutectoid was notobserved.
The two curves of double saturation extending from the binary eutectoidpoints were positioned by the identification of either alpha or compoundconstituents in the microstructures of alloys lying on either side of theline. For example, at 550'C (Figure 7), the microstructures of the 2% Cr-11% Fe and the 4% Cr-16% Fe samples consist of (a + P) and (P + TiFe), re-spectively. The 4% Cr-14% Fe alloy is single phase, beta, although the alloyis located in the (a + P + TiFe) phase field. The apparent anomaly is ex-plained on the basis that the composition lies very close to the space curveof double saturation. Thus, no proeutectoid constituents would be expectedin the microstructare, and the indicated beta is metastable.
At 650j and 600"C, the beta field is extensive enough that data pointsare available to accurately locate the limits of the beta field and hencethe other phase fields. However, at 550'C, the beta field is very smalland the data points on the isotherm alone did-not permit the accurate place-ment of phase boundaries. A number of vertical sections were drawn, some ofwhich will be presented later. From the extrapolation of data from highertemperatures, it was apparent that the beta field was very restricted at550"C and that the ternary eutectoid temperature occurs at approximately540uc. Therefore, the beta field has been constructed as very small withthe limits located at points on the space curves of double saturation.The lines expressing double saturation intersect at the ternary eutectoidpoint; approximately 8% Cr-13% Fe.
Although the data are not presented, alloys were annealed at 500"Cfor 30 days. In general, the microstructures were very fine and conclusiveevidence of the binary Ti-Fe or ternary eutectoid decomposition was notobserved in the ternary alloys. Several other techniques were tried toobtain the ternary eutectoid decomposition. A powder sample and a specimenthat had been cold pressed were prepared. As slight amounts of contamina-tion are known to greatly accelerate the reaction, an 8% Cr-13% Fe alloywas prepared using sponge titanium. The above samples were annealed at525%C for 12 days but no definite evidence was found of the ternary eutectoiddecomposition either metallographically or by x-ray diffraction. The ex-tremely fine products observed in some of the microstructures may have beenthe ternary eutectoid, but definite identification was impossible.
The solubility of chromium and iron in alpha titanium is less than 1%total alloy content. The curve of maximum solubility has been arbitrarilydrawn at equal iron and chromium contents. Only a very narrow duplex phasespace exists between alpha and 11Cr 2 , because of the restricted solubilityof chromium and iron in alpha titanium. At equilibrium, the eutectoid reaction
WADC-TR-52-335 13

would be comp.Lete in this region, and. beta is consumed. No attempt was madeto locate the extent of the (CL + TiCr) or (a + TiFe) fields at high alloycontents because they apparently are ýery restricted.
Figure 8, which is a composite of isotherms of the lower surfaces ofthe beta phase space, illustrates the good correlation obtained on combin-ing the results. Although not shown on the diagrams, additional alloys wereprepared and annealed to more accurately locate the ternary eutectoid point.The compositions are shown in Table II. However, because of the very smallsize and small amounts of phases present in these microstructures, the place-ment of the ternary eutectoid point had to be accomplished using only thealloys investigated previously.
c. Vertical Sections
Vertical sections at constant chromium and titanium contents are illustratedin Figures 9 and 10. The data used in preparing these curves were taken fromthe tothermal sections presented earlier. Excellent correlation of data wasobtained when plotting these sections and others that are not shown.
d. Melting Range Determinations
The results of the solidas determinations are presented in Figure 11;the data points shown were determined by metallographic examination of samplesthat were isothermally annealed and water quenched. The isotherms were dramusing previously determined solidus temperatures for the binary systems(3.,4). Incipient melting data were obtained for a number of alloys by visiblesign of melting on heating and, in general, substantiated the isothermsillustrated4 Annealing at 1100% showed that only the binary TI-Fe alloyswere melted; therefore, chromium additions raise the temperature of thebinary Ti-Fe eutectic (1080"C).
e. Ailoys Rich in Chromium and Iron
With the discovery of the hexagonal modification of TiCr , it becameevident that at high temperatures a continuous series of solig solutionsmay exist between Tir and TiFe which are isomorphous. At lower tempera-tures the cubic modifiation of TiCr is stable. If a continuous singlephase f•ield exists between TICr and2 TiFe2 at high temperatures, it mustcontinuously retreat away from hiCr with falling temperature. 7his byitself would not necessarily affect 2 the titanium-rich portion of the diagramthat had been investigated. However, if the hexagonal phase extends intothe ternary system and enters into equilibrium with the beta phase, theisothermal sections would then necessarily contain additional two and threephase regions.
To decide if the phase relationships mentioned above do exist, an x-raypattern was obtained for a 22% Cr-22% Fe alloy annealed at 8ooC. Thissample was found to contain beta, TiFe and the hexagonal modification of
Cr.2* Therefore, the hexagonal modification does enter into equilibriumwith beta. For this reason, the phase relationships concerning Ti(Fe,Cr) 2
WAC-TR-52-335 14

CD
N N
Fig. 8 - Iaotherin of the Lower Surfaces of the Beta Phase
Space in the TI-Cr-Fe System
WADC-- TR-52-335 1%

TABLE II
ADDITIONAL ALLOYS PREPARED TO POSITION THE TERNARY BJTECTOID POINT
Compositions
(Weight Per Cent)
Ti Cr Fe
83 2 15
82 2 16
82 513
81 51
80 5 15
79 5 16
79 8 13
81 9 10
79 11 10
WAD0-TR-52-335 16
+ to
tv
LE
Cl cr- 4
+
NN
o +
N 40
0
+ 0
caI
40co
00~~ 0 .-
00
3~~~ ~ '3f183r~
WA~J-Th.~2-3~ 1

a2o0 I
++
(4 U
a)0
LL i=
L~ 00
a 2 o
C4 ca Cd43
OLI1
~=0
Iri
L 0,
+
ci R 0
0 +
3. 'f±~3dftd+
Wc2 m 33

z
Ij-
-o -Zo0
0 - 0
Fig U z.tewo h oitmS~raeo h iC-eSua~
WAC-T0-2-33 19~
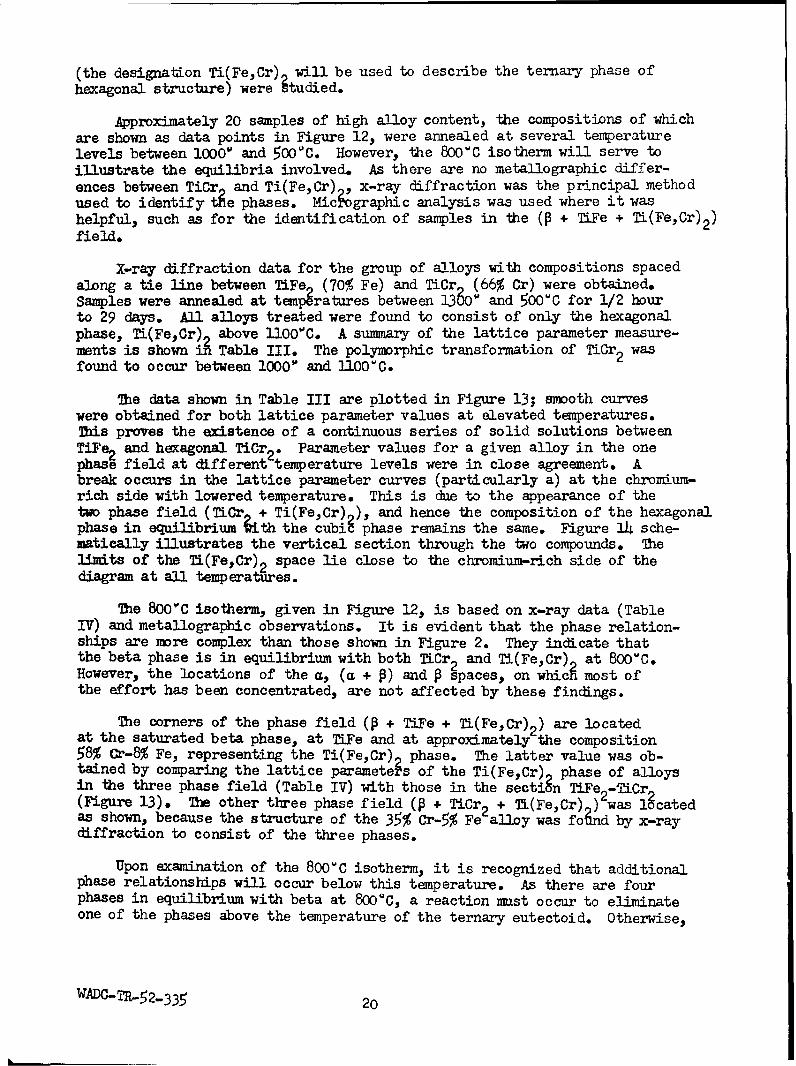
(the designation Ti(Fe,Cr) will be used to describe the ternary phase ofhexagonal structure) were htudied.
Approximately 20 samples of high alloy content, the compositions of whichare shown as data points in Figure 12, were annealed at several temperaturelevels between l000' and 500C. However, the 800"C isotherm will serve toillustrate the equilibria involved. As there are no metallographic differ-ences between TiCr and Ti(Fe, Cr) , x-ray diffraction was the principal methodused to identify tie phases. Mic~ographic analysis was used where it washelpful, such as for the identification of samples in the (P + WiFe + Ti(Fe,Cr) 2 )field.
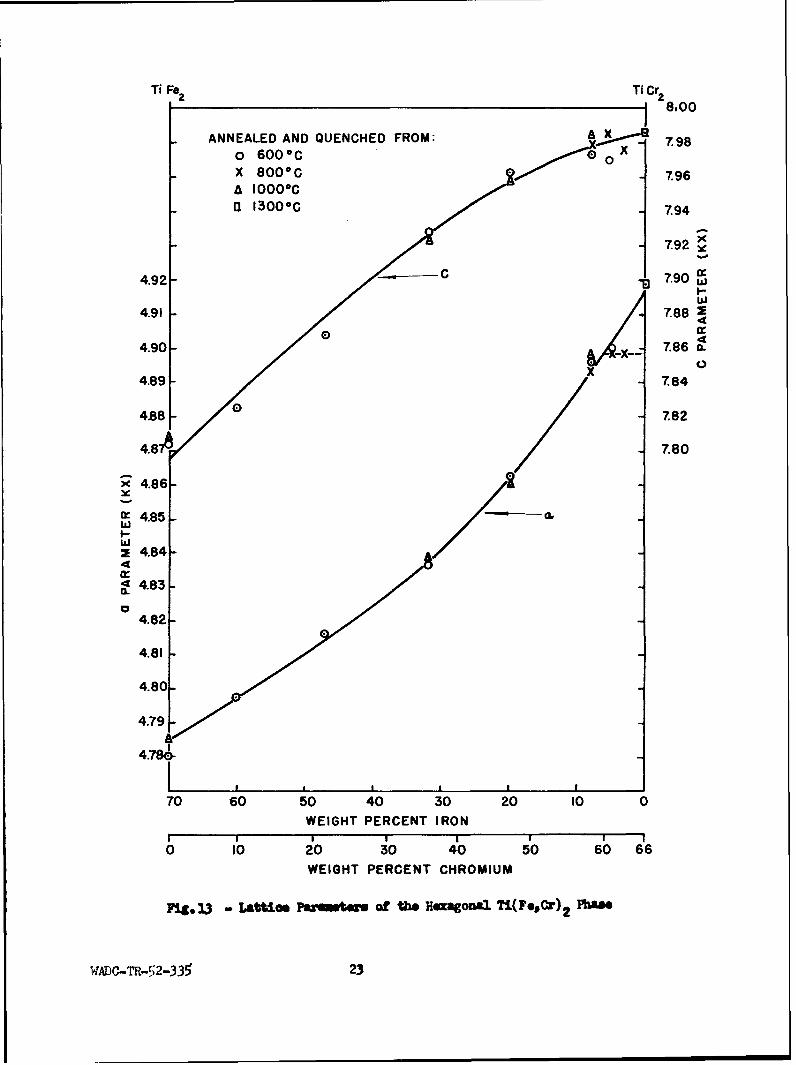
X-ray diffraction data for the group of alloys with compositions spacedalong a tie line between TiFe (70% Fe) and TiCr (66% Cr) were obtained.Samples were annealed at temperatures between 1300 and 500'C for 1/2 hourto 29 days. All alloys treated were found to consist of only the hexagonalphase, Ti(FeCr) above llO1'C. A summary of the lattice parameter measure-ments is shown i Table III. The polymorphic transformation of TiCr 2 wasfound to occur between 1000" and ll0WC.
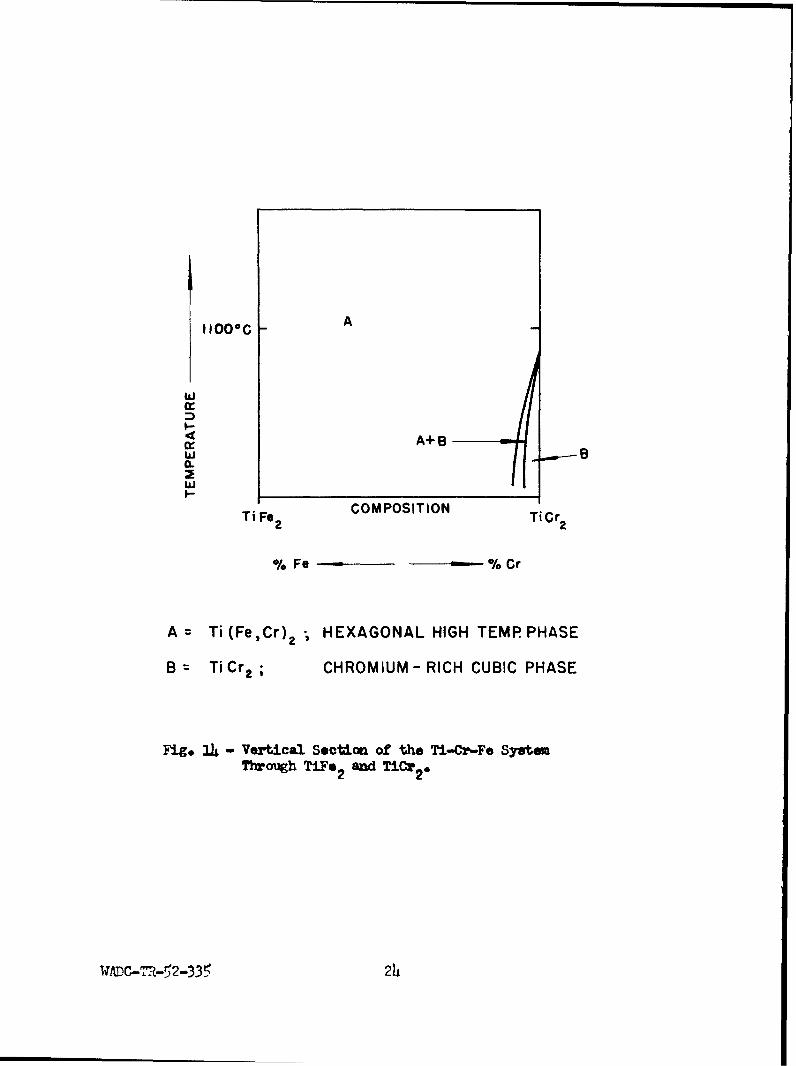
The data shown in Table III are plotted in Figure 13; smooth curveswere obtained for both lattice parameter values at elevated temperatures.This proves the existence of a continuous series of solid solutions betweenTiFe 2 and hexagonal TiCr 2 . Parameter values for a given alloy in the onephase field at different temperature levels were in close agreement. Abreak occurs in the lattice parameter curves (particularly a) at the chromium-rich side with lowered temperature. This is due to the appearance of thetwo phase field (TiCr + Ti(Fe,Cr) ), and hence the composition of the hexagonalphase in equilibrium •Ith the cubig phase remains the same. Figure l sche-matically illustrates the vertical section through the two compounds. Thelimits of the Ti(Fe,Cr) 2 space lie close to the chromium-rich side of thediagram at all temperatures.
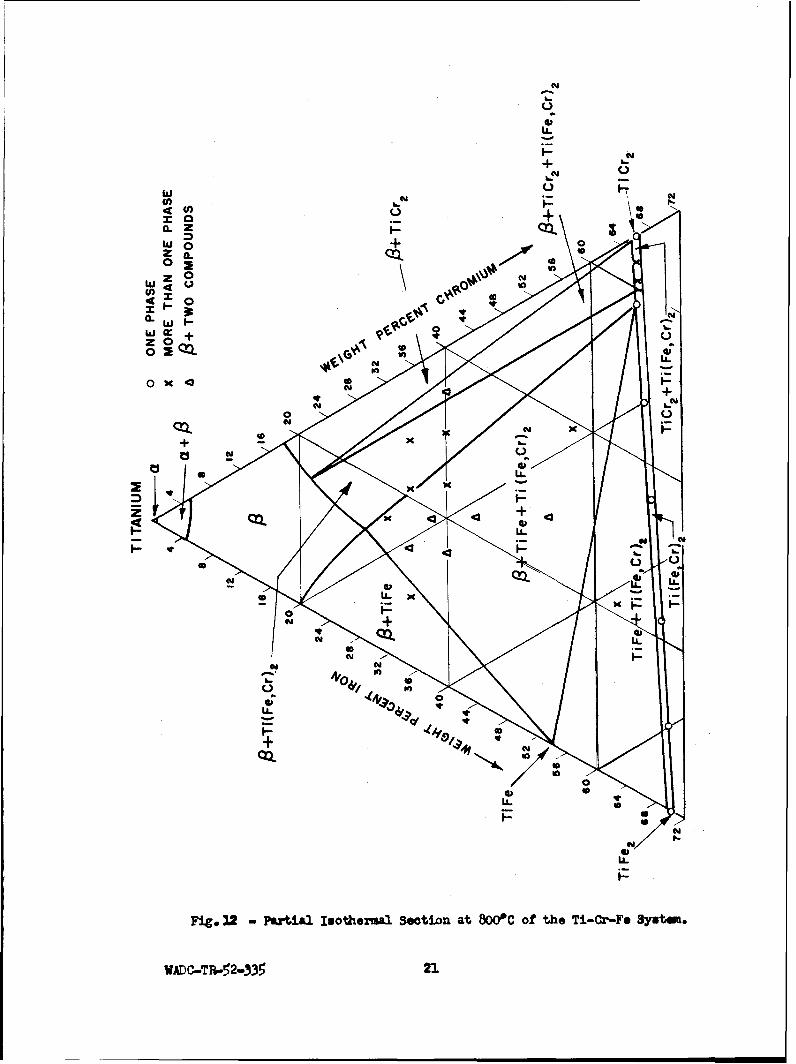
The 800"C isotherm, given in Figure 12, is based on x-ray data (TableIV) and metallographic observations. It is evident that the phase relation-ships are more complex than those shown in Figure 2. They indicate thatthe beta phase is in equilibrium with both TiCr 2 and Ti(Fe,Cr) at 800"C,However, the locations of the a, (a + P) and P spaces, on whicR most ofthe effort has been concentrated, are not affected by these findings.
The corners of the phase field (P + TiFe + Ti(Fe,Cr) 2 ) are locatedat the saturated beta phase, at TLFe and at approximately the composition58% Cr-8% Fe, representing the Ti(Fe,Cr) phase. The latter value was ob-tained by comparing the lattice parametehs of the Ti(Fe,Cr) 2 phase of alloysin the three phase field (Table IV) with those in the section TiFe2-TiCr,(Figure 13). The other three phase field (P + TiCr 2 + T•(Fe,Cr) ) was l9catedas shown, because the structure of the 35% Cr-5% Fe alloy was fo~.nd by x-raydiffraction to consist of the three phases.
Upon examination of the 800oC isotherm, it is recognized that additionalphase relationships will occur below this temperature. As there are fourphases in equilibrium with beta at 800"C, a reaction must occur to eliminateone of the phases above the temperature of the ternary eutectoid. Otherwise,
WADC-TR-5 2- 3 3 5 2o
C-)
gJ-
+b.C-)
(I)
4(i0 +
Z a-0:ZO0W4 0 00
U)D
Fig 120PrilIohra eto tBO fteT-rF yta
x ACTi-2.3 21

TABLE III
X-RAY DIFFRACTION DATA FOR ALLOYS LYING ON THE SECTION TiCr 2 -TiFe 2
Compositions Lattice Parameters(Wt. %) Annealing Treatment of Ti(Fe,Cr) 2
Ti Cr Fe (1C) (Hrs.) Phases Observed c(kX) a(kX) c/a
34 66 0 1300 1/2 Ti'r2 (Hex.) 7.987 4.919 1.6241200 1/2 TiCr 2 (Hex.)1200 15 TiCr2 (Hex.)1100 1 •(• (Hex.)ao00 30 TiCr 2 (Hex.)
1000 2 TiCr 2 (Hex.) +TiCr 2 (Cubic)
1000 40 cr 2 (Cubic)900 22 iiCr 2 (Cubic)
34 63 3 800 144 TL(FeCr) 2 + TiCr 2 7.976 4.899 1.628700 288 Ti(FeCr) 2 7.976 4.900 1.628
34 61 5 800 144 Ti(FeCr) 2 + TiCr 2 7.983 4.899 1.630600 576 Ti(FeCr) 2 + 7.971 4.900 1.627500 696 Ti(Fe,Cr) 2
34 58 8 1000 30 Ti(Fe,Cr) 2 7.985 4.898 1.630800 170 Ti(Fe, Cr) 2 7.976 4.896 1.629700 288 Ti(Fe,Cr) 2 7.967 4.894 1.628600 576 Ti(FeCr) 2 7.974 4.896 1.629
33 47 20 1000 30 Ti(Fe,Cr) 2 7.963 4.861 1.638800 170 Ti(Fe,Cr) 2 7.968 4.862 1.639600 i14 Ti(Fe, Cr) 2
32 36 32 1000 30 Ti(Fe, Cr) 2 7.925 4.839 1.638800 170 Ti(FeCr)2600 144 Ti(Fe,Cr) 2 7.928 4.838 1.639
31 22 47 600 14 Ti(Fe,Cr) 2 7.869 4.812 1.635
30 10 60 600 L44 Ti(Fe,Cr) 2 7.806 4.780 1.633
30 0 70 1000 30 TLFe2 7.808 4.783 1.632800 170 TiFe2600 144 TiFe2 7.806 4.780 1.633
WADC-TR-52-335 22
Ti Fe2 T! Cr28,00
ANNEALED AND QUENCHED FROM: 7.98o 6000C 0 X
x 800 0C - 7.96A 10000Ca 1300 0 C 7.94
- 7.92
4.92 - C 7.90.-
4.91 7.88 1
0,.4.90 7.86
4.89 7. 84
4118 7.82
4.87 -7.80
x 4.86-
(z 4.85 a.IjI-bJ
: 4.84
< 4.830.
4.82-
4.81
4.80 "
4.79 -
4.780-III I I I I
70 60 50 40 30 20 10 0
WEIGHT PERCENT IRONSII I I I I I
0 10 20 30 40 50 60 66WEIGHT PERCENT CHROMIUM
Fig. 33 - Lattios Pawm*twG Of the H=4agona. Ti(FGCr))2 P
WADC-TR-52-335 23
A+A
I IOOOGA
r A+13wB0.
w
COMPOSITIONTi Fe2 Ti Cr 2
% Fe = -% Cr
A= Ti (Fe,Cr) 2 -, HEXAGONAL HIGH TEMP PHASE
B = Ti Cr 2 ; CHROMIUM- RICH CUBIC PHASE
Fig. 114 - Vertical Section of the Ti-Cr-Fe SystemThrough TiFe2 and TiCr 2*
WADC-TR-52-335 24
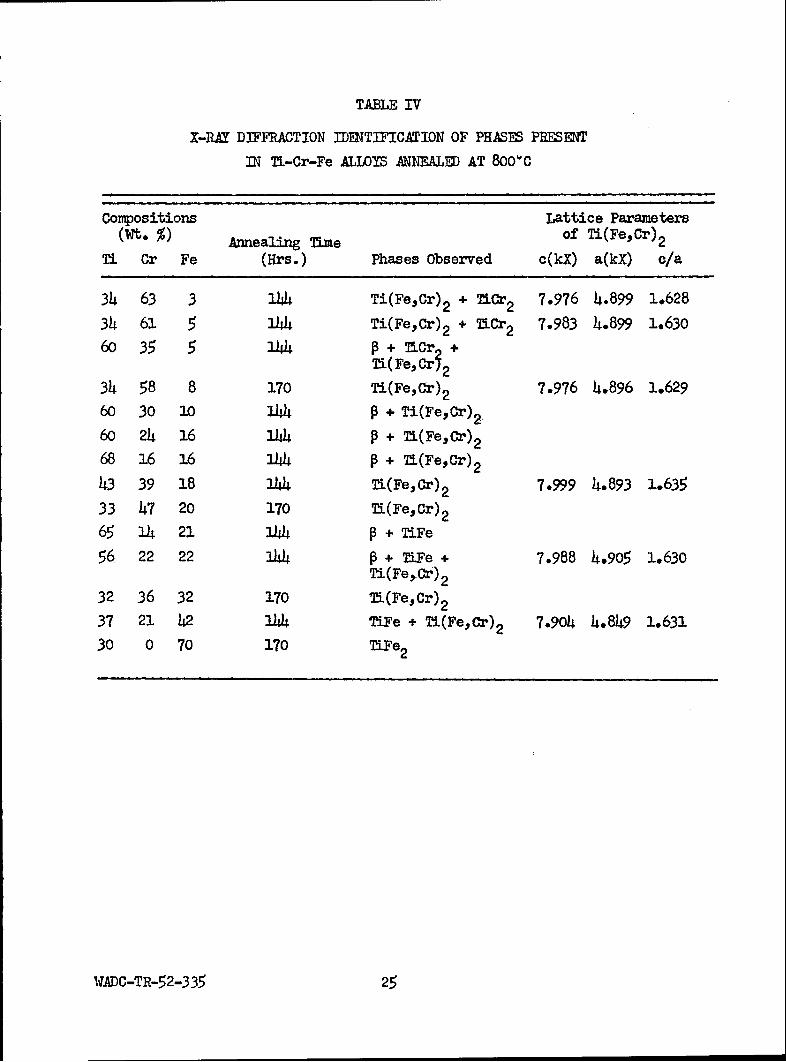
TABLE IV
X-RAY DIFFRACTION IDENTIFICATION OF PHASES PRESENT
IN Ti-Cr-Fe ALLOYS ANNEALED AT 800"C
Conpositions Lattice Parameters(Wt %) Annealing Ilme of Ti(Fe,Cr) 2
Ti Cr Fe (Hrs.) Phases Observed c(kX) a(kX) c/a
34 63 3 144 Ti(Fe,Cr) 2 + TICr 2 7.976 4.899 1.628
34 61 5 144 Ti(Fe,Cr) 2 + '1Cr2 7.983 4.899 1.630
60 35 5 144 p ~ + TCr +Ti(Fe,Cr52
34 58 8 170 Ti(Fe,Cr) 2 7.976 4.896 1.629
60 30 10 144 p + Ti(Fe,Cr) 2
60 24 16 144 p + T2(FeCr) 2
68 16 16 144 p + T2(Fe,Cr) 2
43 39 18 144 T2(Fe, Cr) 2 7.999 4.893 1.635
33 47 20 170 TL(Fe,Cr) 2
65 14 21 144 p +TiFe56 22 22 144 P + TliFe + 7.988 4.905 1.630
Ti (Fe, Cr) 2
32 36 32 170 TL(Fe,Cr) 2
37 21 42 144 WiFe + Ti(Fe,Cr) 2 7.904 4.849 1.631
30 0 70 170 TLFe 2
WADC-TR-52-335 25

five phases would be in equilibrium at the ternary eutectoid temperature andthis is theoretically impossible in a ternary system.
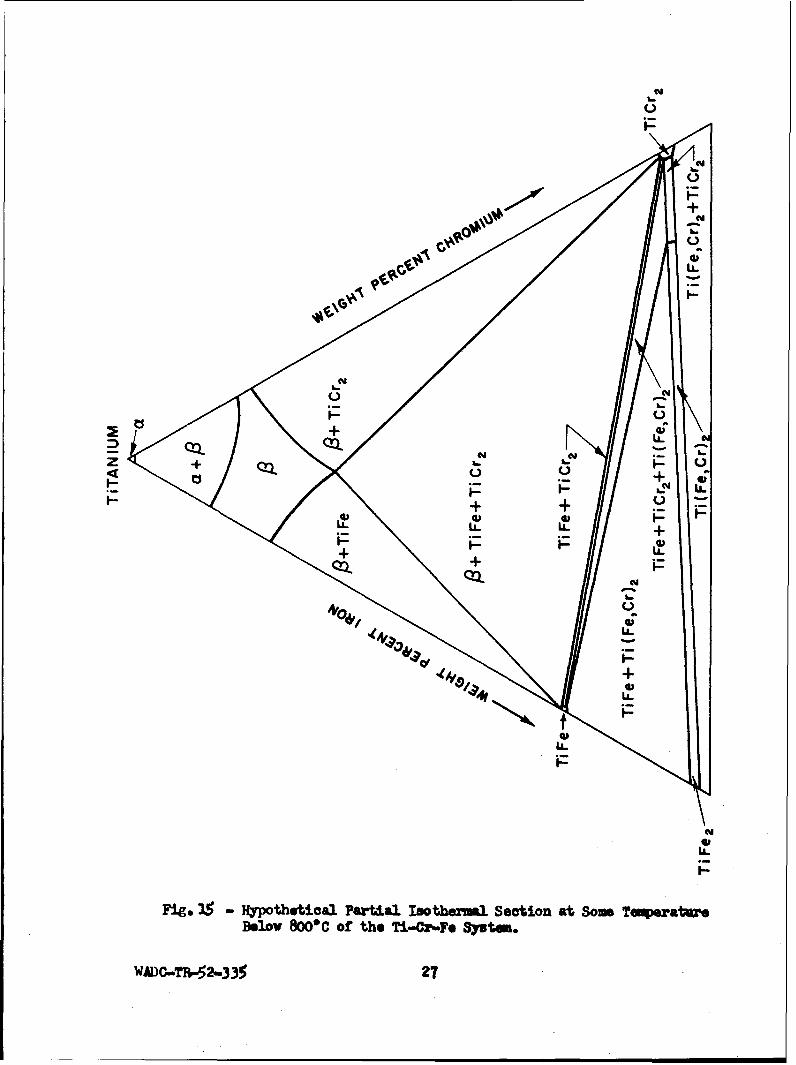
If a four phase reaction, P + Ti(FeCr)2 TiFe + TiCr 2 , takes place ata temperature slightly below 800'C, an isothermal section similar to thatshown in Figure 15 would result. Such a reaction will involve all alloyslocated within the area consisting of the following phase fields shown inFigure 15:
+ TiFe + TiCr 2 )
(TiFe + Ti~r2)
(TiFe + TiCr 2 + Ti(Fe,Cr) 2 )
In alloys lying on the low titanium side of a tie line extending betweenTiFe and TiCr , beta will be consumed under equilibrium conditions and theother three p;ases remain. In compositions on the high titanium side of thetie line, TL(Fe,Cr) 2 will be consumed and the phase space (P + TiFe + TiCr 2 )results. Comparing Figure 15 with Figure 2, it can be seen that the phaserelationships are the same in the titanium-rich portion. Therefore. the iso-thermal sections at this unknown temperature and at lower temperatures wouldbe correct as previously drawn.
7b determine the temperature at which Ti(Fe,Cr) is no longer in equilibriumwith beta, alloys located at the chromium-rich side 3f the (P + TiFe + Ti(Fe,Cr) 2 )field (Figure 12) were annealed at various temperatures and examined by x-raydiffraction analysis. The results are shown in Table V. The cubic modifica-tion of TiCr was not observed in the samples at any temperature; hence, theassumption tUat the above proposed four phase reaction exists may be wrongor the reaction may be too sluggish to proceed even though long annealingtimes were used.
If the previously proposed four phase reaction does not occur, an alternatereaction, P + TiCr -a + Ti(FeCr)., could proceed at a temperature betweenthe binary Ti-Cr e tectoid temperature (675'C) and the ternary eutectoid tempera-ture (54V1C). If this reaction should occur, a section similar to that shownin Figure 16 would result. Below the temperature of this reaction, the "binary"eutectoid decomposition on the chromium side would be P3 :cL + Ti(FeCr) 2 andthe ternary eutectoid would consist of (a + TiFe + Ti(Fe,Cr) 2 ).
Had a ternary eutectoid reaction taken place, identifiuation of the phasespresent could have yielded the information as to whether either TiCr or Ti(Fe,Cr) 2was eliminated above the ternary eutectoid temperature. As discusseg previously,no observable decomposition of the beta phase was obtained. For simplicity,it was assumed that the eutectoid decomposition of the ternary beta involvedthe phases a, TiFe and TiCr 2 .
f. Lcro structures
Only a limited number of photomicrographs are presented as, in generalthe microstructures observed were similar to those of the binary alloys (3,4).The low solubility of chromium and iron in alpha titanium is indicated by the
WADC-TR-52-335 26
CY-
z+
F--U
LL U!L +
F--
Fig. +$*Hpteia ata s hzJ eto tSn eeawBslov CO fth i.r.eSse.
Wm TT~.5..*0&12
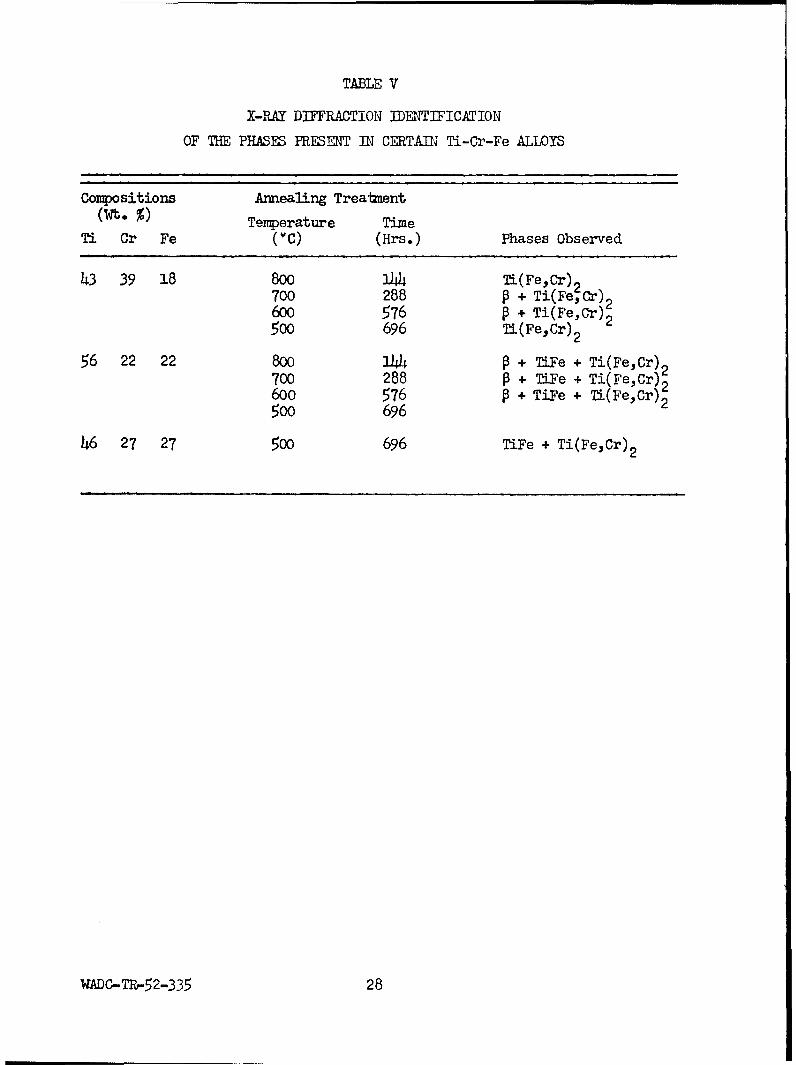
TABLE V
X-RAY DIFFRACTION IDENTIFICATION
OF THE PHASES PRESENT IN CERTAIN Ti-Cr-Fe ALLOYS
Compositions Annealing Treatment(Ut. %) Temperature Time
Ti Cr Fe (*C) (Hrs.) Phases Observed
43 39 18 800 1W4 Ti(Fe,Cr) 2700 288 P + Ti(Fe,Cr) 2600 576 P + Ti(Fe,Cr) 2500 696 Ti(Fe,Cr) 2
56 22 22 800 144 + TLFe + Ti(FeCr),700 288 P + TiFe + Ti(FeCr)2600 576 P + TiFe + Ti(Fe,Cr) 2
500 696
46 27 27 500 696 TiFe + Ti(Fe,Cr) 2
WADC-TR-52-335 28

NQ
++
z
LL.L
P
+ LOL
COL +
Fi. 6- ~otitia Pr~i1Iatma Scio f a* iC0F SuwiaSoim4e U.~rtr ewen69ad!JC
WADC-R-52-3j72
duplex structure of Figure 17. Figure 18 illustrates the eutectoid structuresobserved in the (a + P + TICr ) space. As previously discussed in anothersection, there was no microst uctural evidence of eutectoid in the (a + P +TLFe) space. Also, no ternary eutectoid was noted at 500'C, although thistemperature is below the ternary eutectoid plane. The Ti(Fe,Cr) 2 phase isillustrated in Figure 19.
Figure 20 shows the microstructure of an alloy annealed at 8000 C in the+ TiFe + Ti(Fe,Cr),) space. An x-ray diffraction pattern of this sample
confirmed the metalloýraphic evidence of the two intermediate phases. Todifferentiate between the coexisting intermediate phases, staining etchantswere tested. Ten per cent aqueous solutions of the following etchants wereused:
H2CrO4, swabbed and electrolytic
KCN., swabbed
K 2 Cr2 o7, swabbed
I4n04, swabbed
l5Fe(CN)6 + NaOH, swabbed and electrolytic
Of the many etchants tried, electrolytic etching with the KFe(CN) +NaOH solution was the most useful. The polished samples were etdhed fiastwith a HNO + HF + glycerine solution (Figure 20) and were then electrolyticallyetched witi the K3 Fe (CN) 6 + NaOH solution, preferentially staining Ti(Fe,Cr)2(Figure 21).
A size difference may be noted in Figure 20; Ti(Fe,Cr) is larger withthe smaller TLFe crystals surrounding it. In order to provm that the differen-tial staining in Figure 21 is due to the different phases present and notJust size variations, binary alloys containing either TiCr or TiFe were stain-etched. Both alloys were polished and etched under conditions identical tothose used in the preparation of Figure 21. Figures 22 and 23 conclusivelyshow that TiCr is heavily stained whereas the TiFe is unaffected by the K2Fe(()6+ NaOH + H20 eichant.
As another technique of differentiating between the two compounds, heattinting was tried. With this method a sample previously polished is placedin a preheated furnace with an air atmosphere. At 700oCs the only temperatureinvestigated, 40 seconds appeared to be the best time. Shorter times resultedin little tinting, whereas longer times produced deeper tints that masked thetrue structure. By heat tinting it was possible to differentiate between thetwo compounds, but stain etching was found to give better results.
g. Hardness
Vickers hardness data of Ti-Cr-Fe alloys armealed at and quenched fromtemperatures between 1000" and 650"C are presented graphically in Figure 24.The alloys used are on the vertical section through the ternary system at theCr:Fe ratio of 1:1. These alloys exhibit the same trends observed in thebinary systems Ti-Cr and Ti-Fe (3,4). The hardness carves for samples water
WADC-TR-52-335 30
ii •" . 7 ,<.iX /"/ "
A/
Fig, 1 7 Fg 1~~ /
Neg No ... 7089 500
'+" . /" { " .... cc/ /i ..
4,. ' '7
Fig.Fig l?1 1
A~~~ ~~ 0.5% Cr-0.5% Fe alloy., water quenched A1%C-%F ~osnelda~~~~~after annealing at 800• fo 3 or. 60C for 1432 hours. adwtr unhdAlpha+retined Nearl (s ingler pa sent., uTi ecrod( +T)2ead2 rmr
Etch;"t 60"i glcrn., 20. HN- 20 HF
I' 31
Neg. No. 37089 X 500Ng.o.38X O
Rig. 17ig..11
A 0.5~ ~ 4% Cr-205 % Fe alloy, water quenchedA12CrFealyaneedtafteranneling at60ofoer 1nne32n hors 6800 C for 1432 hours. adwtrunhd
Etchantin6a gatrerneof2retained203H
WADC-R-52-35 3
j' ~ ,
-o
~ ~Jr
4~4Z
Neg. No. 5256 X 750 Neg. No. 5257 X 750
Fig. 20 Fig. 21
A 22% Or-22% Fe alloy, annealed at 800"C The same microstructure as Fig. 20.for 1I44 hours and water quenched. Ti(Fe,Or) 2 is now stained althoughTiU(Fe.,Cr) 2 (larger crystals) and TiFe TiFe is not. Etchant: electrolyticin a matrix of' P. Etchant: HNO 3 + HF K Fe(CN)6 + NaOH + H 0 superimposed+ gyeine. upon the structure eiched with HN03
+ HF + glycerine.
14. 4).l - jFor)
" 7 ,
IF :q
;ir2 Mcat Saea Fg 1.-ca:Smea ig*1
WAD'-r- P-3c5 3
500 •9OC O°
0u 8000 C
8000C 0 750 C• •A 7oo00 C
O f 000OOC-SPECIAL40 QUENCH
••00zx
I00
i I 1 I I I I IO5 I0 15
TOTA L ALLOY % (FE, CR RATIO=I:II )
Fig. 24 - Vlokeru Hardness of fl.-C.-Fe Aloyu (Fe, Cr Ratio - 1:1).
WaDO..23 3
quenched from above 8000C reach a peak at about 5% total alloy content, whichcorresponds to the composition at which beta is retained upon water quench-ing. In the binary alloys, hardness peaks at 7% Cr and 4% Fe were obtainedon quenching from the beta field.
Annealing the ternary alloys at 650" or 7000C resulted in a linear in-crease in hardness with total alloy content up to 10%. Such alloys have (a +structures, and are much softer than the product, beta prime, obtained byquenching from above the transformation temperature. It can be seen from Figure24 that the hardness of alloys in the lower composition range, i.e., those inthe commercial alloy region, may be very greatly changed by heat treatment.The hardness of the 5% alloy annealed at 650=C is 200 DPH, but quenching thesame alloy from 900QC resulted in a hardness of over 500 DPH.
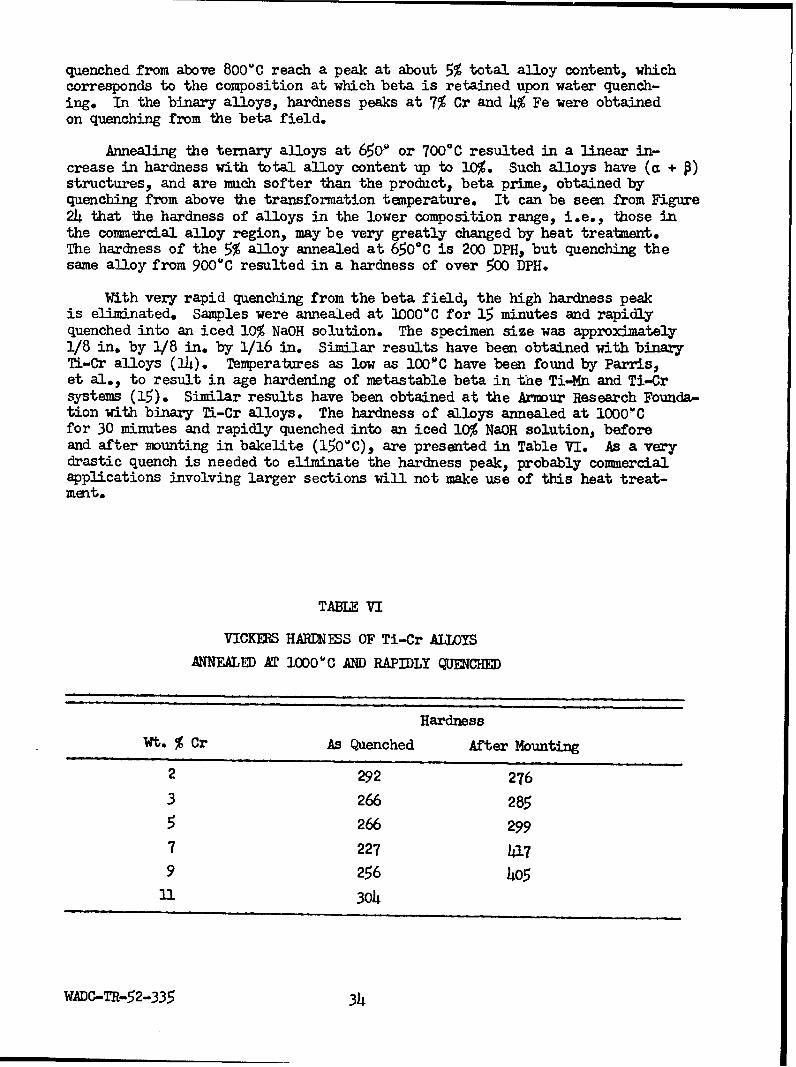
With very rapid quenching from the beta field, the high hardness peakis eliminated. Samples were annealed at 1000"C for 15 minutes and rapidlyquenched into an iced 10% NaOH solution. The specimen size was approximately1/8 in. by 1/8 in. by 1/16 in. Similar results have been obtained with binaryTi-Cr alloys (1 4 ). Temperatures as low as 1000 C have been found by Parris,et al., to result in age hardening of metastable beta in the Ti-Mn and Ti-Crsystems (15). Similar results have been obtained at the Armour Research Founda-tion with binary Ti-Cr alloys. The hardness of alloys annealed at 1000%Cfor 30 minutes and rapidly quenched into an iced 10% NaOH solution, beforeand after mounting in bakelite (150"C), are presented in Table VI. As a verydrastic quench is needed to eliminate the hardness peak, probably commercialapplications involving larger sections will not make use of this heat treat-ment.
TABLE VI
VICKERS HARDNESS OF Ti-Cr ALLOYS
ANNEALED AT 1000"C AND RAPIDLY QJUECHED
Hardness
Wt. % Cr As Quenched After Mounting
2 292 276
3 266 285
5 266 299
7 227 417
9 256 4053. 304
WADC-TR-52-335 34
B. The Ti-AL-O and Ti-Al-N Systems - by R. J. Van Thyne
1. Experimental Procedure
a. Alloy Preparation
Oxygen and nitrogen were added during ingot preparation as master alloys.An oxygen master alloy containing 25% oxygen was prepared by melting iodidetitanium and pressed titanium dioxide (40% 0) powder. The Ti-25% 0 alloy ismore easily handled during weighing and charging than the pressed TiO2 powder.
Chemical analysis indicated that titanium-nitride received from an out-side source contained large amounts of impurities (2.7% calcium). Therefore,a master alloy containing approximately 12% nitrogen was prepared by meltingnitrided sponge titanium. As the sponge melted with difficulty, the alloywas diluted by the addition of titanium to lower the melting point. The chemicalanalysis of the final alloy was 6.69% nitrogen.
Both master alloys are friable and were used as -8 +16 mesh lumps result-ing from crushing the ingots. Melting the 10-gram Ti-Al-O and Ti-Al-N1 composi-tions five times produced homogeneous ingots. Previous work with similaralloys showed that actual compositions follow nominal compositions closely.Weight loss data and chemical analysis proved this to be true.
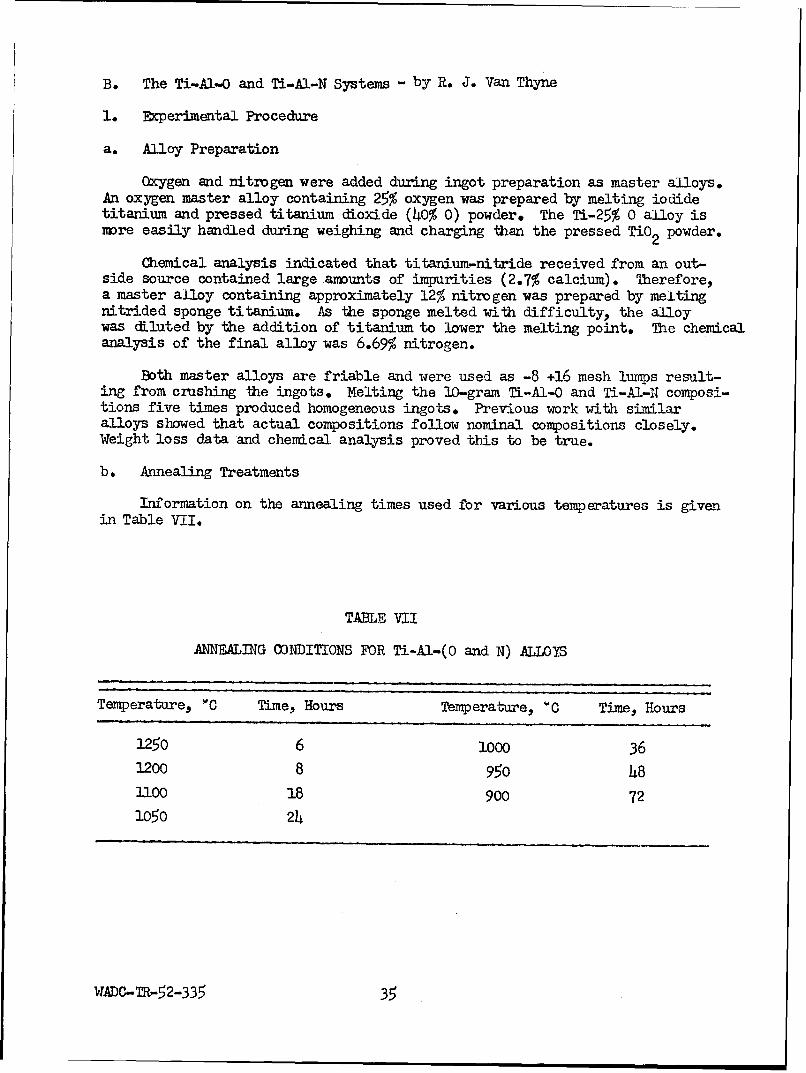
b. Annealing Treatments
Information on the annealing times used for various temperatures is givenin Table VII.
TABLE VII
ANNEAMING 00NDITIONS FOR Ti-Al-(O and N) ALLOYS
Temperature, "C Time, Hours Temperature, WC Time, Hours
1250 6 1000 361200 8 95o 48
11OO 18 900 721o5o 24
WADC-TR-52-335 35
2. Discussion of Results
a. The Phase Diagrams
Figures 25 and 26 illustrate partial vertical sections through the Ti-Al-Oand Ti-AL-N space models, respectively. The phase diagrams were constructedplacing emphasis on the binary intercepts of the previously determined Ti-Al(16) and Ti-O (17) systems. As can be seen, both oxygen and nitrogen raisethe P/a + P space boundary and widen the (a + P) field of the Ti-Al system.Nitrogen raises the 3/a + P boundary appreciably more than oxygen. No attemptwas made to locate the P/a + P boundary for alloys containing 1% nitrogen.
Microstructures of Ti-Al-N alloys containing 0.25% nitrogen are presentedin Figures 27 to 29. They depict the P, (a + P) and a fields, respectively.The beta phase is not retained upon water quenching the Ti-Al-O or Ti-Al-Nalloys but transforms to a serrated or acicular alpha prime structure. Theaddition of the interstitially soluble elements appears to refine the trans-formation structure.
b. Hardness
Vickers hardness data obtained for Ti-Al-O and Ti-A1-N alloys, annealedin the alpha field, are presented graphically in Figures 30 and 31, respectively.Considerable difficulty was encountered in getting reproducible values. Largedifferences in average values were produced by successively grinding out theold impressions and making new ones. For example, a series of values obtainedby the latter method on a Ti-8% Al-l% 0 sample annealed at 900wC were 394,435, 470 and 496 DPH. The reasons behind these hardness variations are notknown but upon averaging the values for several temperature levels, correlat-able data were obtained as illustrated in Figures 30 and 31.
The results show that for a given aluminum level, the hardness generallyincreases with increasing oxygen and nitrogen content; nitrogen has the greaterhardening effect. Although not conclusive, previously determined data of theTi-AI system indicated a peak hardness at about 11% aluminum for alloys an-nealed in the alpha field (4,16). The average hardness data of Ti-A1 alloysannealed at 700w and 800wC are reproduced in the figures for comparison.
A hardness peak is apparent for all the curves in Figures 30 and 31.The composition of maximum hardness moves to lower aluminum contents withincreasing amounts of the interstitial elements. One per cent nitrogen hasthe greatest effect; the maximum hardness of over 500 Vickers occurs at about3 to 4% aluminmm. A minimum in the curve for 1% nitrogen has been shown asa dashed line because only a few data points are available at these composi-tions and only this one curve exhibits the minimum. The curve may very likelybe correct as it is expected that with increasing aluminum content the hardnesscurve for ternary alloys has a minimim similar to that obtained for the Ti-Alalloys. Data for the latter alloys indicates a minimum hardness at 16% aluminum.As the alpha field of the Ti-Al system extends to 25% aluminum at the tempera-ture involved, and no phase changes are known to occur at lower temperatures,the reason for the indicated hardness minimum in the binary or ternary alloysis not known.
WADC-TR-52-335 36
I
I II
i I
II
0 OXYGEN 0.25% OXYGEN
1100 00000 1100 0 X
S0 x X0 X X 0
cr w-p
0-
-
S-
0o
0 X X 0
4 1000- 000 0 00,
bJ
..
/00
I- W X X 0 0 0
x 0 aaa900 xoo 1 0 900 'x 0 0 0 0
0 2 4 6 8 10 12 0 2 4 6 8 10 12% ALUMINUM % ALUMINUM
III
III II
I
0.5% OXYGEN 1.0% OXYGEN
1100 0 0 x x 0 1100 xx 0 00
0~
0 X X 0 0 X X X 0
Lu 0cc . a + i
c
I.- 41000 x 0
0~02 2w x 0 0 0 0 L2 0
900 0 0 0 0 900 0 0 0 0 0
a I I I I I I I I I
0 2 4 6 8 10 12 0 2 4 6 8 10 12% ALUMINUM % ALUMINUM
0 ONE PHASE X TWO PHASE, a+R
Fig. 25 - Vertical Sections at Constant Oxygen Content of the Partial Ti-Ai-CSystem
WAllC-PR-52-335 37

1100 o0000 1100 0 0 x x x
00 X o-0 X X X 0
'Jr
-I000 0 00 X 0 0- I-0000- X X 0 0
w0.
44 w X.- x 0
900 X O o09x 0
0 NITROGEN 0.25% NITROGENI I II I I I
0 2 4 6 8 10 12 0 2 4 6 6 10 12%ALUMINUM % ALUMINUM
0 ONE PHASE
1 0 -XX TWO PHASES,a+--
1200°- 0/ X X X X
,,ooC x/ x x x/ xS1000 X X 0 00 X- x x x 0 0
I 1 a +
SX X 0 o X- 0 x 0
i-w I.-W /o o o €
9000- o 900 -
0.5 % NITROGEN 1.0%/ NITROGEN
x x 0 0 IOIx I 0 0 0
0 2 4 6 8 10 20 2 4 6 8 0 12
% ALUMINUM % ALUMINUM
Fig. 26 - Vertical Sections at Constant Nitrogen Content of the Partial T¶-Al-NSystem
WAuG-'11t-:;2-335 38

-~ X
f- 4t- I
Neg. No. 7310 X 200 Neg. No. 73U2 X 200
Fig. 27 Fig. 28
A 2% A1-0.25% N alloy., water quenched A 6% A1-o.25% N alloy., treated theafter amealing at 1000"C for 24 hours. same as the sample of Fig. 27.Transformed (a +
Neg. No. 7312 X 200
Fig. 29
A 10% .Al-0,25% N alloy., treated the sameas the specimen of Fig. 27. Large grainediso thermal cc.
Etchant: 60 glycerine., 20 HNI03, 20 H-F
WADO-7R-2-335 39
500 1 I 1
1.0% 0 A
400-S- -
0
•, -
"•~~~ 5% 9- OYE
z0 0
300.2025%X0 0
/xI0 0 .. IU) x
042 0 0 025%0
0
200- 7X 0 % OXYGEN
x 0' 0.25% OXYGEN0 0.5% OXYGEN
A1.0% OXYGEN
/xx
100 J I I I0 2 4 6 a 10' 12
WEIGHT PERCENT ALUMINUM
PU*. 30 - Averg. Vickems R•aewe of Ti-.A-Oflo3 A' A=ma3ed in the Alpha Thuospa" at 2oeo Bebm W C.
WADC-TaH.52-335 4

I.O%N
0.5%N /.o_ •.•-- -
00
400z 1
-r O.25%N 00
300-
xx
X 0% NITROGEN
200- x 0 0.25% NITROGEN
00.5% NITROGEN
A% 1.0% NITROGEN
x
1001 x0 2 4 6 810 12
WEIGHT PERCENT ALUMINUM
YUg. 31 - Average Vickwo Harda~se of Ti-Al-N Alloys Anne"led in the Alpha Phamespaos at Tovrsuawes Between W0 and 1200%C
WADC-Th-52-335 41i
C. The Ti-Al-C System - by R. J. Van Thyne
L. Experimental Procedure
a. Alloy Preparation
The preparation of homogeneous carbon-bearing alloys caused considerabledifficulty. Alloys containing less than 1% carbon were prepared using spectro-graphic graphite rod, 1/8 in. diameter by 1/8 in. long. However, the graphitedid not dissolve even with long melting times and many remelts. The 1/8 in.pieces of graphite were used rather than powder because the low density powderis troublesome in arc melting.
Efforts were then turned to producing a good master alloy. When a tungsten-tipped electrode was used, tungsten contamination would result from the highcurreat and long melting times required; therefore, a carbon tip was employed.The amount of carbon pick-up from the tip during melting was rather erratic.Homogeneous ingots containing a few per cent carbon were difficult to meltand were not frangible. A 13% alloy had a very high melting point; consequently,this composition was discarded. As a 30% master alloy was melted more easilythan those of lower composition and was friable, this composition was used.Often the master alloy consisted of an inner core of compound surrounded bya case of apparently lower melting alloy. This difficulty was circumventedby crushing the ingot to powder and remelting.
Ti-AI-C ingots weighing 10 grams were prepared using pieces of the 30%alloy (chemical analysis: 30.o% C) approximately 1/8 in. in size and meltingfive times. It was found necessary to keep the ingots molten for longer timesthan are usually employed. A tungsten-tipped electrode was Employed as themelting currents and times were not excessive. Chemical analyses indicatedthat carbon contents were very close to the nominal compositions.
b. Annealing Treatmets
Samples were annealed at temperatures between 1150w and 600C. The speci-mens that were heat treated at 750' and 600-c were first annealed at 950Cfor 48 hours and then furnace cooled to the temperature of final annealing,Table VIII gives information on the annealing times used for various tempera-tures.
2. Discussion of Results
a. The Ti-C Diagram
Data obtained from as-cast microstructures of the various master alloyscontaining up to 30% carbon permitted an outline of the Ti-C system to be con-structed. The probable diagram is presented in Figure 32.
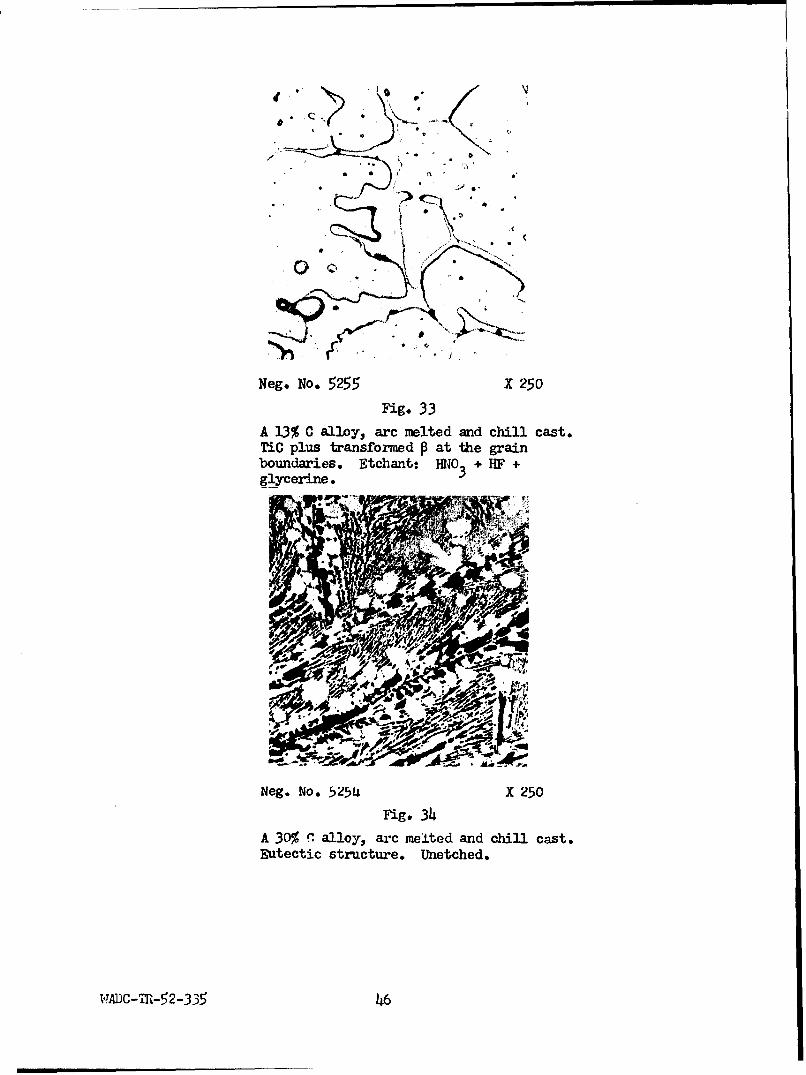
Extremely high melting alloys in the compound region indicated an openmaXimum for TiC. Figure 33 illustrates the duplex (p + TiC) microstructureof a 13% carbon alloy. A nominal 15% carbon master alloy, previously madefor an alloy development program, was entirely TiC. Therefore, the lowerlimit of the TiC phase field is near 15% carbon. The compound appears to
WADC- TR-52- 3 3 5 42

TABLE VIII
ANNEALING TIMES FOR Ti-AL-C ALLOYS
Temperature, 'C Time, Hours Temperature, "C Time, Hours
11o 16 900 72
1O5O 30 850 118
1000 40 750 240
950 48 600 576
WADC-TR-52-335 43
LIQ
3000
2600
LIQ
Ti C
2200+
LIQ+ TiC
wDLIQ +/ TiC TIC+ C
S1800
w
14003+ TiC
1000 a +/
a
a + TiC
,, I i p
0 10 20 30 40WEIGHT % CARBON
Fig, 32 - Probable Type of Phase Diagram for the Partial System Ti-C.
14NC-TM-52-335 44
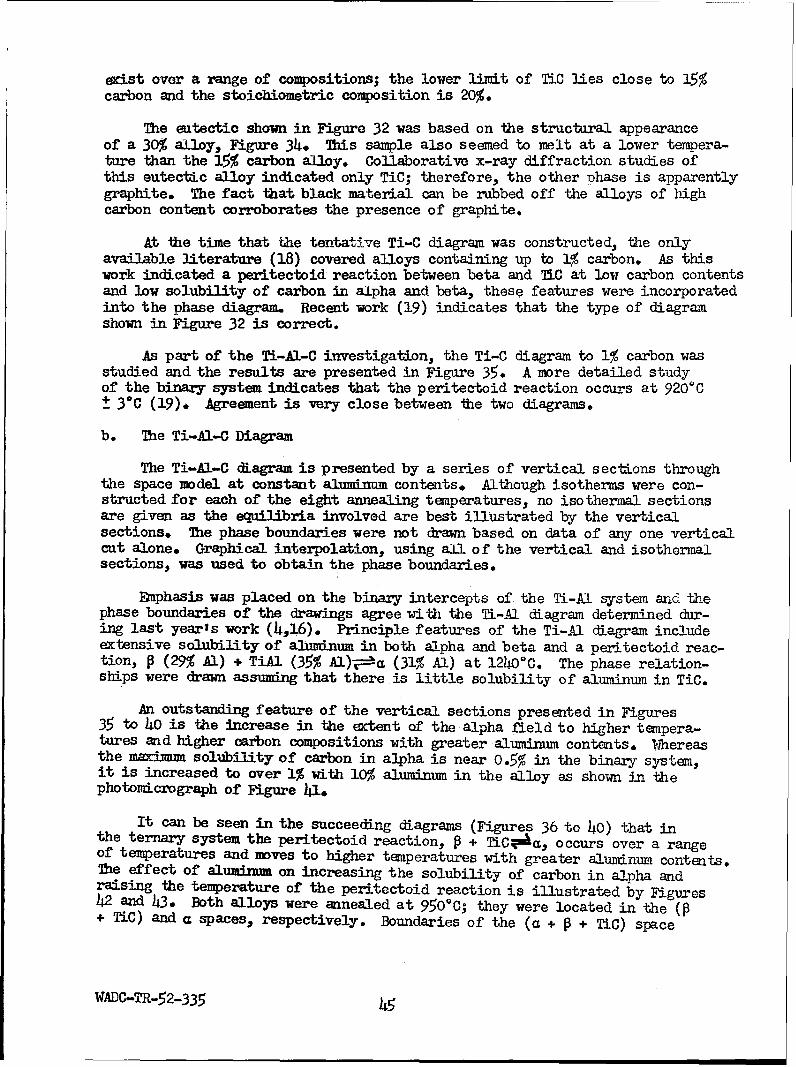
exist over a range of compositions; the lower limit of TiC lies close to 15%carbon and the stoichiometric composition is 20%.
The eutectic shown in Figure 32 was based on the structural appearanceof a 30% alloy, Figure 34. This sample also seemed to melt at a lower tempera-tare than the 15% carbon alloy. Collaborative x-ray diffraction studies ofthis eutectic alloy indicated only TiC; therefore, the other phase is apparentlygraphite. The fact that black material can be rubbed off the alloys of highcarbon content corroborates the presence of graphite.
At the time that the tentative Ti-C diagram was constructed, the onlyavailable literature (18) covered alloys containing up to 1% carbon. As thiswork indicated a peritectoid reaction between beta and TiC at low carbon contentsand low solubility of carbon in alpha and beta, these features were incorporatedinto the phase diagram. Recent work (19) indicates that the type of diagramshown in Figure 32 is correct.
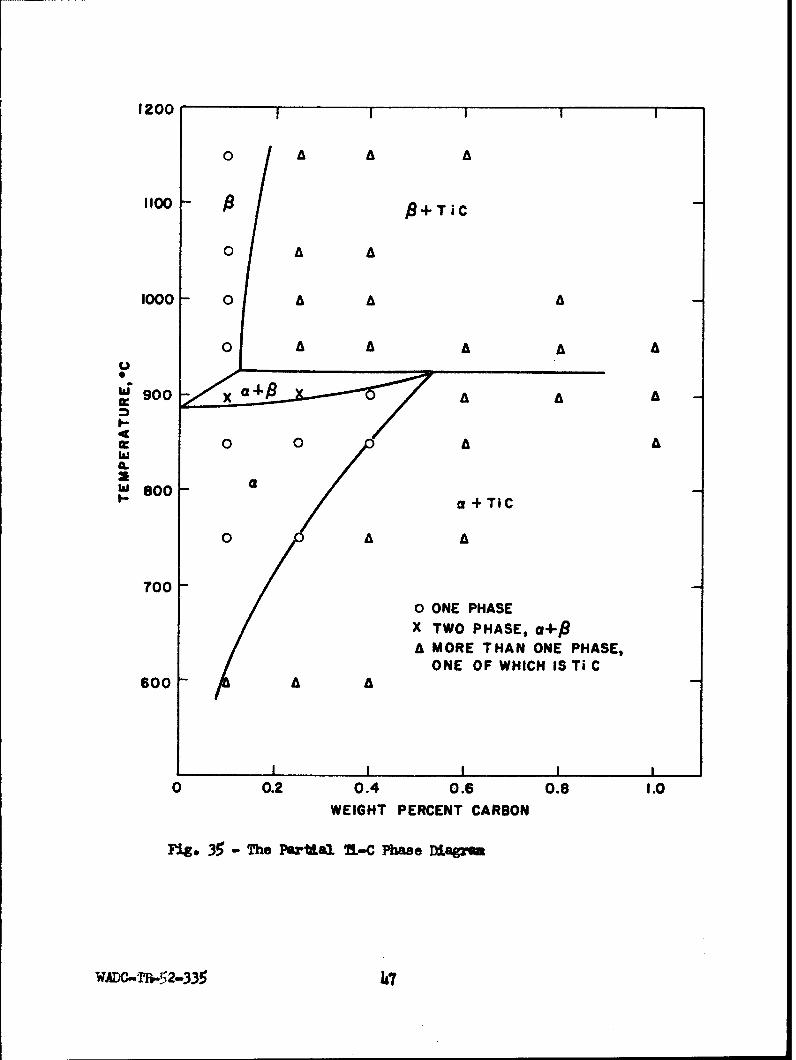
As part of the Ti-AI-C investigation, the Ti-C diagram to 1% carbon wasstudied and the results are presented in Figure 35. A more detailed studyof the binary system indicates that the peritectoid reaction occurs at 920"Ct 3°C (19). Agreement is very close between the two diagrams.
b. Te Ti-AI-C Diagram
The Ti-Al-C diagram is presented by a series of vertical sections throughthe space model at constant aluminum contents. Although isotherms were con-structed for each of the eight annealing temperatures, no isothermal sectionsare given as the equilibria involved are best illustrated by the verticalsections. The phase boundaries were not drawn based on data of any one verticalcut alone. Graphical interpolation, using all of the vertical and isothermalsections, was used to obtain the phase boundaries.
Emphasis was placed on the binary intercepts of the Ti-Al system and thephase boundaries of the drawings agree with the Ti-A1 diagram determined dur-ing last year's work (4.,16). Principle features of the Ti-A] diagram includeextensive solubility of aluminum in both alpha and beta and a peritectoid reac-tion, P (29% Al) + TiAl (35% Al)j`a (31% Al) at 124.0°C. The phase relation-ships were drawn assuming that there is little solubility of aluminum in TiC.
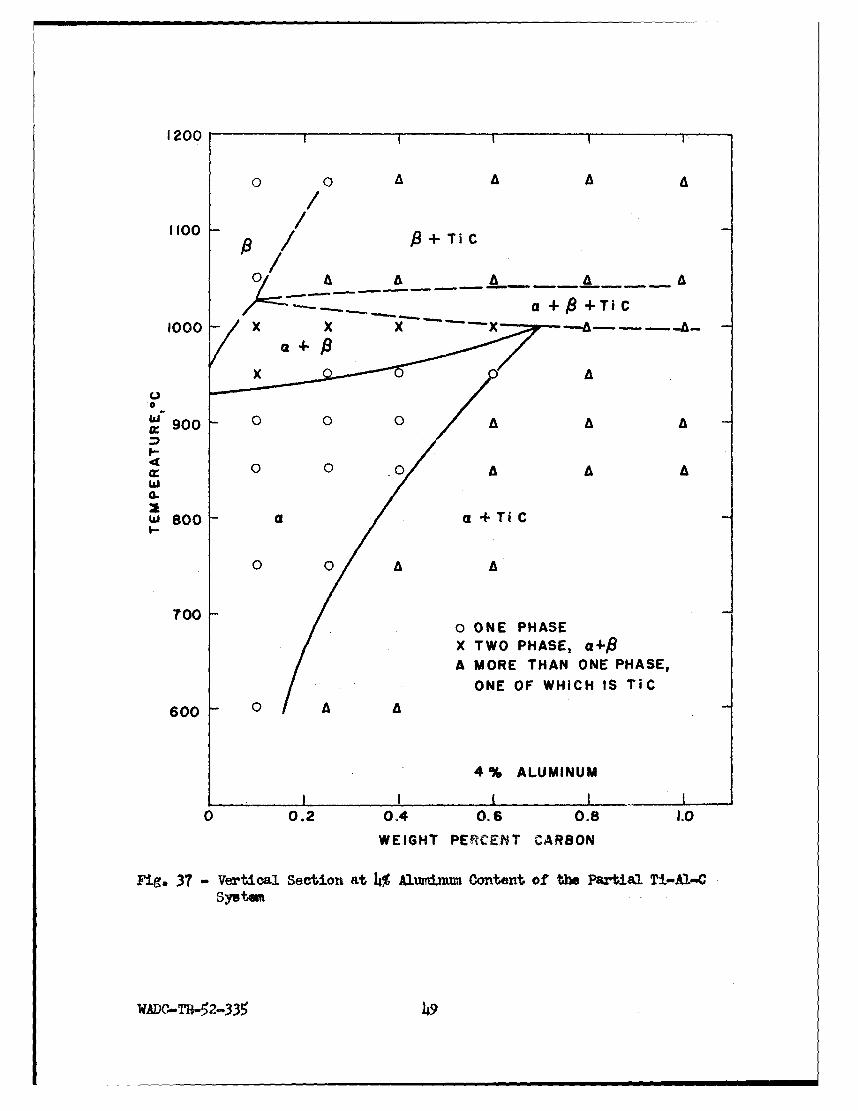
An outstanding feature of the vertical sections presented in Figures35 to 4o is the increase in the extent of the alpha field to higher tempera-tures and higher carbon compositions with greater aluminum contents. Whereasthe maximum solubility of carbon in alpha is near 0.5% in the binary system,it is increased to over 1% with 10% aluminum in the alloy as shown in thephotomicrograph of Figure 41.
It can be seen in the succeeding diagrams (Figures 36 to 40) that inthe ternary system the peritectoid reaction, P + TiCVma, occurs over a rangeof temperatures and moves to higher temperatures with greater aluminum contents.Mhe effect of alumirxmm on increasing the solubility of carbon in alpha andraising the temperature of the peritectoid reaction is illustrated by Figures42 and 43. Both alloys were annealed at 950OC; they were located in the (•+ TiC) and a spaces, respectively. Boundaries of the (a + g + Tic) space
WADC-TR-52-335 45
IMN
Ne.No 25' 5Fi.3
A~~~ 13 (loacmle n hl at
Ti plstasomda hVri
Neg. No. 5254 X 250
Fig. 33A 30% r alloy., arc melted and chili cast.
boundarie5 strctur.ant: heOd.F
WAD C -M-5glycer33ne.
1200 I
o A A A
1100 - A .8+TiC
0
o A A
1000 0 A A A-
S -A
0 0 A AILl
ae 0 0 aa +TIC
o A A
700 -
0 ONE PHASEX TWO PHASE, a+-#9
A MORE THAN ONE PHASE,ONE OF WHICH IS Ti C
600 -A A
I I I II
0 0.2 0.4 0.6 0.8 1.0WEIGHT PERCENT CARBON
Fig. 35 - The Par•.al 7.-C Phase Diagram
WADC-TM.52-335 47

1200 1 i
/
1100 / +rTiC
0/
1000 0
a±~.4TIC/ x x × .-x. .. - - -
a:
w 900 -
I-
00 A A
800
ONE OFWIC SCI
/9-
00
0 02 ONE PHASEWG TWO PHASE, a+R 8
/ A MORE THAN ONE PHASE,
SONE OF WHICH IS Ti C
600 I A
2% ALUMINUM
0 0.2 0.4 0.6 0. 8 1.0WEIGHT PERCENT CARBON
Fig. 36 - Vertical Section at 2% Alumirnum Content of the Partial TL-Al-C
WADC-TR-52-335 48
1200 1
1100 + / 8ITi C
0 - - - -- A- A
Sa +8 + Ti C1000 xxx ý -
AAC-,
0
w
0 A
X T00 PHSE a4-68
A MORE THAN ONE PHASE,
ONE OF WHICH IS TIC
600 0
4 % ALUMINUM
I --L I0 0.2 0.4 0.6 0.8 5.0
WEIGHT PERCEZNT CARBON
Fig, 3T - Verticoal Section at 4~% Aluundmnu Content of the Partial Ti-Al-CSystem

1200 I 1 1
0 a A A A
/ /3+TiC,,o/J . - - - - - -,ac1100 (+~+T
/4 x I---"-" ---- A
1000 0 0A
o 0 0 0 A
/A10 0 0 0 A
goo - a a OT A
0 07. 00 a 4-i
6 o ALUMINUM
0 0.2 0.4 0.6 0.8 1.0
WEIGHT PERCENT CARBON
Fige 38 - Vertical Section at 6- AlmdJmtm Contbent of the Partial Ti-Al-C
X$TW PHSEa4
WADC-T-52-335 5o
I II I I
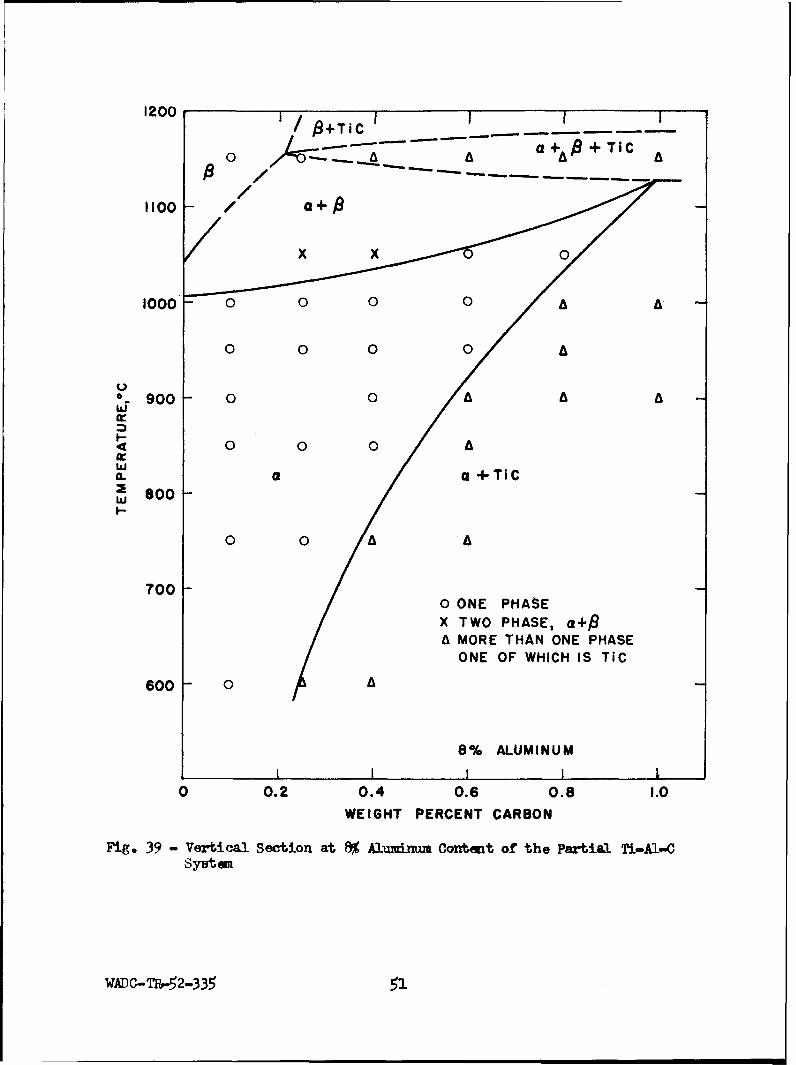
1200 8.TiC
A a4-++TICA0A
0 0
1000 "0 0 0 0 A
U 0 0 0 00 900 - 0 0 a
4 0 0 0 a
wa. a a +TiCw BOO-I,-
0 0 A
7000 ONE PHASEX TWO PHASE, a+pA MORE THAN ONE PHASE
ONE OF WHICH IS TiC600 - 0
8% ALUMINUMI I I I
0 0.2 0.4 0.6 0.8 1.0
WEIGHT PERCENT CARBON
Fig. 39 - Vertical Section at 8% Aluuinum Content of the Partial Ti-Al-CSyeten
WADC-Tf,-52-335 51
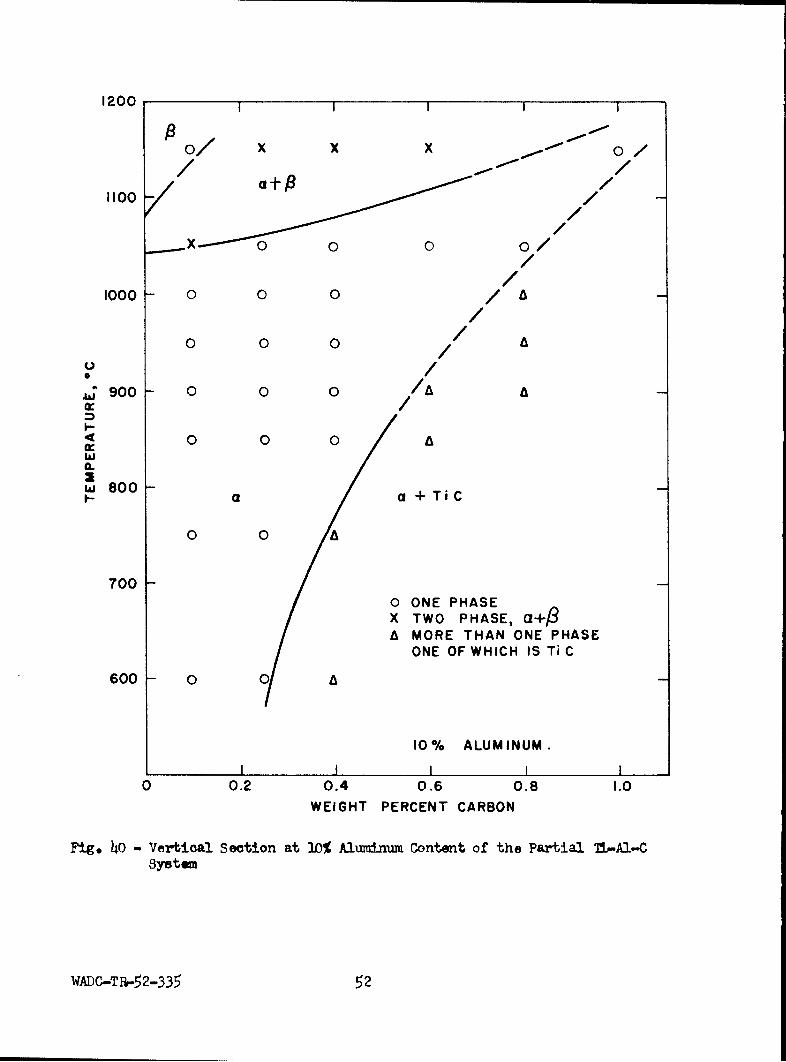
1200
o/ x x x /
1100o/
//0 0 0 0/
/1000 0 0 0
/o 0 0 /
U: /0
u;900 0 0 0A
I-.
0 0 0 A
a.
w 800a a+TiC
0 0a
7000 ONE PHASEX TWO PHASE, a+A MORE THAN ONE PHASE
ONE OF WHICH IS Ti C
600 0 0 A
10% ALUMINUM.I I I II
0 0.2 0.4 0.6 0.8 1.0WEIGHT PERCENT CARBON
Fig. 40 - Vertical Section at 10% Aluminum Content of the Partial Th-AI-Csystem
WADC-TR-52-335 52

Neg. No. 7307 X 200Polarized light
Fig. 41A 10% A1-l.0% C alloy, water quenchedafter annealing at 1150'C for 16 hours.Bquiaxed a.
Neg. No. 6627 X 200 Neg. No. 6628 X 200Polarized light
Fig. 42 Fig. 43
A 0,6% C alloy, annealed at 950ý C for A 4% A1-0. 6% C alloy., annealed at48 hours and water quenched. TiC in 950°C and water quenched, Largea matrix of transformed beta. equiaxed grains of alpha.
Etchant: 60 glycerine., 20 BN0 3, 20 HF
WADC-TR-52-335 53

have been shown as dashed lines as it is difficult to differentiate betweenalpha apd alpha prime in the microstructures containing large amounts of TiC.X-ray diffraction was not useful for this determination as the beta phasetransforms to alpha prime upon water quenching.
Certain identification of the indicated (a + TiC) microstructures couldbe made for alloys with aluminum contents of 0 to 8% for all carbon composi-tions (0 to 1%). TiC was also definitely observed in the Ti-lO% A1-0.40% Csample. However, microstructures unlike those for the other alloys were ob-served for the following:
Ti-l0% AL-0.6% CTi-lO% Al-O.8% CTi-l0% Al-l.0% C
Photomicrographs of Ti-8% Al-0.8% C and Ti-l0% Al-0.8% C alloys, annealedat 900'C for 72 hours and water quenched are presented in Figures 44 and 45,respectively. The former consists of (a + TiC) and the latter is apparentlyalpha plus a different phase and probably TiC. An x-ray diffraction patternwas obtained for a Ti-lO% Al-l.0% C alloy annealed at 750°C for 10 days andwas identified as alpha plus a new phase. The lines of the new phase (TableIX) could not be indexed as TiC, TiAl, or TiAl but were indexed as belong-ing to a cubic structure. As seen in Table IX, close correlation was obtainedbetween the experimental and calculated lattice parameter values; therefore,the phase apparently has a cubic structure with a = ll.20 kX. Using x-raydiffraction, the new phase was not observed in the Ti-l.O% C or Ti-8% Al-l% Csamples.
Because of the uncertain identification of the Ti-l0% Al-(0.6, 0.8, 1.0)%
C alloys, the (c/a + TiC) boundary in Figure 40 has been dashed above 0.5%carbon. A reaction could occur that would bring a new phase into equilibriumin the section illustrated by Figure 40. In a later part of this report,the existence of a series of ternary phases having the compositions Ti X0Oand TiXaO will be discussed. It is possible that a similar ternary iMt~r-mediati 3hase is formed in the Ti-Al.-C system and this will be investigatedduring the next year.
c. Hardness
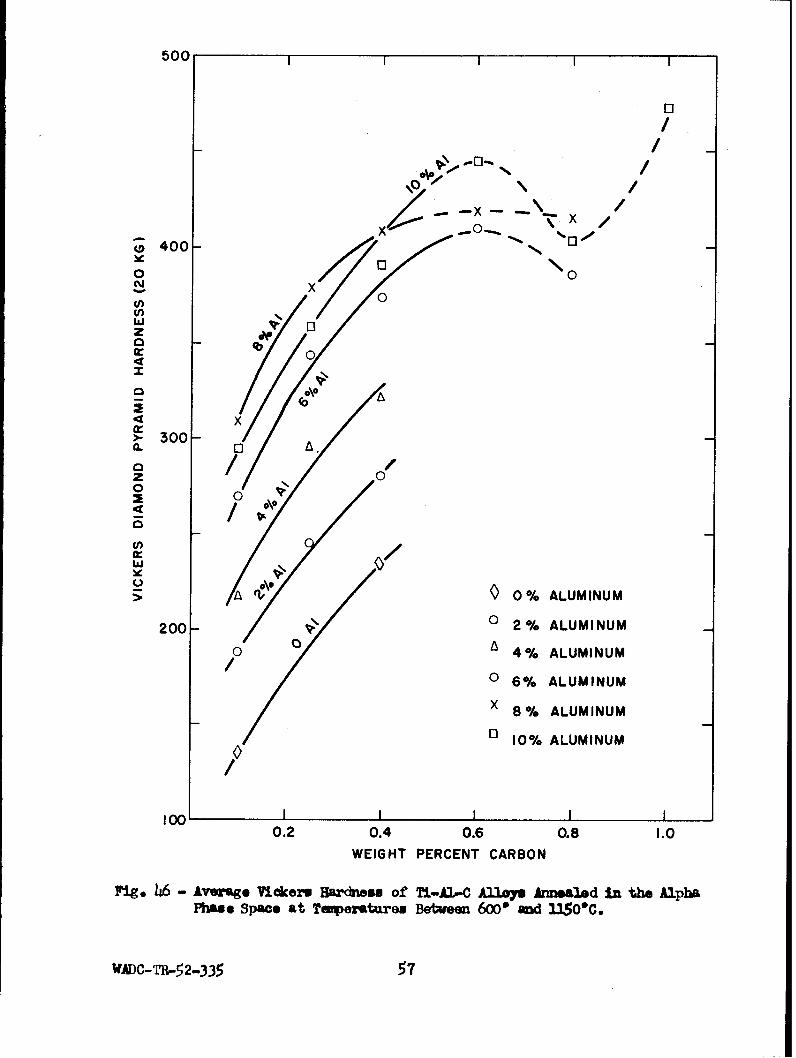
Vickers hardness data were obtained for the Ti-Al-C alloys used for thephase diagram study. At any given aluminum content, the most pronounced hard-ening occurs when the carbon is taken into solution in alpha titanium. In-creasing amounts of carbon beyond the solubility limit result in a relativelysmall increase in hardness.
Figure 46 illustrates the effect of increasing aluminum and carbon contenton the hardness of alpha alloys. The data represent average hardness valuesobtained for one or more heat treatments in the alpha field. The curve for8% aluminum lies above that for 10%; however, this is within experimentalaccuracy. Above 0.6% carbon, the data indicate a hardness peak or plateau;however, the curves have been shown as dashed lines as only a few data pointsare available at these higher alloy contents.
WADC-TR-52-335 54

f*- /.,i/
An 8A./" C alo .,,wtr unce
A /
int 9/ .I ../ i7 ¶+
Neg. No. 7367 X 750
Fig. 45
An 80% AIl-o.8% C alloy., trater thenched
afer. aNneain at6 9O o 725o0s
as te smpl ofFig. 44. lh n
(i i + TiC)
•- - ..-.- -+ ¢ ,
- ,
Neg. No. 7366 X 750
Fig. 15A 10% AL-0.8% C alloy, treated the sameas the sample of Fig. ht4. Alpha + un-identified phase and probably TiC.
Etchant: 60 glycerine, 20 HNO3 , 20 HF
WAW--C.-52-335 55
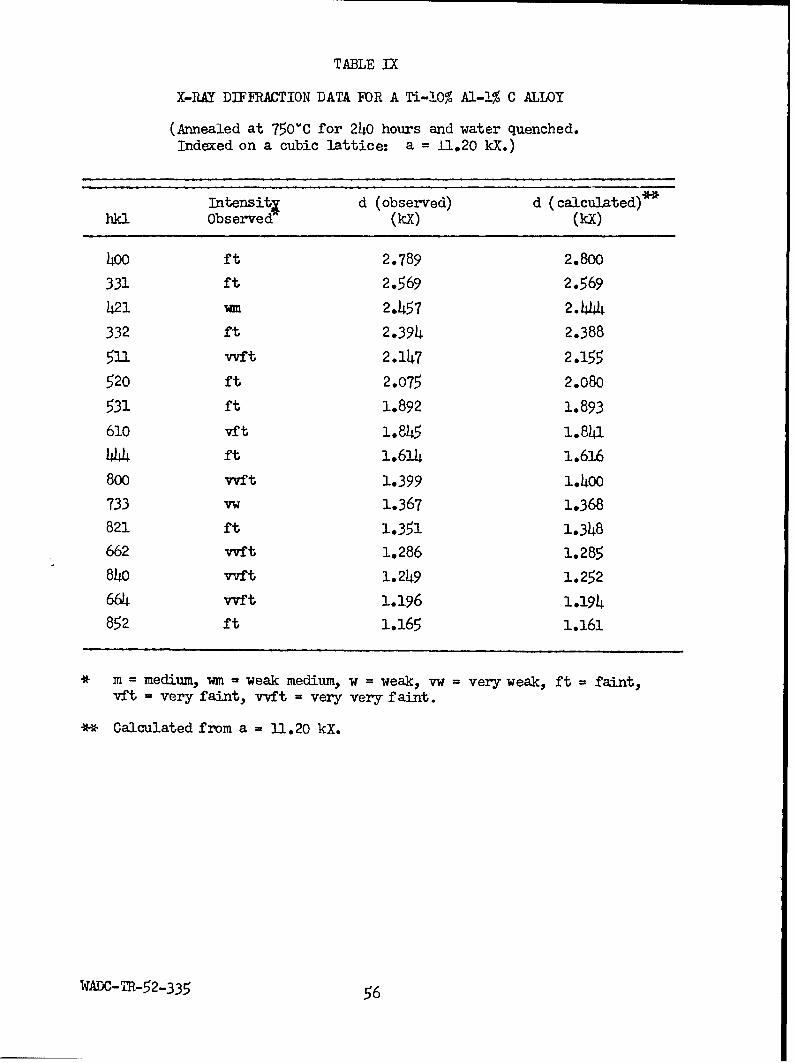
TABLE IX
X-RAY DIFRACTION DATA FOR A Ti-10% Al-l% C ALLOY
(Annealed at 750"C for 240 hours and water quenched.Indexed on a cubic lattice: a = 11.20 kX.)
IntensitI d (observed) d (calculated)**hkl Observed (kX) (kX)
400 ft 2.789 2.800
331 ft 2.569 2.569
421 Wm 2.457 2.444
332 ft 2.394 2.388
511 vvft 2.147 2.155
520 ft 2.075 2.080
531 ft 1.892 1.893
610 vft 1.845 1.8J.
444 ft 1.614 1.616
800 vvft 1.399 1.4o0
733 vw 1.367 1.368
821 ft 1.351 1.348
662 vvft 1.286 1.285
840 vvft 1.249 1.252
664 vvft 1.196 1.194
852 ft 1.165 1.161
* m = medium, wm = weak medium, w = weak, vw = very weak, ft = faint,vft = very faint, vvft = very very faint.
*~* Calculated from a = -1.20 kX.
WADC-TR-52-335 56
500 1
00//
X~//
S400 N
0 00/
0
40\0 i (04 x300.
z00
40
// 0 0% ALUMINUM
200- 0 2% ALUMINUM
0 4% ALUMINUM
0 6% ALUMINUM
X 8% ALUMINUM
D 10% ALUMINUM
Io00 I I I II
0.2 0.4 0.6 0.8 1.0WEIGHT PERCENT CARBON
Figg, 46 - Average Vidlcers Hardness of Ti-Al-C Alloys Annealed in the AlphaPhase Space at Taperatures Between 600' and l3SOC.
WADC-TR.-52-335 57

D. The Ti-O System - by H. D. Kessler
Additional information has been obtained supporting the existen..e ofthe peritectoid reaction (a + TiO 86) in the titanium-oxygen system as re-ported previously (4,17). A 19% oxygen sample was selected for the studyas this composition lies close to the region where the delta phase is be-lieved to exist. Upon annealing this alloy at O000'C, alpha phase was rejectedat the grain boundaries; however, the matrix remained the banded structurecharacteristic of the (a + TiO) phase field (see Figures 47 and 48). Re-annealing this alloy, previously treated at IOO0"C, for long times at 800,'Cresulted in the structure shown in Figures 49 and 50. The TiO of the bandedstructure has reacted with the massive alpha in the grain boundaries forminga delta rim about the alpha phase. This rim effect is characteristic of aperitectoid reaction. As noted in previous work the delta phase is also generallydistributed throughout the sample, having been nucleated at various points inthe banded matrix.
E. Studies on a Family of Ternary Phases in Titanium-Base Systems - by W.Rostoker
In earlier work on this project, a search for the origin of evidence fora Ti 2Fe phase led to the discovery of a ternary phase with oxygen of the generaldesignation Ti1 Fe 2 0-Ti Fe 0 which is isomorphous with the cubic carbide Fe W C.It was shown t4at the Ri'Ke phase does not actually exist but that the resElAsreported (20,21) were dui to oxygen contamination of the alloys examined.
The work of the past year has been directed toward:
(a) The discovery of other phases in titanium-metal-oxygen systems, and theverification of the existence of phases of the Ti 2 X type where X is Cu,Ni, Mn, or Cr.
(b) The study of phase relationships into which these compounds enter.
Topic (b) had a pragmatic as well as academic interest from the point ofview of embrittlement phemonema in titanium alloys. Single isothermal sectionsfor the titanium-rich corners of the Ti-Fe-OC, Ti-Cr-OC, Ti-Ni-OC, and Ti-Mo-)systems were constructed. Each of these systems corresponds to a differentrange and location of the miscibility field of the oxide phase. In the lattercase, no oxide phase was discovered so that its behavior may be compared tothat of the other three systems where ternary phases exist.
Phase relationships were studied by both x-ray diffraction and metallo-graphic methods. Alloys were prepared by melting in a non-consumable electrode,water-cooled copper crucible arc melting furnace. Oxygen was quantitativelyintroduced by the use of weighed amounts of TiO or TiO. Iodide titaniumand the purest available alloying metals were uJed. All results are discussedin terms of the nominal composition of the melts. Debye-Scherrer powder pat-terns were taken in a 14 cm. diameter camera using filtered CuKa radiations(1.541232 and 1.53739 kX). Specimens were prepared by crushing and screeningof previously homogenized ingots. In general, the x-ray diffraction resultswere used to identify the major phases present, while the metallographic examina-tions were more useful in indicating the number of phases present. By the use
WADC-TR-52-335 58
N 'i
IrA AWW~ k
Fig 47 ig4
Neg. No. 5184 X 150 Neg. No. 5183 X 750
Fig. 49 Fig. 50
A 19% 0 sample initially treated as the specimen of Figs. 47 and 48., then sub-sequently annealed at 800% for 168 hours. Grain boundary al~pha (grey) havingreacted with the 21.0 of the banded structure to give a delta rim (white).Also delta precipitated in the matrix.
Tftchant: 60 glycerine., 20 HNO3-9 20 HF
WADC-TR-52-335 59
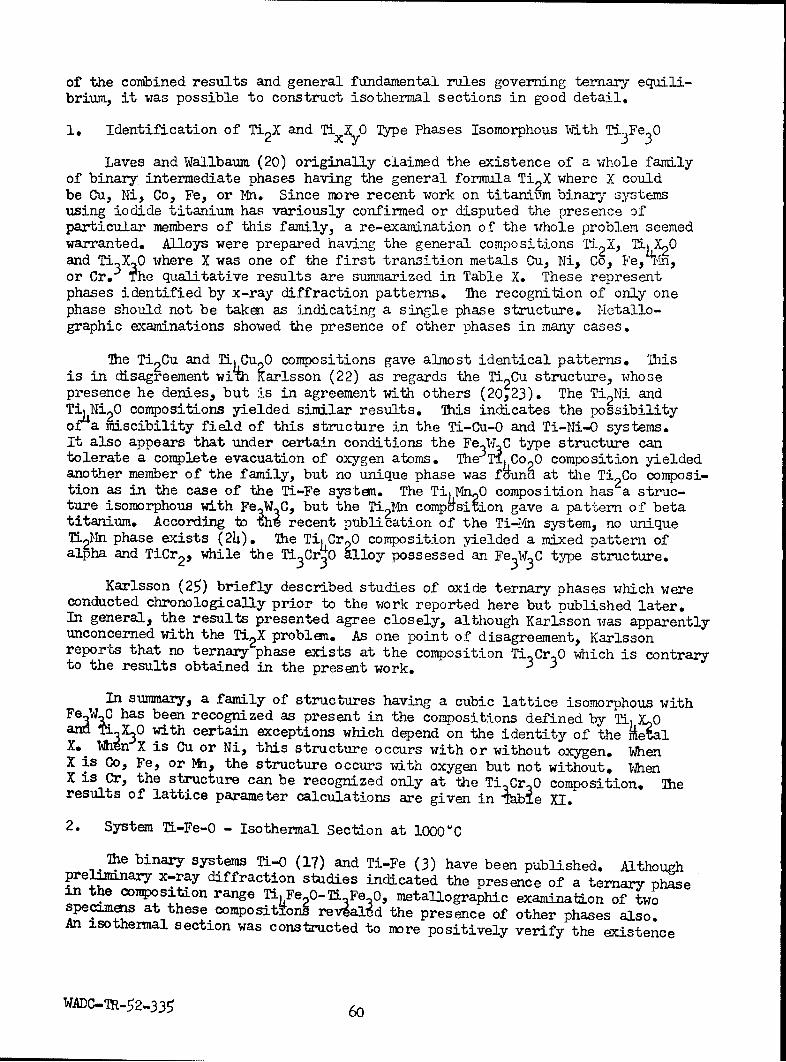
of the combined results and general fundamental rules governing ternary equili-brium, it was possible to construct isothermal sections in good detail.
1. Identification of Ti2X and TixyO Type Phases Isomorphous With Ti 3Fe3 0
Laves and Wallbaum (20) originally claimed the existence of a whole familyof binary intermediate phases having the general formula Ti X where X couldbe Cu, Ni, Co, Fe, or Mn. Since more recent work on titani-im binary sy-stemsusing iodide titanium has variously confirmed or disputed the presence ofparticular members of this family, a re-examination of the whole problem seemedwarranted. Alloys were prepared having the general compositions Ti 2 X, TiX 2 0and Ti X 0 where X was one of the first transition metals Cu, Ni, Go, Fe, ihn,or Cr. 3 The qualitative results are summarized in Table X. These representphases identified by x-ray diffraction patterns. The recognition of only onephase should not be taken as indicating a single phase structure. Metallo-graphic examinations showed the presence of other phases in many cases.
The Ti 2 Cu and Ti Cu 0 compositions gave almost identical patterns. Thisis in disagreement wi4h iarlsson (22) as regards the Ti 2Cu structure, whosepresence he denies, but is in agreement with others (20,23). The Ti 2 Ni andTi),Ni 2 0 compositions yielded similar results. This indicates the possibilityof a miscibility field of this structure in the Ti-Cu-0 and Ti-Ni-O systems.It also appears that under certain conditions the Fe W C type structure cantolerate a complete evacuation of oxygen atoms. The 3 TR Co 0 composition yieldedanother member of the family, but no unique phase was f~unR at the Ti 2Co composi-tion as in the case of the Ti-Fe systen. The Ti Mn 0 composition has a struc-ture isomorphous with Fe W C, but the Ti2Mn comp~sition gave a pattern of betatitanium. According to ýhi recent publication of the Ti-4n system, no uniqueTi2N1n phase exists (24). The Ti4 Cr 0 composition yielded a mixed pattern ofalpha and TiCr 2 , while the Ti3Cr0 Elloy possessed an Fe3W3 C type structure.
Karlsson (25) briefly described studies of oxide ternary phases which wereconducted chronologically prior to the work reported here but published later.In general, the results presented agree closely, although Karlsson was apparentlyunconcerned with the Ti2 X problem. As one point of disagreement, Karlssonreports that no ternary phase exists at the composition Ti Cr30 which is contraryto the results obtained in the present work. 3
In summary, a family of structures having a cubic lattice isomorphous withFe W C has been recognized as present in the compositions defined by Ti1 XgOaxA E X30 with certain exceptions which depend on the identity of the AetalX. 1hin X is Cu or Ni, this structure occurs with or without oxygen. WhenX is Go, Fe, or Mn, the structure occurs with oxygen but not without. unenX is Cr, the structure can be recognized only at the Ti Cr 0 composition. Theresults of lattice parameter calculations are given in 4•bie XI.
2. System Ti-Fe-O - Isothermal Section at l000wC
The binary systems Ti-O (17) and Ti-Fe (3) have been published. Althoughpreliminary x-ray diffraction studies indicated the presence of a ternary phasein the composition range Ti4Fe 20Oi. Fe 0, metallographic examination of twospecimens at these compositions revealid the presence of other phases also.An isothermal section was constructed to more positively verify the existence
WADC-TR-52-335 60
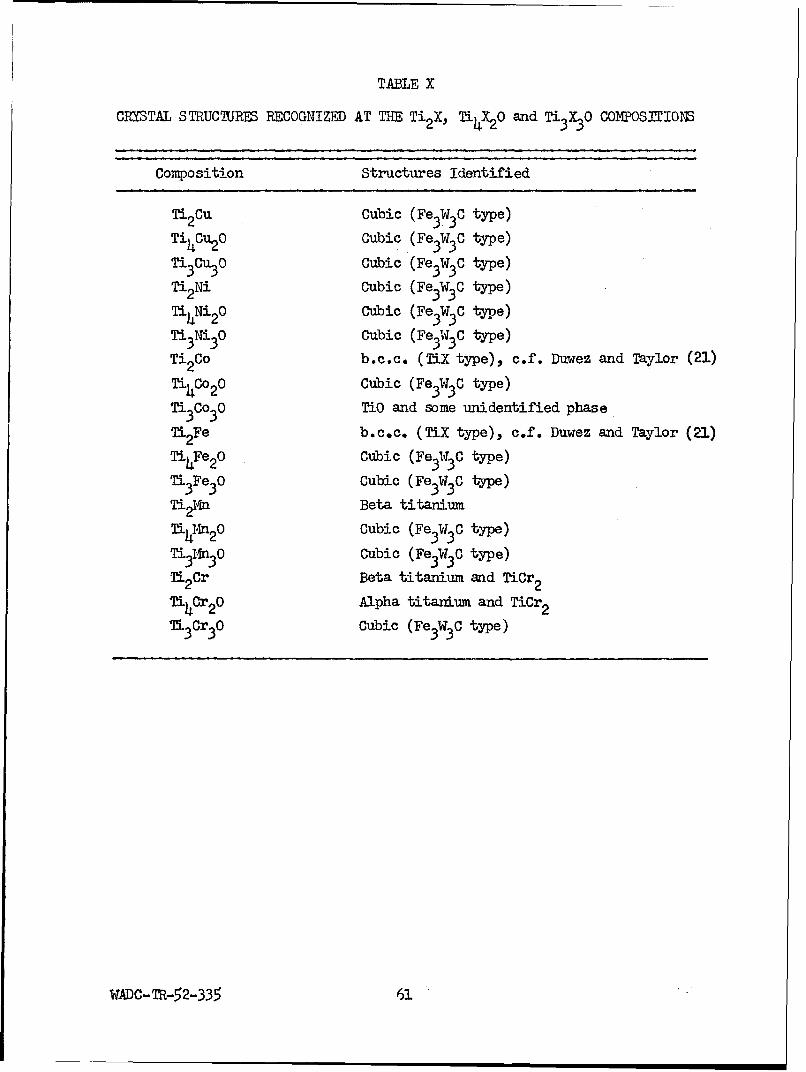
TABLE X
CRYSTAL STRUCTURES RECOGNIZED AT THE Ti 2X, Ti4X2O and Ti 3X3O COMPOSITIONS
Composition Structures Identified
Ti 2Cu Cubic (Fe3 W3 C type)
TihCu2 O Cubic (Fe3W3 C type)
Ti 3 Cu3 0O Cubic (Fe3 W3 C type)
Ti 2Ni Cubic (Fe 3 W3 C type)
Ti4Ni 2o Cubic (Fe 3W3 C type)Ti 3Ni 30 Cubic (Fe3W3C type)
Ti2Co b.c.c. (TiX type), c.f. Duwez and Taylor (21)
Ti4Co2 0 Cubic (Fe 3 W3 C type)
Ti3 Co30 TiO and some unidentified phase
Ti 2Fe b.c.c. (TiX type), c.f. Duwez and Taylor (21)
Ti4Fe 2O Cubic (Fe 3W3 C type)
Ti3Fe30 Cubic (Fe 3 W3 C type)
Ti2 Mn Beta titanium
TL4 n2o Cubic (Fe3W3C type)
Ti3Mn30 Cubic (Fe3 W3C type)Ti2 Cr Beta titanium and TiCr 2
Ti4Cr 20 Alpha titanium and TiCr 2
Ti3Cr30 Cubic (Fe3 W3 C type)
WADC-TR-52-335 61
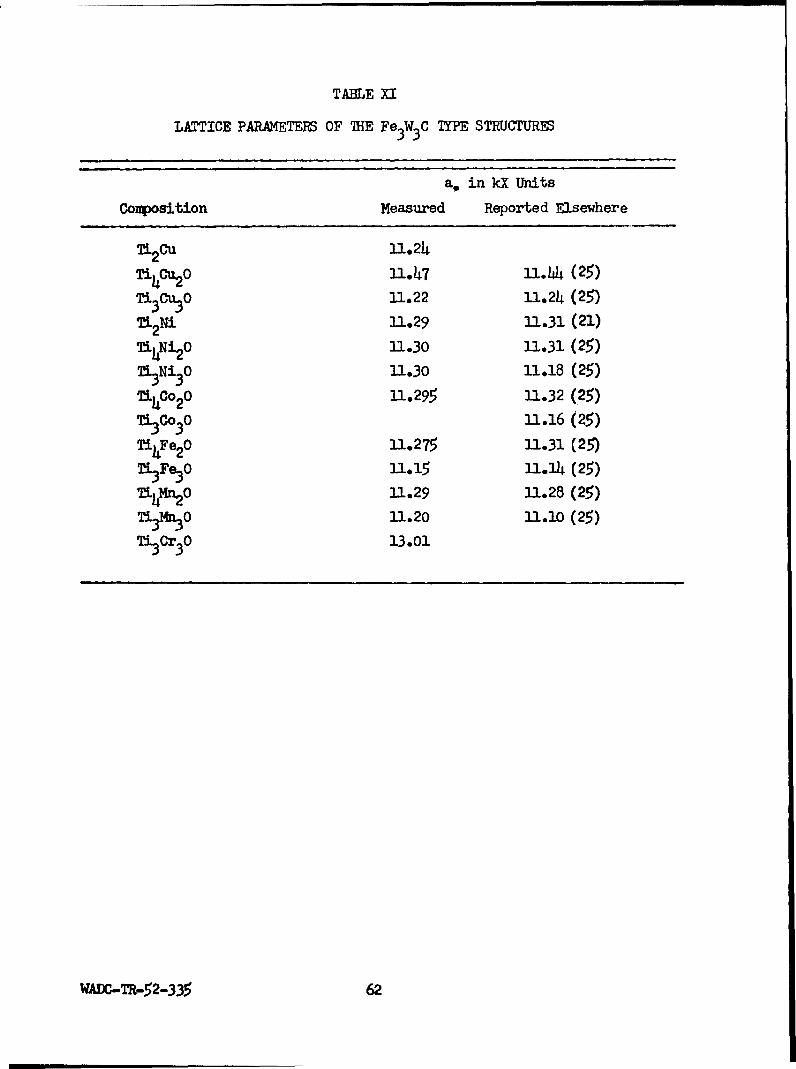
TABLE XI
LATTICE PARAMETERS OF THE Fe W C TYPE STRUCTURES
3 3
a. in kX Units
Composition Measured Reported Elsewhere
L2Cu 311.24
T•iCu 2O 11.47 31.4 (25)T'3Cu3O .1.22 3.24 (25)
TL2Ni 11.29 11.31 (21)
T0'N•o 1.30 1.31 (25)
TY. 3o 11.30 n.18 (25)
TV0o20 -1.295 11.32 (.25)
TY 3C0 n.16 (25)
TivFe20 11.275 31.31 (25)
Tl 3Fe3O 11.15 3.14 (25)142Mn 2o 11.29 11.28 (25)
T'.Mn3O 11.20 11.10 (25)
TI-5 0-30 13.01
WMIC-TR-52-335 62
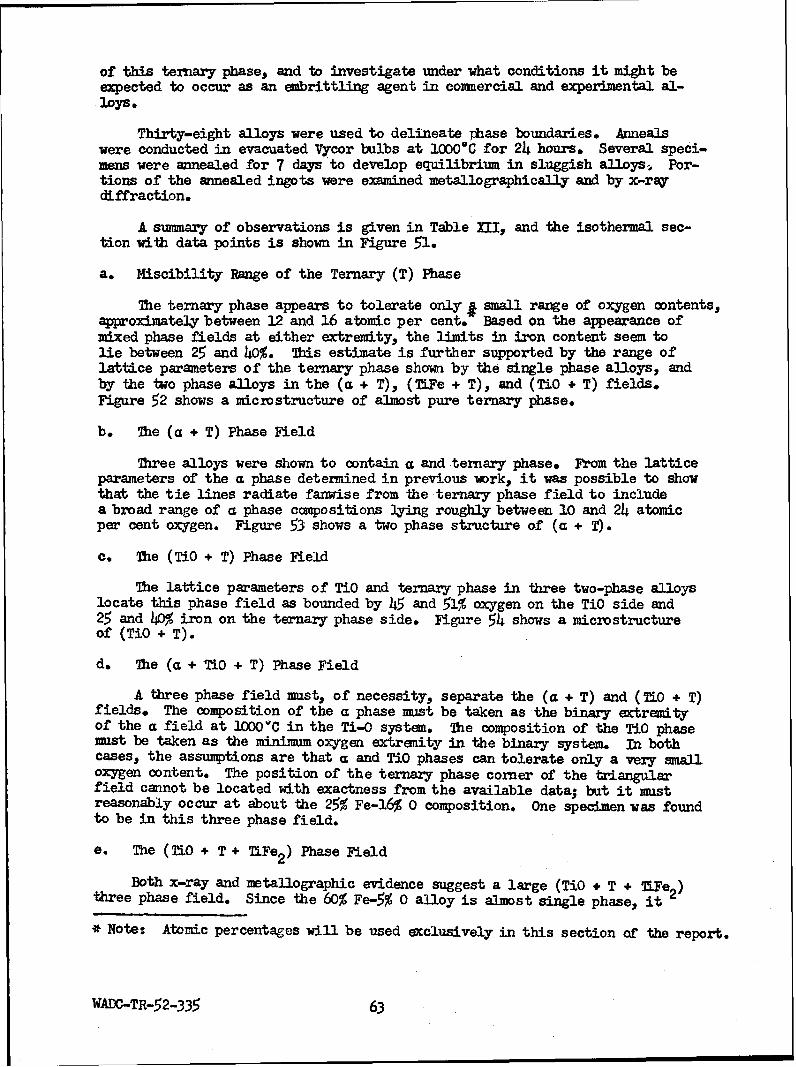
of this ternary phase, and to investigate under what conditions it might beexpected to occur as an embrittling agent in comuercial and experimental al-loys.
Thirty-eight alloys were used to delineate -phase boundaries. Annealswere conducted in evacuated Vycor bulbs at 1000C for 24 hours. Several speci-mens were annealed for 7 days to develop equilibrium in sluggish alloysý. Por-tions of the annealed ingots were examined metallographically and by x-raydiffraction.
A summary of observations is given in Table XII, and the isothermal sec-
tion with data points is shown in Figure 51.
a. Miscibility Range of the Ternary (T) Phase
The ternary phase appears to tolerate only # small range of oxygen contents,approximately between 12 and 16 atomic per cent. Based on the appearance ofmixed phase fields at either extremity, the limits in iron content seem tolie between 25 and 40%. This estimate is further supported by the range oflattice parameters of the ternary phase shown by the single phase alloys, andby the two phase alloys in the (a + T), (TLFe + T), and (TiO + T) fields.Figure 52 shows a microstracture of almost pure ternary phase.
b. The (a + T) Phase Field
Three alloys were shown to contain a and ternary phase. From the latticeparameters of the a phase determined in previous work, it was possible to showthat the tie lines radiate fanwise from the ternary phase field to includea broad range of a phase compositions lying roughly between 10 and 24 atomicper cent oxygen. Figure 53, shows a two phase structure of (a + T).
c. The (TiO + T) Phase Field
The lattice parameters of TiO and ternary phase in three two-phase alloyslocate this phase field as bounded by 45 and 51% oxygen on the TiO side and25 and 4M, iron on the ternary phase side. Figure 54 shows a micro structureof (TiO + T).
d. The (a + T-O + T) Phase Field
A three phase field must, of necessity, separate the (a + T) and (T2O + T)fields. The composition of the a phase must be taken as the binary extremityof the a field at 1000'0C in the Ti-O system. The composition of the TiO phasemust be taken as the minimum oxygen extremity in the binary system. In bothcases, the assumptions are that a and TiO phases can tolerate only a very smalloxygen content. The position of the ternary phase corner of the triangularfield cannot be located with exactness from the available data; but it mustreasonably occur at about the 25% Fe-16% 0 composition. One specimen was foundto be in this three phase field.
e. The (MiO + T + TIFe 2 ) Phase Field
Both x-ray and metallographic evidence suggest a large (TiO + T + WiFe 2 )three phase field. Since the 60% Fe-5% 0 alloy is almost single phase, it 2
* Note: Atomic percentages will be used exclusively in this section of the report.
WADC-TR-52-335 63
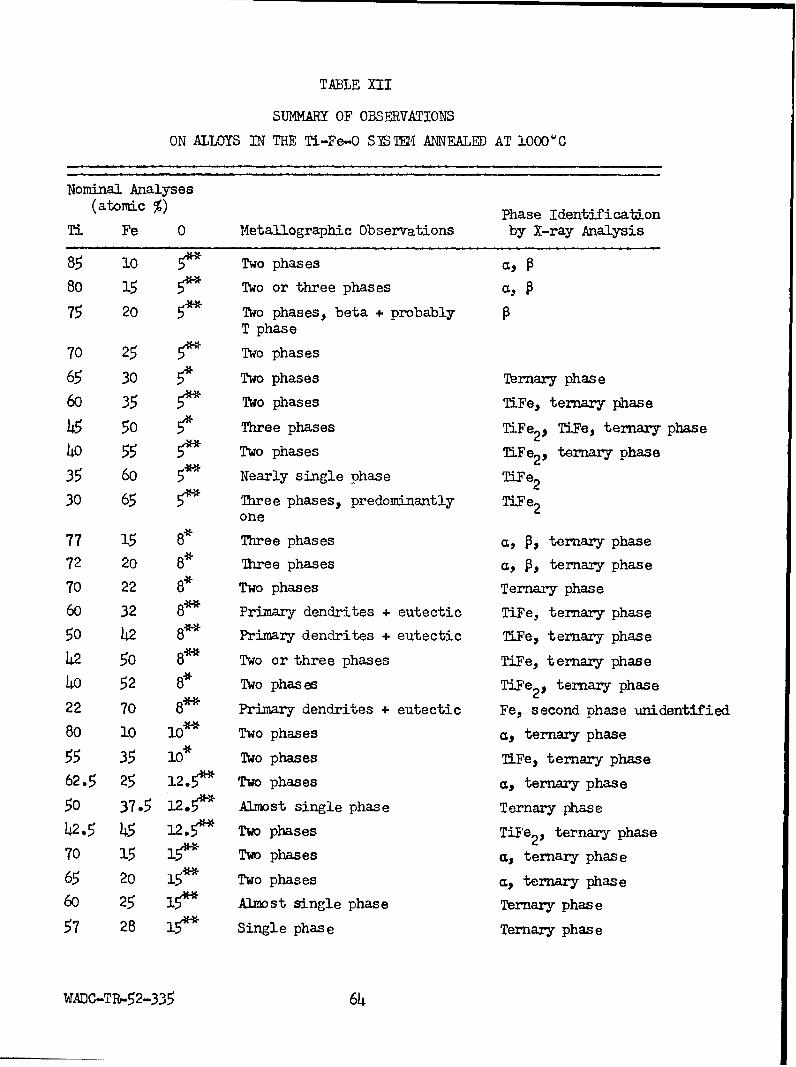
TABLE XII
SUMMARY OF OBSERVATIONS
ON ALLOYS IN THE Ti-Fe-O S'L 4 ANNFEALED AT 1000"C
Nominal Analyses(atomic %) Phase Identification
Ti Fe 0 Metallographic Observations by X-ray Analysis
85 10 5" Two phases ca, P
80 15 5" Two or three phases CL, P75 20 5* Two phases, beta + probably
T phase
70 25 5* Two phases
65 30 5* Two phases Ternary phase
60 35 5" Two phases TiFe, ternary phase
45 5o 5* Three phases TiFe 2 , TiFe, ternary phase
40 55 5* Two phases TiFe 2 , ternary phase
35 60 5** Nearly single phase TiFe2
30 65 5* Three phases, predominantly TiFe 2one
77 15 8* Three phases a., P., ternary phase
72 20 8* Three phases cx, P., ternary phase
70 22 8* Two phases Ternary phase
60 32 8* Primary dendrites + eutectic TiFe, ternary phase
50 42 8* Primary dendrites + eutectic TiFe, ternary phase
42 50 8* Two or three phases TiFe, ternary phase
40 52 8* Two phases TiFe 2 , ternary phase22 70 8* Primary dendrites + eutectic Fe, second phase unidentified
80 10 16• Two phases a, ternary phase
55 35 l* Two phases TLFe, ternary phase
62.5 25 12.5" Two phases a,, ternary phase
50 37.5 12.5** Almost single phase Ternary phase
42.5 45 12.5** Two phases TiFe 2 , ternary phase70 15 15* Two phases a., ternary phase
65 20 15* Two phases a., ternary phase
60 25 15* Almost single phase Ternary phase
57 28 15** Single phase Ternary phase
WADC.-TR,-52-335 64

TABLE XII (Continued)
Nominal Analyses(atomic %)/ Phase Identification
Ti Fe 0 Metallographic Observations by X-ray Analys is
55 30 l5• Single phase Ternary phase
42 43 15* Two or three phases TiFe 2, ternary phase
35 50 i5* Three phases TiO, TiFe,. possiblyternary phase
33 52 15* Three phases TiO, TiFe 2
48 34 le* Two phases, one phase pre-dominant
55 25 20** Two phases TIO, ternary phase
50 25 2ý Two phases TiO, ternary phase
45 30 25*' Two phases TiO, TiFe2 , ternary phase
37 38 25* Two phases TiO, TiFe 2
60 10 30• Three phases Ternary phase
. Annealed for 7 days
** Annealed for 24 hours
WADC-TR-52-335 65
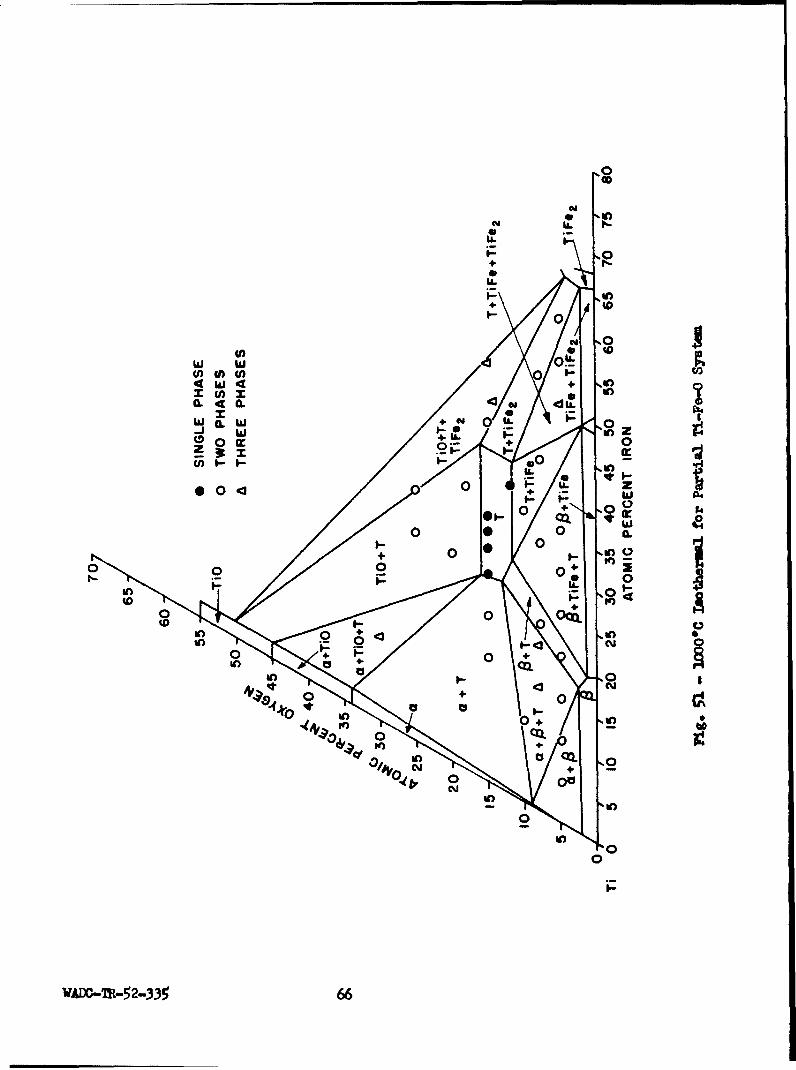
0
044.%
U) -
W )U) I. U)
w 4 +.
(0) 0
IW 44 jL 4 N -d 3O
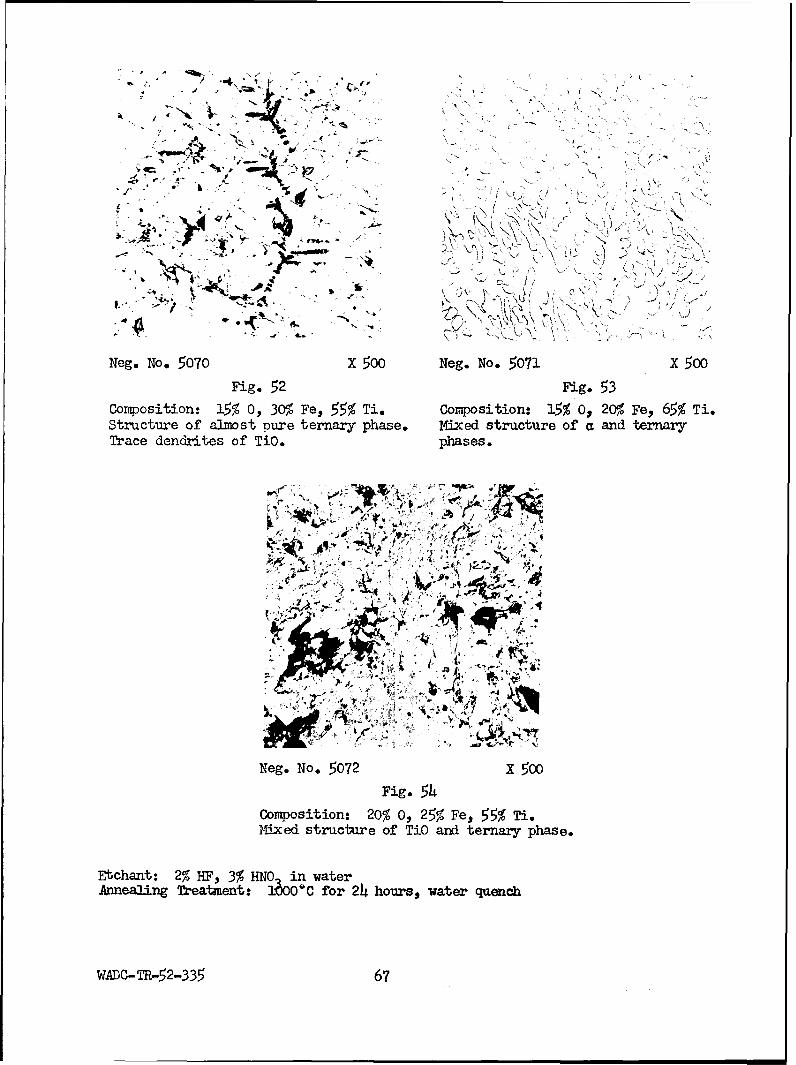
46.4
Neg. No* 5070 X 500 Neg. No- 5071 X 500
g 5 2 .5 3
Co rmosition: 15% 0 ., 30% .Fe ., 55% Ti. Composition: 15% 0O, 20%l Fe ., 65% Ti ,
Structure of almost pure ternary phase. Mixed structure of a and ternary
Trace dendrites of TiO. phases.
.+~~~~~~ <r, <.o.;>,j>
<E,
if
SSK
Neg. No. 5072 X 500
FiFg 2g
Composition: 20% 0,, 25% FeF, 55% Ti.
Mixed structure of TiO and ternary phase.
Etchant: 2% HF., 3% HNOin water
Annealing Treatment: I&00'C for 24 hours, water quench
WADO-TRL-52-335 67
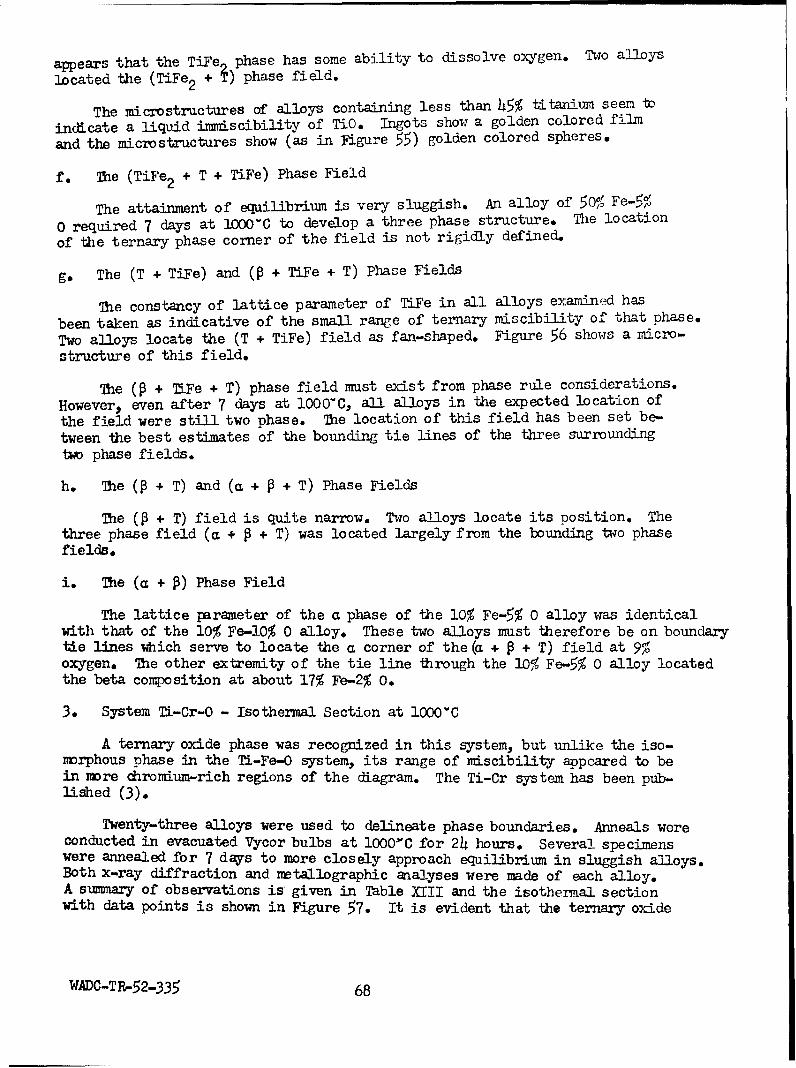
appears that the TiFe phase has some ability to dissolve oxygen. Two alloys
located the (TiFe 2 + ý) phase field.
The microstructures of alloys containing less than 45% titanium seem to
indicate a liquid immiscibility of TiO. Ingots show a golden colored film
and the micro structures show (as in Figure 55) golden colored spheres.
f. The (TiFe2 + T + TiFe) Phase Field
The attainment of equilibrium is very sluggish. An alloy of 50% Fe-5%
0 required 7 days at 1"00'C to develop a three phase structure. The location
of the ternary phase corner of the field is not rigidly defined.
g. The (T + TiFe) and (P + TiFe + T) Phase Fields
The constancy of lattice parameter of TiFe in all alloys examined has
been taken as indicative of the small range of ternary miscibility of that phase.
Two alloys locate the (T + TiFe) field as fan-shaped. Figure 56 shows a micro-
structure of this field.
The (P + TiFe + T) phase field must exist from phase rule considerations.
However, even after 7 days at 1000oC, all alloys in the expected location of
the field were still two phase. The location of this field has been set be-
tween the best estimates of the bounding tie lines of the three surrounding
two phase fields.
h. The (+ T) and (a + P + T) Phase Fields
The (P + T) field is quite narrow. Two alloys locate its position. Thethree phase field (a + P + T) was located largely from the bounding tio phasefields.
i. The (a + P) Phase Field
The lattice parameter of the a phase of the 10% Fe-5% 0 alloy was identicalwith that of the 10% Fe-10% 0 alloy. These two alloys must therefore be on boundarytie lines Nhich serve to locate the a corner of the (a + P + T) field at 9%oxygen. The other extremity of the tie line through the 10% Fe-5% 0 alloy locatedthe beta composition at about 17% Fe-2% 0.
3e System Ti-Cr-O - Isothermal Section at 1000wC
A ternary oxide phase was recognized in this system, but unlike the iso-morphous phase in the Ti-Fe-O system, its range of miscibility appeared to bein more dhromium-rich regions of the diagram. The Ti-Cr system has been pub-lished (3).
Twenty-three alloys were used to delineate phase boundaries. Anneals wereconducted in evacuated Vycor bulbs at l000"C for 24 hours. Several specimenswere annealed for 7 days to more closely approach equilibrium in sluggish alloys.Both x-ray diffraction and metallographic analyses were made of each alloy.A summary of observations is given in Table XIII and the isothermal sectionwith data points is shown in Figure 57. It is evident that the ternary oxide
WADC-TR-52-335 68

Neg .No.504 X75
Fig 55A
Neg. No. 50734 X 7500
Fig. 56
MieStructure of'traypse TiFe andtenr
/0T3% iO, indicatenr iudimicbiy
AnnealingK Tramn:i6- o 4hus$wtrqec
wA~c-R-52-35 6
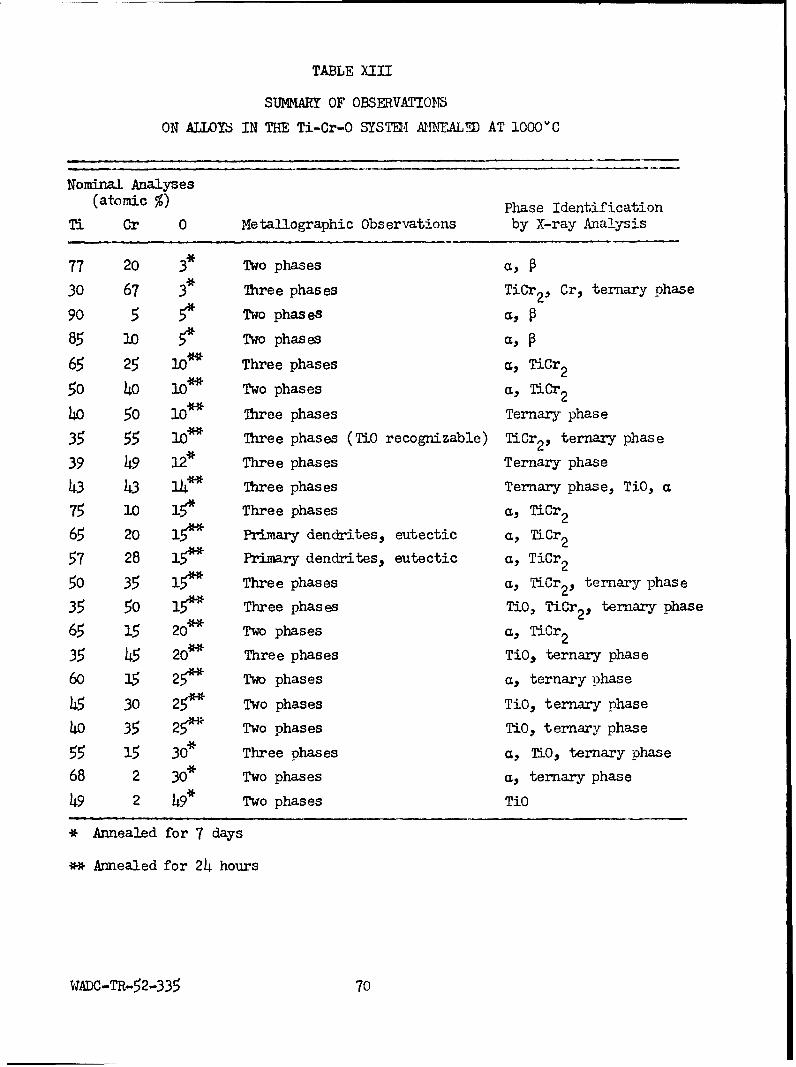
TABLE XIII
SUMMARY OF OBSERVATION
ON ALLOYS IN THE Ti-Cr-O SYSTM1, MMMALD AT 100O0C
Nominal Analyses(atomic %) Phase Identification
Ti Cr 0 Metallographic Observations by X-ray Analysis
77 20 3* Two phases a, P
30 67 3* Three phases TiCr 2 , Cr, ternary phase
90 5 5 Two phases a,
85 10 Two phases a,
65 25 10O* Three phases a, TiCr 2
50 40 10** Two phases a, TiCr2
40 50 1i" Three phases Ternary phase
35 55 lb" Three phases (TiO recognizable) TiCr 2 , ternary phase
39 49 12" Three phases Ternary phase
43 43 1* Three phases Ternary phase, TiO, a
75 10 15* Three phases a, TiCr2
65 20 i• Primary dendrites, eutectic a, TiCr 2
57 28 15* Primary dendrites, eutectic a, TiCr 2
50 35 15** Three phases a, TiCr 2 , ternary phase
35 50 15" Three phases TiO, TiCr 2 , ternary phase
65 15 20** Two phases a, TiCr 2
35 45 2d" Three phases TiO, ternary phase
60 15 25* Two phases a, ternary phase
45 30 25** Two phases TiO, ternary phase
40 35 25'* Two phases TiO, ternary phase
55 15 3e* Three phases a, TiO, ternary phase
68 2 30* Two phases a, ternary phase
49 2 49* Two phases TiO
* Annealed for 7 days
** Annealed for 24 hours
VIADC-TR-52-335 70
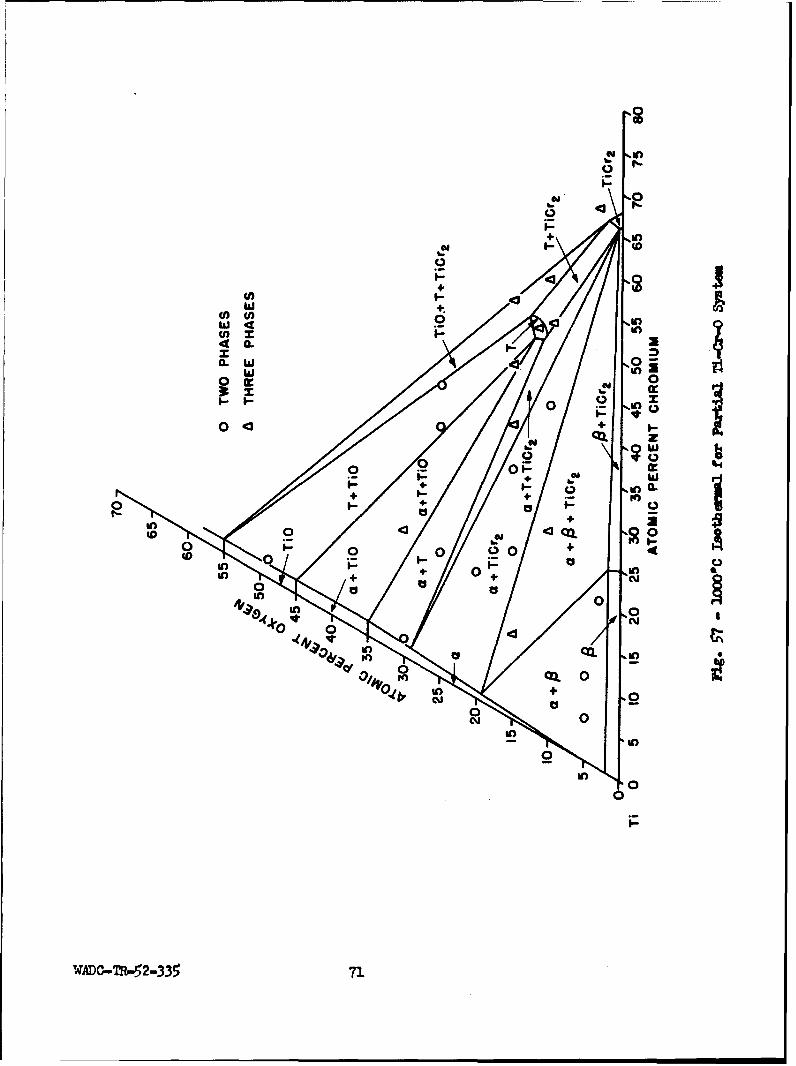
U) U)-
U) x
w If) 0
0
0 +
z
• Wo
tn - +w
+4 0 IL
+- 2
z)
0~ 000
I-I- 00
164. 0
0 4
0 C 0
00
"?ADO-TR-52-335 71

phase is not encountered at tJis or lower temperatures in the commercially im-portant range of Ti-Cr compositions. An isothermal section for this systemat 1200C has apneared recently (26). The same general form of phase equilibriawas established as encountered in the present work. The presence of the ternaryphase is confirmed. One point of disagreement lies in the extent of projectionof the a and TiO phases into the ternary field. The section presented byWang, et al., shows as much as 15 atomic per cent Cr solubility in each ofthese phases although there is little evidence to support this. It is to benoted that in the lO00C section presented here, two alloys showed that thechromium solubility in these two phases was less than 2 atomic per cent.
a. Miscibility Range of the Thrnary (T) Phase
The lines of a cubic phase isomorphous with other members of the ternaryoxide group were consistently noted as the predominant diffraction pattern inhigh chromium content alloys. It was not found possible to develop a completelysingle phase structure in an alloy which from the directions of phase boundariesmust be expected to be in the single phase field. The narrow region of occur-rence of this phase was inferred from the directions of phase boundaries andtie lines. Its location must be considered approximate. The miscibility rangedoes not include the ideal composition Ti 3Cr30.
b. The (a + TiCr2 ) Phase Field
Four alloys confirm the existence of an (a + TiCr 2 ) field at this tempera-ture. A typical microstructure is shown in Figure 58. The presence of thisfield effectively excludes the possibility of the ternary phase appearing asa constituent of commercial titanium-chromium alloys.
c. The (a + T) and (TiO + T) Phase Fields
The existence of these two phase fields was indicated by two and threealloys, respectively. Between (a + T) and (TiO + T) a three phase field (a +TiO + T) must necessarily exist. Two alloys confirmed the presence of thisphase field. Two alloys containing 2% chromium and 30 and 49% oxygen, respect-ively, showed that the solubilities of chromium in a and TiO were very small.Another three phase field (a + TiCr 2 + T) must exist between the (a + TiCr 2 )and (a + T) fields. Two alloys were found to lie in this field. Figures59 and 60 are pertinent to this discussion.
d. The (a + P) and (a + P + TiCr 2 ) Phase Fields
TWo alloys exhibiting three phase structures (Figure 61) served to locatethe a + TiCr 2/a P Ticr 2 boundary. The other two boundaries of the (a +S + TiCr 2 ) field depend on the solubility of oxygen in P. The 3% 0-20% Cralloy showed this to be less than 3%. Accordingly, the (a + P + TiCr^), (a +and P + TiCr 2) fields were located without difficulty. 2)2 "
e. Other Phase Fields
Several alloys indicated the presence of a three phase field (TiCr 2 +TiO + T), Figure 62. A two phase field necessarily exists between TiCr 2 andthe ternary phase T.
WADC-TR.-52-335 72

., \••Vj Q\ >• \
Neg, No. 5189 X 750 Neg, No. 5190 X 750Fig. 58 Fig. 59
Composition: 15% 0O, 20% Cr., 65% Ti. Composition: 25% 03 15% Cr, 60% Ti.Primary dendrites of alpha in a matrix Two phase structure of alpha andof alpha and TiCr 2. ternary phase.
Neg. No. 5192 X 750 Neg. No. 5188 X 750
Fig. 60 Fig. 61
Composition: 15% 0, 35% Cr, 50% Ti. Composition: 10% 0, 25% Cr, 65% Ti.
Mixed structure of alpha., TiCr 2 and aixed structure of alpha, beta and
ternary phase as identified by x-ray TiCr 2
diffraction analysis.
Annealing Treatment: 1O0000C for 24 hours, water quench.Etchant: 60 glycerine, 20 HN03 , 20 HF.
WADC-TR-52-335 73

IJ
Neg. No. 5191 X 750Fig. 62
Composition: 10% 0, 55% Cr., 35% Ti.Mixed structure of TiO., TiCr2 and ternaryphase.
Annealinjg Treatment: 1 0 0 0 V 0 for 24 hours, water quenchEtehant: 60 glycerine., 20 HMO03P 20 HF
VIPIC-TR-52-335 74
4. Isothermal Section at 900uC - System Ti-Ni-O
The Ti-Ni system (27) has been published. The Ti 2Ni phase is known to havea cubic structure isomorphous with the ternary phases under study. The Ti-Ni-Osystem is of particular interest as a case where the ternary phase latticecan tolerate a complete evacuation of the interstitial atoms. The arbitrarycompositions Ti Ni 0 and Ti Ni 0 both indicated the presence of the Ti Ni struc-ture but gave n4 iadication3of 3the ternary miscibility field of the ph.se.
Twenty-seven alloys were used to delineate phase boundaries in the ternarysection. Anneals were conducted in evacuated Vycor bulbs at 900uC for 48hours. The lower temperature was necessary to avoid the presence of the liquidphase because of the low eutectic temperature (995"C) in the Ti-Ni system.Annealed alloys were subjected to both x-ray diffraction and metallographicanalysis. A summary of observations is given in Table XIV and the isothermalsection with data points is shown in Figure 63.
a. Miscibility Field of the Ti 2 Ni Phase
Judging from three alloys which were single phase or nearly so and fromthe directions of phase boundaries, it is concluded that the Ti 2Ni phase hasa narrow miscibility field extending into the ternary system in the directionof a constant ratio of Ti:Ni. The interpretation is that the structure is permitt-ing the occupation of vacant interstitial sites approximately up to the satura-tion which the other isomorphous ternary phases permit. Figure 64 shows thestructure of a 5% 0-30% Ni alloy which is nearly single phase.
b. The (a + Ti 2 Ni) Phase Field
This phase field proved to be very extensive. Six alloys were identifiedas lying in this field. Figure 65 is a characteristic structure. Becauseof the extent of this field the adjoining (cg + + Ti 2Ni) field was necessarilyrestricted.
c. The (TiO + Ti2Ni) and (a + TiO + !ri2Ni) Phase Fields
Two alloys identified the existence of a (TiO + Ti Ni) phase field.Figure 66 shows a typical microstructure. The three phase field (a + TiO +Ti Ni) was automatically defined by the a + 2 MNi/a + TiO + Ti Ni andTie+ Ti Ni/a + TiO + Ti 2 Ni boundaries. Figure 67 shows a microstructarefrom thig field*
d. The (TiO + Ti 2Ni + TiNi ) Phase Field
TiO enters into equilibrium with TiN1 rather than TiNi and accordinglya very large (TiO + Ti 2Ni + TiNi ) field i• formed. Five alloys showed threephase structures belonging to tQ;s field. An exemplary microstructure isshown in Figure 68.
e. The (Ti 2Ni + TiNi 3 ) and (TiNi + Ti 2Ni + TiNi 3 ) Phase Fields
The occurrence of two different three phase structures at 5% 0-45% Ni and10% 0-45% Ni signifies that there must be a narrow two phase field (Ti 2 Ni + TiNi 3 )
WADC-TR-52-335 75

TABLE XIV
SULMARY OF OBSERVATIONS
ON ALLOYS IN THE Ti-Ni-O SYSTR ANNEALED AT 900"C
Nominal Analyses
(atomic %) Phase Identification
Ti Ni 0 Metallographic Observations by X-ray Analysis
67 33 0 Single phase Ti 2 Ni
87.5 10 2.5 Two phases
85 12 3 Three phases a, Ti 2Ni
90 5 5 Two phases a, P
75 20 5 Two phases a, Ti 2Ni
65 30 5 Nearly single phase Ti 2Ni
62 33 5 Two phases Ti 2Ni
60 35 5 Two phases TL2Ni55 40 5 Two phases Ti 2Ni50 45 5 Three phases TiNi, Ti 2Ni
45 50 5 Three phases Ti 2Ni, TiNi 3
70 20 10 Two phases a, Tii2 N
65 25 10 Two phases a, TL2 Ni
60 30 10 Nearly single phase Ti 2Ni
57 33 10 Two phases Ti 2Ni
55 35 10 Two phases Ti 2Ni
50 40 10 Three phases Ti 2 Ni, TiNi 3
45 45 10 Three phases Ti 2Ni, TiN 3
43 43 14 Three phases Ti 2 Ni, TiNi 3
70 15 15 Two phases a, Ti2Ni
65 10 25 a, Ti 2 Ni
60 15 25 Three phases a, Ti 2 Ni
55 20 25 Two phases TiO, TiNi
50 25 25 Three phases TiO, Ti 2 Ni, TiNi 3
45 30 25 Three phases Ti 2 Ni, TiO, TiNi 3
60 5 35 Three phases a, TiO, Ti 2Ni
50 5 45 Two phases TiO, Ti 2 Ni
WADC-TR-52-335 76
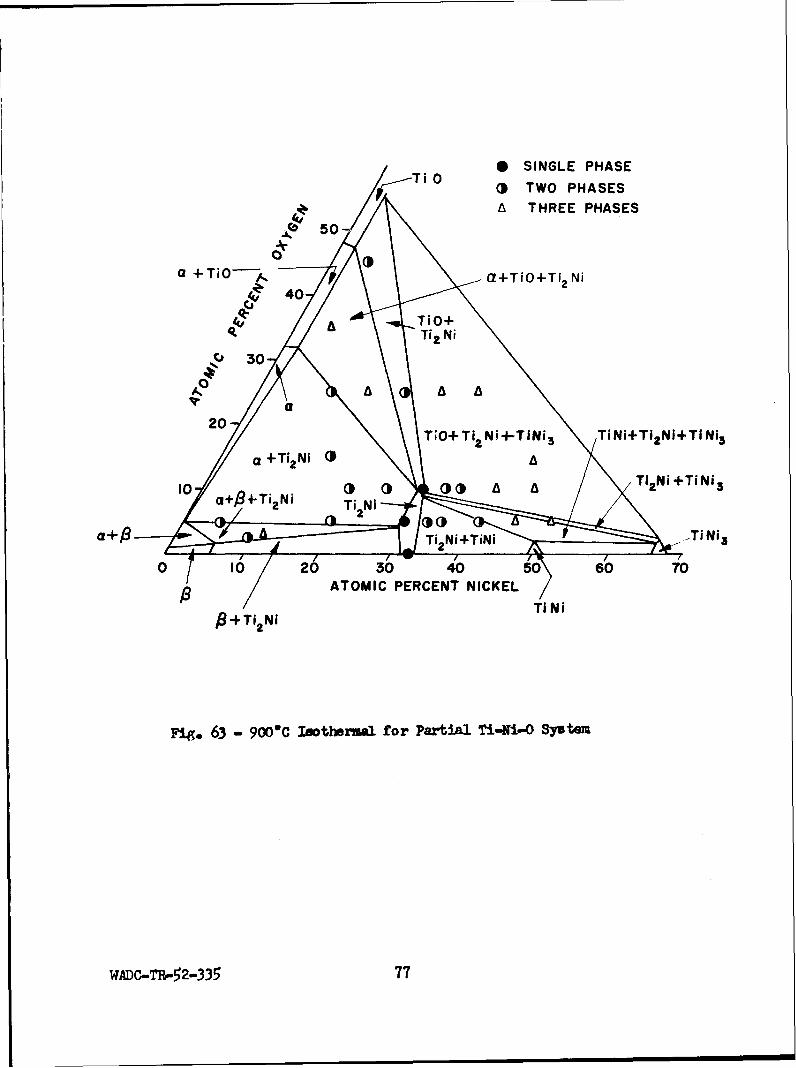
*SINGLE PHASEi 0 TWO PHASES
A THREE PHASES
4'
a TITi 3 Tii+Ti2NI+TI i 5
a~f3 iTi
30430007
10g 63)+T Ni 900 TtI2Ni orPa+a1Tiii0 yse
2 rh TR - 2-N3 77

DV4) 0
C,0
*0 4 1ý
Neg. No. 7070 X 500 Neg. No. 7067 X 500
Fig. 64~ Fig. 65
Composition: 5% 0, 30% Ni, 65% Ti~. Composition: 10% 0,. 20% Ni., 70% Ti.
Structure of aanmst pure Ti2 Ni. Tiq phase structure of (a + fI5 2Ni).
Neg AL.- N v 7066 Xd 75Me.N.7b 5
Fi.6ki.64opsto:2%0 0 i 5 i Cmoiin 5 ,5 i 0 i
Two phaisesrcueo(TO+TNi. Trepaetrcueo(a+I0+
Av Ti2Ni)i
Aneln ramnt 0K o 8horwtrqecEtcat:()gyeie20I0320H
WADC-TR-2-3f 7
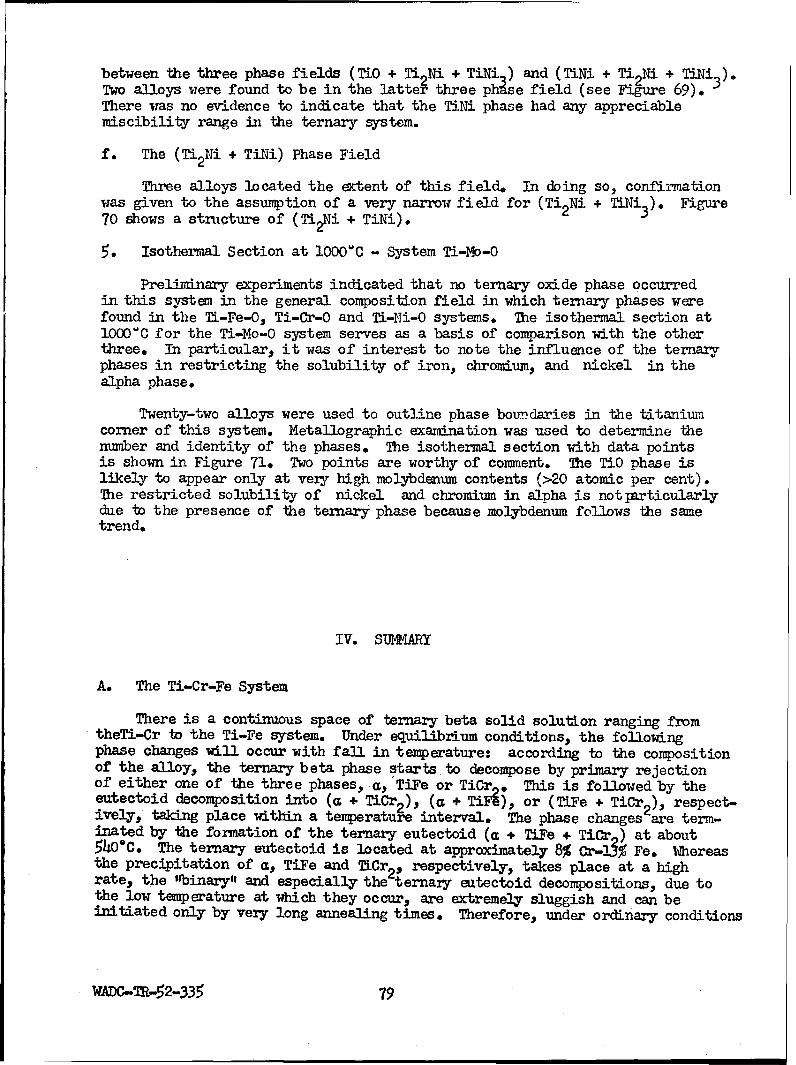
between the three phase fields (TiO + Ti Ni + TiNi ) and (TiNi + Ti Ni + TiNi 3 ).Two alloys were found to be in the latte; three phase field (see Figure 69).There was no evidence to indicate that the TiNi phase had any appreciablemiscibility range in the ternary system.
f. The (Ti2Ni + TiNi) Phase Field
Three alloys located the extent of this field. In doing so, confirmationwas given to the assumption of a very narrow field for (Ti 2Ni + TiNi 3 ). Figure70 shows a structure of (Ti 2Ni + TiNi).
5. Isothermal Section at lO00uC - System Ti-Mo-O
Preliminary experiments indicated that no ternary oxide phase occurredin this system in the general composition field in which ternary phases werefound in the TL-Fe-O, Ti-Cr-O and Ti-Ni-O systems. The isothermal section atlO00'C for the Ti-Mo-O system serves as a basis of comparison with the otherthree. In particular, it was of interest to note the influence of the ternaryphases in restricting the solubility of iron, chromium, and nickel in thealpha phase.
Twenty-two alloys were used to outline phase boundaries in the titaniumcorner of this system. Metallographic examination was used to determine thenumber and identity of the phases. The isothermal section with data pointsis shown in Figure 71. Two points are worthy of comment. The TiO phase islikely to appear only at very high molybdenum contents (>20 atomic per cent).The restricted solubility of nickel and chromium in alpha is not particularlydue to the presence of the ternary phase because molybdenum follows the sametrend.
IV. SIMMARY
A. The Ti-Cr-Fe System
There is a continuous space of ternary beta solid solution ranging fromtheTi-Cr to the Ti-Fe system. Under equilibrium conditions, the followingphase changes will occur with fall in temperature: according to the compositionof the alloy, the ternary beta phase starts to decompose by primary rejectionof either one of the three phases, a, TiFe or TiCr . This is followed by theeutectoid decomposition into (a + TiCr 2 ), (a + TiFR), or (TiFe + TiCr 2 ), respect-ively, taking place within a temperature interval. The phase changes are term-inated by the formation of the ternary eutectoid (a + TiFe . TiCr ) at about540"C. The ternary eutectoid is located at approximately 8% Cr-Z% Fe. Whereasthe precipitation of a, TiFe and TiCr 2 , respectively, takes place at a highrate, the "binary", and especially the ternary eutectoid decompositions, due tothe low temperature at which they occur, are extremely sluggish and can beinitiated only by very long annealing times. Therefore, under ordinary conditions
WADC-TR-52-335 79
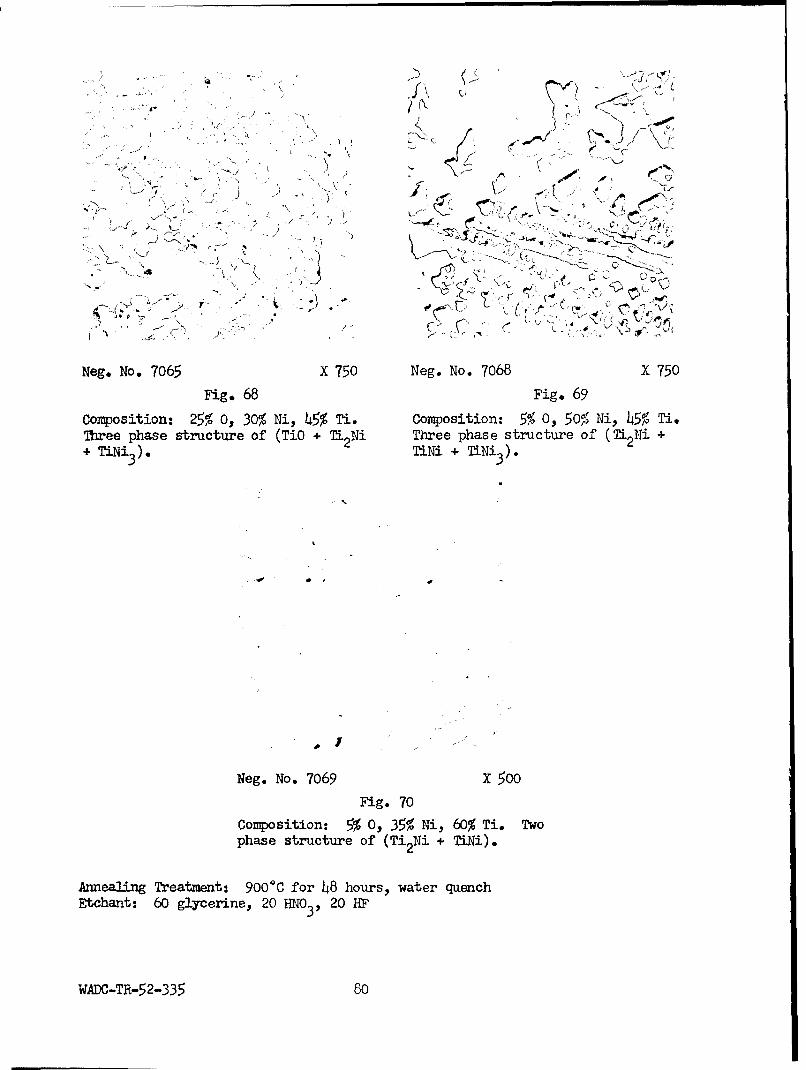
-N
..•. .. . ._ . . "~~~~-- ------- : < -+' -• . . .d•- • ..
S..... ' cs\: ' " " -:• >
Neg. No. 7o65 X 750 Neg. No. 7068 X 750
Fig. 68 Fig. 69Neg.~~. No0 76 NX 750 NeTio705X .5
Composition: 25% O, 30% Ni, 45% Ti. Composition: 5% 0, 50% Ni, 40% Ti.Three phase structure of (TiO + TL2Ni Three phase structure of ('N 2 Ni ++ TiNi 3
2 TiNi + T+ Ni)2
Neg. No. 7069 X 500
Fig. 70
Composition: 5% 0, 35% Ni, 60% Ti. Two
phase structure of (Ti 2Ni + TiNi).
Annealing Treatment: 9000C for 48 hours, water quenchEtchant: 60 glycerine, 20 HNO3 , 20 HF
WADC-TR-52-335 80

60
TiO 0 SINGLE PHASE
C,50 0003 TWO PHASES0O0 THREE PHASES
00
.40
v 0 (boo@ a @+T
20 a
100
1 2 3 4 5 6 7 a 9 10 11 12 13 14 I5ATOMIC PERCENT MOLYB3DENUM----p
Fig. 71 - 3W000 C Isothermal for Partial Ti-.4A-O Sputem
WADC-Tfb-5~2-335 8
of heat treatment, the beta phase remains metastable, similarto the conditions in the binary systems Ti-Cr and Ti-Fe.
The beta phase of alloys lying on the low titanium sideof a tie line between 7% chromium and L% iron is retained uponwater quenching from the beta space. The solubility of chromiumand iron in alpha titanium is less than 1% total alloy content*
A continuous series of solid solutions exists above 1100 Cbetween TiFe 2 and the high temperature modification of TiCr 2oSolidus data are presented and show that chromium raises the binaryTi-Fe eutectic temperature (1080 0 C). Hardness data are presentedand illustrate the pronounced effect of heat treatment.
B. The Ti-Al-(O and N ) Systems
Both oxygen and nitrogen raise the Va and B space boundaryand widen the (a , B) field of the Ti-Al system although nitrogenis more effective. The beta phase transforms to alpha prime uponwater quenching. Data are presented illustrating the fact thatthe hardness of ternary alloys is increased by the addition ofoxygen or nitrogen.
C. The Ti-Al-C Systea
A probable Ti-C diagram to 30% carbon is presented. Theessential features include: a very high melting compound, TiC,with a solubility limit near 15% carbon, A eutectic betweenTiC and carbon occurs at about 30% carbon.
Vertical sections of the Ti-Al-C system illustrate theincreased solubility of carbon in alpha with greater aluminumcontentso The solubility is increased to over 1% carbon at10% aluminum. The peritectoid reaction of the Ti-C systemoccurs at successively higher temperatures in the ternary system.An unidentified phase was observed in samples of high alloy content.Data are presented illustrating the hardening effect of aluminumand carbon on alpha titanium.
WADC-TR-52-335 82
D. The Ternary Oxide Phases
A family of ternary oxide phases isomorphous with Fe W Cwas discovered. The group had the general formula Ti X•TfX 2where X was copper, nickel, cobalt, iron, manganese oý chromduo.
The phase relationships by which these ternary phases enteredinto equilibrium were investigated in single isothermal sectionsfor the systems Ti-Fe-O, T±-Cr-O and Ti-Ni-Oo By way of 8 omparisonwi.th a system in which no ternary oxide appears, the 1000 C levelof the Ti-Mo-O system was constructed.
It was demonstraued that these oxide phases are not to beexpected to appear in commercial alloy compositions.
WADC-TR-52.-335
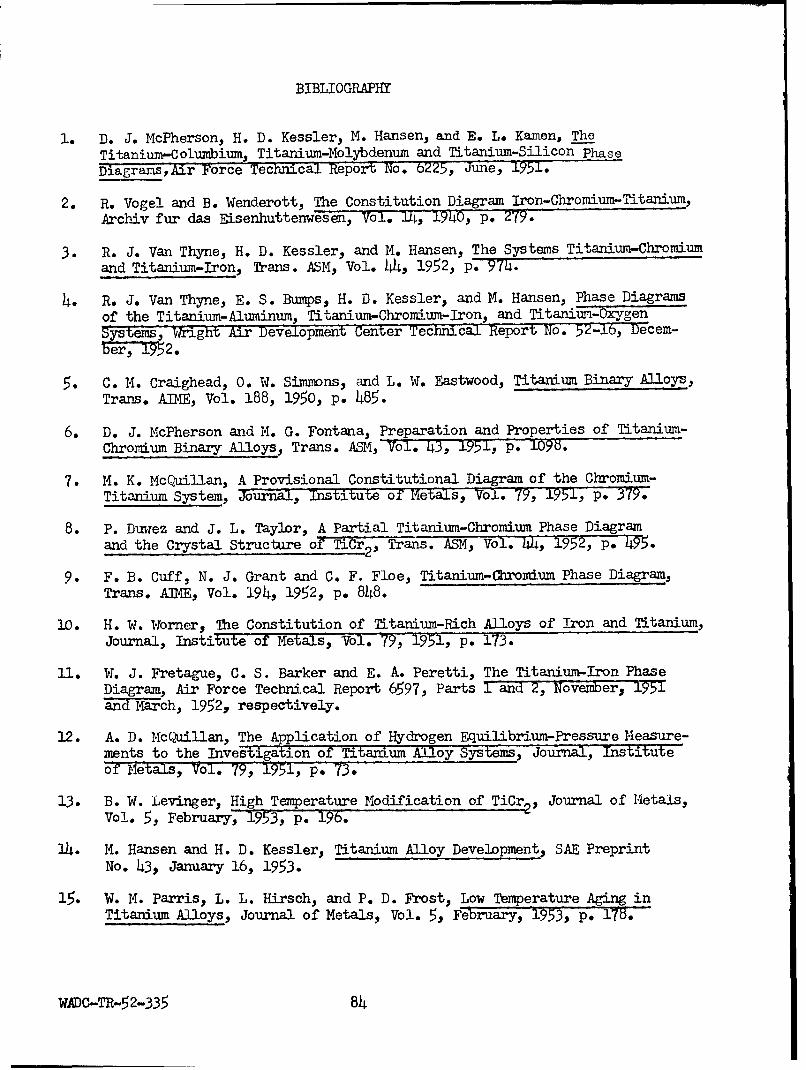
BIBLIOGRAPHY
1. D. J. McPherson, H. D. Kessler, M. Hansen, and E. L. Kanen, TheTitanium-Columbium, Titanium-Molybdenum and Titanium-Silicon PhaseD6iagrams,Air Force Technical Report No. 6225, June, 1951.
2. R. Vogel and B. Wenderott, The Constitution Diagram Iron-Chromium-Titanium,Archiv fur das Eisenhuttenwesen, Vol. lh, 197O, p. 279.
3. R. J. Van Thyne, H. D. Kessler, and M. Hansen, The Systems Titanitum-Chromiumand Titanium-Iron, Trans. ASM, Vol. 44, 1952, p. 97M.
4. R. J. Van Thyne, E. S. Bumps, H. D. Kessler, and M. Hansen, Phase Diagramsof the Titanium-Aluminum, Titanium-Chromium-Iron, and Titanixg e _nSyst-ms, Wright Air DeVelopment Center Technical Report No. 52-16, Decem-ber., 1952.
5. C. 14. Craighead, 0. W. Simmons, and L. W. Eastwood, Titanium Binary Alloys,Trans. AIME, Vol. 188, 1950, p. 485.
6. D. J. McPherson and M. G. Fontana, Preparation and Properties of Titanium-Chromium Binary Alloys, Trans. ASM, Vol. 43, 1951, p. 109b.
7. M. K. McQuillan, A Provisional Constitutional Diagram of the Chromium-Titanium System, Journal, Institute -o Metals, Vol. 79, 1951, P. 379.
8. P. Duwez and J. L. Taylor, A Partial Titanium-Chromium Phase Diagramand the Crystal Structure of TiCr 2 , Trans. ASM, Vol. 44., 1952, p. 495.
9. F. B. Cuff, N. J. Grant and C. F. Floe, Titanium-Chromium Phase Diagram,Trans. AM., Vol. 194., 1952, p. 848.
10. H. W. Worner, The Constitution of Titanium-Rich Alloys of Iron and Titanium,Journal, Institute of Metals, Vol. 79, 1951, p. 173.
11. W. J. Fretague, C. S. Barker and E. A. Peretti, The Titanium-Iron PhaseDiagram, Air Force Technical Report 6597, Parts 1 and 2, November, 1951and March, 1952, respectively.
12. A. D. McQuillan, The Application of Hydrogen Equilibrium-Pressure Measure-ments to the Investigation of Titanium Alloy Systems, Journal, Instituteof Metals, Vol. 79, 1951, p. 73.
13. B. W. Levinger, High Temperature Modification of TiCr , Journal of Metals,Vol. 5,y,F 93., p. 196.
14. M. Hansen and H. D. Kessler, Titanium Alloy Development, SAE PreprintNo. 43., January 16, 1953.
15. W. M. Parris, L. L. Hirsch, and P. D. Frost, Low Temperature Aging inTitanium Alloys, Journal of Metals, Vol. 5, February, 1953, p, 17T.
WADC-TR-52-335 84
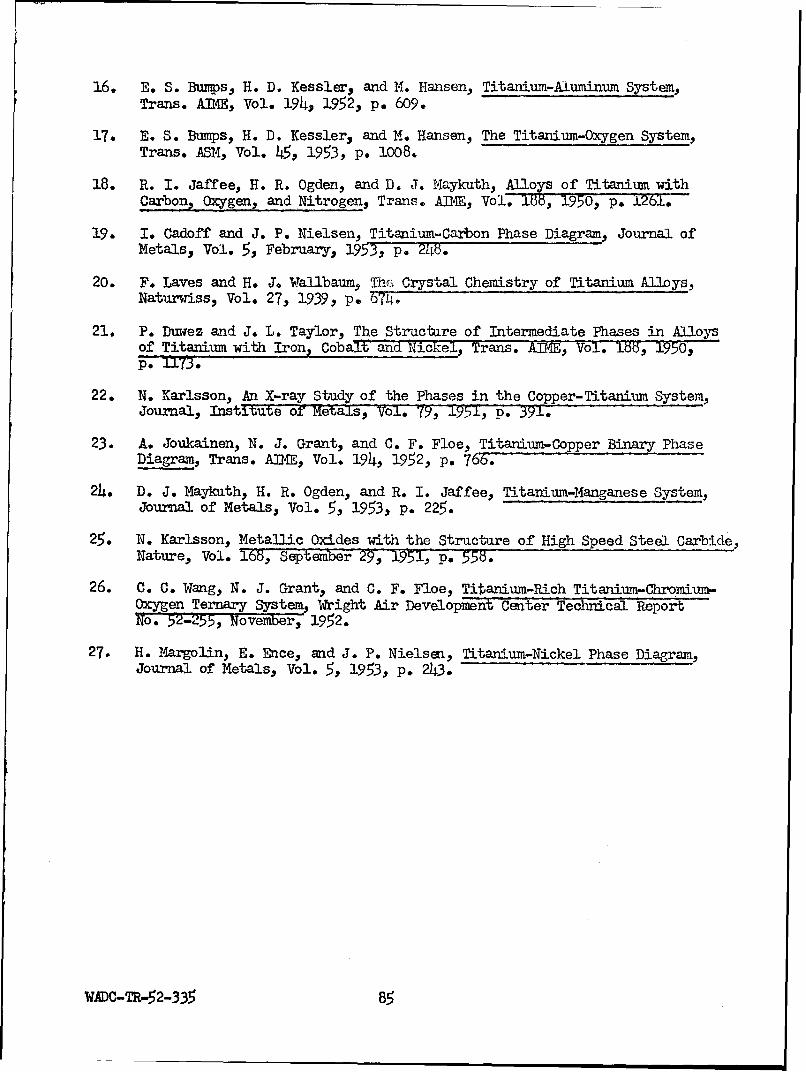
16. E. S. Bumps, H. D. Kessler, and M. Hansen, Titanium-Aluminum System,Trans. AIME, Vol. 194, 1952, p. 609.
17. E. S. Bumps, H. D. Kessler, and M. Hansen, The Titanium-Oxygen System,Trans. ASM, Vol. 45, 1953, p. 1008.
18. R. I. Jaffee, H. R. Ogden, and D. J. M4aykuth, Alloys of Titanium withCarbon, Oxygen, and Nitrogen, Trans. AIME, Vol. 155, 1950, p. 1261.
19. I. Cadoff and J. P. Nielsen, Titanium-Carbon Phase Diagram, Journal ofMetals, Vol. 5, February, 1953, p. 248.
20. F. Laves and H. J. Wallbaum, Thf. Crystal Chemistry of Titanium Alloys,Naturiniss, Vol. 27, 1939, p. U(4-
21. P. Duwez and J. L. Taylor, The Structure of Intermediate Phases in Alloysof Titanium with Iron, Cobalt and Nickel, Trans. -M, Vol. 168, 1950,p. 1173.
22. N. Karlsson, An X-ray Study of the Phases in the Copper-Titanium System,Journal, Institute of Metals, Vol. 79, 1951, p. 391.
23. A. Joukainen, N. J. Grant, and C. F. Floe, Titanium-Copper Binary PhaseDiagram, Trans. AIME, Vol. 194, 1952, p. 766.
24. D. J. Maykath, H. R. Ogden, and R. I. Jaffee, Titanium-Manganese System,Journal of Metals, Vol. 5, 1953, p. 225.
25. N. Karlsson, Metallic Oxides with the Structure of High Speed Steel Carbide,Nature, Vol. 165, Sptember 29, 1951 , p. 558.
26. C. C. Wang, N. J. Grant, and C. F. Floe, Titanium-Rich Titanium-Chromium-Oxygen Ternary System, Wright Air Development Center Technical ReportNo. 52-255, November, 1952.
27. H. Margolin, E. Ence, and J. P. Nielsen, Titanium-Nickel Phase Diagram,Journal of Metals, Vol. 5, 1953, p. 243.
WADC-T-52-335 85