Embed Size (px)
Citation preview
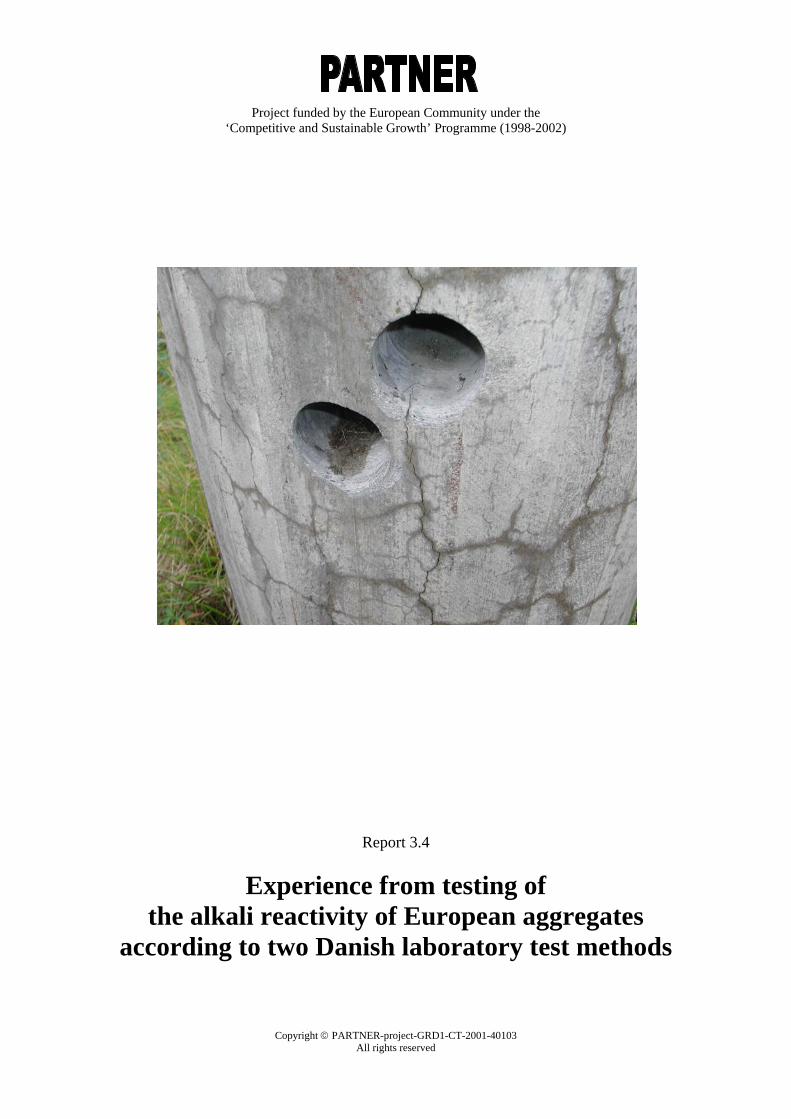
Project funded by the European Community under the ‘Competitive and Sustainable Growth’ Programme (1998-2002)
Report 3.4
Experience from testing of the alkali reactivity of European aggregates
according to two Danish laboratory test methods
Copyright © PARTNER-project-GRD1-CT-2001-40103 All rights reserved
Copyright © PARTNER-project-GRD1-CT-2001-40103 All rights reserved
3
Preface This report is one of a series produced as output from PARTNER, a project funded by the European Community under the “Competitive and Sustainable Growth“ programme. The overall objective of this project is to provide the basis for a unified test procedure for evaluating the alkali reactivity of aggregates across the different European economic and geological regions. It will enable CEN TC-154, Aggregates, to fulfil the requirements of the Aggregates Mandate, M125, which identifies durability against alkalis as a necessary performance characteristic in the specification of aggregates for concrete (EN 12620) to meet the Essential Requirements of the CPD for Strength and Safety. The project will achieve this by:
• Evaluating the tests developed by RILEM, and some regional tests, for their suitability for use with the wide variety of aggregate and geological types found across Europe.
• Calibrating the results of these accelerated tests against behaviour in concrete in real structures and in field sites.
• Producing an “atlas” of the geology and petrography of European aggregates. • Educating European petrographers and testing organisations in the effective use of these
methods. • Making recommendations, based on the above work, to CEN for suitable CEN methods of test
and specifications to ensure durability against alkalis. The project has 24 Partners from 14 countries, covering most of Europe, from Iceland to Greece. Partners BRE ……………………………...……………………………………………………………….UK PC Laboratoriet A/S ....................................................................................................................... DK SINTEF ......................................................................................................................................... NO SP - Swedish National Testing and Research Institute .................................................................. SE RAMBOLL .................................................................................................................................... DK ISSeP – Institut Scientifique de Service Public.............................................................................. B LCPC Laboratory .......................................................................................................................... F VDZ – German Cement Works Association ................................................................................. D TITAN Cement Company, S.A...................................................................................................... EL LABEIN ......................................................................................................................................... ES CRIC – Centre National de Recherches Scientifiques et techniques pour L’Industrie Cimentière .................................................................................................................. B IMBiGS .......................................................................................................................................... PL NORCEM A.S................................................................................................................................ NO CESI ............................................................................................................................................... I VOZ – Austrian Cement Association............................................................................................. A IBRI – Icelandic Building Research Institute STATS............................................................................................................................................ UK NCC AB ......................................................................................................................................... SE DANISH TECHNOLOGICAL INSTITUTE ................................................................................ DK AIDICO.......................................................................................................................................... ES ANEFA........................................................................................................................................... ES Cemex............................................................................................................................................. ES HOLCIM ........................................................................................................................................ B Hönnun........................................................................................................................................... IS
Copyright © PARTNER-project-GRD1-CT-2001-40103 All rights reserved
4
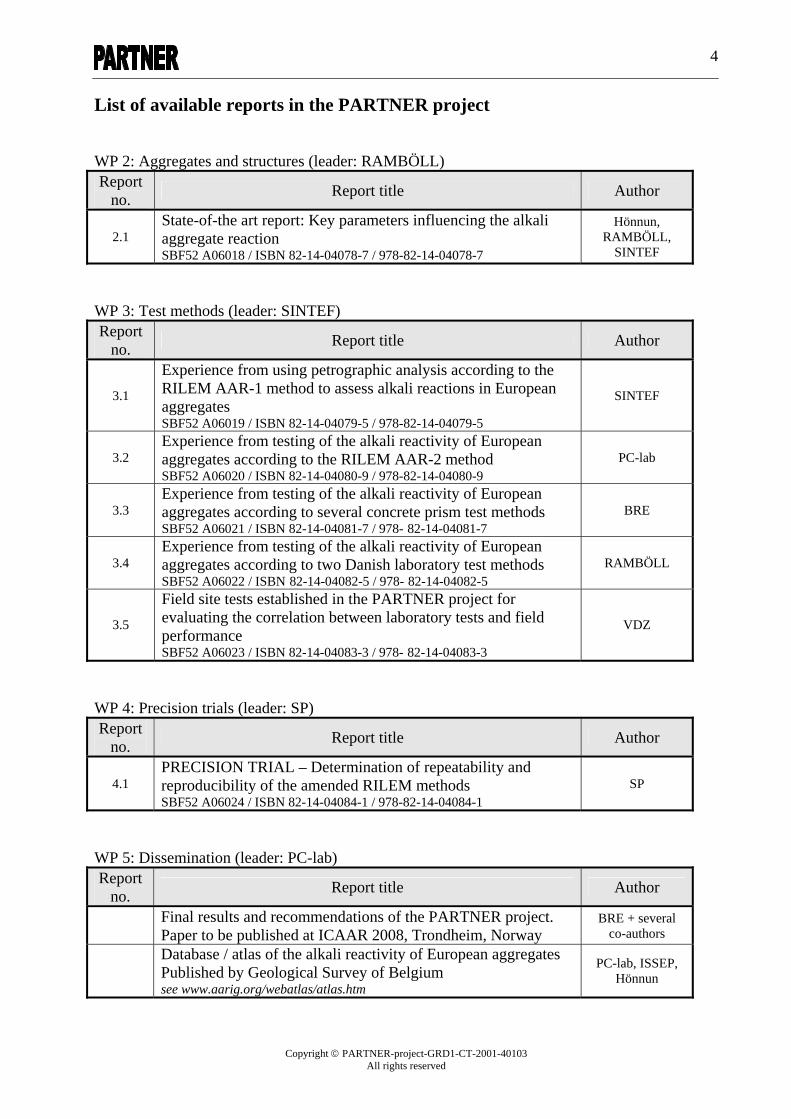
List of available reports in the PARTNER project WP 2: Aggregates and structures (leader: RAMBÖLL) Report
no. Report title Author
2.1 State-of-the art report: Key parameters influencing the alkali aggregate reaction SBF52 A06018 / ISBN 82-14-04078-7 / 978-82-14-04078-7
Hönnun, RAMBÖLL,
SINTEF
WP 3: Test methods (leader: SINTEF) Report
no. Report title Author
3.1
Experience from using petrographic analysis according to the RILEM AAR-1 method to assess alkali reactions in European aggregates SBF52 A06019 / ISBN 82-14-04079-5 / 978-82-14-04079-5
SINTEF
3.2 Experience from testing of the alkali reactivity of European aggregates according to the RILEM AAR-2 method SBF52 A06020 / ISBN 82-14-04080-9 / 978-82-14-04080-9
PC-lab
3.3 Experience from testing of the alkali reactivity of European aggregates according to several concrete prism test methods SBF52 A06021 / ISBN 82-14-04081-7 / 978- 82-14-04081-7
BRE
3.4 Experience from testing of the alkali reactivity of European aggregates according to two Danish laboratory test methods SBF52 A06022 / ISBN 82-14-04082-5 / 978- 82-14-04082-5
RAMBÖLL
3.5
Field site tests established in the PARTNER project for evaluating the correlation between laboratory tests and field performance SBF52 A06023 / ISBN 82-14-04083-3 / 978- 82-14-04083-3
VDZ
WP 4: Precision trials (leader: SP) Report
no. Report title Author
4.1 PRECISION TRIAL – Determination of repeatability and reproducibility of the amended RILEM methods SBF52 A06024 / ISBN 82-14-04084-1 / 978-82-14-04084-1
SP
WP 5: Dissemination (leader: PC-lab) Report
no. Report title Author
Final results and recommendations of the PARTNER project. Paper to be published at ICAAR 2008, Trondheim, Norway
BRE + several co-authors
Database / atlas of the alkali reactivity of European aggregates Published by Geological Survey of Belgium see www.aarig.org/webatlas/atlas.htm
PC-lab, ISSEP, Hönnun
Copyright © PARTNER-project-GRD1-CT-2001-40103 All rights reserved
5
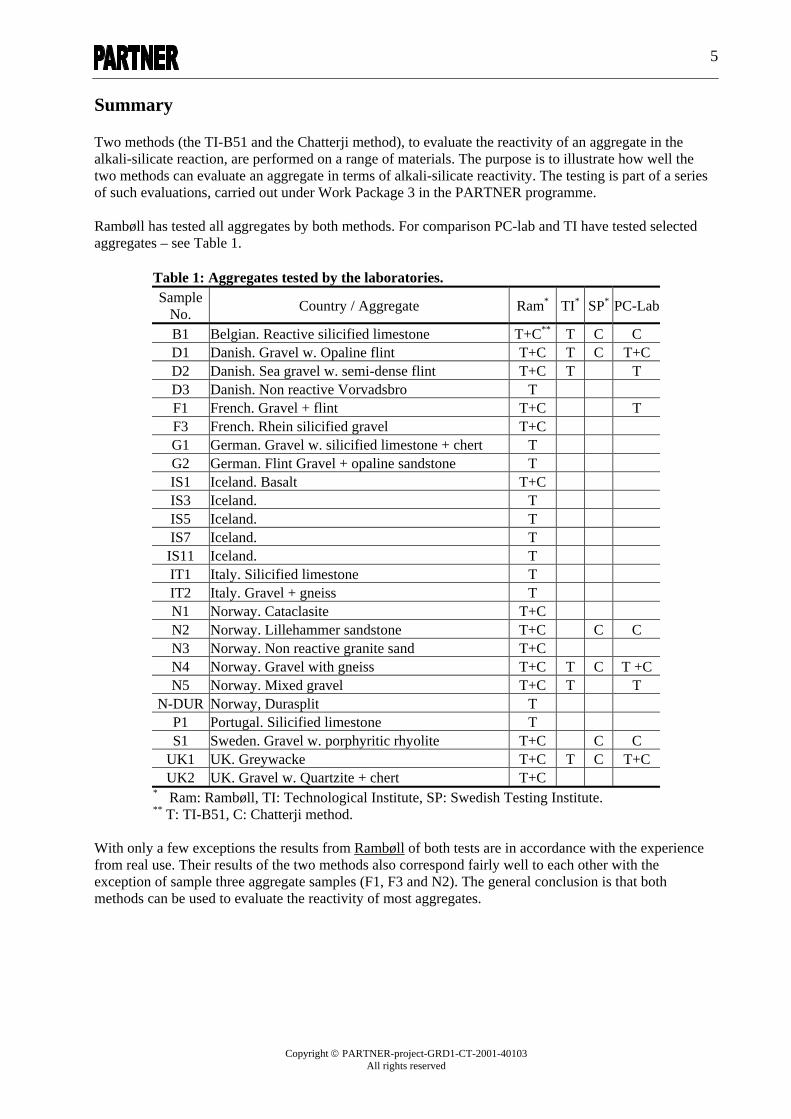
Summary Two methods (the TI-B51 and the Chatterji method), to evaluate the reactivity of an aggregate in the alkali-silicate reaction, are performed on a range of materials. The purpose is to illustrate how well the two methods can evaluate an aggregate in terms of alkali-silicate reactivity. The testing is part of a series of such evaluations, carried out under Work Package 3 in the PARTNER programme. Rambøll has tested all aggregates by both methods. For comparison PC-lab and TI have tested selected aggregates – see Table 1.
Table 1: Aggregates tested by the laboratories. Sample
No. Country / Aggregate Ram* TI* SP* PC-Lab
B1 Belgian. Reactive silicified limestone T+C** T C C D1 Danish. Gravel w. Opaline flint T+C T C T+C D2 Danish. Sea gravel w. semi-dense flint T+C T T D3 Danish. Non reactive Vorvadsbro T F1 French. Gravel + flint T+C T F3 French. Rhein silicified gravel T+C G1 German. Gravel w. silicified limestone + chert T G2 German. Flint Gravel + opaline sandstone T IS1 Iceland. Basalt T+C IS3 Iceland. T IS5 Iceland. T IS7 Iceland. T
IS11 Iceland. T IT1 Italy. Silicified limestone T IT2 Italy. Gravel + gneiss T N1 Norway. Cataclasite T+C N2 Norway. Lillehammer sandstone T+C C C N3 Norway. Non reactive granite sand T+C N4 Norway. Gravel with gneiss T+C T C T +C N5 Norway. Mixed gravel T+C T T
N-DUR Norway, Durasplit T P1 Portugal. Silicified limestone T S1 Sweden. Gravel w. porphyritic rhyolite T+C C C
UK1 UK. Greywacke T+C T C T+C UK2 UK. Gravel w. Quartzite + chert T+C
* Ram: Rambøll, TI: Technological Institute, SP: Swedish Testing Institute. ** T: TI-B51, C: Chatterji method.
With only a few exceptions the results from Rambøll of both tests are in accordance with the experience from real use. Their results of the two methods also correspond fairly well to each other with the exception of sample three aggregate samples (F1, F3 and N2). The general conclusion is that both methods can be used to evaluate the reactivity of most aggregates.
Copyright © PARTNER-project-GRD1-CT-2001-40103 All rights reserved
6
Content
1 TI-B51 - The Danish mortar bar test ................................................................................... 7 1.1 Introduction.................................................................................................................................7
1.2 Method ......................................................................................................................................7
1.3 Work programme .......................................................................................................................7
1.4 Results ......................................................................................................................................7
2 The Chatterji method – Chemical method for aggregate testing.................................... 17 2.1 Introduction...............................................................................................................................17
2.2 Method ....................................................................................................................................17
2.3 Work programme .....................................................................................................................17
2.4 Results ....................................................................................................................................17
3 Comments on results from TI-B51 and Chatterji’s method............................................ 18
Annex: ANNEX 1. Method description (note) for the TI-B51 method ANNEX 2. Petrographic composition and field performance of the aggregates tested ANNEX 3. Method description (note) for the Chatterji method
Copyright © PARTNER-project-GRD1-CT-2001-40103 All rights reserved
7
1 TI-B51 - The Danish mortar bar test
1.1 Introduction This report describes how the various aggregates selected for testing respond to the test TI-B51 - The Danish mortar bar test. The testing is part of a series of evaluations of the alkali reactivity of aggregates, carried out under Work Package 3 in the PARTNER programme. The report is written by Bent Grelk, Rambøll, Denmark ([email protected]).
1.2 Method In addition to the aggregates selected in WP2/WP3 (see Annex 2), five Icelandic samples (IS1, -3, -5, -7 and –11) and one Norwegian sample (N-DUR) were also tested by the TI-B51 method. Boulder size aggregates were crushed to fit the grading curve described in Annex 1. Mortar prisms (40x40x160 mm) were produced by mixing the aggregates with a low alkali Portland cement PC (EA/L/S). In case of low flow values a plasticizer (Plastiment-LA55) was used. The method employed (TI-B51) was developed by Denmark’s Technological Institute and is only published in Danish. The note in Annex 1 does, however, describe the test in sufficient detail. The principle of the method is to submerge the mortar prisms into a saturated NaCl water solution at 50˚C. NaCl will react with eventual reactive material in the aggregate and result in an expansion. The lengths of the prisms are continuously measured at regular intervals and expansion curves produced for each aggregate. The expansion is this way a measure for the reactivity of the aggregate.
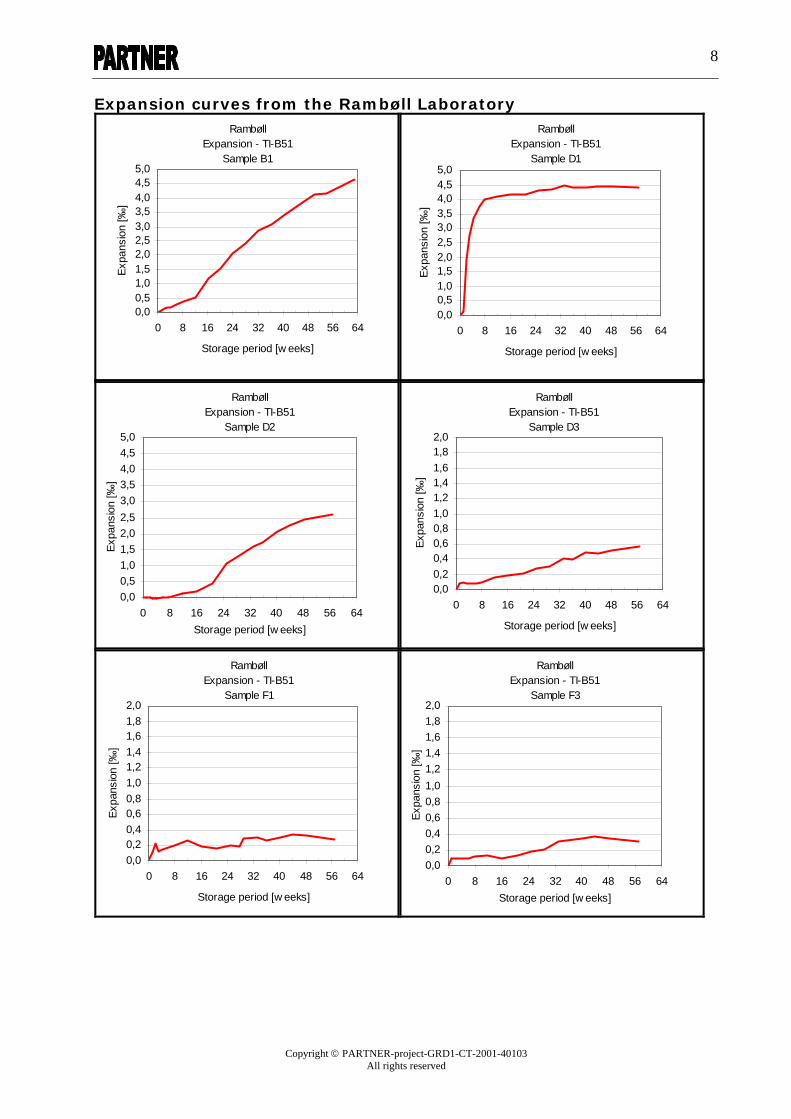
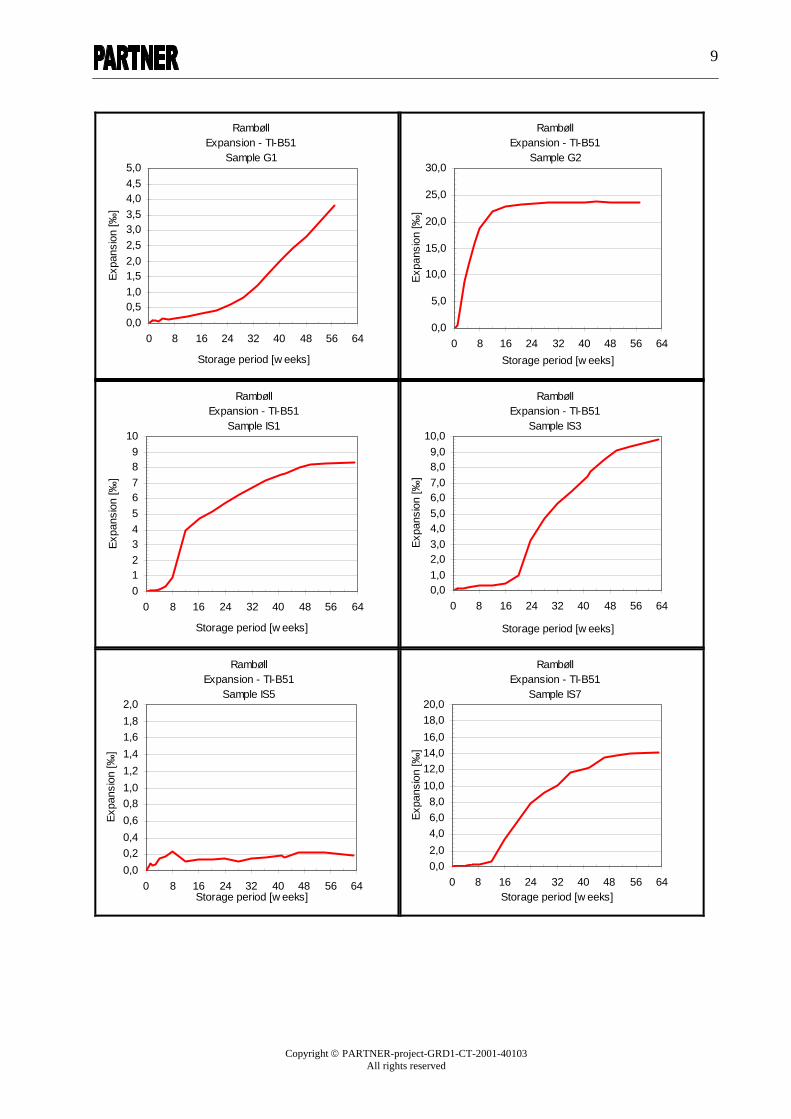
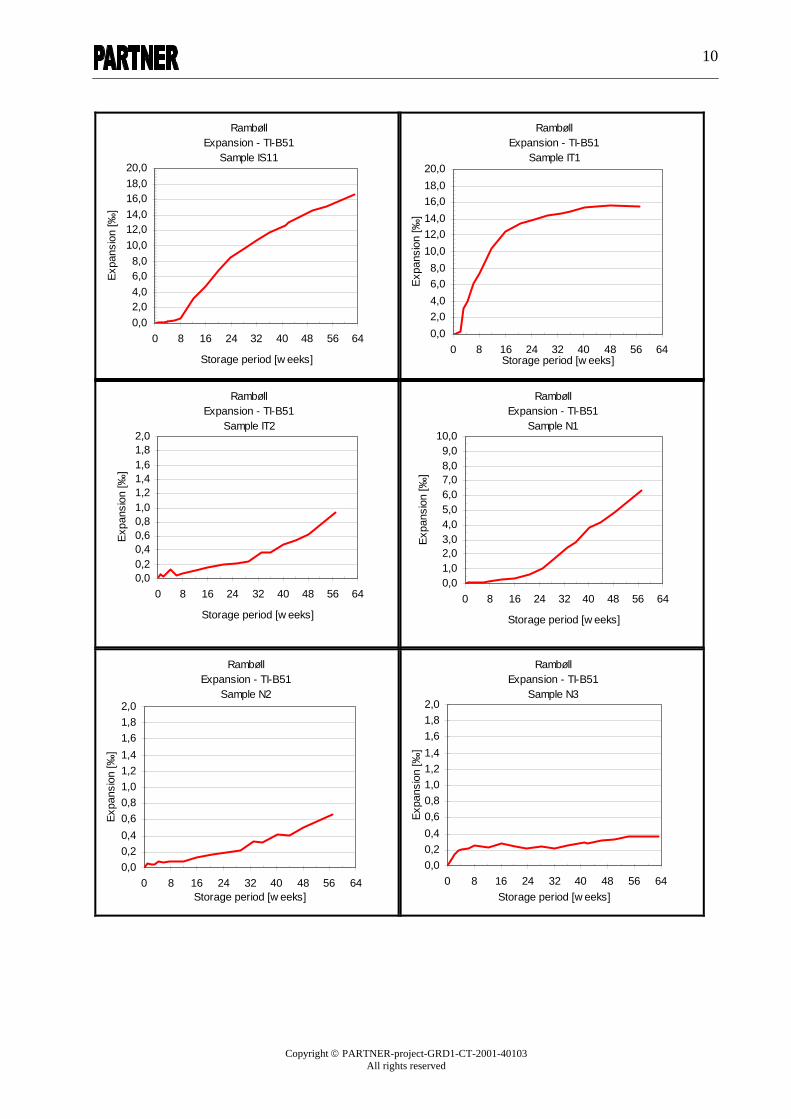
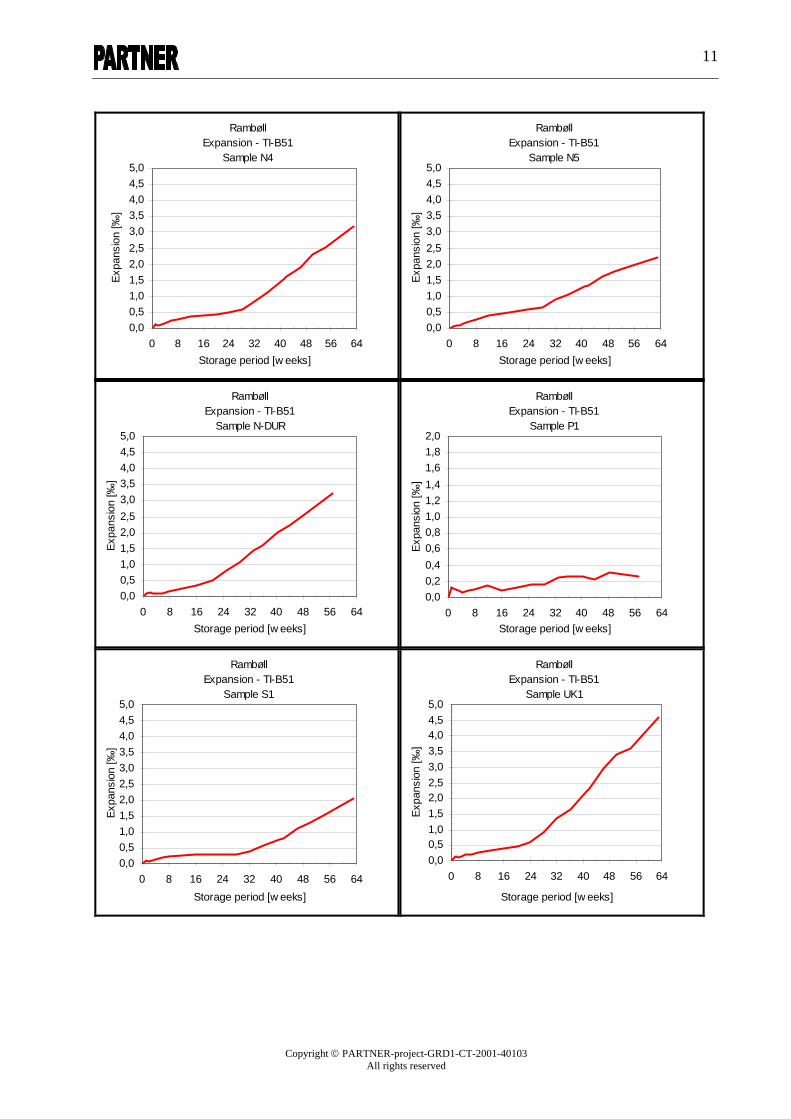
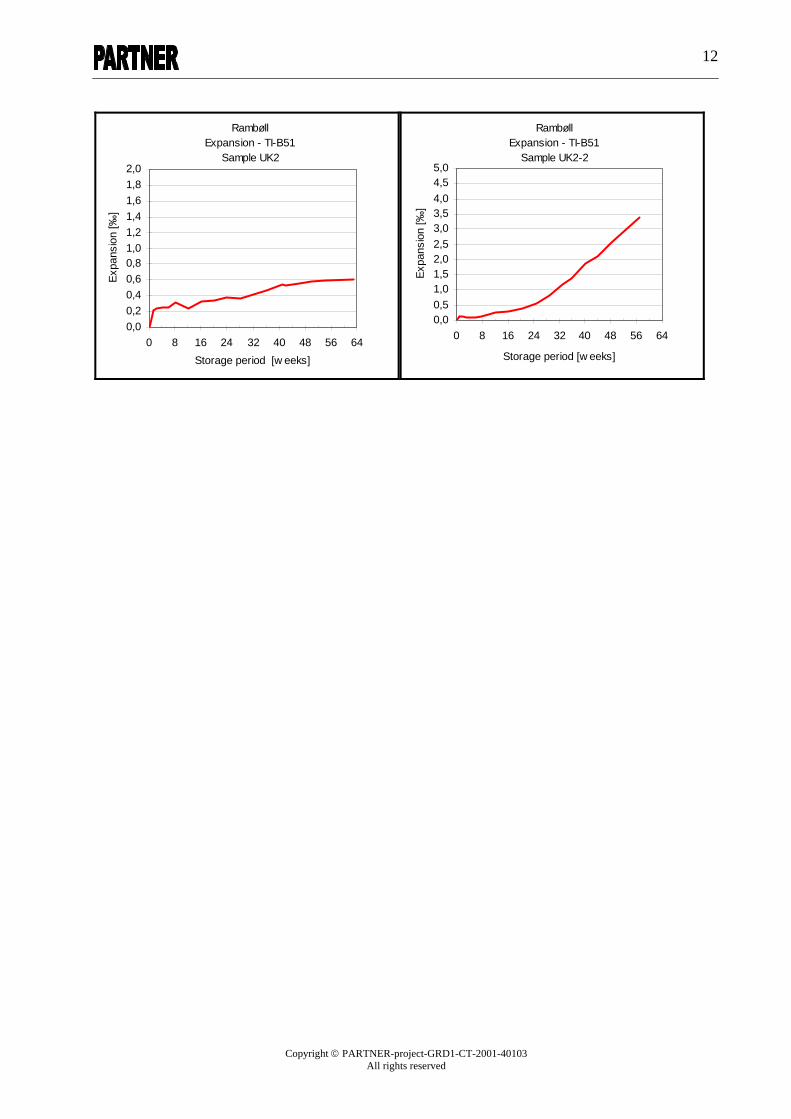
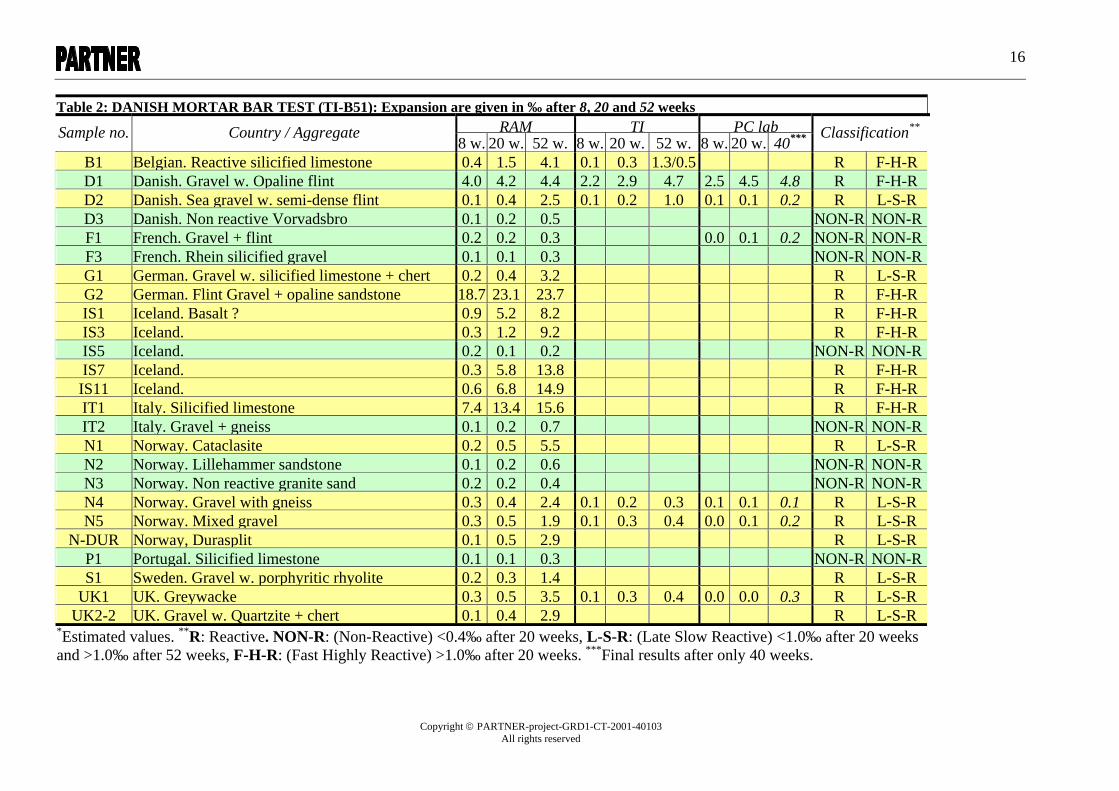
1.3 Work programme Rambøll tested all aggregates by this method for at least 52 weeks. For comparison TI and PC-Lab have tested selected aggregates. All mortar prisms were tested for at least 52 weeks. Expansions were measured every week during the first 4 weeks period and hereafter every 4 week. The expansions measured at 20 and 52 week serve as the fundament for classifying the reactivity of the aggregates. The categories are: o NON Reactive (NON-R): Expansion <0.4‰ after 20 weeks o Late Slow Reactive (L-S-R): Expansion <1.0‰ after 20 weeks and >1.0‰ after 52 weeks o Fast Highly Reactive (F-H-R): Expansion >1.0‰ after 20 weeks
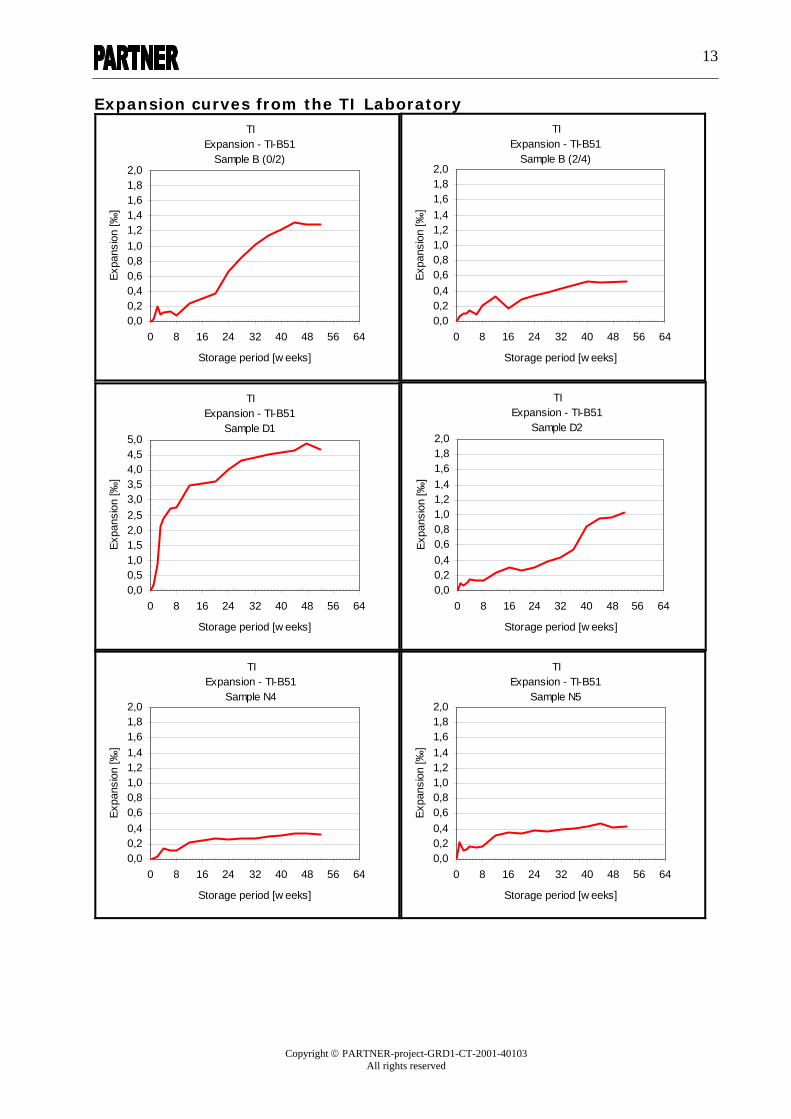
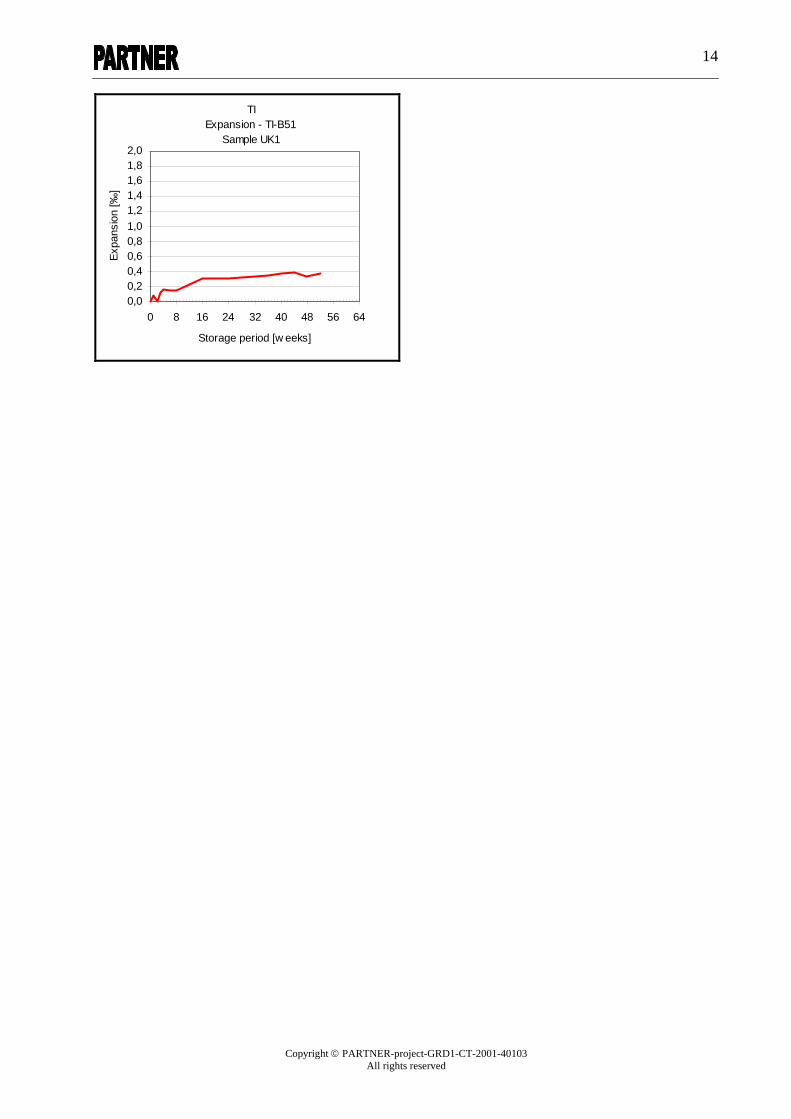
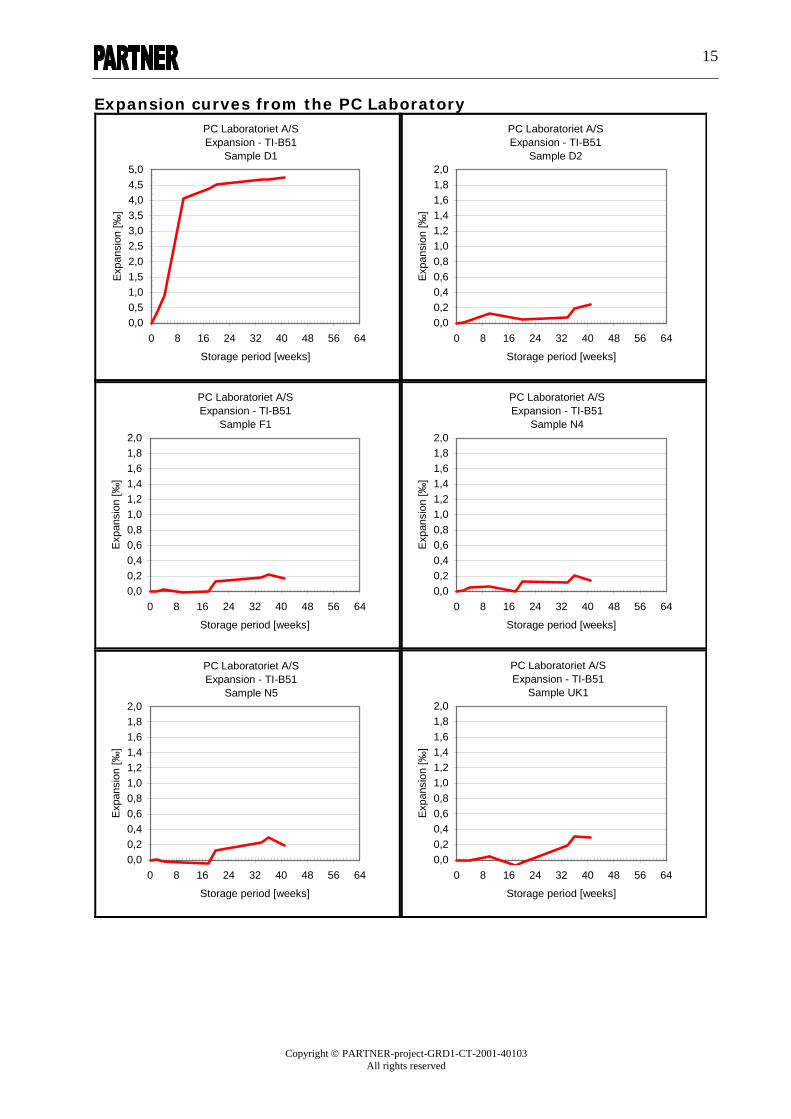
1.4 Results The results of the testing from the three laboratories are visualised in the following expansion curves (NB! The scale of the vertical axes varies). The curves are followed by a scheme (Table 2) with summary of the results and the classifications. TI and PC-Lab obtained results that deviated significantly (lower expansion) from the results of the Rambøll Laboratory. Afterwards it was found that PC-Lab and TI had deviated from the prescribed method by using high-alkali cement in the mortar. At this stage the chemical implications of this is not fully understood, but their results are not comparable to the results from Rambøll.
Copyright © PARTNER-project-GRD1-CT-2001-40103 All rights reserved
8
Expansion curves from the Rambøll Laboratory Rambøll
Expansion - TI-B51Sample B1
0,00,51,01,52,02,53,03,54,04,55,0
0 8 16 24 32 40 48 56 64
Storage period [w eeks]
Expa
nsio
n [‰
]Rambøll
Expansion - TI-B51Sample D1
0,00,51,01,52,02,53,03,54,04,55,0
0 8 16 24 32 40 48 56 64
Storage period [w eeks]
Expa
nsio
n [‰
]
RambøllExpansion - TI-B51
Sample D2
0,00,51,01,52,02,53,03,54,04,55,0
0 8 16 24 32 40 48 56 64Storage period [w eeks]
Expa
nsio
n [‰
]
RambøllExpansion - TI-B51
Sample D3
0,00,20,40,60,81,01,21,41,61,82,0
0 8 16 24 32 40 48 56 64
Storage period [w eeks]
Expa
nsio
n [‰
]
RambøllExpansion - TI-B51
Sample F1
0,00,20,40,60,81,01,21,41,61,82,0
0 8 16 24 32 40 48 56 64
Storage period [w eeks]
Expa
nsio
n [‰
]
RambøllExpansion - TI-B51
Sample F3
0,00,20,40,60,81,01,21,41,61,82,0
0 8 16 24 32 40 48 56 64Storage period [w eeks]
Expa
nsio
n [‰
]
Copyright © PARTNER-project-GRD1-CT-2001-40103 All rights reserved
9
Rambøll
Expansion - TI-B51Sample G1
0,00,51,01,52,02,53,03,54,04,55,0
0 8 16 24 32 40 48 56 64
Storage period [w eeks]
Expa
nsio
n [‰
]Rambøll
Expansion - TI-B51Sample G2
0,0
5,0
10,0
15,0
20,0
25,0
30,0
0 8 16 24 32 40 48 56 64Storage period [w eeks]
Expa
nsio
n [‰
]
RambøllExpansion - TI-B51
Sample IS1
0123456789
10
0 8 16 24 32 40 48 56 64
Storage period [w eeks]
Expa
nsio
n [‰
]
RambøllExpansion - TI-B51
Sample IS3
0,01,02,03,04,05,06,07,08,09,0
10,0
0 8 16 24 32 40 48 56 64
Storage period [w eeks]
Expa
nsio
n [‰
]
RambøllExpansion - TI-B51
Sample IS5
0,00,20,40,60,81,01,21,41,61,82,0
0 8 16 24 32 40 48 56 64Storage period [w eeks]
Expa
nsio
n [‰
]
RambøllExpansion - TI-B51
Sample IS7
0,02,04,06,08,0
10,012,014,016,018,020,0
0 8 16 24 32 40 48 56 64Storage period [w eeks]
Expa
nsio
n [‰
]
Copyright © PARTNER-project-GRD1-CT-2001-40103 All rights reserved
10
Rambøll
Expansion - TI-B51Sample IS11
0,02,04,06,08,0
10,012,014,016,018,020,0
0 8 16 24 32 40 48 56 64
Storage period [w eeks]
Expa
nsio
n [‰
]Rambøll
Expansion - TI-B51Sample IT1
0,02,04,06,08,0
10,012,014,016,018,020,0
0 8 16 24 32 40 48 56 64Storage period [w eeks]
Expa
nsio
n [‰
]
Rambøll
Expansion - TI-B51Sample IT2
0,00,20,40,60,81,01,21,41,61,82,0
0 8 16 24 32 40 48 56 64
Storage period [w eeks]
Expa
nsio
n [‰
]
RambøllExpansion - TI-B51
Sample N1
0,01,02,03,04,05,06,07,08,09,0
10,0
0 8 16 24 32 40 48 56 64
Storage period [w eeks]
Expa
nsio
n [‰
]
RambøllExpansion - TI-B51
Sample N2
0,00,20,40,60,81,01,21,41,61,82,0
0 8 16 24 32 40 48 56 64Storage period [w eeks]
Expa
nsio
n [‰
]
RambøllExpansion - TI-B51
Sample N3
0,00,20,40,60,81,01,21,41,61,82,0
0 8 16 24 32 40 48 56 64Storage period [w eeks]
Expa
nsio
n [‰
]
Copyright © PARTNER-project-GRD1-CT-2001-40103 All rights reserved
11
Rambøll
Expansion - TI-B51Sample N4
0,00,51,01,52,02,53,03,54,04,55,0
0 8 16 24 32 40 48 56 64Storage period [w eeks]
Expa
nsio
n [‰
]Rambøll
Expansion - TI-B51Sample N5
0,00,51,01,52,02,53,03,54,04,55,0
0 8 16 24 32 40 48 56 64Storage period [w eeks]
Expa
nsio
n [‰
]
RambøllExpansion - TI-B51
Sample N-DUR
0,00,51,01,52,02,53,03,54,04,55,0
0 8 16 24 32 40 48 56 64Storage period [w eeks]
Expa
nsio
n [‰
]
RambøllExpansion - TI-B51
Sample P1
0,00,20,40,60,81,01,21,41,61,82,0
0 8 16 24 32 40 48 56 64Storage period [w eeks]
Expa
nsio
n [‰
]
RambøllExpansion - TI-B51
Sample S1
0,00,51,01,52,02,53,03,54,04,55,0
0 8 16 24 32 40 48 56 64Storage period [w eeks]
Expa
nsio
n [‰
]
RambøllExpansion - TI-B51
Sample UK1
0,00,51,01,52,02,53,03,54,04,55,0
0 8 16 24 32 40 48 56 64
Storage period [w eeks]
Expa
nsio
n [‰
]
Copyright © PARTNER-project-GRD1-CT-2001-40103 All rights reserved
12
Rambøll
Expansion - TI-B51Sample UK2
0,00,20,40,60,81,01,21,41,61,82,0
0 8 16 24 32 40 48 56 64Storage period [w eeks]
Expa
nsio
n [‰
]Rambøll
Expansion - TI-B51Sample UK2-2
0,00,51,01,52,02,53,03,54,04,55,0
0 8 16 24 32 40 48 56 64
Storage period [w eeks]
Expa
nsio
n [‰
]
Copyright © PARTNER-project-GRD1-CT-2001-40103 All rights reserved
13
Expansion curves from the TI Laboratory TI
Expansion - TI-B51 Sample B (0/2)
0,00,20,40,60,81,01,21,41,61,82,0
0 8 16 24 32 40 48 56 64
Storage period [w eeks]
Expa
nsio
n [‰
]TI
Expansion - TI-B51Sample B (2/4)
0,00,20,40,60,81,01,21,41,61,82,0
0 8 16 24 32 40 48 56 64
Storage period [w eeks]
Expa
nsio
n [‰
]
TIExpansion - TI-B51
Sample D1
0,00,51,01,52,02,53,03,54,04,55,0
0 8 16 24 32 40 48 56 64
Storage period [w eeks]
Expa
nsio
n [‰
]
TIExpansion - TI-B51
Sample D2
0,00,20,40,60,81,01,21,41,61,82,0
0 8 16 24 32 40 48 56 64
Storage period [w eeks]
Expa
nsio
n [‰
]
TIExpansion - TI-B51
Sample N4
0,00,20,40,60,81,01,21,41,61,82,0
0 8 16 24 32 40 48 56 64
Storage period [w eeks]
Expa
nsio
n [‰
]
TIExpansion - TI-B51
Sample N5
0,00,20,40,60,81,01,21,41,61,82,0
0 8 16 24 32 40 48 56 64
Storage period [w eeks]
Expa
nsio
n [‰
]
Copyright © PARTNER-project-GRD1-CT-2001-40103 All rights reserved
14
TIExpansion - TI-B51
Sample UK1
0,00,20,40,60,81,01,21,41,61,82,0
0 8 16 24 32 40 48 56 64
Storage period [w eeks]
Expa
nsio
n [‰
]
Copyright © PARTNER-project-GRD1-CT-2001-40103 All rights reserved
15
Expansion curves from the PC Laboratory PC Laboratoriet A/SExpansion - TI-B51
Sample D1
0,00,51,01,52,02,53,03,54,04,55,0
0 8 16 24 32 40 48 56 64
Storage period [weeks]
Exp
ansi
on [‰
]PC Laboratoriet A/SExpansion - TI-B51
Sample D2
0,00,20,40,60,81,01,21,41,61,82,0
0 8 16 24 32 40 48 56 64
Storage period [weeks]
Exp
ansi
on [‰
]
PC Laboratoriet A/SExpansion - TI-B51
Sample F1
0,00,20,40,60,81,01,21,41,61,82,0
0 8 16 24 32 40 48 56 64
Storage period [weeks]
Exp
ansi
on [‰
]
PC Laboratoriet A/SExpansion - TI-B51
Sample N4
0,00,20,40,60,81,01,21,41,61,82,0
0 8 16 24 32 40 48 56 64
Storage period [weeks]
Exp
ansi
on [‰
]
PC Laboratoriet A/SExpansion - TI-B51
Sample N5
0,00,20,40,60,81,01,21,41,61,82,0
0 8 16 24 32 40 48 56 64
Storage period [weeks]
Exp
ansi
on [‰
]
PC Laboratoriet A/SExpansion - TI-B51
Sample UK1
0,00,20,40,60,81,01,21,41,61,82,0
0 8 16 24 32 40 48 56 64
Storage period [weeks]
Exp
ansi
on [‰
]
Copyright © PARTNER-project-GRD1-CT-2001-40103 All rights reserved
16
Table 2: DANISH MORTAR BAR TEST (TI-B51): Expansion are given in ‰ after 8, 20 and 52 weeksRAM TI PC labSample no. Country / Aggregate
8 w. 20 w. 52 w. 8 w. 20 w. 52 w. 8 w. 20 w. 40*** Classification**
B1 Belgian. Reactive silicified limestone 0.4 1.5 4.1 0.1 0.3 1.3/0.5 R F-H-RD1 Danish. Gravel w. Opaline flint 4.0 4.2 4.4 2.2 2.9 4.7 2.5 4.5 4.8 R F-H-RD2 Danish. Sea gravel w. semi-dense flint 0.1 0.4 2.5 0.1 0.2 1.0 0.1 0.1 0.2 R L-S-RD3 Danish. Non reactive Vorvadsbro 0.1 0.2 0.5 NON-R NON-RF1 French. Gravel + flint 0.2 0.2 0.3 0.0 0.1 0.2 NON-R NON-RF3 French. Rhein silicified gravel 0.1 0.1 0.3 NON-R NON-RG1 German. Gravel w. silicified limestone + chert 0.2 0.4 3.2 R L-S-RG2 German. Flint Gravel + opaline sandstone 18.7 23.1 23.7 R F-H-RIS1 Iceland. Basalt ? 0.9 5.2 8.2 R F-H-RIS3 Iceland. 0.3 1.2 9.2 R F-H-RIS5 Iceland. 0.2 0.1 0.2 NON-R NON-RIS7 Iceland. 0.3 5.8 13.8 R F-H-RIS11 Iceland. 0.6 6.8 14.9 R F-H-RIT1 Italy. Silicified limestone 7.4 13.4 15.6 R F-H-RIT2 Italy. Gravel + gneiss 0.1 0.2 0.7 NON-R NON-RN1 Norway. Cataclasite 0.2 0.5 5.5 R L-S-RN2 Norway. Lillehammer sandstone 0.1 0.2 0.6 NON-R NON-RN3 Norway. Non reactive granite sand 0.2 0.2 0.4 NON-R NON-RN4 Norway. Gravel with gneiss 0.3 0.4 2.4 0.1 0.2 0.3 0.1 0.1 0.1 R L-S-RN5 Norway. Mixed gravel 0.3 0.5 1.9 0.1 0.3 0.4 0.0 0.1 0.2 R L-S-R
N-DUR Norway, Durasplit 0.1 0.5 2.9 R L-S-RP1 Portugal. Silicified limestone 0.1 0.1 0.3 NON-R NON-RS1 Sweden. Gravel w. porphyritic rhyolite 0.2 0.3 1.4 R L-S-R
UK1 UK. Greywacke 0.3 0.5 3.5 0.1 0.3 0.4 0.0 0.0 0.3 R L-S-RUK2-2 UK. Gravel w. Quartzite + chert 0.1 0.4 2.9 R L-S-R
*Estimated values. **R: Reactive. NON-R: (Non-Reactive) <0.4‰ after 20 weeks, L-S-R: (Late Slow Reactive) <1.0‰ after 20 weeks and >1.0‰ after 52 weeks, F-H-R: (Fast Highly Reactive) >1.0‰ after 20 weeks. ***Final results after only 40 weeks.
Copyright © PARTNER-project-GRD1-CT-2001-40103 All rights reserved
17
2 The Chatterji method – Chemical method for aggregate testing
2.1 Introduction This report describes how selected aggregates respond to the Chatterji method test – Chemical method for aggregate testing. The testing is part of a series of evaluations of the alkali reactivity of aggregates, carried out under Work Package 3 in the PARTNER programme
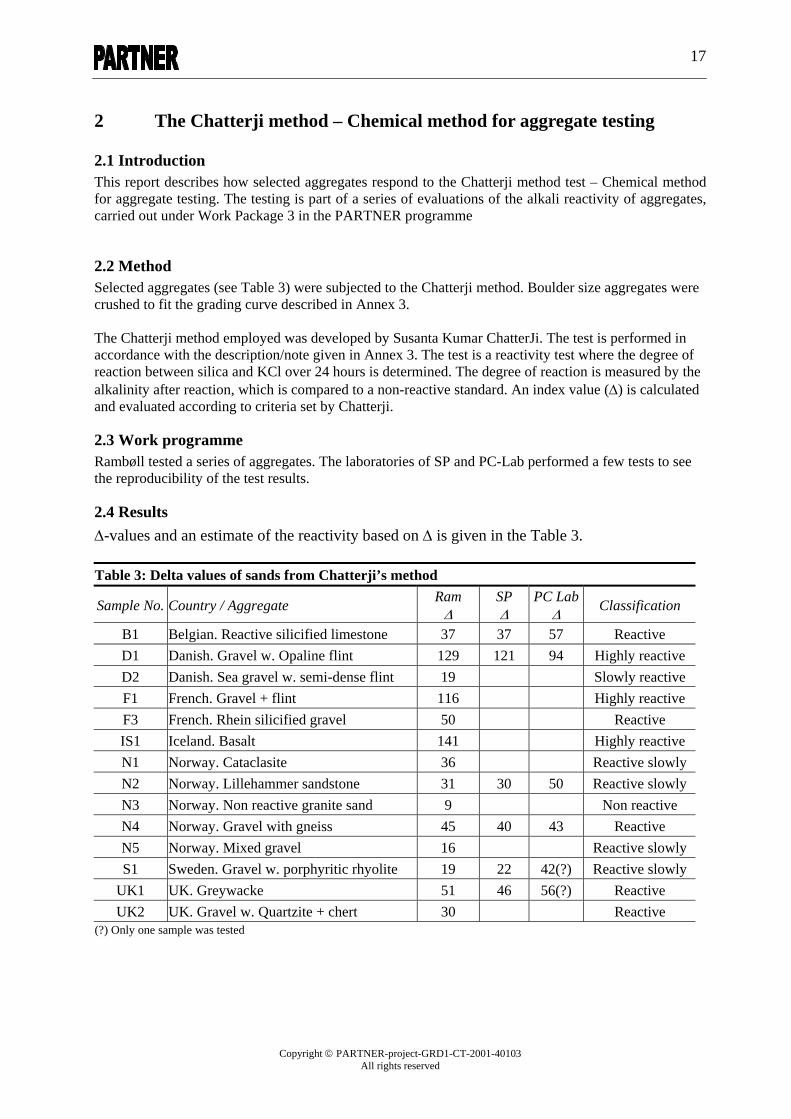
2.2 Method Selected aggregates (see Table 3) were subjected to the Chatterji method. Boulder size aggregates were crushed to fit the grading curve described in Annex 3. The Chatterji method employed was developed by Susanta Kumar ChatterJi. The test is performed in accordance with the description/note given in Annex 3. The test is a reactivity test where the degree of reaction between silica and KCl over 24 hours is determined. The degree of reaction is measured by the alkalinity after reaction, which is compared to a non-reactive standard. An index value (Δ) is calculated and evaluated according to criteria set by Chatterji.
2.3 Work programme Rambøll tested a series of aggregates. The laboratories of SP and PC-Lab performed a few tests to see the reproducibility of the test results.
2.4 Results Δ-values and an estimate of the reactivity based on Δ is given in the Table 3. Table 3: Delta values of sands from Chatterji’s method
Sample No. Country / Aggregate Ram Δ
SP Δ
PC Lab Δ Classification
B1 Belgian. Reactive silicified limestone 37 37 57 Reactive D1 Danish. Gravel w. Opaline flint 129 121 94 Highly reactive D2 Danish. Sea gravel w. semi-dense flint 19 Slowly reactive F1 French. Gravel + flint 116 Highly reactive F3 French. Rhein silicified gravel 50 Reactive IS1 Iceland. Basalt 141 Highly reactive N1 Norway. Cataclasite 36 Reactive slowly N2 Norway. Lillehammer sandstone 31 30 50 Reactive slowly N3 Norway. Non reactive granite sand 9 Non reactive N4 Norway. Gravel with gneiss 45 40 43 Reactive N5 Norway. Mixed gravel 16 Reactive slowly S1 Sweden. Gravel w. porphyritic rhyolite 19 22 42(?) Reactive slowly
UK1 UK. Greywacke 51 46 56(?) Reactive UK2 UK. Gravel w. Quartzite + chert 30 Reactive
(?) Only one sample was tested
Copyright © PARTNER-project-GRD1-CT-2001-40103 All rights reserved
18
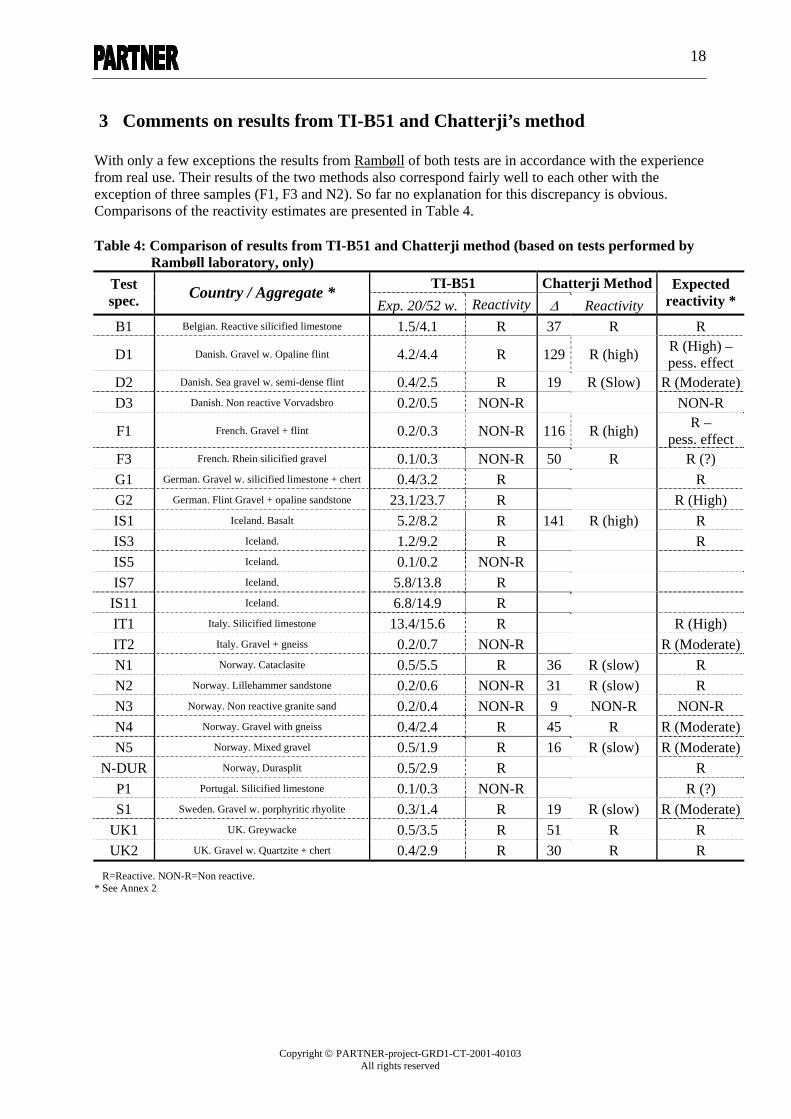
3 Comments on results from TI-B51 and Chatterji’s method With only a few exceptions the results from Rambøll of both tests are in accordance with the experience from real use. Their results of the two methods also correspond fairly well to each other with the exception of three samples (F1, F3 and N2). So far no explanation for this discrepancy is obvious. Comparisons of the reactivity estimates are presented in Table 4. Table 4: Comparison of results from TI-B51 and Chatterji method (based on tests performed by
Rambøll laboratory, only) TI-B51 Chatterji Method Test
spec. Country / Aggregate * Exp. 20/52 w. Reactivity Δ Reactivity
Expected reactivity *
B1 Belgian. Reactive silicified limestone 1.5/4.1 R 37 R R
D1 Danish. Gravel w. Opaline flint 4.2/4.4 R 129 R (high) R (High) – pess. effect
D2 Danish. Sea gravel w. semi-dense flint 0.4/2.5 R 19 R (Slow) R (Moderate)D3 Danish. Non reactive Vorvadsbro 0.2/0.5 NON-R NON-R
F1 French. Gravel + flint 0.2/0.3 NON-R 116 R (high) R – pess. effect
F3 French. Rhein silicified gravel 0.1/0.3 NON-R 50 R R (?) G1 German. Gravel w. silicified limestone + chert 0.4/3.2 R R G2 German. Flint Gravel + opaline sandstone 23.1/23.7 R R (High) IS1 Iceland. Basalt 5.2/8.2 R 141 R (high) R IS3 Iceland. 1.2/9.2 R R IS5 Iceland. 0.1/0.2 NON-R IS7 Iceland. 5.8/13.8 R
IS11 Iceland. 6.8/14.9 R IT1 Italy. Silicified limestone 13.4/15.6 R R (High) IT2 Italy. Gravel + gneiss 0.2/0.7 NON-R R (Moderate)N1 Norway. Cataclasite 0.5/5.5 R 36 R (slow) R N2 Norway. Lillehammer sandstone 0.2/0.6 NON-R 31 R (slow) R N3 Norway. Non reactive granite sand 0.2/0.4 NON-R 9 NON-R NON-R N4 Norway. Gravel with gneiss 0.4/2.4 R 45 R R (Moderate)N5 Norway. Mixed gravel 0.5/1.9 R 16 R (slow) R (Moderate)
N-DUR Norway, Durasplit 0.5/2.9 R R P1 Portugal. Silicified limestone 0.1/0.3 NON-R R (?) S1 Sweden. Gravel w. porphyritic rhyolite 0.3/1.4 R 19 R (slow) R (Moderate)
UK1 UK. Greywacke 0.5/3.5 R 51 R R UK2 UK. Gravel w. Quartzite + chert 0.4/2.9 R 30 R R
R=Reactive. NON-R=Non reactive. * See Annex 2
Annex 1 - page 1
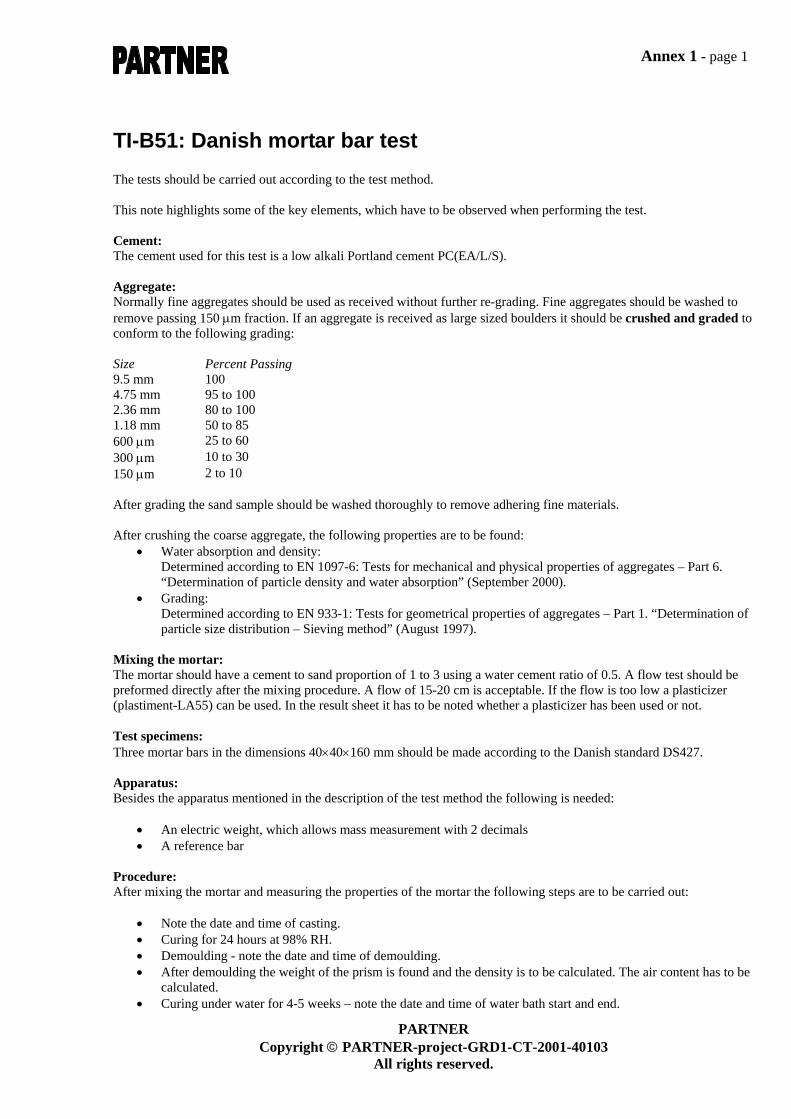
TI-B51: Danish mortar bar test The tests should be carried out according to the test method. This note highlights some of the key elements, which have to be observed when performing the test. Cement: The cement used for this test is a low alkali Portland cement PC(EA/L/S). Aggregate: Normally fine aggregates should be used as received without further re-grading. Fine aggregates should be washed to remove passing 150 µm fraction. If an aggregate is received as large sized boulders it should be crushed and graded to conform to the following grading: Size Percent Passing 9.5 mm 100 4.75 mm 95 to 100 2.36 mm 80 to 100 1.18 mm 50 to 85 600 µm 25 to 60 300 µm 10 to 30 150 µm 2 to 10 After grading the sand sample should be washed thoroughly to remove adhering fine materials. After crushing the coarse aggregate, the following properties are to be found:
• Water absorption and density: Determined according to EN 1097-6: Tests for mechanical and physical properties of aggregates – Part 6. “Determination of particle density and water absorption” (September 2000).
• Grading: Determined according to EN 933-1: Tests for geometrical properties of aggregates – Part 1. “Determination of particle size distribution – Sieving method” (August 1997).
Mixing the mortar: The mortar should have a cement to sand proportion of 1 to 3 using a water cement ratio of 0.5. A flow test should be preformed directly after the mixing procedure. A flow of 15-20 cm is acceptable. If the flow is too low a plasticizer (plastiment-LA55) can be used. In the result sheet it has to be noted whether a plasticizer has been used or not. Test specimens: Three mortar bars in the dimensions 40×40×160 mm should be made according to the Danish standard DS427. Apparatus: Besides the apparatus mentioned in the description of the test method the following is needed:
• An electric weight, which allows mass measurement with 2 decimals • A reference bar
Procedure: After mixing the mortar and measuring the properties of the mortar the following steps are to be carried out:
• Note the date and time of casting. • Curing for 24 hours at 98% RH. • Demoulding - note the date and time of demoulding. • After demoulding the weight of the prism is found and the density is to be calculated. The air content has to be
calculated. • Curing under water for 4-5 weeks – note the date and time of water bath start and end.
PARTNER Copyright © PARTNER-project-GRD1-CT-2001-40103
All rights reserved.
Annex 1 - page 2
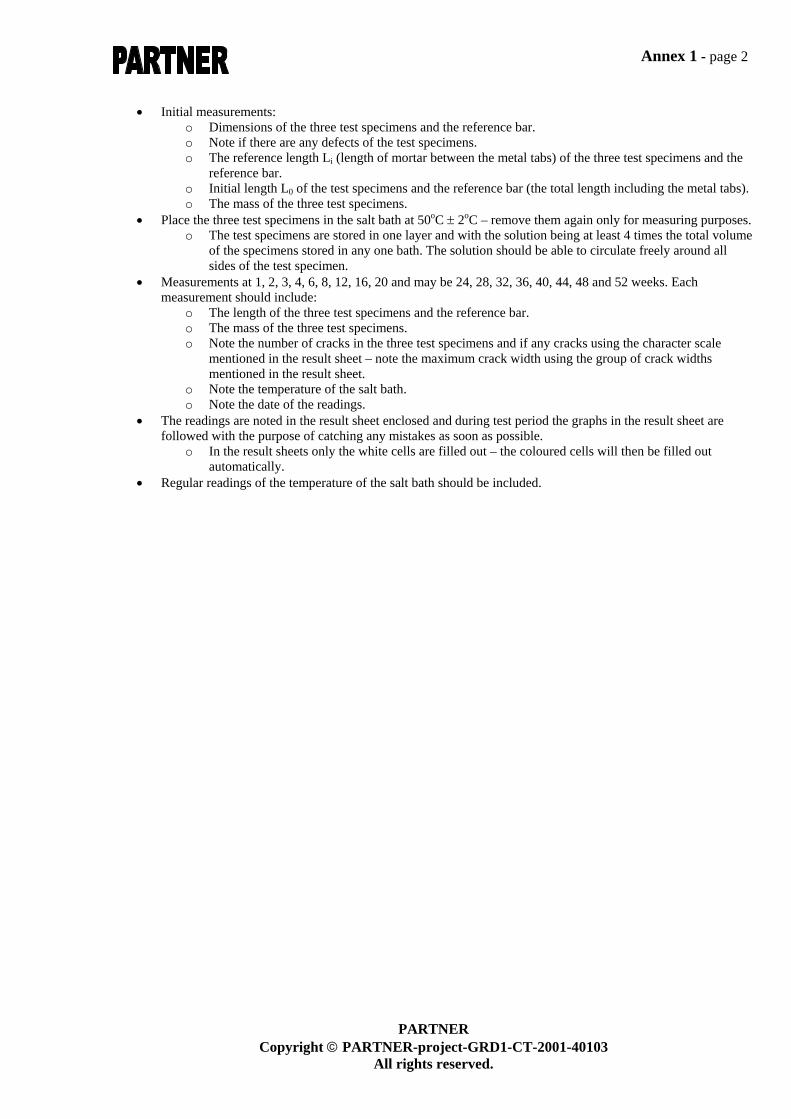
• Initial measurements: o Dimensions of the three test specimens and the reference bar. o Note if there are any defects of the test specimens. o The reference length Li (length of mortar between the metal tabs) of the three test specimens and the
reference bar. o Initial length L0 of the test specimens and the reference bar (the total length including the metal tabs). o The mass of the three test specimens.
• Place the three test specimens in the salt bath at 50oC ± 2oC – remove them again only for measuring purposes. o The test specimens are stored in one layer and with the solution being at least 4 times the total volume
of the specimens stored in any one bath. The solution should be able to circulate freely around all sides of the test specimen.
• Measurements at 1, 2, 3, 4, 6, 8, 12, 16, 20 and may be 24, 28, 32, 36, 40, 44, 48 and 52 weeks. Each measurement should include:
o The length of the three test specimens and the reference bar. o The mass of the three test specimens. o Note the number of cracks in the three test specimens and if any cracks using the character scale
mentioned in the result sheet – note the maximum crack width using the group of crack widths mentioned in the result sheet.
o Note the temperature of the salt bath. o Note the date of the readings.
• The readings are noted in the result sheet enclosed and during test period the graphs in the result sheet are followed with the purpose of catching any mistakes as soon as possible.
o In the result sheets only the white cells are filled out – the coloured cells will then be filled out automatically.
• Regular readings of the temperature of the salt bath should be included.
PARTNER Copyright © PARTNER-project-GRD1-CT-2001-40103
All rights reserved.
Annex 2 – page 1
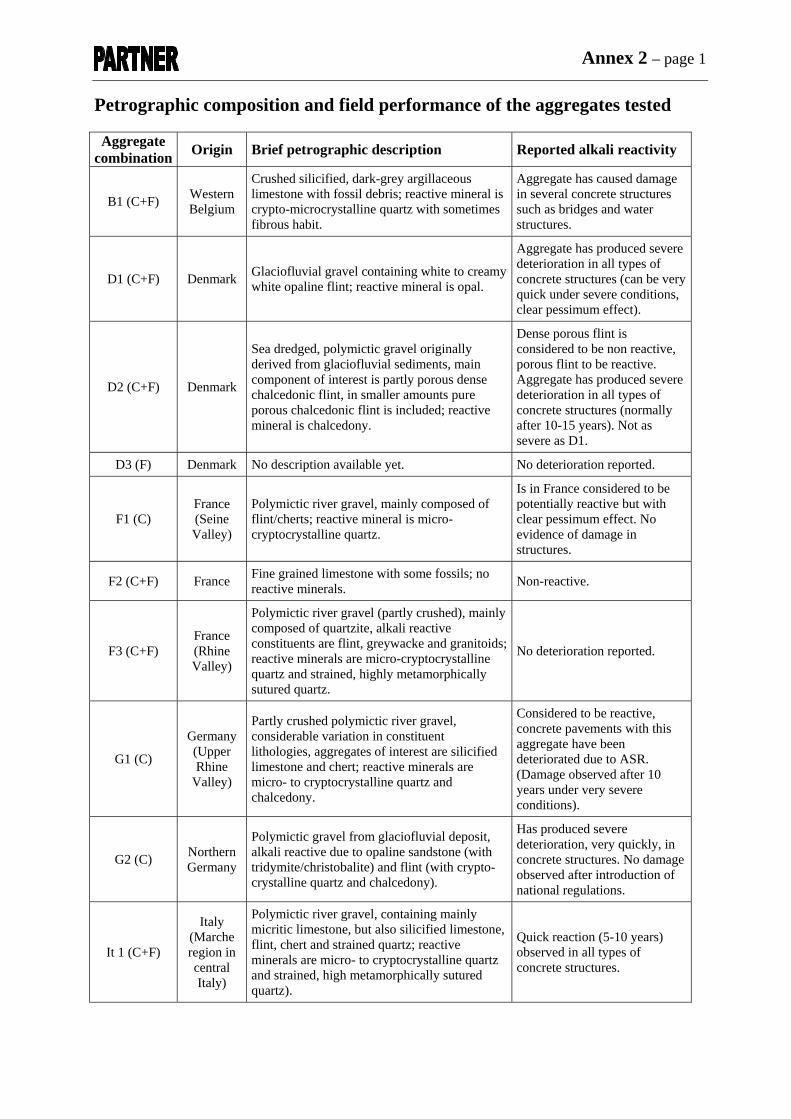
Petrographic composition and field performance of the aggregates tested Aggregate
combination Origin Brief petrographic description Reported alkali reactivity
B1 (C+F) Western Belgium
Crushed silicified, dark-grey argillaceous limestone with fossil debris; reactive mineral is crypto-microcrystalline quartz with sometimes fibrous habit.
Aggregate has caused damage in several concrete structures such as bridges and water structures.
D1 (C+F) Denmark Glaciofluvial gravel containing white to creamy white opaline flint; reactive mineral is opal.
Aggregate has produced severe deterioration in all types of concrete structures (can be very quick under severe conditions, clear pessimum effect).
D2 (C+F) Denmark
Sea dredged, polymictic gravel originally derived from glaciofluvial sediments, main component of interest is partly porous dense chalcedonic flint, in smaller amounts pure porous chalcedonic flint is included; reactive mineral is chalcedony.
Dense porous flint is considered to be non reactive, porous flint to be reactive. Aggregate has produced severe deterioration in all types of concrete structures (normally after 10-15 years). Not as severe as D1.
D3 (F) Denmark No description available yet. No deterioration reported.
F1 (C) France (Seine Valley)
Polymictic river gravel, mainly composed of flint/cherts; reactive mineral is micro-cryptocrystalline quartz.
Is in France considered to be potentially reactive but with clear pessimum effect. No evidence of damage in structures.
F2 (C+F) France Fine grained limestone with some fossils; no reactive minerals. Non-reactive.
F3 (C+F) France (Rhine Valley)
Polymictic river gravel (partly crushed), mainly composed of quartzite, alkali reactive constituents are flint, greywacke and granitoids; reactive minerals are micro-cryptocrystalline quartz and strained, highly metamorphically sutured quartz.
No deterioration reported.
G1 (C)
Germany (Upper Rhine
Valley)
Partly crushed polymictic river gravel, considerable variation in constituent lithologies, aggregates of interest are silicified limestone and chert; reactive minerals are micro- to cryptocrystalline quartz and chalcedony.
Considered to be reactive, concrete pavements with this aggregate have been deteriorated due to ASR. (Damage observed after 10 years under very severe conditions).
G2 (C) Northern Germany
Polymictic gravel from glaciofluvial deposit, alkali reactive due to opaline sandstone (with tridymite/christobalite) and flint (with crypto-crystalline quartz and chalcedony).
Has produced severe deterioration, very quickly, in concrete structures. No damage observed after introduction of national regulations.
It 1 (C+F)
Italy (Marche region in central Italy)
Polymictic river gravel, containing mainly micritic limestone, but also silicified limestone, flint, chert and strained quartz; reactive minerals are micro- to cryptocrystalline quartz and strained, high metamorphically sutured quartz).
Quick reaction (5-10 years) observed in all types of concrete structures.
Annex 2 – page 2
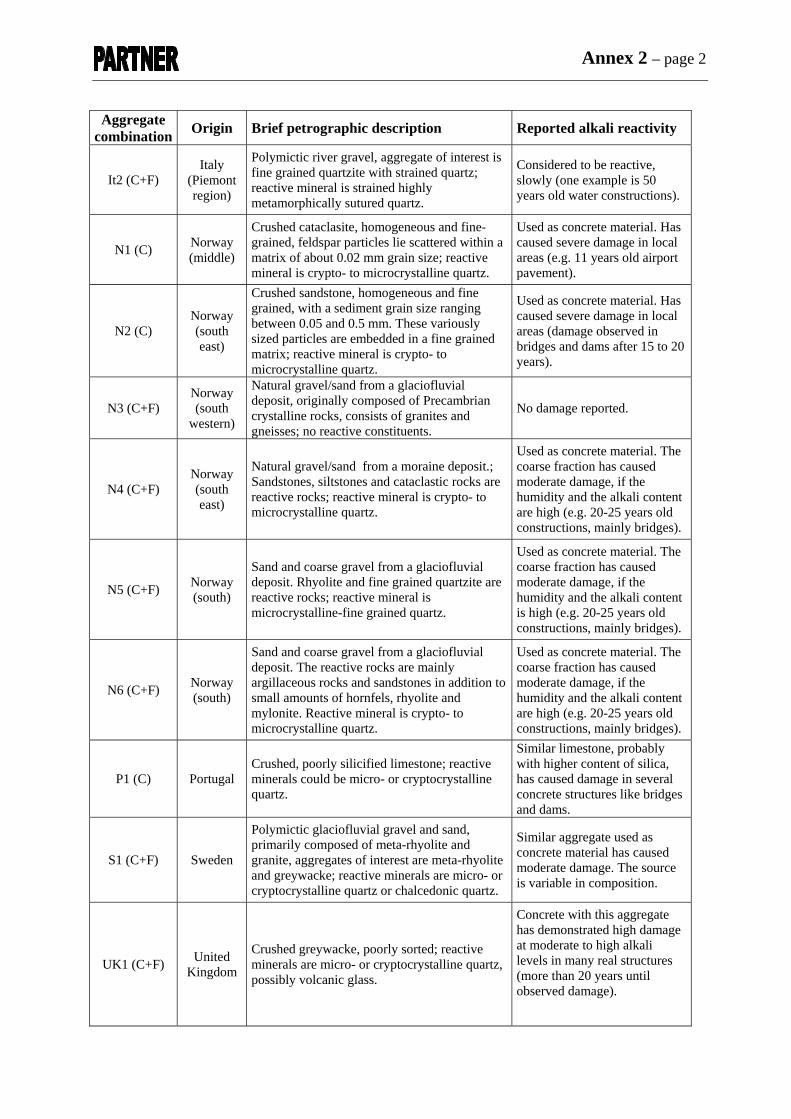
Aggregate
combination Origin Brief petrographic description Reported alkali reactivity
It2 (C+F) Italy
(Piemont region)
Polymictic river gravel, aggregate of interest is fine grained quartzite with strained quartz; reactive mineral is strained highly metamorphically sutured quartz.
Considered to be reactive, slowly (one example is 50 years old water constructions).
N1 (C) Norway (middle)
Crushed cataclasite, homogeneous and fine-grained, feldspar particles lie scattered within a matrix of about 0.02 mm grain size; reactive mineral is crypto- to microcrystalline quartz.
Used as concrete material. Has caused severe damage in local areas (e.g. 11 years old airport pavement).
N2 (C) Norway (south east)
Crushed sandstone, homogeneous and fine grained, with a sediment grain size ranging between 0.05 and 0.5 mm. These variously sized particles are embedded in a fine grained matrix; reactive mineral is crypto- to microcrystalline quartz.
Used as concrete material. Has caused severe damage in local areas (damage observed in bridges and dams after 15 to 20 years).
N3 (C+F) Norway (south
western)
Natural gravel/sand from a glaciofluvial deposit, originally composed of Precambrian crystalline rocks, consists of granites and gneisses; no reactive constituents.
No damage reported.
N4 (C+F) Norway (south east)
Natural gravel/sand from a moraine deposit.; Sandstones, siltstones and cataclastic rocks are reactive rocks; reactive mineral is crypto- to microcrystalline quartz.
Used as concrete material. The coarse fraction has caused moderate damage, if the humidity and the alkali content are high (e.g. 20-25 years old constructions, mainly bridges).
N5 (C+F) Norway (south)
Sand and coarse gravel from a glaciofluvial deposit. Rhyolite and fine grained quartzite are reactive rocks; reactive mineral is microcrystalline-fine grained quartz.
Used as concrete material. The coarse fraction has caused moderate damage, if the humidity and the alkali content is high (e.g. 20-25 years old constructions, mainly bridges).
N6 (C+F) Norway (south)
Sand and coarse gravel from a glaciofluvial deposit. The reactive rocks are mainly argillaceous rocks and sandstones in addition to small amounts of hornfels, rhyolite and mylonite. Reactive mineral is crypto- to microcrystalline quartz.
Used as concrete material. The coarse fraction has caused moderate damage, if the humidity and the alkali content are high (e.g. 20-25 years old constructions, mainly bridges).
P1 (C) Portugal Crushed, poorly silicified limestone; reactive minerals could be micro- or cryptocrystalline quartz.
Similar limestone, probably with higher content of silica, has caused damage in several concrete structures like bridges and dams.
S1 (C+F) Sweden
Polymictic glaciofluvial gravel and sand, primarily composed of meta-rhyolite and granite, aggregates of interest are meta-rhyolite and greywacke; reactive minerals are micro- or cryptocrystalline quartz or chalcedonic quartz.
Similar aggregate used as concrete material has caused moderate damage. The source is variable in composition.
UK1 (C+F) United Kingdom
Crushed greywacke, poorly sorted; reactive minerals are micro- or cryptocrystalline quartz, possibly volcanic glass.
Concrete with this aggregate has demonstrated high damage at moderate to high alkali levels in many real structures (more than 20 years until observed damage).
Annex 2 – page 3
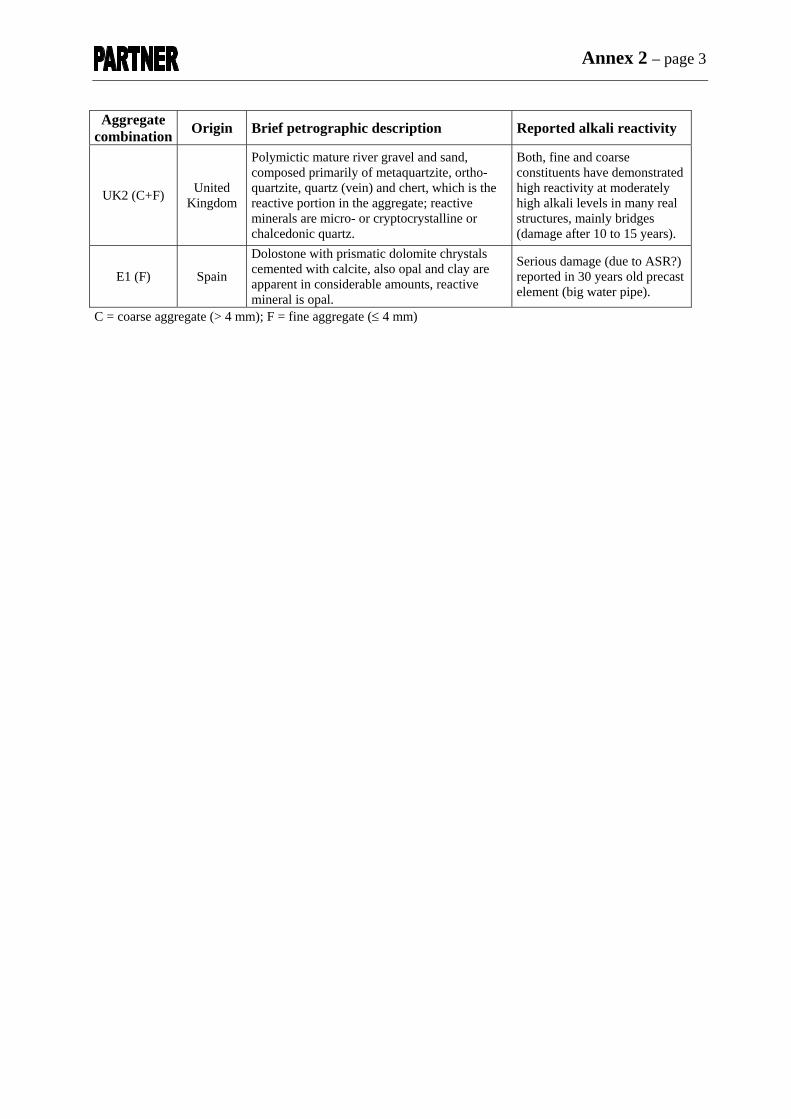
Aggregate
combination Origin Brief petrographic description Reported alkali reactivity
UK2 (C+F) United Kingdom
Polymictic mature river gravel and sand, composed primarily of metaquartzite, ortho-quartzite, quartz (vein) and chert, which is the reactive portion in the aggregate; reactive minerals are micro- or cryptocrystalline or chalcedonic quartz.
Both, fine and coarse constituents have demonstrated high reactivity at moderately high alkali levels in many real structures, mainly bridges (damage after 10 to 15 years).
E1 (F) Spain
Dolostone with prismatic dolomite chrystals cemented with calcite, also opal and clay are apparent in considerable amounts, reactive mineral is opal.
Serious damage (due to ASR?) reported in 30 years old precast element (big water pipe).
C = coarse aggregate (> 4 mm); F = fine aggregate (≤ 4 mm)
Annex 3 - page 1
Chatterji – chemical method for aggregate testing: The tests should be carried out as described below. This note highlights some of the key elements, which have to be observed when performing the test. Aggregate: Normally fine aggregates should be used as received without further re-grading. Fine aggregates should be washed to remove passing 125 µm fraction. If an aggregate is received as large sized boulders it should be crushed and graded to conform to the following grading: Size Percent Passing 4 mm 95 to 100 2 mm 80 to 100 1 mm 50 to 85 500 µm 25 to 60 250 µm 10 to 30 125 µm 2 to 10 After grading the sand sample should be washed thoroughly to remove adhering fine materials. Preparation of test samples: Bulk aggregate samples should be dried at 105o C to constant weight. After drying, the samples should be homogenized either by prolonged mixing or by passing through a sample divider a few times. Homogenized samples should then be reduced to about 250g samples by using a sample divider or by mixing and quartering. The reduced samples should be used to weigh out test samples. Apparatus and materials: The following apparatus are needed:
• KCl • CaO • 0.025 N HCl • An electric weighing machine, which allows mass measurement with two decimals • Three conical flasks, which could be stoppered by a rubber plug. Each of these rubber plugs should have a
pressure release valve. • Air oven • Thermometer • A semi-micro burette
Procedure: 1. Prepare a large stock solution of saturated solution of KCl in distilled water (add approximately 40 g of KCl is
added for each 100 g of water at about 500C).
2. Store the saturated solution of KCl for at least two days at 20oC ± 2oC before use. Filter the solution to remove excess KCl. The room temperature should not vary widely from day to day.
3. Prepare two dry samples of the aggregate to be tested and one sample of a non-reactive quartz sand (reference sample) of 100.0 g ± 0.2 g. Note the exact weights of each of the samples.
4. Place the two test samples and the reference sample in an air oven maintained at 70oC ± 2oC. Note the time for storing the samples.
5. Take out three conical flasks with rubber plugs with pressure release valves and labelled 1, 2 and ref. for the two test samples respectively for the reference sample.
6. Weigh out the saturated KCl solution such that solution/sand-ratio is 2 (e.g. for 100.0g of sand use 200.0g of KCl). Note the exact weight of each lot of KCl.
PARTNER Copyright © PARTNER-project-GRD1-CT-2001-40103
All rights reserved.
Annex 3 - page 2
7. Weigh out three lots of 3.5g CaO. Note the exact weight of each lot of CaO. Add one lot of CaO in each of the conical flasks containing saturated KCl solution and stopper them. Ca(OH)2 should not be used. Surface carbonation of Ca(OH)2 hinders the formation of a saturated Ca(OH)2 solution for a long time.
8. Store all three conical flasks in the air oven maintained at 70oC for 16 hours. Note the start time of storing and the end time of storing.
9. Add the heated aggregate samples to the corresponding conical flasks and stopper them.
10. Swirl the flasks carefully, but thoroughly.
11. Place the three samples in the oven at 70oC ± 2oC for 24 hours. Note the start time of storing and the end time of storing. For the first 8 hours, re-suspend the samples every 2 hours and release pressure using the valve in the rubber plug.
12. Cool the suspensions in a water bath maintained at 20oC ± 2oC for at least 3 hours. Note the start time for cooling and the end time of cooling. During the cooling period re-suspend the mix every 20 minutes – this will ensure re-saturation of the solution with Ca(OH)2 at 20oC. At this time also break the vacuum by opening the pressure release valve.
13. Filter the suspension through 0.4 or 0.45µm size membrane filters under suction (fx. filter Minisart from Sartorius). Avoid carbonation after the solutions have been filtered (start the titration immediately after filtering). To ensure the repeatibility of the titration repeat the titration once for every suspension.
14. Take out approximately 10 mL of the filtrates - measure the exact volume of the filtrates.
15. Determine the OH concentration of each of the three filtrates acidimetrically using 0.025 HCl and phenolphthalein as the indicator: Add few drops of phenolphthalein to the filtrates. Note the start volume of the 0.025 N HCl. Note the end volume of the 0.025 N HCl. A titration is considered complete when the filtrate solution remains colourless for 30 seconds or more.
16. Calculate the concentration of OH- in the three solutions [mg/L].
17. For each of the two test samples, calculate the difference (∆) between OH--concentration of the test sample and OH--concentration of the reference sample.
18. Longer digestion at 70 oC, after 24 hours, followed by filtration and titration of the filtrate may give further information about the aggregate.
19. It is not necessary to include the reference sand with each lot of new aggregate. However, one lot of reference sand should be included in each day of testing.
Calculation:
Suppose “A” ml of the filtrate (from step 13) requires “B” ml of 0.025 N HCl for complete neutralization. Then the OH ion concentration (C) of the filtrate in mg/L is given as:
C =B*425/A (mg/L)
and
∆ = Crefereence - Ctest
PARTNER Copyright © PARTNER-project-GRD1-CT-2001-40103
All rights reserved.