Embed Size (px)
Citation preview
annualreport 2011
Contents Financial highlights ..................................................................................................................................1
Group structure...............................................................................................................................................2
Directorate and administration .....................................................................................................3
Chairman’s review ........................................................................................................................................4
Corporate governance .............................................................................................................................7
Review of financials ..................................................................................................................................9
Ratios and statistics ..............................................................................................................................10
Report of the directors........................................................................................................................11
Statement of directors’ responsibility ...............................................................................12
Report of the independent auditors ....................................................................................13
Consolidated financial statements ........................................................................................14
Notes to the consolidated financial statements ..................................................18
Company Statement of Financial Position ....................................................................47
Shareholders’ analysis .........................................................................................................................48
Shareholders’ diary .................................................................................................................................49
Notice of annual general meeting .........................................................................................49
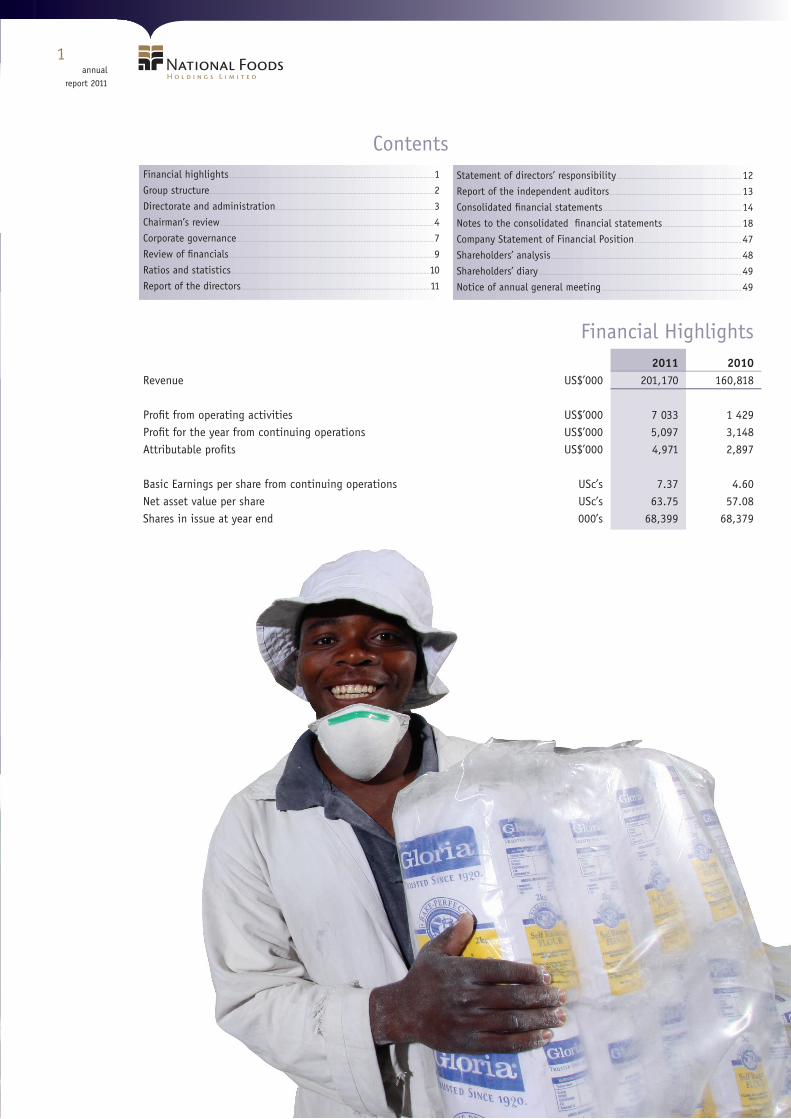
Financial Highlights 2011 2010Revenue US$’000 201,170 160,818 Profit from operating activities US$’000 7 033 1 429 Profit for the year from continuing operations US$’000 5,097 3,148 Attributable profits US$’000 4,971 2,897
Basic Earnings per share from continuing operations USc’s 7.37 4.60 Net asset value per share USc’s 63.75 57.08 Shares in issue at year end 000’s 68,399 68,379
annualreport 2011
Group Structure
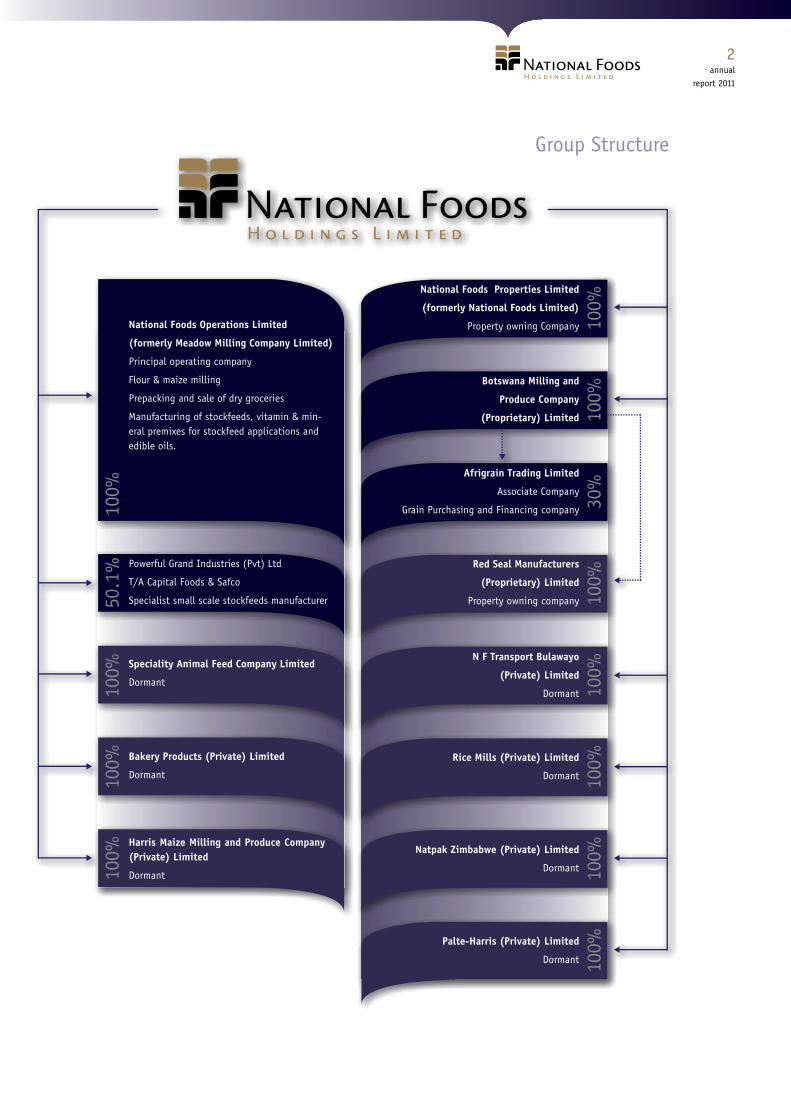
National Foods Operations Limited
(formerly Meadow Milling Company Limited)
Principal operating company
Flour & maize milling
Prepacking and sale of dry groceries
Manufacturing of stockfeeds, vitamin & min-eral premixes for stockfeed applications and edible oils.
Powerful Grand Industries (Pvt) Ltd
T/A Capital Foods & Safco
Specialist small scale stockfeeds manufacturer
Red Seal Manufacturers
(Proprietary) Limited
Property owning company
N F Transport Bulawayo
(Private) Limited
Dormant
Rice Mills (Private) Limited
Dormant
Natpak Zimbabwe (Private) Limited
Dormant
Palte-Harris (Private) Limited
Dormant
National Foods Properties Limited
(formerly National Foods Limited)
Property owning Company
Botswana Milling and
Produce Company
(Proprietary) Limited
Afrigrain Trading Limited
Associate Company
Grain Purchasing and Financing company
Speciality Animal Feed Company Limited
Dormant
Bakery Products (Private) Limited
Dormant
Harris Maize Milling and Produce Company (Private) Limited
Dormant
annualreport 2011
National Foods Holdings Limited
BOARD OF DIRECTORS
Chairman T. MoyoManaging Director J.J. Brooke* M.J. Conway T.W. Brown* Executive Director L.T. Murimwa* J.P. Schonken N. Segoale AUDIT COMMITTEE
Chairman T.W. Brown M. Conway T. Moyo
REMUNERATION COMMITTEE
Chairman T.W. Brown M. Conway
SECRETARY
A.D. Lorimer
TRANSFER SECRETARIES
First Transfer Secretaries (Private) Limited P.O. Box 11, Harare, Zimbabwe
REGISTERED OFFICE
Gloria House 10 Stirling Road, Workington P.O. Box 269, Harare. PRINCIPAL BANKERS
CBZ Limited AUDITORS
Ernst & Young Angwa City Cnr K. Nkrumah Avenue/ J.Nyerere Way P.O. Box 62, Harare, Zimbabwe LEGAL
Dube, Manikai & Hwacha Gula Ndebele & Partners
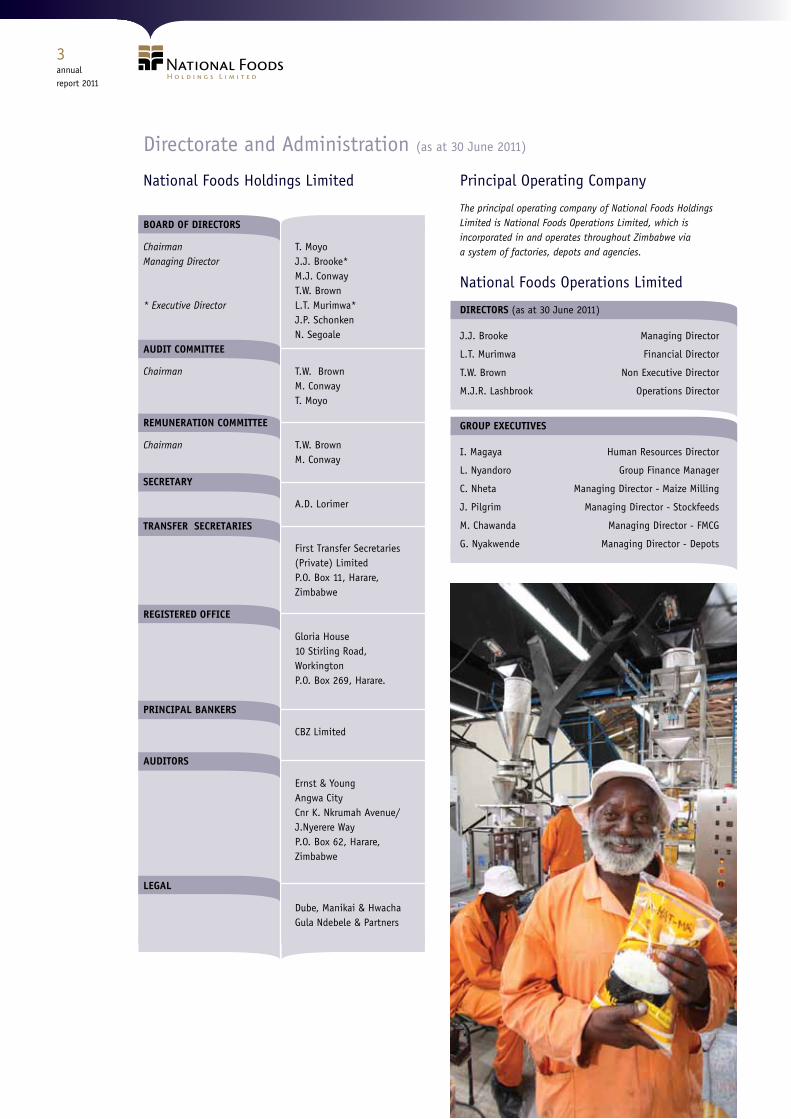
Principal Operating Company
The principal operating company of National Foods Holdings Limited is National Foods Operations Limited, which is incorporated in and operates throughout Zimbabwe viaa system of factories, depots and agencies.
National Foods Operations Limited
DIRECTORS (as at 30 June 2011)
J.J. Brooke Managing Director
L.T. Murimwa Financial Director
T.W. Brown Non Executive Director
M.J.R. Lashbrook Operations Director
GROUP EXECUTIVES
I. Magaya Human Resources Director
L. Nyandoro Group Finance Manager
C. Nheta Managing Director - Maize Milling
J. Pilgrim Managing Director - Stockfeeds
M. Chawanda Managing Director - FMCG
G. Nyakwende Managing Director - Depots
Directorate and Administration (as at 30 June 2011)
annualreport 2011
Chairman’s StatementIntroduction
The stable political and economic environment has enabled the Group to continue its strategy of streamlining and right sizing its operations whilst striving to match regional performance benchmarks.
Key economic indicators, such as beverage and fuel sales, suggest a steady uplift in general economic activity which is supported by increases in bank deposits and GDP growth that may well have been more than 20% year on year. The Group is well positioned to enjoy its share of Zimbabwe’s growth if we can achieve increased capacity utilization and access more locally grown raw materials.
Government’s decision to introduce a nominal duty on imported maize meal in July will no doubt increase maize milling volumes without any need for a retail price increase. A similar duty on flour, rice and salt will impact positively on those categories. We support Government’s strategy to boost throughput of local manufacturers to stem the flow of factory closures and staff reductions.
The continued economic stability is positively affecting local investor confidence which will encourage commitment to further investment into more long term plants and facilities. This in turn will encourage local crop production which is essential if we are to feed ourselves as a nation.
At year end the Group is operating four factories whilst nine remain mothballed. We cannot overestimate the importance of the resuscitation of local agricultural production on the back of a resolution on land title deeds.
Overview of Financial Performance
Our results for the full year ending 30 June 2011 reflect the delicate balance of retaining turnover in a fiercely competitive retail arena and protecting a slim operating margin whilst simultaneously retooling, recapitalizing, retrenching excess staff and re-engineering systems and processes. Most year on year performance indicators show positive movement, with the exception of the gross profit percentage which was intentionally sacrificed in order to maintain valuable market share.
Volumes sold at 351,533mt were 17% above the prior year. This translated to turnover of $203m which is an increase of 23% over the comparative period. The average selling price per ton increased from $553 to $579 on the back of higher world grain and bean prices. Gross profit increased by 19% to $46,8m but the GP% reduced to 23.0% from 23.7% achieved in the prior year. Total “all-in” operating costs per tonne reduced to $116 from $141 in the corresponding prior period. The Group recorded a profit for the year of $5,1m from continuing operations.
We generated $6,5m cash more than the previous year whilst the balance sheet grew by 12% to $43,6m with net debt of $1,1m representing an acceptable 3% gearing ratio. Weighted average cost of debt at year end was 10% which precludes any meaningful debt funded capital expenditure but is an acceptable cost to fund our working capital needs. The Group has adequate funding to support its short and medium term strategies.
The Group spent approximately $2,6m on repairs and maintenance programmes which is 144% of the depreciation charge, compared to 248% in the corresponding prior period.
Regrettably, the low capacity utilization has a direct impact on staffing levels required. Consequently we spent $1,7m to fund the voluntary retrenchment of another 259 staff during the year. It is hoped the retrenchment programme will soon be completed.
Operations
The Group spent $2,2m of capital expenditure predominantly in the Maize and Depots businesses. A new rice packing plant was constructed in Mutare at an existing National Foods facility at a cost of $636,000 and was commisioned in early August. Considerable resource was allocated to consolidating operations into fewer sites with enhanced security measures to improve internal controls.
In June the Transport division was disposed to members of the management of that division and a service level agreement concluded with the new owners to provide 15,000mt of transportation monthly. The disposal is in keeping with our strategic intent to focus on Milling, Stockfeeds, FMCG categories and a strong distribution platform to support the businesses.
Pursuant to this, greater resource has been allocated to our route to market architecture to improve efficiencies and capitalize on our Brands and Scale which are material competitive advantages.
annualreport 2011
Chairman’s Statement (continued)
Flour Milling
Flour sales at 92,288mt for the year were flat on the comparative period however the gross profit margin fell from 21% to 18% in the last quarter as we endeavoured to hold volumes at our single flour mill that remains open. We have sufficient stocks of the correct wheats to produce a high quality flour but remain pressurized to compete against cheap Baltic and Mozambican duty free imports.
The introduction of a nominal import duty would see an immediate increase in volumes, without any selling price increase and the immediate re-opening of the Bulawayo flour mill. We continue to invest in improving our facilities with a focus on line automation and the provision of bulk distribution services to plant bakers. $413,000 was spent on capital improvements during this year. The Gloria brand remains the market leader in the prepacked category whilst Red Seal occupies the second position.
Maize Milling
Initiatives to improve quality, packaging and pricing during the year paid off as volumes grew by 52% from 65,603mt to 99,421mt over the prior year. Capacity utilization of the Harare and Bulawayo mills is at 25% of installed capacity. The mills in Gweru, Mutare and Masvingo remain closed under care and maintenance. We have ample capacity and sufficient raw materials to fulfill the entire nation’s maize meal requirements into the foreseeable future.
Red Seal is the entrenched market leader in the roller meal category whilst Pearlenta is now the second choice refined product in its category. Considerable investment will be made to support the Pearlenta brand in the near future. $600,000 is earmarked to improve the maize packing lines before Christmas. Management continues to effectively provide a correctly priced, high quality product on the shelf nationwide.
Stockfeeds
The Stockfeeds business continued to grow which necessitated a third shift at the Harare plant. Volume increase over prior year was 31% from 97,767mt to 127,885mt justifying management’s strategy to price competitively and distribute widely in order to assist in the rehabilitation of the nation’s livestock levels.
Our technical relationship with In Vivo of France through Coprex of South Africa continues to provide innovations in formulations and processes which result in a better feed. The Stockfeeds team committed significant resource to the hosting of training clinics for the New Farmer, particularly in animal husbandry and technical training. The new specialist beef and dairy feed plant at Harare will be commissioned in September/October providing an additional 6,000mt per month of feed. The third pelleter was installed in June to support expected growth in the poultry sector.
Our investment into Capital Foods was profitable in the first year of operation. We expect this business to continue its growth pattern. By embracing the needs of both large and small farmers, and having a full range of correctly priced stocks at 36 locations countrywide, this product is the market leader. Management will implement bulk distribution solutions and greater line automation in the next year whilst maintaining a strategy to grow volumes.
FMCG
Sale volumes grew year on year predominantly through the introduction of sugar packed into the Red Seal Brand. Like for like volumes were however up only 9% to 48,061mt due to significant competition in the rice category. In keeping with Group strategy, prices were adjusted and market share regained towards the year end. The Mahatma brand enjoys premium positioning, however, our lower quality rice brands are under intense pressure to contribute to the Group’s earnings.
Salt grew in volume and held margin as Red Seal remained as category leader. Fattis and Moni’s pasta, along with Perfecto noodles further consolidated their top spot in this category. Koo baked beans remains the market leader despite the porosity of the border. We discontinued the Mazappy snack line, kapenta and biscuits as they were not contributing sufficiently. The spreads category consists of Red Seal, Mama Africa and Black Cat peanut butters; Red Seal and Hugo’s jam and some Koo jams. Its performance was lukewarm and requires strategizing into the future. Management has been tasked with re-engineering the FMCG business in the forthcoming year to enhance profitability.
Depot Network
Sales volumes increased by 93% to 91,273mt when compared with the prior period thereby contributing 26% of total Group revenue. It is our belief that there is greater growth potential in the rural communities compared to the urban centres. Consequently we will offer a greater range of products and services to our depot customers in order to attract and retain new customers.
Your Board has approved a further $800,000 of immediate expenditure on the IT platform to ensure all 22 depots are “on-line” to the main system. This will improve stock management, the ability to position sufficient cash in the depots to purchase grains and facilitate the enormous benefit of supplying account holding customers directly out of the nearest depot to them. At present 15 out of 22 depots have reliable connectivity to the IT platform. Management’s efforts to improve controls and service levels have impacted positively on this unit’s contribution to Group strategy and cash generation.
annualreport 2011
Properties
Five properties were disposed of by the year end leaving net lettable area of 105,003m² of which 60,072m² was let to National Foods, 42,368m² to 3rd parties and 2,563m² remains unoccupied. $31,000 was spent on essential repairs to the portfolio. The Group’s balance sheet is overly weighted with property assets that are not producing sufficient returns, particularly given the introduction of the punitive property rates tariffs. Management will continue to dispose of non-core properties whilst creating a broader long term strategy for the overall portfolio in order to provide a better return on equity. Portfolio wide the average rental was $1.14 m² by the year end.
Future Prospects
In July the Group adopted an activity based measurement system underpinned by an integrated sales and operations planning module driven by market demand. Our focus will therefore be largely on extracting efficiencies and savings from procurement, logistics and line-automation whilst maintaining or growing turnover and volumes.
Improvements should arise out of greater use of the IT systems, better demand planning and supply chain initiatives. The improvements will produce cost savings which allow us to better compete in the market and be more profitable.
Further investment will be made into the Group’s brands in an effort to improve gross margins through premium pricing where the market allows it.
Needless to say the success of our strategy is dependent upon ongoing political and economic stability and a concerted effort to grow more crops locally. During the year we spent $128 million importing food products which should ideally be paid to local producers thereby strengthening the economy.
Dividend
The Board has declared a second half dividend of 0.85c payable on or about 7 October 2011 to shareholders registered in the books of the company by noon 23 September 2011. The transfer books and register of members will be closed from 24 September 2011 to 2 October 2011, both dates inclusive. Together with the interim dividend of 0.7c this final dividend brings the total dividend for the year to 1.55c per share.
Acknowledgement and Appreciation
I would like to express thanks to my Board colleagues for their support and commitment. In particular I wish to thank Mike Conway, who resigned from the Board on 23 August 2011 for his guidance during much of the transition. I welcome Mr Neil Brimacombe of Tiger Brands to the Board from 23 August 2011.
My thanks also to the management and staff for their efforts and commitment which is evidenced by National Foods being the market brand leader in 8 out of the 11 categories we compete in.
I wish the management well in their strategies which I am confident will steadily improve returns to shareholders and stakeholders alike.
Todd MoyoChairman
12 October 2011
Chairman’s Statement (continued)
annualreport 2011
Corporate GovernanceNational Foods Holdings Group subscribes to the principles of discipline, independence, accountability, transparency, responsibilty, integrity, fairness and social responsibility, identified as the primary characteristics of good governance in the Code of Corporate Practices and Conduct, contained within the King III Report on Corporate Governance and the Combined Code on Corporate Governance.
The primary objective of any system of corporate governance is to ensure that directors and managers, to whom the running of large corporations has been entrusted by the shareholders, carry out their responsibilities faithfully and effectively, placing the interests of the corporation and society ahead of their own. This process is facilitated through the establishment of appropriate reporting and control structures within the organisation. The Board believes that the Group’s governance practices are strong and that in all material respects, the Group conforms to the principles embodied within the King III Report and Combined Code on Corporate Governance and is committed to ensuring that these principles continue to be an integral part of the way in which the group’s business is conducted.
Directorate and Executive Management
The Boards of Directors of the Holding Company and of the Principal Operating Company retain full and effective control over the Group. The Boards meet regularly, no less than four times a year to review strategy, planning, operational performance, acquisitions and disposals, stakeholder communications and other material matters relating to performance of executive management.
The majority of Directors of the Holding Company are non-executive bringing objective judgement to bear on issues of strategy and performance.The Group Chairman is a non-executive Director.
Managerial levels of authority have been established for capital expenditure projects and the acquisition and disposal of assets. However, decisions of a material nature are taken by the Board of Directors and senior management, who constitute key management and whose remuneration is disclosed in Note 19.8. The directors have access to the advice and services of the company secretary who is responsible to the Board for ensuring compliance with procedures and regulations. Directors are entitled to seek independent professional advice about the affairs of the Group, at the company’s expense, if they believe that course of action would be in the best interest of the Group.
Financial Statements
The Directors of the National Foods Holdings Group are responsible for preparing financial statements and other information presented in the annual report in a manner that fairly presents the state of affairs and results of the operations of the company and the Group. The external auditors are responsible for carrying out an independent examination of the financial statements in accordance with International Auditing Standards and reporting their findings thereon. The annual financial statements contained in this report have been prepared in accordance with International Financial Reporting Standards. They are based on appropriate accounting policies and are supported by reasonable and prudent judgements and estimates. The directors have no reason to believe that the Group’s operations will not continue as a going concern in the year ahead.
Audit Committee
The company has an audit committee comprising representation by non-executive directors and is chaired by a non-executive director. The Committee comprises T. Brown (Chairman), M. Conway and T. Moyo. Mr N. Brimacombe takes over from Mr M. Conway from 23 August 2011. The external auditors have unrestricted access to this committee. The audit committee reviews the effectiveness of internal controls in the Group with reference to the findings of both the internal and external auditors. Other areas covered include the review of important accounting issues, including specific disclosures in the financial statements and a review of the major audit recommendations.
Risk Management Committee
The directors are accountable for the process of risk management and for establishing appropriate risk and control policies and to ensure that these are communicated throughout the Group. Executive managers are responsible for the identification and evaluation of key risks applicable to their areas of business. The Group is in the process of establishing a risk management committee which will be responsible for overseeing and reporting on the overall group risk. This will provide an ongoing process for identifying, evaluating and managing the significant risks faced by the Group. This committee will report to the Board on all areas of risk that have been identified in the Group.
Internal Control
The Group maintains internal controls and systems designed to provide reasonable assurance as to the integrity and reliability of the financial statements and to adequately safeguard, verify and maintain accountability for its assets. Such controls are based on established policies and procedures and are implemented by trained personnel with an appropriate segregation of duties. The internal audit function operates under the direction of the Group Audit Committee, which approves the scope of the work to be performed. Significant findings are reported to both executive management and the audit committee. Corrective action is taken to address internal control deficiencies identified in the execution of the work. Nothing has come to the attention of the Directors, that indicates any material breakdown in the functioning of the key internal controls and systems during the period under review. The Group has comprehensive risk and loss control procedures in place, which form an integral part of a sophisticated third party and self-insurance programme.
annualreport 2011
Corporate Governance (continued)
Directors’ and Executive Remuneration
Remuneration committee
The remuneration committee has been delegated by the board with the responsibility of determining the remuneration of the executive directors and other senior management members, as well as approving all grants of share options under the National Foods Holdings Group Share Option Scheme. The chairman of the committee is obliged to report to the board on its deliberations. The committee is comprised of T Brown (Chairman) and M Conway. Mr N. Brimacombe takes over from Mr Conway from 23 August 2011.
Remuneration policy
The remuneration policy is formulated to attract, retain and motivate top quality people in the best interests of shareholders, and is based upon the following principles:
• Remuneration arrangements will be designed to support National Foods Holdings Group’s business strategy, vision and to conform to best practices.
• Total rewards will be set at levels that are competitive within the context of the relevant areas of responsibility and the industry in which the Group operates.
Composition of executive remuneration
The remuneration packages of executive directors comprise an annual salary, incentive bonus plan and participation in the National Foods Holdings Group Share Option Scheme.
Management Reporting
There are comprehensive management reporting disciplines in place which include the preparation of annual budgets by all operating units. Individual budgets are approved by the Principal Operating Company board of directors, while the Group budget is reviewed by the directors of the Holding Company. Monthly results and the financial status of operating units are reported against approved budgets and compared to the prior year. Profit projections and cash flow forecasts are updated half yearly, while working capital and borrowing levels are monitored on an ongoing basis.
Strategic Planning Process
In line with its mission to build a world-class business, the overall strategy for National Foods Holdings is clearly focused. Annual strategic plans are compiled at both Group and business unit level, with detailed plans for action and allocated responsibilities. Progress is reviewed regularly.
Ethics
Directors and employees are required to observe the highest ethical standards, ensuring that the business practices are conducted in a manner which, in all reasonable circumstances is beyond reproach. In line with the Zimbabwe Stock Exchange Listing Requirements, the Group operates a closed period prior to the publication of its interim and year end financial results during which period directors, officers and employees may not deal in the shares of the Holding Company. Where appropriate, this is also extended to include other sensitive periods.
Equal Opportunity
The Group is committed to providing equal opportunities for its employees regardless of race, tribe, place of origin, political opinion, colour, creed or sex.
annualreport 2011
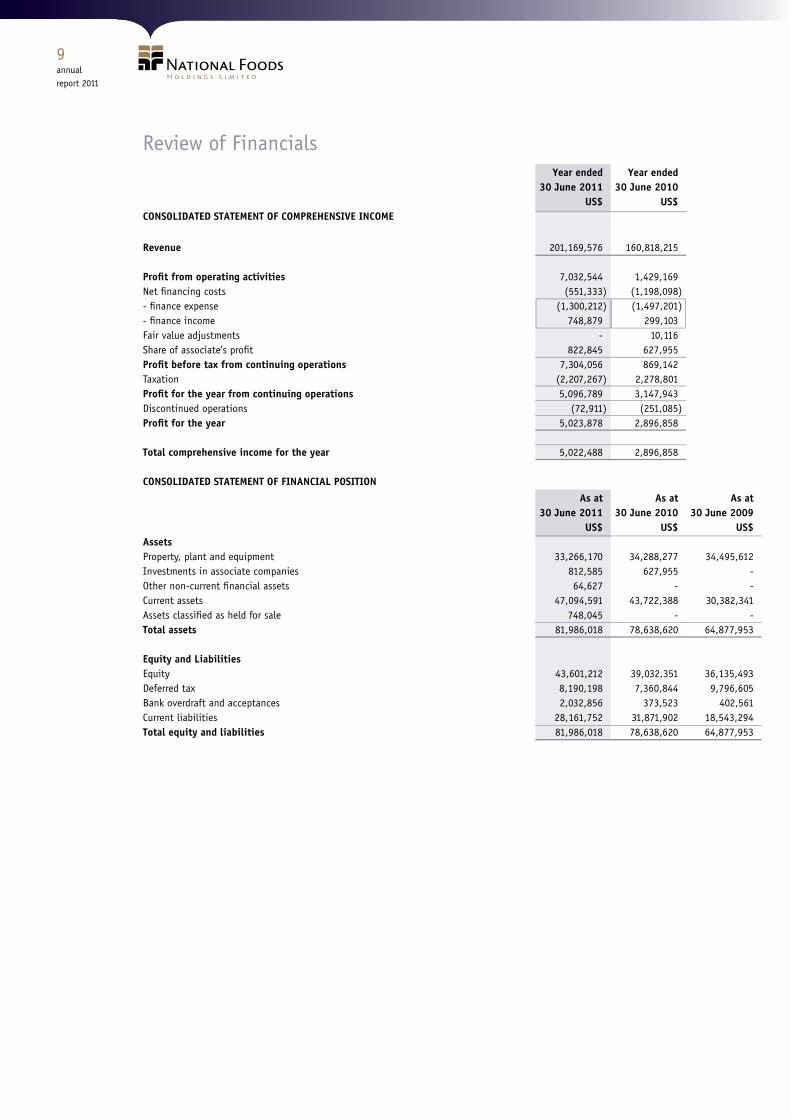
Review of Financials Year ended Year ended 30 June 2011 30 June 2010 US$ US$ CONSOLIDATED STATEMENT OF COMPREHENSIVE INCOME
Revenue 201,169,576 160,818,215
Profit from operating activities 7,032,544 1,429,169 Net financing costs (551,333 ) (1,198,098 ) - finance expense (1,300,212 ) (1,497,201 ) - finance income 748,879 299,103 Fair value adjustments - 10,116 Share of associate’s profit 822,845 627,955 Profit before tax from continuing operations 7,304,056 869,142 Taxation (2,207,267 ) 2,278,801 Profit for the year from continuing operations 5,096,789 3,147,943 Discontinued operations (72,911 ) (251,085 ) Profit for the year 5,023,878 2,896,858
Total comprehensive income for the year 5,022,488 2,896,858
CONSOLIDATED STATEMENT OF FINANCIAL POSITION
As at As at As at 30 June 2011 30 June 2010 30 June 2009 US$ US$ US$Assets Property, plant and equipment 33,266,170 34,288,277 34,495,612Investments in associate companies 812,585 627,955 -Other non-current financial assets 64,627 - -Current assets 47,094,591 43,722,388 30,382,341Assets classified as held for sale 748,045 - -Total assets 81,986,018 78,638,620 64,877,953
Equity and Liabilities Equity 43,601,212 39,032,351 36,135,493Deferred tax 8,190,198 7,360,844 9,796,605Bank overdraft and acceptances 2,032,856 373,523 402,561Current liabilities 28,161,752 31,871,902 18,543,294Total equity and liabilities 81,986,018 78,638,620 64,877,953
annualreport 2011
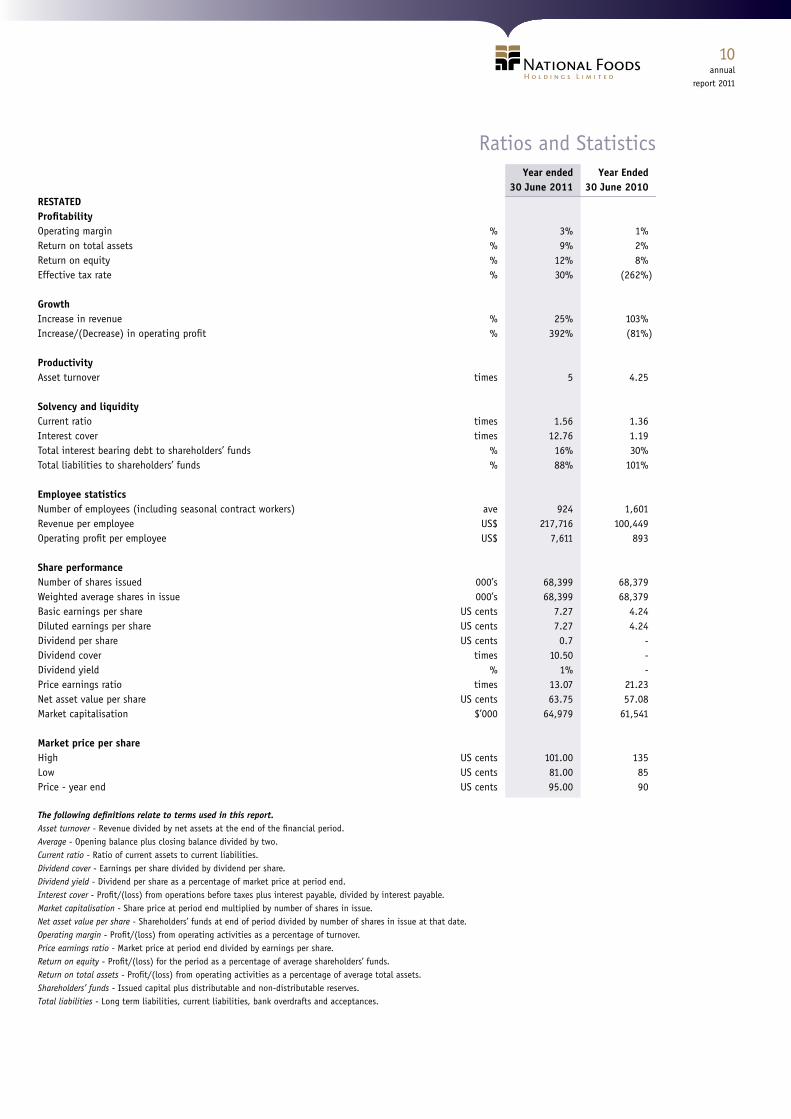
Ratios and Statistics Year ended Year Ended 30 June 2011 30 June 2010RESTATEDProfitability Operating margin % 3% 1%Return on total assets % 9% 2%Return on equity % 12% 8%Effective tax rate % 30% (262% ) Growth Increase in revenue % 25% 103%Increase/(Decrease) in operating profit % 392% (81% ) Productivity Asset turnover times 5 4.25 Solvency and liquidity Current ratio times 1.56 1.36 Interest cover times 12.76 1.19 Total interest bearing debt to shareholders’ funds % 16% 30%Total liabilities to shareholders’ funds % 88% 101% Employee statistics Number of employees (including seasonal contract workers) ave 924 1,601 Revenue per employee US$ 217,716 100,449 Operating profit per employee US$ 7,611 893 Share performance Number of shares issued 000’s 68,399 68,379 Weighted average shares in issue 000’s 68,399 68,379 Basic earnings per share US cents 7.27 4.24 Diluted earnings per share US cents 7.27 4.24 Dividend per share US cents 0.7 - Dividend cover times 10.50 - Dividend yield % 1% - Price earnings ratio times 13.07 21.23 Net asset value per share US cents 63.75 57.08 Market capitalisation $’000 64,979 61,541 Market price per share High US cents 101.00 135Low US cents 81.00 85Price - year end US cents 95.00 90
The following definitions relate to terms used in this report.Asset turnover - Revenue divided by net assets at the end of the financial period.Average - Opening balance plus closing balance divided by two.Current ratio - Ratio of current assets to current liabilities.Dividend cover - Earnings per share divided by dividend per share.Dividend yield - Dividend per share as a percentage of market price at period end.Interest cover - Profit/(loss) from operations before taxes plus interest payable, divided by interest payable.Market capitalisation - Share price at period end multiplied by number of shares in issue.Net asset value per share - Shareholders’ funds at end of period divided by number of shares in issue at that date.Operating margin - Profit/(loss) from operating activities as a percentage of turnover.Price earnings ratio - Market price at period end divided by earnings per share.Return on equity - Profit/(loss) for the period as a percentage of average shareholders’ funds.Return on total assets - Profit/(loss) from operating activities as a percentage of average total assets.Shareholders’ funds - Issued capital plus distributable and non-distributable reserves.Total liabilities - Long term liabilities, current liabilities, bank overdrafts and acceptances.
annualreport 2011
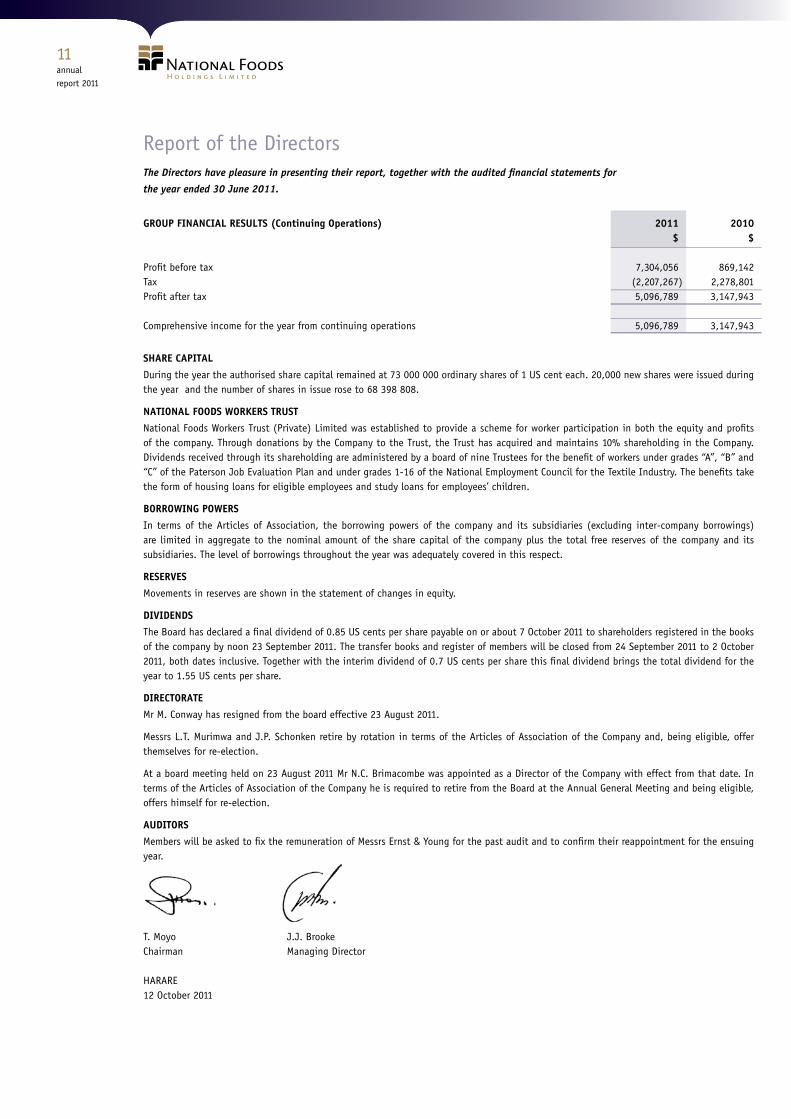
Report of the DirectorsThe Directors have pleasure in presenting their report, together with the audited financial statements for
the year ended 30 June 2011.
GROUP FINANCIAL RESULTS (Continuing Operations) 2011 2010 $ $
Profit before tax 7,304,056 869,142Tax (2,207,267 ) 2,278,801Profit after tax 5,096,789 3,147,943 Comprehensive income for the year from continuing operations 5,096,789 3,147,943
SHARE CAPITAL
During the year the authorised share capital remained at 73 000 000 ordinary shares of 1 US cent each. 20,000 new shares were issued during the year and the number of shares in issue rose to 68 398 808.
NATIONAL FOODS WORKERS TRUST
National Foods Workers Trust (Private) Limited was established to provide a scheme for worker participation in both the equity and profits of the company. Through donations by the Company to the Trust, the Trust has acquired and maintains 10% shareholding in the Company. Dividends received through its shareholding are administered by a board of nine Trustees for the benefit of workers under grades “A”, “B” and “C” of the Paterson Job Evaluation Plan and under grades 1-16 of the National Employment Council for the Textile Industry. The benefits take the form of housing loans for eligible employees and study loans for employees’ children.
BORROWING POWERS
In terms of the Articles of Association, the borrowing powers of the company and its subsidiaries (excluding inter-company borrowings) are limited in aggregate to the nominal amount of the share capital of the company plus the total free reserves of the company and its subsidiaries. The level of borrowings throughout the year was adequately covered in this respect.
RESERVES
Movements in reserves are shown in the statement of changes in equity.
DIVIDENDS
The Board has declared a final dividend of 0.85 US cents per share payable on or about 7 October 2011 to shareholders registered in the books of the company by noon 23 September 2011. The transfer books and register of members will be closed from 24 September 2011 to 2 October 2011, both dates inclusive. Together with the interim dividend of 0.7 US cents per share this final dividend brings the total dividend for the year to 1.55 US cents per share.
DIRECTORATE
Mr M. Conway has resigned from the board effective 23 August 2011.
Messrs L.T. Murimwa and J.P. Schonken retire by rotation in terms of the Articles of Association of the Company and, being eligible, offer themselves for re-election.
At a board meeting held on 23 August 2011 Mr N.C. Brimacombe was appointed as a Director of the Company with effect from that date. In terms of the Articles of Association of the Company he is required to retire from the Board at the Annual General Meeting and being eligible, offers himself for re-election.
AUDITORS
Members will be asked to fix the remuneration of Messrs Ernst & Young for the past audit and to confirm their reappointment for the ensuing year.
T. Moyo J.J. BrookeChairman Managing Director
HARARE 12 October 2011
annualreport 2011
Statement of Directors’ ResponsibilityThe Directors of the company are required by the Companies Act to maintain adequate accounting records and to prepare financial statements that present a true and fair view of the state of affairs of the Company and the Group at the end of each financial year and of the profit and cash flows for the period. In preparing the accompanying financial statements International Financial Reporting Standards have been followed. Suitable accounting policies have been used and consistently applied, and reasonable and prudent judgements and estimates have been made.
The financial statements have been prepared under the historical cost convention, are in agreement with the underlying books and records and have been properly prepared in accordance with the accounting policies set out in note 2 of the financial statements, and comply with International Financial Reporting Standards and the disclosure requirements of the Companies Act (Chapter 24:03) and the relevant regulations made thereunder.
The principal accounting policies of the Group are consistent with those applied in the previous year and conform to International Financial Reporting Standards (IFRS).
The Group has decided to adopt IFRS 1, First-Time Adoption of International Financial Reporting Standards ahead of the effective date. This has had the effect in the current year financial reporting of disclosing three statements of financial position together with appropriate notes. The statements of financial position cover the opening position at 30 June 2009 with deemed US Dollar amounts, the closing balances as at 30 June 2010 and closing balances as at 30 June 2011.
The Directors have satisfied themselves that the Group is in a sound financial position and has adequate resources to continue in operational existence for the foreseeable future. Accordingly they are satisfied that it is appropriate to adopt the going concern basis in preparing the financial statements.
The Board recognises and acknowledges its responsibility for the Group’s systems of internal financial control. National Foods maintains internal controls and systems that are designed to safeguard the assets of the Group, prevent and detect errors and fraud and ensure the completeness and accuracy of the Group’s records. The Group’s Audit Committee has met the external auditors to discuss their reports on the results of their work, which include assessments of relative strengths and weaknesses of key control areas. Whilst in a growing Group of the size, complexity and diversity of National Foods it may be expected that occasional breakdowns in established control processes may occur, no breakdowns involving material loss have been reported to the Directors in respect of the period under review.
The financial statements for the year ended 30 June 2011, which appear on pages 14 to 47 have been approved by the Board of Directors and are signed on its behalf by:
T. Moyo J.J. Brooke Chairman Managing Director
HARARE 12 October 2011
annualreport 2011
Independent Auditor’s Report Chartered Accountants (Zimbabwe) Angwa City Cnr Julius Nyerere Way/ Kwame Nkrumah Avenue P.O. Box 62 0r 702 Harare
Tel: +263 04 750905 / 750979 Fax: +263 04 570707 / 773842 E-mail: [email protected]
TO THE MEMBERS OF NATIONAL FOODS HOLDINGS LIMITED
We have audited the accompanying consolidated financial statements of National Foods Holdings Limited as set out on pages 14 to 47, which comprise the Group Statement of Financial Position as at 30 June 2011, the Group Statement of Comprehensive Income, the Group Statement of Changes in Equity and the Group Statement of Cash Flows for the year then ended, and the notes to the financial statements, which include a summary of significant accounting policies and other explanatory information.
Directors’ Responsibility for the Financial Statements
The Company’s Directors are responsible for the preparation and fair presentation of these financial statements in accordance with International Financial Reporting Standards (IFRS) and in the manner required by the Companies Act (Chapter 24:03), and for such internal control as the Directors determine is necessary to enable the preparation of financial statements that are free from material misstatement, whether due to fraud or error.
Auditor’s responsibility
Our responsibility is to express an opinion on these financial statements based on our audit. We conducted our audit in accordance with International Standards on Auditing. Those Standards require that we comply with ethical requirements and plan and perform the audit to obtain reasonable assurance whether the financial statements are free from material misstatement.
An audit involves performing procedures to obtain audit evidence about the amounts and disclosures in the financial statements. The procedures selected depend on the auditor’s judgement, including the assessment of the risks of material misstatement of the financial statements, whether due to fraud or error. In making those risk assessments, the auditor considers internal control relevant to the entity’s preparation and fair presentation of the financial statements in order to design audit procedures that are appropriate in the circumstances, but not for the purpose of expressing an opinion on the effectiveness of the entity’s internal control. An audit also includes evaluating, the appropriateness of accounting policies used and the reasonableness of accounting estimates made by the Directors, as well as evaluating the overall presentation of the financial statements.
We believe that the audit evidence we have obtained is sufficient and appropriate to provide a basis for our audit opinion.
Opinion
In our opinion, the consolidated financial statements present fairly, in all material respects, the financial position of National Foods Holdings Limited and its subsidiaries as at 30 June 2011, and its financial performance and its cash flows for the year then ended in accordance with International Financial Reporting Standards.
Report on other legal and regulatory requirements
In our opinion, the consolidated financial statements have, in all material respects, been properly prepared in compliance with the disclosure requirements of the Companies Act (Chapter 24:03) and the relevant Statutory Instruments.
Ernst & Young Chartered Accountants (Zimbabwe)
HARARE12 October 2011
annualreport 2011
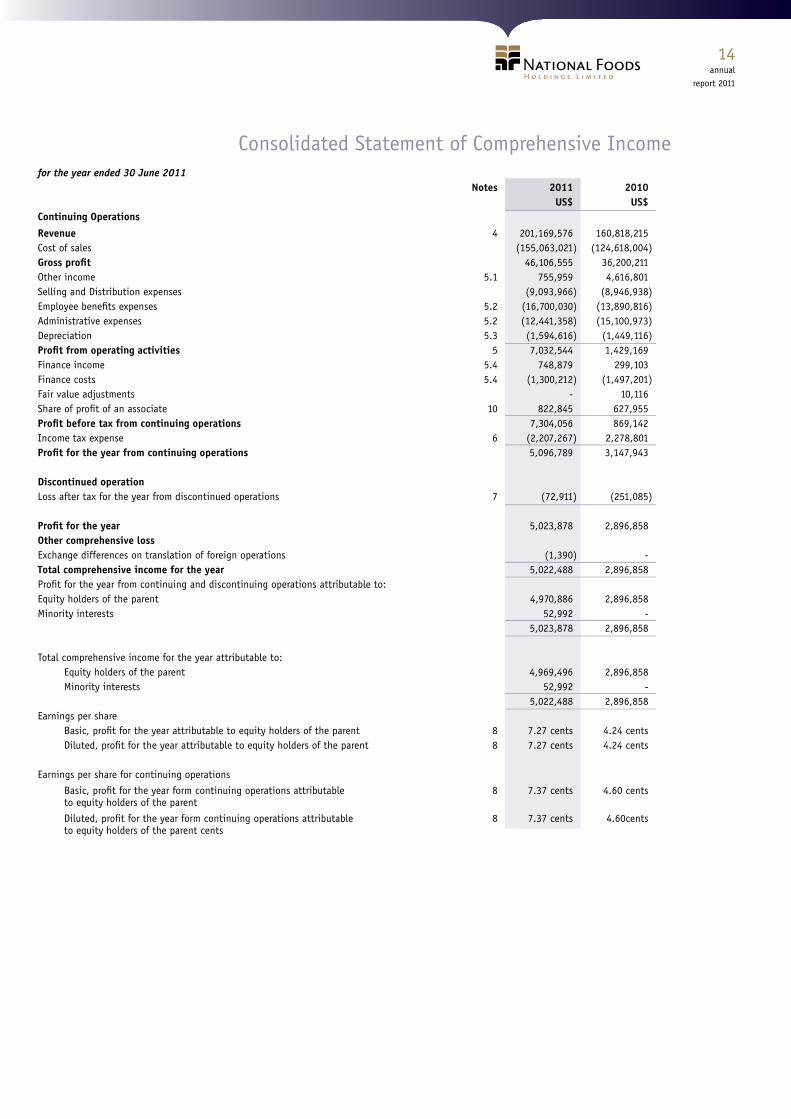
Consolidated Statement of Comprehensive Incomefor the year ended 30 June 2011 Notes 2011 2010 US$ US$Continuing Operations
Revenue 4 201,169,576 160,818,215Cost of sales (155,063,021 ) (124,618,004 )Gross profit 46,106,555 36,200,211Other income 5.1 755,959 4,616,801Selling and Distribution expenses (9,093,966 ) (8,946,938 )Employee benefits expenses 5.2 (16,700,030 ) (13,890,816 )Administrative expenses 5.2 (12,441,358 ) (15,100,973 )Depreciation 5.3 (1,594,616 ) (1,449,116 )Profit from operating activities 5 7,032,544 1,429,169 Finance income 5.4 748,879 299,103 Finance costs 5.4 (1,300,212 ) (1,497,201 )Fair value adjustments - 10,116Share of profit of an associate 10 822,845 627,955Profit before tax from continuing operations 7,304,056 869,142Income tax expense 6 (2,207,267 ) 2,278,801Profit for the year from continuing operations 5,096,789 3,147,943
Discontinued operationLoss after tax for the year from discontinued operations 7 (72,911 ) (251,085 )
Profit for the year 5,023,878 2,896,858Other comprehensive lossExchange differences on translation of foreign operations (1,390 ) -Total comprehensive income for the year 5,022,488 2,896,858 Profit for the year from continuing and discontinuing operations attributable to:Equity holders of the parent 4,970,886 2,896,858Minority interests 52,992 - 5,023,878 2,896,858
Total comprehensive income for the year attributable to: Equity holders of the parent 4,969,496 2,896,858 Minority interests 52,992 - 5,022,488 2,896,858Earnings per share Basic, profit for the year attributable to equity holders of the parent 8 7.27 cents 4.24 cents Diluted, profit for the year attributable to equity holders of the parent 8 7.27 cents 4.24 cents
Earnings per share for continuing operations
Basic, profit for the year form continuing operations attributable 8 7.37 cents 4.60 cents to equity holders of the parent
Diluted, profit for the year form continuing operations attributable 8 7.37 cents 4.60cents to equity holders of the parent cents
annualreport 2011
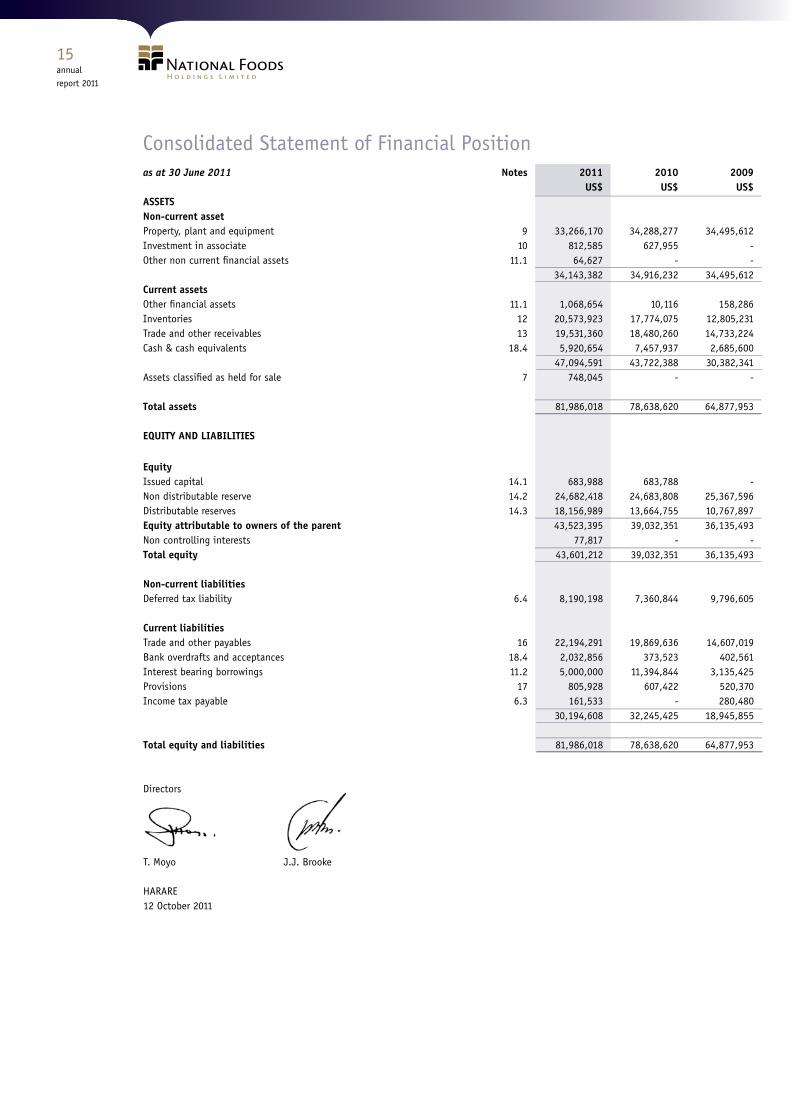
Consolidated Statement of Financial Positionas at 30 June 2011 Notes 2011 2010 2009 US$ US$ US$ASSETSNon-current assetProperty, plant and equipment 9 33,266,170 34,288,277 34,495,612 Investment in associate 10 812,585 627,955 - Other non current financial assets 11.1 64,627 - - 34,143,382 34,916,232 34,495,612 Current assets Other financial assets 11.1 1,068,654 10,116 158,286 Inventories 12 20,573,923 17,774,075 12,805,231 Trade and other receivables 13 19,531,360 18,480,260 14,733,224 Cash & cash equivalents 18.4 5,920,654 7,457,937 2,685,600 47,094,591 43,722,388 30,382,341 Assets classified as held for sale 7 748,045 - -
Total assets 81,986,018 78,638,620 64,877,953
EQUITY AND LIABILITIES
EquityIssued capital 14.1 683,988 683,788 - Non distributable reserve 14.2 24,682,418 24,683,808 25,367,596 Distributable reserves 14.3 18,156,989 13,664,755 10,767,897 Equity attributable to owners of the parent 43,523,395 39,032,351 36,135,493 Non controlling interests 77,817 - - Total equity 43,601,212 39,032,351 36,135,493
Non-current liabilitiesDeferred tax liability 6.4 8,190,198 7,360,844 9,796,605 Current liabilitiesTrade and other payables 16 22,194,291 19,869,636 14,607,019 Bank overdrafts and acceptances 18.4 2,032,856 373,523 402,561 Interest bearing borrowings 11.2 5,000,000 11,394,844 3,135,425 Provisions 17 805,928 607,422 520,370 Income tax payable 6.3 161,533 - 280,480 30,194,608 32,245,425 18,945,855
Total equity and liabilities 81,986,018 78,638,620 64,877,953 Directors
T. Moyo J.J. Brooke
HARARE12 October 2011
annualreport 2011
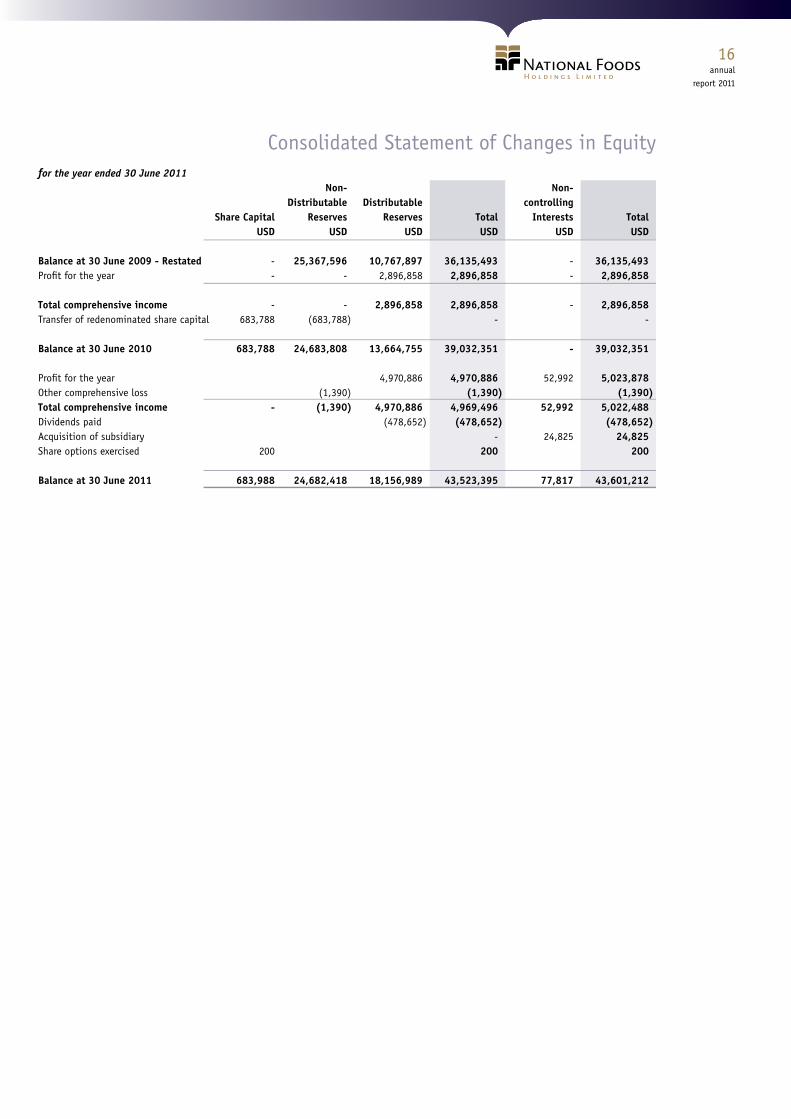
Consolidated Statement of Changes in Equityfor the year ended 30 June 2011 Non- Non- Distributable Distributable controlling Share Capital Reserves Reserves Total Interests Total USD USD USD USD USD USD Balance at 30 June 2009 - Restated - 25,367,596 10,767,897 36,135,493 - 36,135,493 Profit for the year - - 2,896,858 2,896,858 - 2,896,858
Total comprehensive income - - 2,896,858 2,896,858 - 2,896,858 Transfer of redenominated share capital 683,788 (683,788 ) - - Balance at 30 June 2010 683,788 24,683,808 13,664,755 39,032,351 - 39,032,351 Profit for the year 4,970,886 4,970,886 52,992 5,023,878 Other comprehensive loss (1,390 ) (1,390 ) (1,390 )Total comprehensive income - (1,390 ) 4,970,886 4,969,496 52,992 5,022,488 Dividends paid (478,652 ) (478,652 ) (478,652 )Acquisition of subsidiary - 24,825 24,825 Share options exercised 200 200 200
Balance at 30 June 2011 683,988 24,682,418 18,156,989 43,523,395 77,817 43,601,212
annualreport 2011
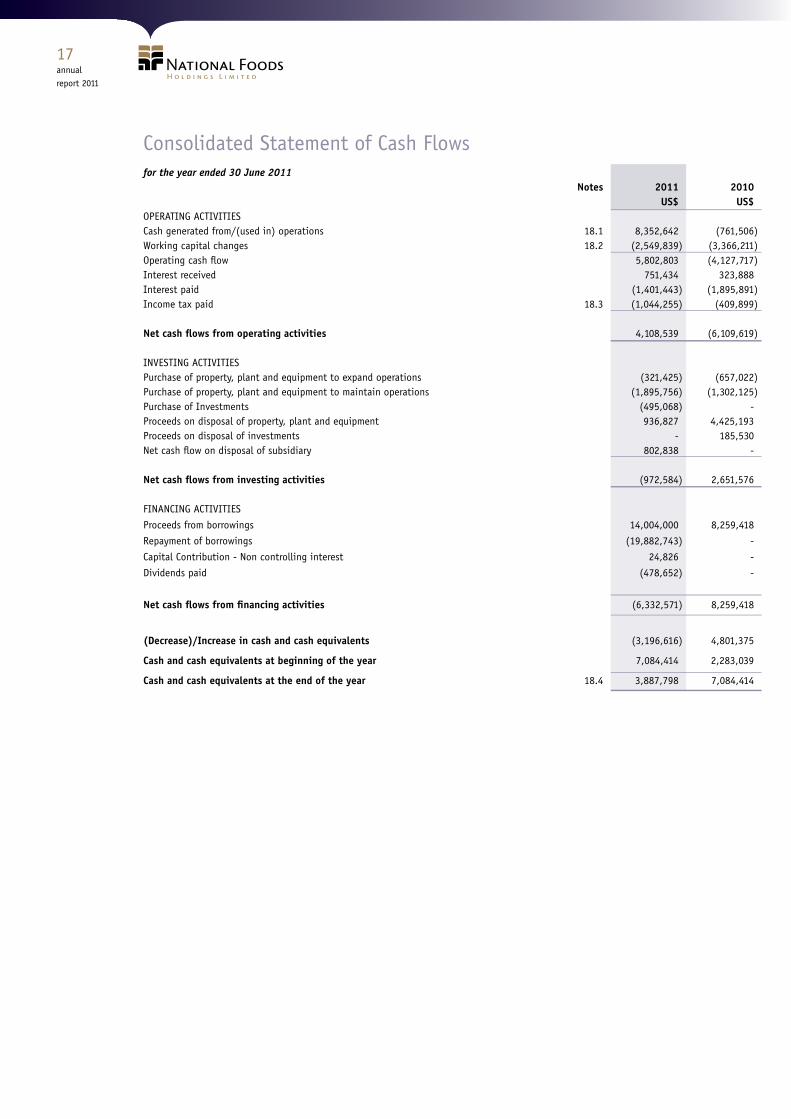
Consolidated Statement of Cash Flowsfor the year ended 30 June 2011 Notes 2011 2010 US$ US$OPERATING ACTIVITIESCash generated from/(used in) operations 18.1 8,352,642 (761,506 )Working capital changes 18.2 (2,549,839 ) (3,366,211 )Operating cash flow 5,802,803 (4,127,717 )Interest received 751,434 323,888 Interest paid (1,401,443 ) (1,895,891 )Income tax paid 18.3 (1,044,255 ) (409,899 )
Net cash flows from operating activities 4,108,539 (6,109,619 ) INVESTING ACTIVITIES Purchase of property, plant and equipment to expand operations (321,425 ) (657,022 )Purchase of property, plant and equipment to maintain operations (1,895,756 ) (1,302,125 )Purchase of Investments (495,068 ) - Proceeds on disposal of property, plant and equipment 936,827 4,425,193 Proceeds on disposal of investments - 185,530 Net cash flow on disposal of subsidiary 802,838 -
Net cash flows from investing activities (972,584 ) 2,651,576 FINANCING ACTIVITIES
Proceeds from borrowings 14,004,000 8,259,418
Repayment of borrowings (19,882,743 ) -
Capital Contribution - Non controlling interest 24,826 -
Dividends paid (478,652 ) -
Net cash flows from financing activities (6,332,571 ) 8,259,418
(Decrease)/Increase in cash and cash equivalents (3,196,616 ) 4,801,375
Cash and cash equivalents at beginning of the year 7,084,414 2,283,039
Cash and cash equivalents at the end of the year 18.4 3,887,798 7,084,414
annualreport 2011
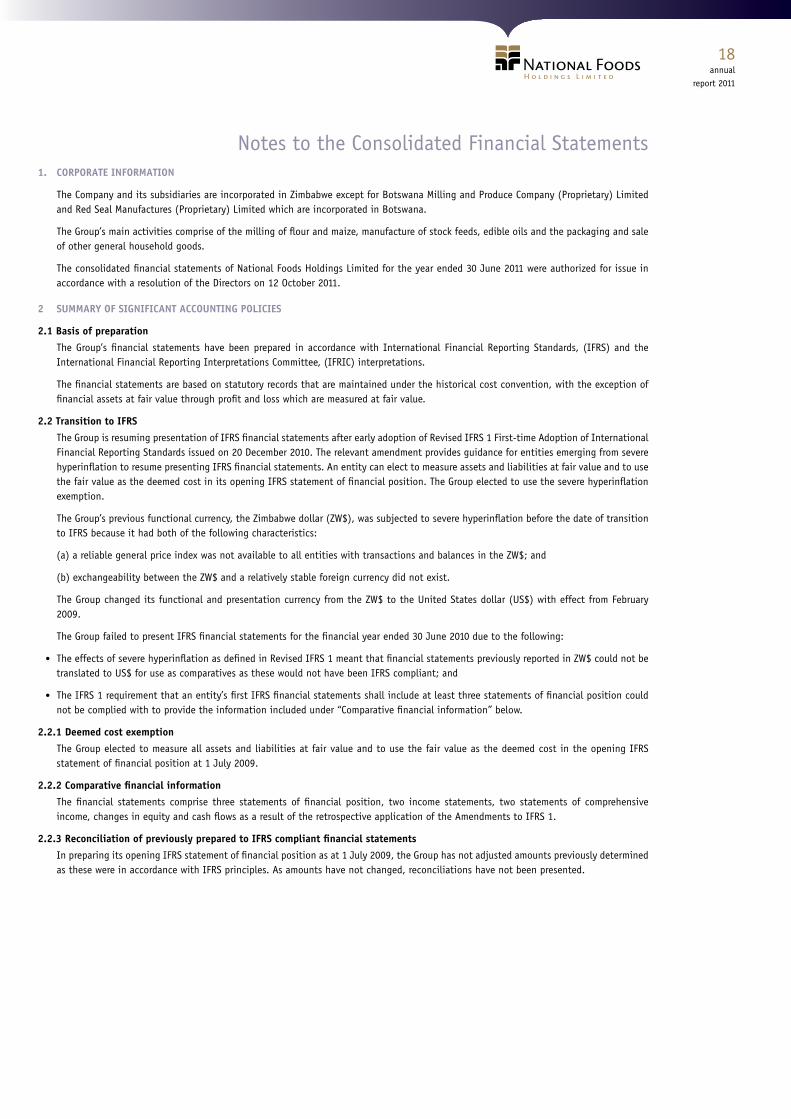
Notes to the Consolidated Financial Statements1. CORPORATE INFORMATION
The Company and its subsidiaries are incorporated in Zimbabwe except for Botswana Milling and Produce Company (Proprietary) Limited and Red Seal Manufactures (Proprietary) Limited which are incorporated in Botswana.
The Group’s main activities comprise of the milling of flour and maize, manufacture of stock feeds, edible oils and the packaging and sale of other general household goods.
The consolidated financial statements of National Foods Holdings Limited for the year ended 30 June 2011 were authorized for issue in accordance with a resolution of the Directors on 12 October 2011.
2 SUMMARY OF SIGNIFICANT ACCOUNTING POLICIES
2.1 Basis of preparation
The Group’s financial statements have been prepared in accordance with International Financial Reporting Standards, (IFRS) and the International Financial Reporting Interpretations Committee, (IFRIC) interpretations.
The financial statements are based on statutory records that are maintained under the historical cost convention, with the exception of financial assets at fair value through profit and loss which are measured at fair value.
2.2 Transition to IFRS
The Group is resuming presentation of IFRS financial statements after early adoption of Revised IFRS 1 First-time Adoption of International Financial Reporting Standards issued on 20 December 2010. The relevant amendment provides guidance for entities emerging from severe hyperinflation to resume presenting IFRS financial statements. An entity can elect to measure assets and liabilities at fair value and to use the fair value as the deemed cost in its opening IFRS statement of financial position. The Group elected to use the severe hyperinflation exemption.
The Group’s previous functional currency, the Zimbabwe dollar (ZW$), was subjected to severe hyperinflation before the date of transition to IFRS because it had both of the following characteristics:
(a) a reliable general price index was not available to all entities with transactions and balances in the ZW$; and
(b) exchangeability between the ZW$ and a relatively stable foreign currency did not exist.
The Group changed its functional and presentation currency from the ZW$ to the United States dollar (US$) with effect from February 2009.
The Group failed to present IFRS financial statements for the financial year ended 30 June 2010 due to the following:
• The effects of severe hyperinflation as defined in Revised IFRS 1 meant that financial statements previously reported in ZW$ could not be translated to US$ for use as comparatives as these would not have been IFRS compliant; and
• The IFRS 1 requirement that an entity’s first IFRS financial statements shall include at least three statements of financial position could not be complied with to provide the information included under “Comparative financial information” below.
2.2.1 Deemed cost exemption
The Group elected to measure all assets and liabilities at fair value and to use the fair value as the deemed cost in the opening IFRS statement of financial position at 1 July 2009.
2.2.2 Comparative financial information
The financial statements comprise three statements of financial position, two income statements, two statements of comprehensive income, changes in equity and cash flows as a result of the retrospective application of the Amendments to IFRS 1.
2.2.3 Reconciliation of previously prepared to IFRS compliant financial statements
In preparing its opening IFRS statement of financial position as at 1 July 2009, the Group has not adjusted amounts previously determined as these were in accordance with IFRS principles. As amounts have not changed, reconciliations have not been presented.
annualreport 2011
Notes to the Consolidated Financial Statements (continued)
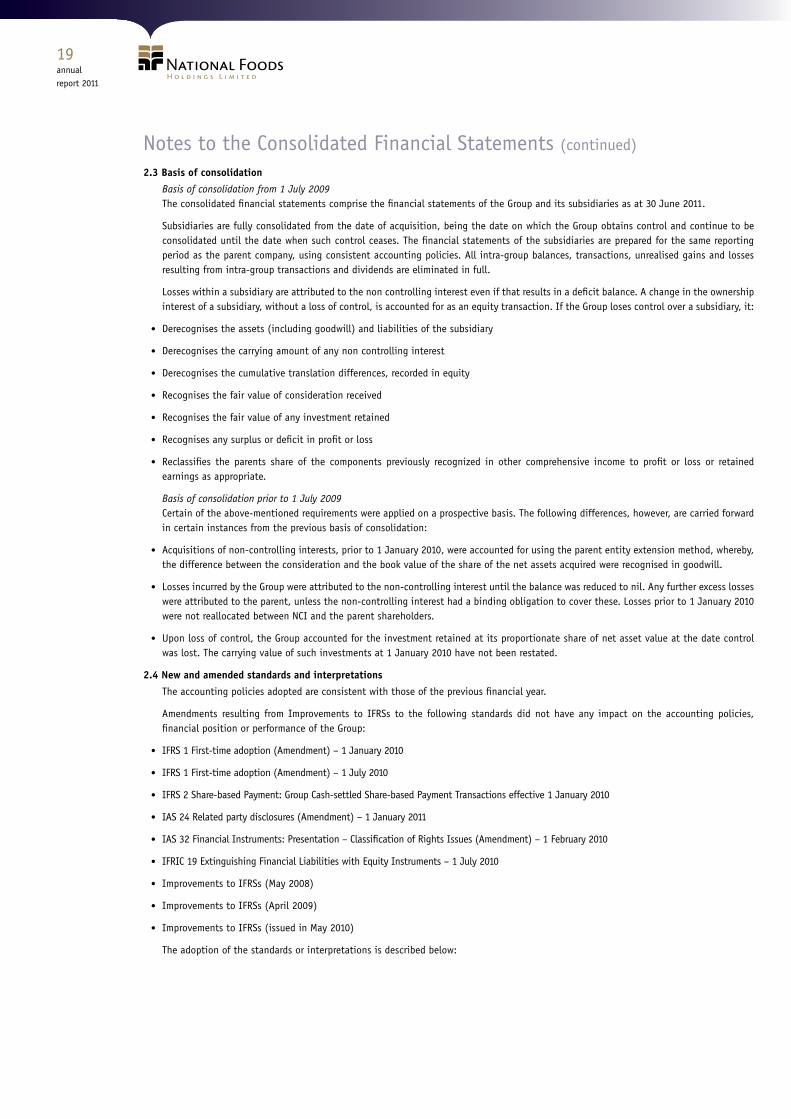
2.3 Basis of consolidation
Basis of consolidation from 1 July 2009The consolidated financial statements comprise the financial statements of the Group and its subsidiaries as at 30 June 2011.
Subsidiaries are fully consolidated from the date of acquisition, being the date on which the Group obtains control and continue to be consolidated until the date when such control ceases. The financial statements of the subsidiaries are prepared for the same reporting period as the parent company, using consistent accounting policies. All intra-group balances, transactions, unrealised gains and losses resulting from intra-group transactions and dividends are eliminated in full.
Losses within a subsidiary are attributed to the non controlling interest even if that results in a deficit balance. A change in the ownership interest of a subsidiary, without a loss of control, is accounted for as an equity transaction. If the Group loses control over a subsidiary, it:
• Derecognises the assets (including goodwill) and liabilities of the subsidiary
• Derecognises the carrying amount of any non controlling interest
• Derecognises the cumulative translation differences, recorded in equity
• Recognises the fair value of consideration received
• Recognises the fair value of any investment retained
• Recognises any surplus or deficit in profit or loss
• Reclassifies the parents share of the components previously recognized in other comprehensive income to profit or loss or retained earnings as appropriate.
Basis of consolidation prior to 1 July 2009Certain of the above-mentioned requirements were applied on a prospective basis. The following differences, however, are carried forward in certain instances from the previous basis of consolidation:
• Acquisitions of non-controlling interests, prior to 1 January 2010, were accounted for using the parent entity extension method, whereby, the difference between the consideration and the book value of the share of the net assets acquired were recognised in goodwill.
• Losses incurred by the Group were attributed to the non-controlling interest until the balance was reduced to nil. Any further excess losses were attributed to the parent, unless the non-controlling interest had a binding obligation to cover these. Losses prior to 1 January 2010 were not reallocated between NCI and the parent shareholders.
• Upon loss of control, the Group accounted for the investment retained at its proportionate share of net asset value at the date control was lost. The carrying value of such investments at 1 January 2010 have not been restated.
2.4 New and amended standards and interpretations
The accounting policies adopted are consistent with those of the previous financial year.
Amendments resulting from Improvements to IFRSs to the following standards did not have any impact on the accounting policies, financial position or performance of the Group:
• IFRS 1 First-time adoption (Amendment) – 1 January 2010
• IFRS 1 First-time adoption (Amendment) – 1 July 2010
• IFRS 2 Share-based Payment: Group Cash-settled Share-based Payment Transactions effective 1 January 2010
• IAS 24 Related party disclosures (Amendment) – 1 January 2011
• IAS 32 Financial Instruments: Presentation – Classification of Rights Issues (Amendment) – 1 February 2010
• IFRIC 19 Extinguishing Financial Liabilities with Equity Instruments – 1 July 2010
• Improvements to IFRSs (May 2008)
• Improvements to IFRSs (April 2009)
• Improvements to IFRSs (issued in May 2010)
The adoption of the standards or interpretations is described below:
annualreport 2011
Notes to the Consolidated Financial Statements (continued)
IFRS 1 First-time Adoption of International Financial Reporting Standards (Amendments)
This amendment is effective for annual periods beginning on or after 1 January 2010. IFRS 1 has been amended to provide additional exemptions from full retrospective application of IFRS for the measurement of oil & gas assets and leases. This is not applicable to the Group as it is not a first-time adopter.
IFRS 1 First-time Adoption of International Financial Reporting Standards (Amendment)
The amendment to IFRS 1 is effective for annual periods beginning on or after 1 July 2010. The amendment allows first-time adopters to utilise the transitional provisions of IFRS 7 Financial Instruments: Disclosures as they relate to the March 2009 amendments to the standard. These provisions give relief from providing comparative information in the disclosures required by the amendments in the first year of application. To achieve this, the transitional provisions in IFRS 7 were also amended. This is not applicable to the Group as it is not a first-time adopter.
IFRS 2 Share-based Payment (Revised)
The IASB issued an amendment to IFRS 2 that clarified the scope and the accounting for Group cash-settled share-based payment transactions. The standard is not relevant to the Group and had no impact on the financial position or performance of the Group.
IAS 24 Related Party Disclosures (Amendment)
The amended standard is effective for annual periods beginning on or after 1 January 2011. It clarified and simplifies the definition of a related party to simplify the identification of such relationships and to eliminate inconsistencies in its application. The revised standard introduces a partial exemption of disclosure requirements for government related entities. The Group does not expect any impact on its financial position or performance.
IAS 32 Financial Instruments: Presentation – Classification of Rights Issues (Amendment)
The amendment to IAS 32 is effective for annual periods beginning on or after 1 February 2010 and amended the definition of a financial liability. The amendment addresses the accounting for rights issues that are denominated in a currency other than the functional currency of the issuer. Provided certain conditions are met, such rights issues are now classified as equity regardless of the currency in which the exercise price is denominated. Previously, these issues had to be accounted for as derivative liabilities. The amendment applies retrospectively in accordance with IAS 8 ‘Accounting policies, changes in accounting estimates and errors’. This amendment will have no impact on the Group after initial application.
IFRIC 19 Extinguishing Financial Liabilities with Equity Instruments
IFRIC 19 is effective for annual periods beginning on or after 1 July 2010. The interpretation clarifies the accounting by an entity when the terms of a financial liability are renegotiated and result in the entity issuing equity instruments to a creditor of the entity to extinguish all or part of the financial liability (debt for equity swap). The interpretation clarifies that equity instruments issued to a creditor to extinguish a financial liability qualify as consideration paid. The equity instruments issued are measured at their fair value. In case that this cannot be reliably measured, the instruments are measured at the fair value of the liability extinguished. Any gain or loss is recognised immediately in profit or loss. The adoption of this interpretation will have no effect on the financial position or performance of the Group.
2.5 Improvements to IFRSs
In May 2008 and April 2009, the IASB issued omnibus of amendments to its standards, primarily with a view to removing inconsistencies and clarifying wording. There are separate transitional provisions for each standard. The adoption of the following amendments where relevant resulted in changes to accounting policies but did not have any impact on the financial position or performance of the Group.
Issued in May 2008IFRS 5 Non-current Assets Held for Sale and Discontinued Operations (effective from 1 January 2010): clarifies that when a subsidiary is classified as held for sale, all its assets and liabilities are classified as held for sale, even when the entity remains a non-controlling interest after the sale transaction. The amendment is applied prospectively and has no impact on the financial position nor financial performance of the Group.
Issued in April 2009• IFRS 5 Non-current Assets Held for Sale and Discontinued Operations (effective from 1 January 2010): clarifies that the disclosures required
in respect of non-current assets and disposal Groups classified as held for sale or discontinued operations are only those set out in IFRS 5. The disclosure requirements of other IFRSs only apply if specifically required for such non-current assets or discontinued operations. The standard is not relevant to the Group and did not impact on the financial position or performance of the Group.
• IFRS 8 Operating Segments (effective from 1 January 2010): clarifies that segment assets and liabilities need only be reported when those assets and liabilities are included in measures that are used by the chief operating decision maker.
annualreport 2011
Notes to the Consolidated Financial Statements (continued)
• IAS 1 Presentation of Financial Statements (effective from 1 January 2010): clarifies that the terms of a liability that could at anytime result in its settlement by the issuance of equity instruments at the option of the counterparty do not affect its current or non-current classification.
• IAS 7 Statement of Cash Flows (effective from 1 January 2010): States that only expenditure that results in recognising an asset can be classified as a cash flow from investing activities. This amendment will only impact future presentation in the statement of cash flows.
• IAS 17 Leases (effective from 1 January 2010): the specific guidance on classifying land as a lease has been removed so that only the general guidance remains.
• IAS 36 Impairment of Assets (effective from 1 January 2010): The amendment clarifies that the largest unit permitted for allocating goodwill, acquired in a business combination, is the operating segment as defined in IFRS 8 before aggregation for reporting purposes. The amendment has no impact on the Group as the annual impairment test is performed before aggregation.
• IAS 39 Financial Instruments: Recognition and Measurement (effective from 1 January 2010):
• Assessment of loan prepayment penalties as embedded derivatives - A prepayment option is considered closely related to the host contract when the exercise price reimburses the lender up to the approximate present value of lost interest for the remaining term of the host contract.
• Scope exemption for business combination contract - The scope exemption for contracts between an acquirer and a vendor in a business combination to buy or sell an acquiree at a future date applies only to binding forward contracts, not derivative contracts where further actions are still to be taken.
• Cash flow hedge accounting - Gains or losses on cash flow hedges of a forecast transaction that subsequently results in the recognition of a financial instrument or on cash flow hedges or recognised financial instruments should be reclassified in the period that the hedged forecast cash flows affect profit or loss.
Issued in May 2010IFRS 3 Business Combinations (effective from 1 July 2010):
• Transition requirements for contingent consideration from a business combination that occurred before the effective date of the revised IFRS. - The amendment clarifies that the amendments to IFRS 7 Financial Instruments: Disclosures, IAS 32 Financial Instruments: Presentation and IAS 39 Financial Instruments: Recognition and Measurement, that eliminate the exemption for contingent consideration, do not apply to contingent consideration that arose from business combinations whose acquisition dates precede the application of IFRS 3 (as revised in 2008). The amendment is applied retrospectively.
• Measurement of non-controlling interests (NCI) - The amendment limits the scope of the measurement choices only to the components of NCI that are present ownership interests which entitle their holders to a proportionate share of the entity’s net assets, in the event of liquidation. Other components of NCI are measured at their acquisition date fair value, unless another measurement basis is required by another IFRS.
• Un-replaced and voluntarily replaced share-based payment awards - The amendment requires an entity (in a business combination) to account for the replacement of the acquiree’s share-based payment transactions (whether by obligation or voluntarily), i.e., split between consideration and post-combination expenses. However, if the entity replaces the acquiree’s awards that expire as a consequence of the business combination, these are recognised as post-combination expenses.
• IAS 27 Consolidated and Separate Financial Statements (effective from 1 July 2010): The amendment clarifies that the consequential amendments from IAS 27 made to IAS 21 The Effect of Changes in Foreign Exchange Rates, IAS 28 Investments in Associates and IAS 31 Interests in Joint Ventures apply prospectively for annual periods beginning on or after 1 July 2009 or earlier when IAS 27 is applied earlier. The amendment is applied retrospectively.
2.6 Standards issued but not yet effective
Standards issued but not yet effective up to the date of issuance of the Group’s financial statements are listed below. This listing is of standards and interpretations issued, which the Group reasonably expects to be applicable at a future date. The Group intends to adopt those standards when they become effective. The Group expects that adoption of these standards, amendments and interpretations in most cases not to have any significant impact on the Group’s financial position or performance in the period of initial application but additional disclosures will be required. In cases where it will have an impact the Group is still assessing the possible impact.
IAS 1 Financial statement presentation (Amendment)
The amendment is effective for annual periods beginning on or after 1 January 2012 and requires that items of other comprehensive income be grouped in Items that would be reclassified to profit or loss at a future point and items that will never be reclassified. This amendment only effects the presentation in the financial statements.
annualreport 2011
Notes to the Consolidated Financial Statements (continued)
IAS 12 Income taxes (Amendment)
The amendment is effective for annual periods beginning on or after 1 January 2012 and introduces a rebuttable presumption that deferred tax on investment properties measured at fair value will be recognised on a sale basis, unless an entity has a business model that would indicate the investment property will be consumed in the business. If consumed a use basis should be adopted. This amendment will have no impact on the Group after initial application.
IAS 19 Post employee benefits (Amendment)
The amendments are effective for annual periods beginning on or after 1 January 2013. There are changes to post employee benefits in that pension surpluses and deficits are to be recognised in full (no more deferral mechanisms) and all actuarial gains and losses recognised in other comprehensive income as they occur with no recycling to profit or loss. Past service costs as a result of plan amendments are to be recognized immediately.
Short and long-term benefits will now be distinguished based on the expected timing of settlement, rather than employee entitlement.
IFRS 1 First-time Adoption of international Financial Reporting Standards (Amendment) - Severe Hyperinflation and Removal of Fixed Dates for First-time Adopters (Amendment)
The amendment is effective for annual periods beginning on or after 1 July 2011. The IASB has provided guidance on how an entity should resume presenting IFRS financial statements when its functional currency ceases to be subject to severe hyperinflation. A further amendment to the standard is the removal of the legacy fixed dates in IFRS 1 relating to derecognition and day one gain or loss transactions have also been removed. The standard now has these dates coinciding with the date of transition to IFRS.
IFRS 7 Financial Instruments: Disclosures - Transfer of financial assets (Amendment)
The amendment is effective for annual periods beginning on or after 1 July 2011. The amendment requires additional quantitative and qualitative disclosures relating to transfers of financial assets, where:
Financial assets are derecognised in their entirety, but where the entity has a continuing involvement in them (e.g., options or guarantees on the transferred assets)
Financial assets are not derecognised in their entirety - The amendments may be applied earlier than the effective date and this fact must be disclosed. Comparative disclosures are not required for any period beginning before the effective date.
IFRS 9 Financial Instruments: Classification and Measurement
IFRS 9 as issued reflects the first phase of the IASBs work on the replacement of IAS 39 and applies to classification and measurement of financial assets and liabilities as defined in IAS 39. The standard is effective for annual periods beginning on or after 1 January 2013. In subsequent phases, the Board will address impairment and hedge accounting. The completion of this project is expected by the end of 2011. The adoption of the first phase of IFRS 9 will primarily have an effect on the classification and measurement of the Group’s financial assets. The Group is currently assessing the impact of adopting IFRS 9, however, the impact of adoption depends on the assets held by the Group at the date of adoption, it is not practical to quantify the effect.
IFRS 10 Consolidated Financial Statements; IFRS 11 Joint Arrangements; IFRS 12 Disclosure of Interest in Other Entities.
IFRS 10 replaces the portion of IAS 27 Consolidated and Separate Financial Statements that addresses the accounting for consolidated financial statements. It also includes the issues raised in SIC 12 Consolidation – Special Purpose Entities. IFRS 10 establishes a single control model with a new definition of control that applies to all entities. The changes will require management to make significant judgement to determine which entities are controlled and therefore required to be consolidated by the parent. Therefore, IFRS 10 may change which entities are within a Group.
IFRS 11 replaces IAS 31 Interest in Joint Ventures and SIC 13 Jointly Controlled Entities – Non-monetary Contributions by Ventures. IFRS 11 uses some of the terms that were used in IAS 31 but with different meanings which may create some confusion as to whether there are significant changes. IFRS 11 focuses on the nature of the rights and obligations arising from the arrangement compared to the legal form in IAS 31. IFRS 11 uses the principle of control in IFRS 10 to determine joint control which may change whether joint control exists. IFRS 11 addresses only two forms of joint arrangements; joint operations where the entity recognises its assets, liabilities, revenues and expenses and/or its relative share of those items and joint ventures which is accounted for on the equity method (no more proportional consolidation).
IFRS 12 includes all the disclosures that were previously required relating to an entity’s interests in subsidiaries, joint arrangements, associates and structured entities as well as a number of new disclosures. An entity is now required to disclose the judgements made to determine whether it controls another entity.
The Group will need to consider the new definition of control to determine which entities are controlled or jointly controlled and then to account for them under the new standards. IFRS 10, 11 and 12 will be effective for the Group from 1 July 2013.
annualreport 2011
Notes to the Consolidated Financial Statements (continued)
IFRS 13 Fair Value Measurement
IFRS 13 establishes a single framework for all fair value measurement (financial and non-financial assets and liabilities) when fair value is required or permitted by IFRS. IFRS 13 does not change when an entity is required to use fair value but rather describes how to measure fair value under IFRS when it is permitted or required by IFRS. There are also consequential amendments to other standards to delete specific requirements for determining fair value. The Group will need to consider the new requirements to determine fair values going forward. IFRS 13 will be effective for the Group 1 July 2013.
IFRIC 14 Prepayments of a minimum funding requirement (Amendment)
The amendment to IFRIC 14 is effective for annual periods beginning on or after 1 January 2011 with retrospective application. The amendment corrects an unintended consequence of IFRIC 14, ‘IAS 19 – The limit on a defined benefit asset, minimum funding requirements and their interaction’. Without the amendments, entities are not permitted to recognise as an asset some voluntary prepayments for minimum funding contributions. The amendment provides guidance on assessing the recoverable amount of a net pension asset. The amendment permits an entity to treat the prepayment of a minimum funding requirement as an asset. The amendment is deemed to have no impact on the financial statements of the Group.
Improvements to IFRSs (issued in 2010)
The following summarises the six amendments included that will be effective for June 2012 year end:
• IFRS 1 First-time Adoption of International Financial Reporting Standards
• Accounting policy changes in the year of adoption - The amendment clarifies that, if a first-time adopter changes its accounting policies or its use of the exemptions in IFRS 1 after it has published an interim financial report in accordance with IAS 34 Interim Financial Reporting, it has to explain those changes and update the reconciliations between previous GAAP and IFRS.
• Revaluation basis as deemed cost - The amendment allows first-time adopters to use an event-driven fair value as deemed cost, even if the event occurs after the date of transition, but before the first IFRS financial statements are issued. When such re-measurement occurs after the date of transition to IFRS, but during the period covered by its first IFRS financial statements the adjustment is recognised directly in retained earnings (or if appropriate, another category of equity).
• IFRS 7 Financial Instruments Disclosures
• The amendment clarifies disclosures by emphasizing the interaction between quantitative and qualitative disclosures and nature and extent of risks associated with financial instruments.
• IAS 1 Presentation of Financial Statements - Clarification of statement of changes in equity
• The amendment clarifies that an entity will present an analysis of other comprehensive income for each component of equity, either in the statement of changes in equity or in the notes to the financial statements. The amendment is applied retrospectively.
• IFRIC 13 Customer Loyalty Programmes - Fair value of award credit• The amendment clarifies that when the fair value of award credits is measured based on the value of the awards for which they could
be redeemed, the amount of discounts or incentives otherwise granted to customers not participating in the award credit scheme is to be taken into account. The amendment is applied retrospectively.
• IAS 34 Interim Financial Statements - Significant events and transactions
• The amendment provides guidance to illustrate how to apply disclosure principles in IAS 34 and add disclosure requirements around circumstances likely to affect fair values of financial instruments and their classification.
2.7 Business Combinations
Business combinations from 1 July 2009
Business combinations are accounted for using the acquisition method. The cost of an acquisition is measured as the aggregate of the consideration transferred, measured at acquisition date fair value and the amount of any non-controlling interest in the acquiree. For each business combination, the acquirer measures the non-controlling interest in the acquiree either at fair value or at the proportionate share of the acquiree’s identifiable net assets. Acquisition costs incurred are expensed and included in administrative expenses.
When the Group acquires a business, it assesses the financial assets and liabilities assumed for appropriate classification and designation in accordance with the contractual terms, economic circumstances and pertinent conditions as at the acquisition date. This includes the separation of embedded derivatives in host contracts by the acquiree.
If the business combination is achieved in stages, the acquisition date fair value of the acquirer’s previously held equity interest in the acquiree is remeasured to fair value at the acquisition date through profit or loss.
annualreport 2011
Notes to the Consolidated Financial Statements (continued)
Any contingent consideration to be transferred by the acquirer will be recognised at fair value at the acquisition date. Subsequent changes to the fair value of the contingent consideration which is deemed to be an asset or liability will be recognised in accordance with IAS 39 either in profit or loss or as a change to other comprehensive income. If the contingent consideration is classified as equity, it should not be remeasured until it is finally settled within equity.
Goodwill is initially measured at cost being the excess of the aggregate of the consideration transferred and the amount recognised for non-controlling interest over the net identifiable assets acquired and liabilities assumed. If this consideration is lower than the fair value of the net assets of the subsidiary acquired, the difference is recognised in profit or loss.
After initial recognition, goodwill is measured at cost less any accumulated impairment losses. For the purpose of impairment testing, goodwill acquired in a business combination is, from the acquisition date, allocated to each of the Group’s cash generating units that are expected to benefit from the combination, irrespective of whether other assets or liabilities of the acquiree are assigned to those units.
Where goodwill forms part of a cash-generating unit and part of the operation within that unit is disposed of, the goodwill associated with the operation disposed of is included in the carrying amount of the operation when determining the gain or loss on disposal of the operation. Goodwill disposed of in this circumstance is measured based on the relative values of the operation disposed of and the portion of the cash-generating unit retained.
Business combinations prior to 1 July 2009
In comparison to the above-mentioned requirements, the following differences applied:
Business combinations were accounted for using the purchase method. Transaction costs directly attributable to the acquisition formed part of the acquisition costs. The non-controlling interest (formerly known as minority interest) was measured at the proportionate share of the acquiree’s identifiable net assets.
Business combinations achieved in stages were accounted for as separate steps. Any additional acquired share of interest did not affect previously recognised goodwill.
When the Group acquired a business, embedded derivatives separated from the host contract by the acquire were not reassessed on acquisition unless the business combination resulted in a change in the terms of the contract that significantly modified the cash flows that otherwise would have been required under the contract.
Contingent consideration was recognised if, and only if, the Group had a present obligation, the economic outflow was more likely than not and a reliable estimate was determinable. Subsequent adjustments to the contingent consideration were recognised as part of goodwill.
2.8 Investments in associates
The Group’s investment in its associate is accounted for using the equity method. An associate is an entity in which the Group has significant influence.
Under the equity method, the investment in the associate is carried in the statement of financial position at cost plus post acquisition changes in the Group’s share of net assets of the associate. Goodwill relating to the associate is included in the carrying amount of the investment and is neither amortised nor individually tested for impairment.
The statement of comprehensive income reflects the share of the results of operations of the associate. Where there has been a change recognised directly in the equity of the associate, the Group recognises its share of any changes and discloses this, when applicable, in the statement of changes in equity. Unrealised gains and losses resulting from transactions between the Group and the associate are eliminated to the extent of the interest in the associate.
The share of profit of an associate is shown on the face of the statement of comprehensive income. This is the profit attributable to equity holders of the associate and therefore is profit after tax and non-controlling interests in the subsidiaries of the associate.
The financial statements of the associate are prepared for the same reporting period as the Group. Where necessary, adjustments are made to bring the accounting policies in line with those of the Group.
After application of the equity method, the Group determines whether it is necessary to recognise an additional impairment loss on the Group’s investment in its associate. The Group determines at each reporting date whether there is any objective evidence that the investment in the associate is impaired. If this is the case the Group calculates the amount of impairment as the difference between the recoverable amount of the associate and its carrying value and recognises the amount in the ‘share of profit of an associate’ in profit or loss.
Upon loss of significant influence over the associate, the Group measures and recognises any retaining investment at its fair value. Any difference between the carrying amount of the associate upon loss of significant influence and the fair value of the retaining investment and proceeds from disposal is recognized in profit or loss.
annualreport 2011
Notes to the Consolidated Financial Statements (continued)
2.9 Foreign currency translation
The Group’s financial statements are presented in United States Dollars (US$) (see 2.2), which is the Group’s functional and presentation currency. Each entity in the Group determines its own functional currency and items included in the financial statements of each entity are measured using that functional currency.
In preparing the financial statements of the individual entities, transactions in currencies other than the entity’s functional currency (foreign currencies) are recognised at the rates of exchange prevailing at the dates of the transactions. At the end of each reporting period, monetary items denominated in foreign currencies are retranslated at the rates prevailing at that date. Non-monetary items carried at fair value that are denominated in foreign currencies are retranslated at the rates prevailing at the date when the fair value was determined. Non-monetary items that are measured in terms of historical cost in a foreign currency are not retranslated.
Exchange differences are recognised in profit or loss in the period in which they arise.
For the purpose of presenting consolidated financial statements, the assets and liabilities of the Group’s foreign operations are expressed in United States Dollars using exchange rates prevailing at the end of the reporting period. Income and expense items are translated at the average exchange rates for the period, unless exchange rates fluctuated significantly during that period, in which case the exchange rates at the dates of the transactions are used. Exchange differences arising, if any, are recognised in other comprehensive income and accumulated in equity (attributed to non-controlling interests as appropriate). Upon disinvestment of a foreign entity, translation differences related to that entity are recycled into profit or loss.
2.10 Taxes
Income tax expense represents the sum of the tax currently payable and deferred tax.
2.10.1 Current income tax
The tax currently payable is based on taxable profit for the year. Taxable profit differs from profit as reported in the consolidated statement of comprehensive income because of items of income or expense that are taxable or deductible in other years and items that are never taxable or deductible.
Current income tax relating to items recognized directly in other comprehensive income or equity is recognized in other comprehensive income or equity and not in profit or loss for the period. Management periodically evaluates positions taken in the tax returns with respect to situations in which applicable tax regulations are subject to interpretation and establishes provisions where appropriate.
Current tax assets and liabilities for the current and prior periods are measured at the amount expected to be recovered from or paid to the taxation authorities. The tax rates and tax laws used to compute the amount are those that are enacted or substantively enacted by the end of the reporting period in countries where the Group operates and generates taxable income.
2.10.2 Deferred income tax
Deferred income tax is provided using the liability method on all temporary differences at the reporting date between the tax base of assets or liabilities and their carrying amounts in the statement of financial position for financial reporting purposes. Deferred income tax liabilities are recognised for all taxable temporary differences, except:
• where the deferred income tax liability arises from the initial recognition of goodwill or of an asset or liability in a transaction that is not a business combination and, at the time of the transaction, affects neither the accounting profit nor taxable profit or loss; and
• in respect of taxable temporary differences associated with investments in subsidiaries, associates and interests in joint ventures, where the timing of the reversal of the temporary differences can be controlled and it is probable that the temporary differences will not reverse in the foreseeable future.
Deferred income tax assets are recognised for all deductible temporary differences, carry forward of unused tax credits and unused tax losses, to the extent that it is probable that taxable profit will be available against which the deductible temporary differences, and the carry forward of unused tax credits and unused tax losses can be utilised except:
• where the deferred income tax asset relating to the deductible temporary difference arises from the initial recognition of an asset or liability in a transaction that is not a business combination and, at the time of the transaction, affects neither the accounting profit nor taxable profit or loss; and
• in respect of deductible temporary differences associated with investments in subsidiaries, associates and interests in joint ventures, deferred income tax assets are recognised only to the extent that it is probable that the temporary differences will reverse in the foreseeable future and taxable profit will be available against which the temporary differences can be utilised.
The carrying amount of deferred income tax assets is reviewed at the end of each reporting period and reduced to the extent that it is no longer probable that sufficient taxable profit will be available to allow all or part of the deferred income tax asset to be utilised. Unrecognised deferred income tax assets are reassessed at the end of each reporting period and are recognised to the extent that it has become probable that future taxable profit will allow the deferred tax asset to be recovered.
annualreport 2011
Notes to the Consolidated Financial Statements (continued)
Deferred taxation is recognised in profit or loss except to the extent that it relates to items that are recognized outside profit or loss (whether in other comprehensive income or directly in equity), in which case tax is also recognized outside of profit or loss.
Deferred taxation relating to tax losses carried forward is recognised to the extent that it is probable that future taxable profit will be available against which the unused tax losses can be utilised.
Deferred income tax assets and liabilities are measured at the tax rates that are expected to apply to the year when the asset is realised or the liability is settled, based on tax rates (and tax laws) that have been enacted or substantively enacted at the end of the reporting period.
Deferred income tax assets and deferred income tax liabilities are offset, only if a legally enforceable right exists to set off current tax assets against current income tax liabilities and the deferred income taxes relate to the same taxable entity and the same taxation authority.
2.10.3 Value Added Tax (VAT)
Revenues, expenses and assets are recognised net of the amount of VAT except:
• Where the VAT incurred on a purchase of assets or services is not recoverable from the tax authorities, in which case the VAT is recognised as part of the cost of acquisition of the asset or as part of the expense item as applicable; and
• receivables and payables that are stated with the amount of VAT included. The net amount of VAT recoverable from, or payable to, the taxation authority is included as part of receivables or payables in the statement of financial position.
2.11 Non-current assets held for sale and discontinued operations
Non-current assets and disposal groups classified as held for sale are measured at the lower of their varying amounts and fair value less costs to sell. Non-current assets and disposal groups are classified as held for sale if their carrying amounts will be recovered principally through a sale transaction rather than through continuing use. This condition is regarded as met only when the sale is highly probable and the asset or disposal group is available for immediate sale in its present condition. Management must be committed to the sale, which should be expected to qualify for recognition as a completed sale within one year from the date of classification.
In the consolidated statement of comprehensive income of the reporting period and the comparable period of the previous year, income and expenses from discontinued operations are reported separately from income and expenses from continuing operations, down to the level of profit after taxes, even when the Group retains a non-controlling interest in the subsidiary after sale. The resulting profit or loss (after taxes) is reported separately in the statement of comprehensive income.
Property, plant and equipment and intangible assets once classified as held for sale are not depreciated or amortised.
2.11 Inventories
Inventories are stated at the lower of cost and estimated net realisable value. In general, cost is determined on a “first in, first-out” or weighted average cost basis. In the case of manufactured goods, cost includes materials, attributable direct labour and an appropriate proportion of production overheads.
Net realisable value is the estimated selling price in the ordinary course of business, less estimated costs of completion and the estimated costs necessary to make the sale.
2.12 Leases
The determination of whether an arrangement is, or contains a lease is based on the substance of the arrangement at inception date of whether the fulfillment of the arrangement is dependent on the use of a specific asset or assets or the arrangement conveying the right to use the asset.
Leases are classified as finance leases whenever the terms of the lease transfer substantially all the risks and rewards of ownership to the lessee. All other leases are classified as operating leases.
2.12.1 The Group as lessor
Rental income from operating leases is recognised on a straight-line basis over the term of the relevant lease. Initial direct costs incurred in negotiating and arranging an operating lease are added to the carrying amount of the leased asset and recognised on a straight-line basis over the lease term.
2.12.2 The Group as lessee
Finance leases which transfer to the Group substantially all the risks and benefits incidental to ownership of the leased item are capitalized at the commencement of the lease at the fair value of the leased property or, if lower, at the present value of the minimum lease payments. Lease payments are apportioned between finance charges and reduction of the lease liability so as to achieve a constant rate of interest on the remaining balance of the liability. Finance charges are recognized in finance costs in profit or loss.
annualreport 2011
Notes to the Consolidated Financial Statements (continued)
A capitalised leased asset is depreciated over the useful life of the asset. However, if there is no reasonable certainty that the Group will obtain ownership by the end of the lease term, the asset is depreciated over the shorter of the estimated useful life of the asset and the lease term.
Operating lease payments are recognised as an expense on a straight-line basis over the lease term, except where another systematic basis is more representative of the time pattern in which economic benefits from the leased asset are consumed.
2.13 Provisions
Provisions are recognised when the Group has a present obligation (legal or constructive) as a result of a past event, it is probable that the Group will be required to settle the obligation, and a reliable estimate can be made of the amount of the obligation.
The amount recognised as a provision is the best estimate of the consideration required to settle the present obligation at the end of the reporting period, taking into account the risks and uncertainties surrounding the obligation. Where a provision is measured using the cash flows estimated to settle the present obligation, its carrying amount is the present value of those cash flows.
When some or all of the economic benefits required to settle a provision are expected to be recovered from a third party, a receivable is recognised as an asset if it is virtually certain that reimbursement will be received and the amount of the receivable can be measured reliably.
2.14 Retirement benefits
Retirement benefits are provided for eligible Group employees through various independently administered defined contribution schemes, including the National Social Security Authority.
Contributions to these funds are recognised as an expense in the period to which employees’ services relate.
2.15 Property, plant and equipment
All items of property, plant and equipment are shown at cost less accumulated depreciation and accumulated impairment losses, if any. Cost includes expenditures that are directly attributable to the acquisition of the asset.
Land is carried at cost whereas buildings are carried at cost less accumulated depreciation and accumulated impairment losses.
The assets’ residual values and useful lives are reviewed, and adjusted if appropriate, at the end of each reporting period.
No depreciation is provided on land or capital work-in-progress. Depreciation commences when the asset is available for use. Other fixed assets are depreciated on a straight line basis, at such rates as are considered appropriate to reduce their book values to residual values over their estimated useful lives, as follows:
Buildings 40 yearsProductive plant and machinery 8 - 20 yearsAncillary machinery, equipment and furniture 5 - 10 yearsMotor vehicles 5 - 10 years
The assets’ residual values, useful lives and methods of depreciation are reviewed at each financial year end and adjusted prospectively if appropriate.
The carrying values of plant and equipment are reviewed for impairment when events or changes in circumstances indicate that the carrying value may not be recoverable in full.
An item of property, plant and equipment is derecognised upon disposal or when no future economic benefits are expected from its use or disposal. Any gain or loss arising on derecognition of the asset (calculated as the difference between the net disposal proceeds and the carrying amount of the asset) is included in profit or loss in the year the asset is derecognised.
2.16 Revenue recognition
Revenue is recognised to the extent that it is probable that the economic benefits will flow to the Group and the revenue can be reliably measured. Revenue is measured at the fair value of the consideration received/receivable net of discounts, rebates, VAT and other sales taxes or duty. Intra-group revenue, which arises in the normal course of business is excluded from revenue. The following specific recognition criteria must also be met before revenue is recognised:
2.16.1 Sale of goods
Revenue from the sale of goods is recognised when the significant risks and rewards of ownership of the goods have passed to the buyer, usually on delivery of the goods.
2.16.2 Rental income
Rental income arising from operating leases on properties is accounted for on a straight line basis over the lease terms.
annualreport 2011
Notes to the Consolidated Financial Statements (continued)
2.16.3 Dividend and interest revenue
Dividend revenue from investments is recognised when the shareholder’s right to receive payment has been established (provided that it is probable that the economic benefits will flow to the Group and the amount of revenue can be measured reliably).
Interest revenue is recognised when it is probable that the economic benefits will flow to the Group and the amount of revenue can be measured reliably. Interest revenue is accrued on a time basis, by reference to the principal outstanding and at the effective interest rate applicable, which is the rate that exactly discounts estimated future cash receipts through the expected life of the financial asset to that asset’s net carrying amount on initial recognition.
2.17 Borrowing costs
Borrowing costs that are directly attributable to the acquisition, construction or production of a qualifying asset shall be capitalized as part of the cost of that asset. A qualifying asset is an asset that necessarily takes a substantial period of time to get ready for its intended use or sale.
All other borrowing costs are recognized in profit or loss in the period in which they are incurred. Borrowing costs consist of interest and other costs that an entity incurs in connection with the borrowing of funds.
The Group capitalises borrowing costs for all eligible assets where construction was commenced on or after 1 January 2009. The Group continues to expense borrowing costs relating to construction projects that commenced prior to 1 January 2009.
2.18 Impairment of non financial assets
The Group assesses at each reporting date whether there is an indication that an asset may be impaired. If any such indication exists, or when annual impairment testing for an asset is required, the Group makes an estimate of the asset’s recoverable amount. An asset’s recoverable amount is the higher of an asset’s or cash-generating unit’s fair value less costs to sell and its value in use and is determined for an individual asset, unless the asset does not generate cash inflows that are largely independent of those from other assets or groups of assets. Where the carrying amount of an asset exceeds its recoverable amount, the asset is considered impaired and is written down to its recoverable amount. In assessing value in use, the estimated future cash flows are discounted to their present value using a pre-tax discount rate that reflects current market assessments of the time value of money and the risks specific to the asset. In determining fair value less costs to sell, an appropriate valuation model is used.
Impairment losses of continuing operations are recognised in profit or loss in those expense categories consistent with the function of the impaired asset.
An assessment is made at each reporting date as to whether there is any indication that previously recognised impairment losses may no longer exist or may have decreased. If such indication exists, the Group makes an estimate of recoverable amount. A previously recognised impairment loss is reversed only if there has been a change in the estimates used to determine the asset’s recoverable amount since the last impairment loss was recognised. If that is the case the carrying amount of the asset is increased to its recoverable amount. That increased amount cannot exceed the carrying amount that would have been determined, net of depreciation, had no impairment loss been recognised for the asset in prior years. Such reversal is recognised in profit or loss. After the reversal depreciation charge is adjusted in future periods to allocate the revised carrying amount, less any residual value, on a systematic basis over the remaining useful life.
2.19 Financial assets
The Group’s financial assets include trade and other accounts receivable, cash and cash equivalent, quoted investments and derivative financial instruments.
Financial assets in the scope of IAS 39 are classified as either financial assets at fair value through profit or loss and loans and receivables as appropriate. When financial assets are recognised initially, they are measured at fair value, plus, in the case of investments not at fair value through profit or loss, directly attributable transaction costs. The Group determines the classification of its financial assets on initial recognition and, where allowed and appropriate, re-evaluates this designation at each financial year-end.
All regular purchases and sales of financial assets are recognised on the trade date i.e. the date that the Group commits to purchase the asset. Regular purchases or sales are purchases or sales of financial assets that require delivery of assets within the period generally established by regulation or convention in the marketplace.
2.19.1 Effective interest method
The effective interest method is a method of calculating the amortised cost of a debt instrument and of allocating interest income over the relevant period. The effective interest rate is the rate that exactly discounts estimated future cash receipts (including all fees on points paid or received that form an integral part of the effective interest rate, transaction costs and other premiums or discounts) through the expected life of the debt instrument, or (where appropriate) a shorter period, to the net carrying amount on initial recognition.
Income is recognised on an effective interest basis for debt instruments other than those financial assets classified as at fair value through profit and loss.
annualreport 2011
Notes to the Consolidated Financial Statements (continued)
2.19.2 Financial assets at fair value through profit or loss [FVTPL]
Financial assets at fair value through profit or loss includes financial assets held for trading and financial assets designated upon initial recognition as at fair value through profit and loss. A financial asset is classified as held for trading if:
• it has been acquired principally for the purpose of selling it in the near term; or
• on initial recognition it is part of a portfolio of identified financial instruments that the Group manages together and has a recent actual pattern of short-term profit-taking; or
• it is a derivative that is not designated and effective as a hedging instrument.
Financial assets may be designated at initial recognition as at fair value through profit or loss if the following criteria are met:
• the designation eliminates or significantly reduces the inconsistent treatment that would otherwise arise from measuring the assets or recognising gains or losses on them on a different basis; or
• the assets are part of a group of financial assets which are managed and their performance evaluated on a fair value basis, in accordance with a documented risk management strategy.
The fair value of investments that are actively traded in organised financial markets is determined by reference to quoted market bid price at the close of business on the last day of the reporting period. For investments where there is no active market, fair value is determined using valuation techniques. Such techniques include using recent arm’s length market transactions (reference to the current market value of another instrument, which is substantially the same) discounted cash flow analysis and option pricing models.
Financial assets at FVTPL are stated at fair value, with any gains or losses arising on remeasurement recognised in profit or loss. The net gain or loss recognised in profit or loss incorporates any dividend or interest earned on the financial asset. Fair value is determined in the manner described in note 24.
2.19.3 Loans and receivables
Loans and receivables are financial assets with fixed or determinable payments that are not quoted in an active market. Such assets are measured at fair value on initial recognition, and are subsequently carried at amortised cost using the effective interest rate method, less any impairment losses if any. Gains and losses are recognised in income when the loans and receivables are derecognised or impaired, as well as through the amortisation process.
2.19.4 Cash and cash equivalents
Cash and cash equivalents comprise cash at banks and in hand and short term deposits with an original maturity of three months or less and are measured at amortised cost.
For the purpose of the consolidated statement of cash flows, cash and cash equivalents consist of cash on hand and deposits in banks, net of bank overdrafts and short term borrowings.
2.19.5 Impairment of financial assets
Financial assets, other than those at FVTPL, are assessed for indicators of impairment at the end of each reporting period. Financial assets are considered to be impaired when there is objective evidence that, as a result of one or more events that occurred after the initial recognition of the financial asset, the estimated future cash flows of the investment have been affected. Objective evidence of impairment could include:
• significant financial difficulty of the issuer or counterparty; or
• default or delinquency in interest or principal payments; or
• it becoming probable that the borrower will enter bankruptcy or financial re-organisation.
For financial assets carried at amortised cost, the amount of the impairment loss recognised is the difference between the asset’s carrying amount and the present value of estimated future cash flows, discounted at the financial asset’s original effective interest rate.
The carrying amount of the financial asset is reduced by the impairment loss directly for all financial assets with the exception of trade receivables, where the carrying amount is reduced through the use of an allowance account. When a trade receivable is considered uncollectible, it is written off against the allowance account. Subsequent recoveries of amounts previously written off are credited against the allowance account. Changes in the carrying amount of the allowance account are recognised in profit or loss.
If, in a subsequent period, the amount of the impairment loss decreases and the decrease can be related objectively to an event occurring after the impairment was recognised, the previously recognised impairment loss is reversed through profit or loss to the extent that the carrying amount of the financial asset at the date the impairment is reversed does not exceed what the amortised cost would have been had the impairment not been recognised.
annualreport 2011
Notes to the Consolidated Financial Statements (continued)
2.19.6 Derecognition of financial assets
The Group derecognises a financial asset only when the contractual rights to the cash flows from the asset expire, or when it transfers the financial asset and substantially all the risks and rewards of ownership of the asset to another entity. If the Group neither transfers nor retains substantially all the risks and rewards of ownership and continues to control the transferred asset, the Group recognises its retained interest in the asset and an associated liability for amounts it may have to pay. If the Group retains substantially all the risks and rewards of ownership of a transferred financial asset, the Group continues to recognise the financial asset and also recognises a collateralised borrowing for the proceeds received.
2.20 Financial liabilities
2.20.1 Classification of financial liabilities
Financial liabilities are classified as other financial liabilities. The Group’s financial liabilities include trade and other accounts payable, bank overdraft and interest bearing loans, and these are initially measured at fair value including transaction costs and subsequently amortised cost. Gains or losses are recognised in profit or loss when the liabilities are derecognised as well as through the amortisation process.
2.20.2 Derecognition of financial liabilities
The Group derecognises financial liabilities when, and only when, the Group’s obligations are discharged, cancelled or they expire.
2.21 Derivative financial instruments and hedge accounting
Initial recognition and subsequent measurement
The Group uses derivative financial instruments such as forward currency contracts and interest rate swaps to hedge its foreign market risks and interest risks respectively. Such derivative financial instruments are initially recognised at fair value on the date on which a derivative contract is entered into and are subsequently remeasured at fair value. Derivatives are carried as financial assets when the fair value is positive and as financial liabilities when the fair value is negative.
Any gains or losses arising from changes in fair value on derivatives during the year that do not qualify for hedge accounting and the ineffective portion of an effective hedge, are taken directly to profit or loss.
The fair value of forward currency contracts is the difference between the forward exchange rate and the contract rate. The forward exchange rate is referenced to current forward exchange rates for contracts with similar maturity profiles. The fair value of interest rate swap contracts is determined by reference to market values for similar instruments.
3 KEY ESTIMATES, UNCERTAINTIES AND JUDGEMENTS
The following are the critical judgments that the directors have made in the process of applying the entity’s accounting policies and that have the most significant effect on the amounts recognised in the consolidated financial statements.
3.1 Useful lives and residual values of property, plant and equipment
The Group assesses useful lives and residual values of property, plant and equipment each year taking into consideration past experience, technology changes and the local operating environment. The useful lives are set out in note 2.13 and no changes to those useful lives have been considered necessary during the year. Residual values will be reassessed each year and adjustments for depreciation will be done in future periods if there is indication of impairment in value. The carrying amount of the Group’s property, plant and equipment is US$33 266 170 (June 2010: US$ 34,288,277).
3.2 Allowance for credit losses
Allowance for credit losses is a specific provision made for trade receivables which is reviewed on a monthly basis. In determining the recoverability of a trade receivable the Group considers any change in the credit quality of the trade receivable from the date the credit was initially granted up to the end of the reporting period as well as the value of security held over that receivable. The carrying amount of the Group’s allowance for credit losses as at 30 June 2011 was US$ 1 795 150 (June 2010: US$ 1,096,358).
annualreport 2011
Notes to the Consolidated Financial Statements (continued)
2011 2010 US$ US$ 4. REVENUE The following is an analysis of the Group’s revenue for the year
Revenue from the sale of goods 200,607,392 160,219,154 Revenue from rental income 562,184 599,061 201,169,576 160,818,215
5. PROFIT FROM OPERATING ACTIVITIES Profit from operating activities is arrived at after taking into account the following:
5.1. Other income Profit on disposal of property, plant and equipment 358,047 3,972,042 Commissions and rebates 190,240 405,629 Lease of assets, toll, handling and other services rendered 67,369 158,526 Sale of scrap 48,125 80,604 Insurance and recoveries 92,178 - 755,959 4,616,801 5.2. After charging the following Employee benefits expenses Salaries and wages 8,274,094 10,571,109 Post employment benefits: Defined contribution plans 820,913 680,942 Retrenchment gratuities 1,020,000 706,759 Administrative expenses Audit fees and expenses 89,896 58,167 Foreign exchange (gains)/losses (32,758 ) 57,424 Profit on disposal of listed investments - 27,244 Impairment losses recognised on receivables 698,792 830,780
5.3. Depreciation - buildings 479,452 483,149 - plant, machinery and equipment 728,016 562,535 - motor vehicles 387,148 403,432 1,594,616 1,449,116
5.4. Finance costs Interest paid - bank overdrafts and other short term borrowings (1,300,212 ) (1,497,201 ) Interest received from short term investments 748,879 299,103 (551,333 ) (1,198,098 ) 6. TAXATION6.1. Income tax recognised in profit or loss Income tax - on current profits at normal rates 1,208,669 (715,344 ) - capital gains tax 169,244 - Deferred tax relating to current temporary differences 829,354 57,671 Effect on deferred tax of change in statutory tax rate - (1,621,128 ) 2,207,267 (2,278,801 )
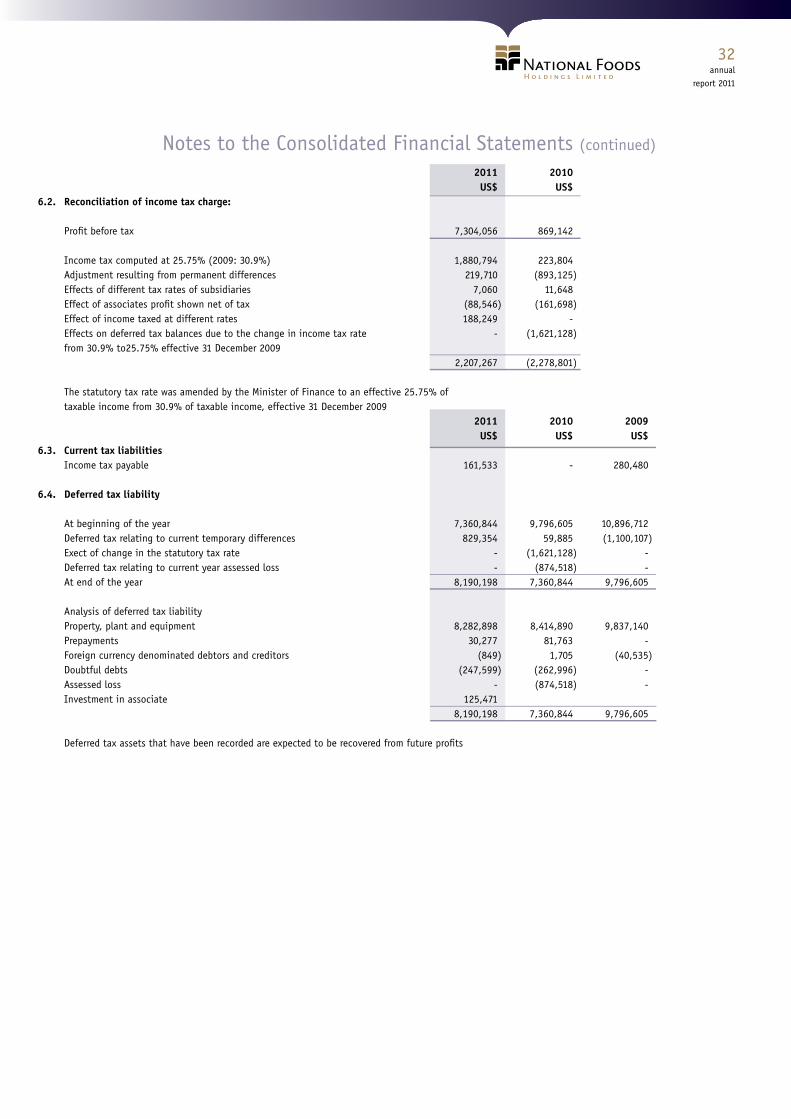
annualreport 2011
Notes to the Consolidated Financial Statements (continued)
2011 2010 US$ US$ 6.2. Reconciliation of income tax charge:
Profit before tax 7,304,056 869,142
Income tax computed at 25.75% (2009: 30.9%) 1,880,794 223,804 Adjustment resulting from permanent differences 219,710 (893,125 ) Effects of different tax rates of subsidiaries 7,060 11,648 Effect of associates profit shown net of tax (88,546 ) (161,698 ) Effect of income taxed at different rates 188,249 - Effects on deferred tax balances due to the change in income tax rate - (1,621,128 ) from 30.9% to25.75% effective 31 December 2009 2,207,267 (2,278,801 )
The statutory tax rate was amended by the Minister of Finance to an effective 25.75% of taxable income from 30.9% of taxable income, effective 31 December 2009 2011 2010 2009 US$ US$ US$6.3. Current tax liabilities Income tax payable 161,533 - 280,480
6.4. Deferred tax liability
At beginning of the year 7,360,844 9,796,605 10,896,712 Deferred tax relating to current temporary differences 829,354 59,885 (1,100,107 ) Exect of change in the statutory tax rate - (1,621,128 ) - Deferred tax relating to current year assessed loss - (874,518 ) - At end of the year 8,190,198 7,360,844 9,796,605
Analysis of deferred tax liability Property, plant and equipment 8,282,898 8,414,890 9,837,140 Prepayments 30,277 81,763 - Foreign currency denominated debtors and creditors (849 ) 1,705 (40,535 ) Doubtful debts (247,599 ) (262,996 ) - Assessed loss - (874,518 ) - Investment in associate 125,471 8,190,198 7,360,844 9,796,605 Deferred tax assets that have been recorded are expected to be recovered from future profits
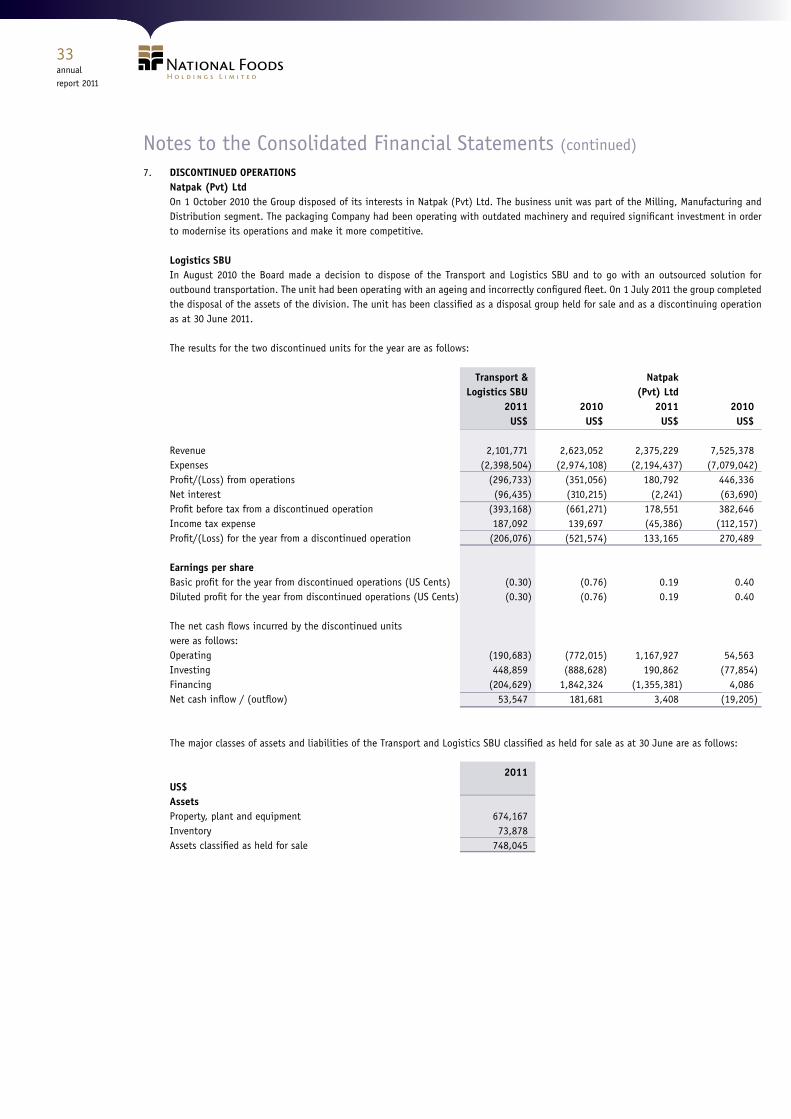
annualreport 2011
Notes to the Consolidated Financial Statements (continued)
7. DISCONTINUED OPERATIONS Natpak (Pvt) Ltd
On 1 October 2010 the Group disposed of its interests in Natpak (Pvt) Ltd. The business unit was part of the Milling, Manufacturing and Distribution segment. The packaging Company had been operating with outdated machinery and required significant investment in order to modernise its operations and make it more competitive.
Logistics SBUIn August 2010 the Board made a decision to dispose of the Transport and Logistics SBU and to go with an outsourced solution for outbound transportation. The unit had been operating with an ageing and incorrectly configured fleet. On 1 July 2011 the group completed the disposal of the assets of the division. The unit has been classified as a disposal group held for sale and as a discontinuing operation as at 30 June 2011.
The results for the two discontinued units for the year are as follows: Transport & Natpak Logistics SBU (Pvt) Ltd 2011 2010 2011 2010 US$ US$ US$ US$
Revenue 2,101,771 2,623,052 2,375,229 7,525,378 Expenses (2,398,504 ) (2,974,108 ) (2,194,437 ) (7,079,042 ) Profit/(Loss) from operations (296,733 ) (351,056 ) 180,792 446,336 Net interest (96,435 ) (310,215 ) (2,241 ) (63,690 ) Profit before tax from a discontinued operation (393,168 ) (661,271 ) 178,551 382,646 Income tax expense 187,092 139,697 (45,386 ) (112,157 ) Profit/(Loss) for the year from a discontinued operation (206,076 ) (521,574 ) 133,165 270,489
Earnings per share Basic profit for the year from discontinued operations (US Cents) (0.30 ) (0.76 ) 0.19 0.40 Diluted profit for the year from discontinued operations (US Cents) (0.30 ) (0.76 ) 0.19 0.40
The net cash flows incurred by the discontinued units were as follows: Operating (190,683 ) (772,015 ) 1,167,927 54,563 Investing 448,859 (888,628 ) 190,862 (77,854 ) Financing (204,629 ) 1,842,324 (1,355,381 ) 4,086 Net cash inflow / (outflow) 53,547 181,681 3,408 (19,205 )
The major classes of assets and liabilities of the Transport and Logistics SBU classified as held for sale as at 30 June are as follows:
2011 US$ Assets Property, plant and equipment 674,167 Inventory 73,878 Assets classified as held for sale 748,045
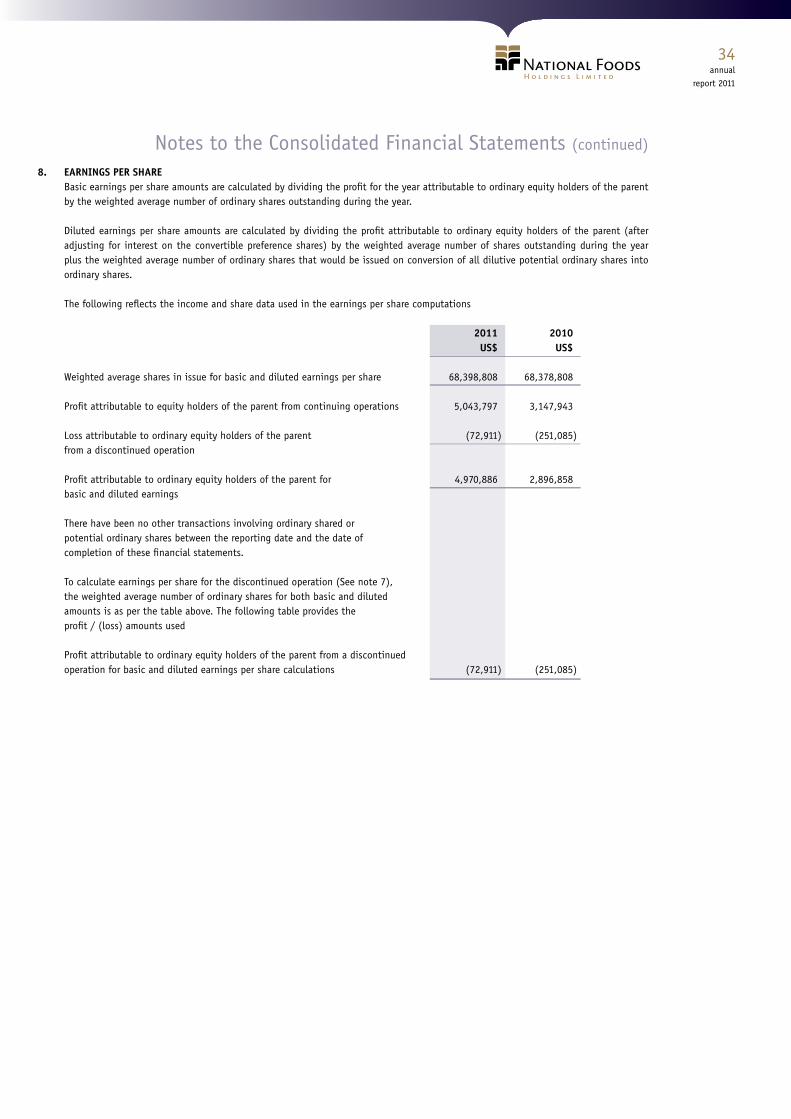
annualreport 2011
Notes to the Consolidated Financial Statements (continued)
8. EARNINGS PER SHAREBasic earnings per share amounts are calculated by dividing the profit for the year attributable to ordinary equity holders of the parent by the weighted average number of ordinary shares outstanding during the year.
Diluted earnings per share amounts are calculated by dividing the profit attributable to ordinary equity holders of the parent (after adjusting for interest on the convertible preference shares) by the weighted average number of shares outstanding during the year plus the weighted average number of ordinary shares that would be issued on conversion of all dilutive potential ordinary shares into ordinary shares.
The following reflects the income and share data used in the earnings per share computations
2011 2010 US$ US$
Weighted average shares in issue for basic and diluted earnings per share 68,398,808 68,378,808
Profit attributable to equity holders of the parent from continuing operations 5,043,797 3,147,943
Loss attributable to ordinary equity holders of the parent (72,911 ) (251,085 ) from a discontinued operation Profit attributable to ordinary equity holders of the parent for 4,970,886 2,896,858 basic and diluted earnings There have been no other transactions involving ordinary shared or potential ordinary shares between the reporting date and the date of completion of these financial statements.
To calculate earnings per share for the discontinued operation (See note 7), the weighted average number of ordinary shares for both basic and diluted amounts is as per the table above. The following table provides the profit / (loss) amounts used
Profit attributable to ordinary equity holders of the parent from a discontinued operation for basic and diluted earnings per share calculations (72,911 ) (251,085 )
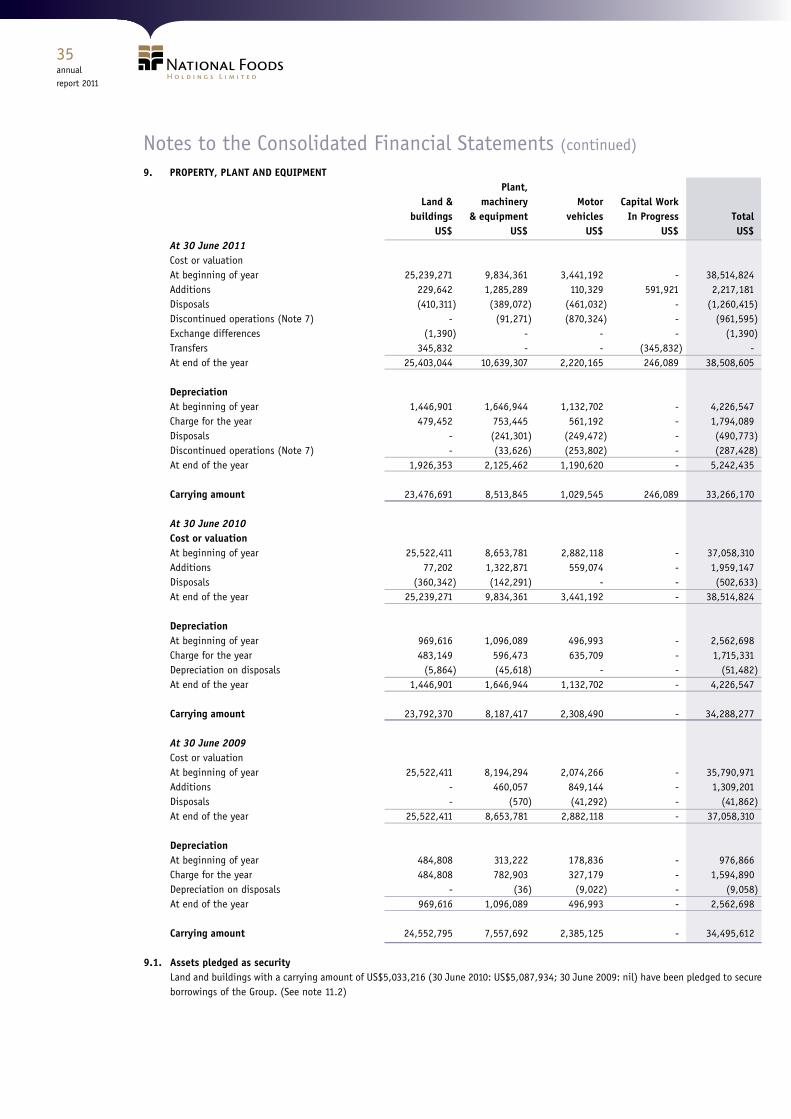
annualreport 2011
Notes to the Consolidated Financial Statements (continued)
9. PROPERTY, PLANT AND EQUIPMENT Plant, Land & machinery Motor Capital Work buildings & equipment vehicles In Progress Total US$ US$ US$ US$ US$ At 30 June 2011 Cost or valuation At beginning of year 25,239,271 9,834,361 3,441,192 - 38,514,824 Additions 229,642 1,285,289 110,329 591,921 2,217,181 Disposals (410,311 ) (389,072 ) (461,032 ) - (1,260,415 ) Discontinued operations (Note 7) - (91,271 ) (870,324 ) - (961,595 ) Exchange differences (1,390 ) - - - (1,390 ) Transfers 345,832 - - (345,832 ) - At end of the year 25,403,044 10,639,307 2,220,165 246,089 38,508,605 Depreciation At beginning of year 1,446,901 1,646,944 1,132,702 - 4,226,547 Charge for the year 479,452 753,445 561,192 - 1,794,089 Disposals - (241,301 ) (249,472 ) - (490,773 ) Discontinued operations (Note 7) - (33,626 ) (253,802 ) - (287,428 ) At end of the year 1,926,353 2,125,462 1,190,620 - 5,242,435 Carrying amount 23,476,691 8,513,845 1,029,545 246,089 33,266,170 At 30 June 2010 Cost or valuation At beginning of year 25,522,411 8,653,781 2,882,118 - 37,058,310 Additions 77,202 1,322,871 559,074 - 1,959,147 Disposals (360,342 ) (142,291 ) - - (502,633 ) At end of the year 25,239,271 9,834,361 3,441,192 - 38,514,824 Depreciation At beginning of year 969,616 1,096,089 496,993 - 2,562,698 Charge for the year 483,149 596,473 635,709 - 1,715,331 Depreciation on disposals (5,864 ) (45,618 ) - - (51,482 ) At end of the year 1,446,901 1,646,944 1,132,702 - 4,226,547 Carrying amount 23,792,370 8,187,417 2,308,490 - 34,288,277 At 30 June 2009 Cost or valuation At beginning of year 25,522,411 8,194,294 2,074,266 - 35,790,971 Additions - 460,057 849,144 - 1,309,201 Disposals - (570 ) (41,292 ) - (41,862 ) At end of the year 25,522,411 8,653,781 2,882,118 - 37,058,310 Depreciation At beginning of year 484,808 313,222 178,836 - 976,866 Charge for the year 484,808 782,903 327,179 - 1,594,890 Depreciation on disposals - (36 ) (9,022 ) - (9,058 ) At end of the year 969,616 1,096,089 496,993 - 2,562,698 Carrying amount 24,552,795 7,557,692 2,385,125 - 34,495,612
9.1. Assets pledged as securityLand and buildings with a carrying amount of US$5,033,216 (30 June 2010: US$5,087,934; 30 June 2009: nil) have been pledged to secure borrowings of the Group. (See note 11.2)
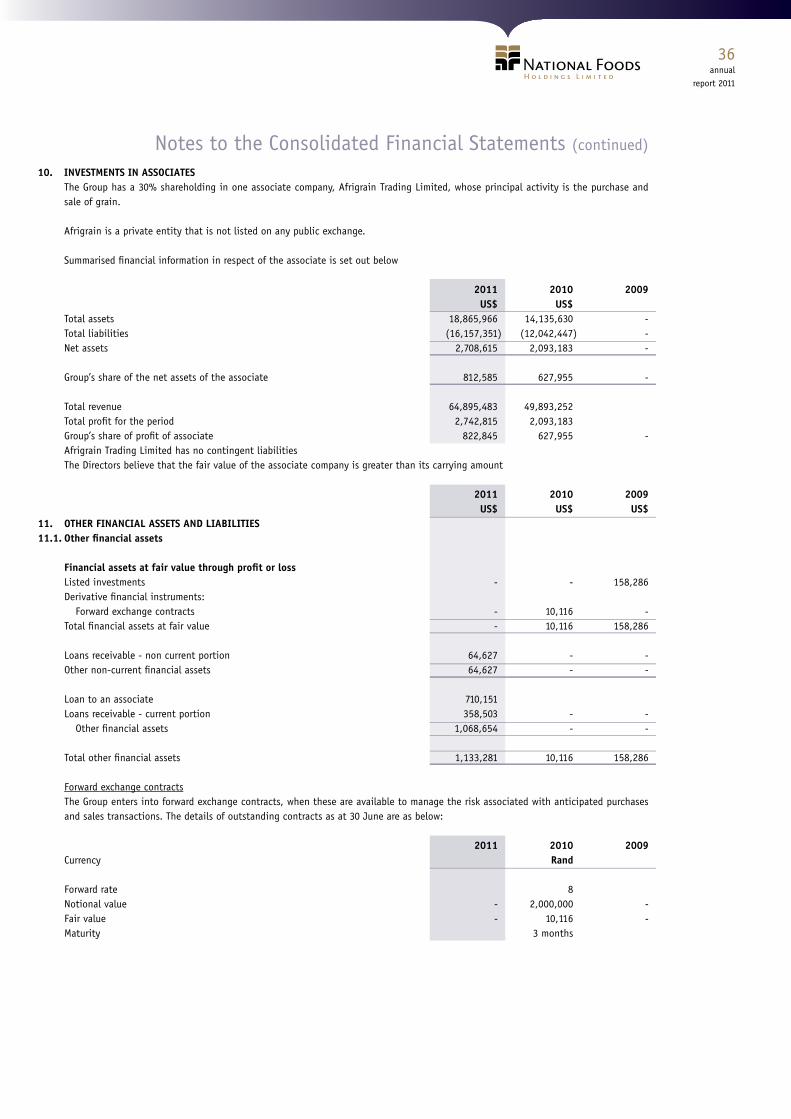
annualreport 2011
Notes to the Consolidated Financial Statements (continued)
10. INVESTMENTS IN ASSOCIATES The Group has a 30% shareholding in one associate company, Afrigrain Trading Limited, whose principal activity is the purchase and sale of grain.
Afrigrain is a private entity that is not listed on any public exchange.
Summarised financial information in respect of the associate is set out below
2011 2010 2009 US$ US$ Total assets 18,865,966 14,135,630 - Total liabilities (16,157,351 ) (12,042,447 ) - Net assets 2,708,615 2,093,183 - Group’s share of the net assets of the associate 812,585 627,955 - Total revenue 64,895,483 49,893,252 Total profit for the period 2,742,815 2,093,183 Group’s share of profit of associate 822,845 627,955 - Afrigrain Trading Limited has no contingent liabilities The Directors believe that the fair value of the associate company is greater than its carrying amount 2011 2010 2009 US$ US$ US$11. OTHER FINANCIAL ASSETS AND LIABILITIES 11.1. Other financial assets Financial assets at fair value through profit or loss Listed investments - - 158,286 Derivative financial instruments: Forward exchange contracts - 10,116 - Total financial assets at fair value - 10,116 158,286 Loans receivable - non current portion 64,627 - - Other non-current financial assets 64,627 - - Loan to an associate 710,151 Loans receivable - current portion 358,503 - - Other financial assets 1,068,654 - - Total other financial assets 1,133,281 10,116 158,286 Forward exchange contracts
The Group enters into forward exchange contracts, when these are available to manage the risk associated with anticipated purchases and sales transactions. The details of outstanding contracts as at 30 June are as below:
2011 2010 2009 Currency Rand Forward rate 8 Notional value - 2,000,000 - Fair value - 10,116 - Maturity 3 months
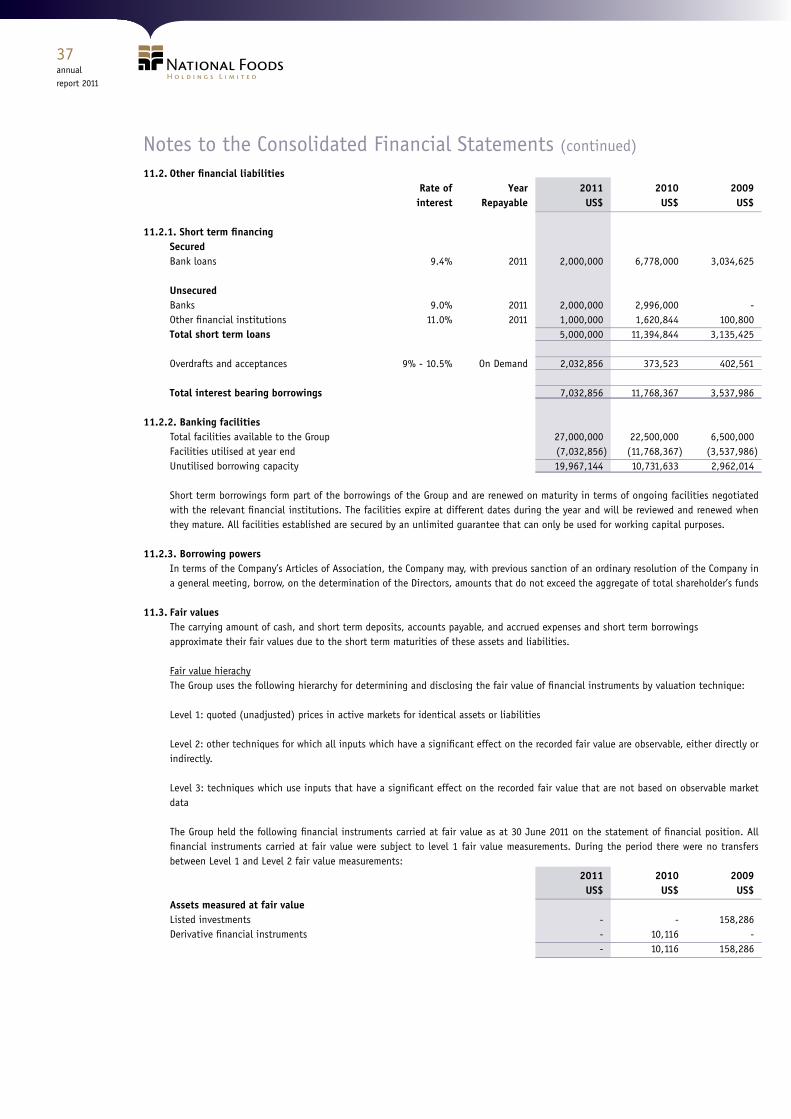
annualreport 2011
Notes to the Consolidated Financial Statements (continued)
11.2. Other financial liabilities Rate of Year 2011 2010 2009 interest Repayable US$ US$ US$ 11.2.1. Short term financing Secured Bank loans 9.4% 2011 2,000,000 6,778,000 3,034,625 Unsecured Banks 9.0% 2011 2,000,000 2,996,000 - Other financial institutions 11.0% 2011 1,000,000 1,620,844 100,800 Total short term loans 5,000,000 11,394,844 3,135,425 Overdrafts and acceptances 9% - 10.5% On Demand 2,032,856 373,523 402,561 Total interest bearing borrowings 7,032,856 11,768,367 3,537,986 11.2.2. Banking facilities Total facilities available to the Group 27,000,000 22,500,000 6,500,000 Facilities utilised at year end (7,032,856 ) (11,768,367 ) (3,537,986 ) Unutilised borrowing capacity 19,967,144 10,731,633 2,962,014
Short term borrowings form part of the borrowings of the Group and are renewed on maturity in terms of ongoing facilities negotiated with the relevant financial institutions. The facilities expire at different dates during the year and will be reviewed and renewed when they mature. All facilities established are secured by an unlimited guarantee that can only be used for working capital purposes.
11.2.3. Borrowing powers In terms of the Company’s Articles of Association, the Company may, with previous sanction of an ordinary resolution of the Company in a general meeting, borrow, on the determination of the Directors, amounts that do not exceed the aggregate of total shareholder’s funds
11.3. Fair values The carrying amount of cash, and short term deposits, accounts payable, and accrued expenses and short term borrowings approximate their fair values due to the short term maturities of these assets and liabilities.
Fair value hierachy The Group uses the following hierarchy for determining and disclosing the fair value of financial instruments by valuation technique:
Level 1: quoted (unadjusted) prices in active markets for identical assets or liabilities
Level 2: other techniques for which all inputs which have a significant effect on the recorded fair value are observable, either directly or indirectly.
Level 3: techniques which use inputs that have a significant effect on the recorded fair value that are not based on observable market data The Group held the following financial instruments carried at fair value as at 30 June 2011 on the statement of financial position. All financial instruments carried at fair value were subject to level 1 fair value measurements. During the period there were no transfers between Level 1 and Level 2 fair value measurements:
2011 2010 2009 US$ US$ US$ Assets measured at fair value Listed investments - - 158,286 Derivative financial instruments - 10,116 - - 10,116 158,286
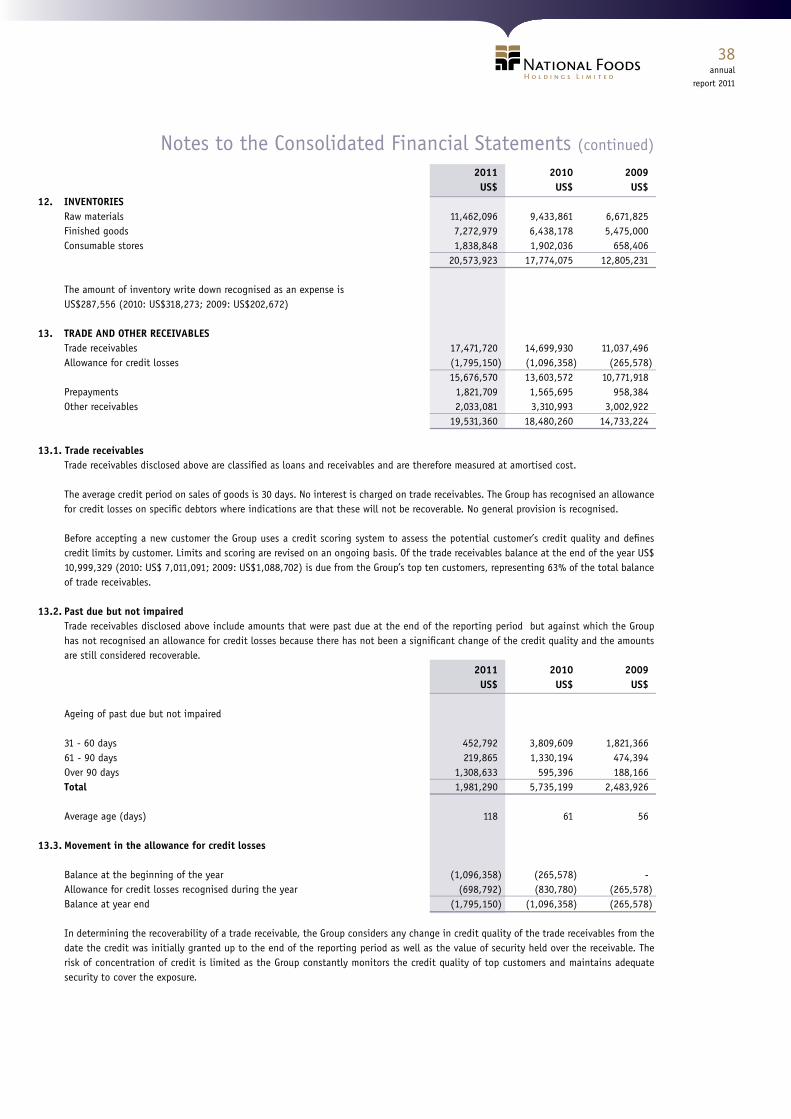
annualreport 2011
Notes to the Consolidated Financial Statements (continued)
2011 2010 2009 US$ US$ US$ 12. INVENTORIES Raw materials 11,462,096 9,433,861 6,671,825 Finished goods 7,272,979 6,438,178 5,475,000 Consumable stores 1,838,848 1,902,036 658,406 20,573,923 17,774,075 12,805,231 The amount of inventory write down recognised as an expense is US$287,556 (2010: US$318,273; 2009: US$202,672)
13. TRADE AND OTHER RECEIVABLES Trade receivables 17,471,720 14,699,930 11,037,496 Allowance for credit losses (1,795,150 ) (1,096,358 ) (265,578 ) 15,676,570 13,603,572 10,771,918 Prepayments 1,821,709 1,565,695 958,384 Other receivables 2,033,081 3,310,993 3,002,922 19,531,360 18,480,260 14,733,224
13.1. Trade receivablesTrade receivables disclosed above are classified as loans and receivables and are therefore measured at amortised cost.
The average credit period on sales of goods is 30 days. No interest is charged on trade receivables. The Group has recognised an allowance for credit losses on specific debtors where indications are that these will not be recoverable. No general provision is recognised.
Before accepting a new customer the Group uses a credit scoring system to assess the potential customer’s credit quality and defines credit limits by customer. Limits and scoring are revised on an ongoing basis. Of the trade receivables balance at the end of the year US$ 10,999,329 (2010: US$ 7,011,091; 2009: US$1,088,702) is due from the Group’s top ten customers, representing 63% of the total balance of trade receivables.
13.2. Past due but not impaired Trade receivables disclosed above include amounts that were past due at the end of the reporting period but against which the Group has not recognised an allowance for credit losses because there has not been a significant change of the credit quality and the amounts are still considered recoverable.
2011 2010 2009 US$ US$ US$
Ageing of past due but not impaired
31 - 60 days 452,792 3,809,609 1,821,366 61 - 90 days 219,865 1,330,194 474,394 Over 90 days 1,308,633 595,396 188,166 Total 1,981,290 5,735,199 2,483,926
Average age (days) 118 61 56 13.3. Movement in the allowance for credit losses Balance at the beginning of the year (1,096,358 ) (265,578 ) - Allowance for credit losses recognised during the year (698,792 ) (830,780 ) (265,578 ) Balance at year end (1,795,150 ) (1,096,358 ) (265,578 )
In determining the recoverability of a trade receivable, the Group considers any change in credit quality of the trade receivables from the date the credit was initially granted up to the end of the reporting period as well as the value of security held over the receivable. The risk of concentration of credit is limited as the Group constantly monitors the credit quality of top customers and maintains adequate security to cover the exposure.
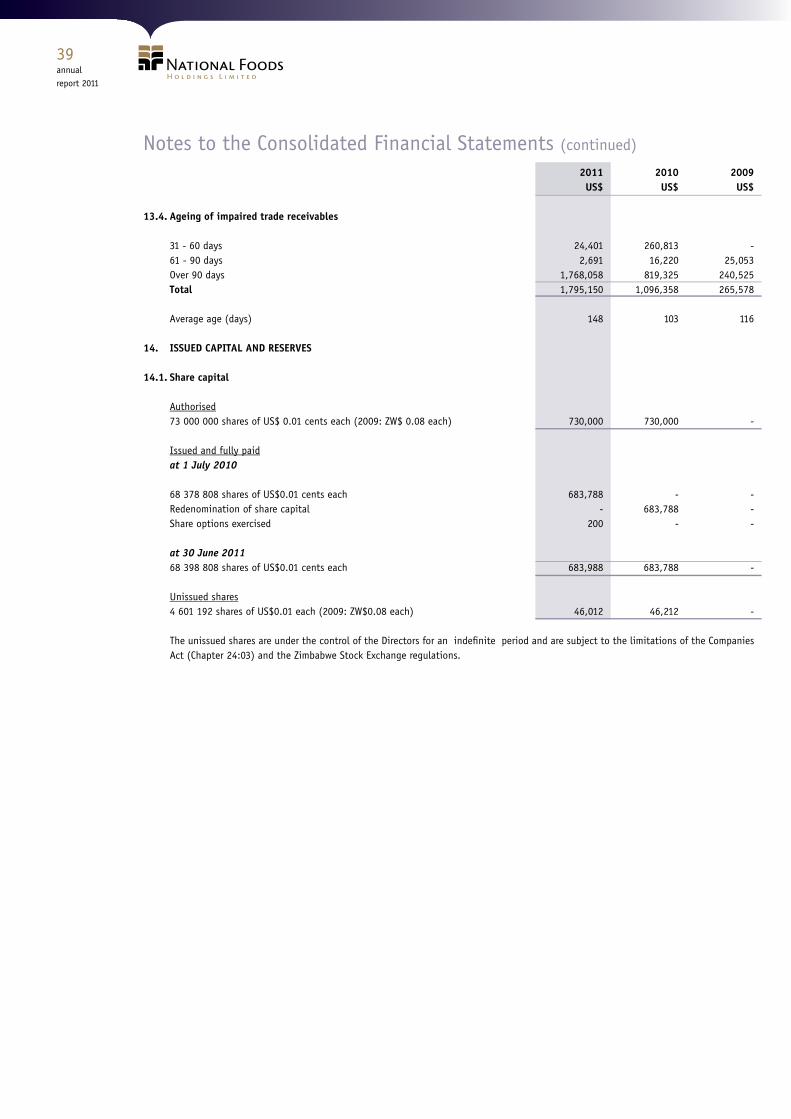
annualreport 2011
Notes to the Consolidated Financial Statements (continued)
2011 2010 2009 US$ US$ US$
13.4. Ageing of impaired trade receivables
31 - 60 days 24,401 260,813 - 61 - 90 days 2,691 16,220 25,053 Over 90 days 1,768,058 819,325 240,525 Total 1,795,150 1,096,358 265,578
Average age (days) 148 103 116
14. ISSUED CAPITAL AND RESERVES
14.1. Share capital
Authorised 73 000 000 shares of US$ 0.01 cents each (2009: ZW$ 0.08 each) 730,000 730,000 -
Issued and fully paid at 1 July 2010 68 378 808 shares of US$0.01 cents each 683,788 - - Redenomination of share capital - 683,788 - Share options exercised 200 - - at 30 June 2011 68 398 808 shares of US$0.01 cents each 683,988 683,788 -
Unissued shares 4 601 192 shares of US$0.01 each (2009: ZW$0.08 each) 46,012 46,212 -
The unissued shares are under the control of the Directors for an indefinite period and are subject to the limitations of the Companies Act (Chapter 24:03) and the Zimbabwe Stock Exchange regulations.
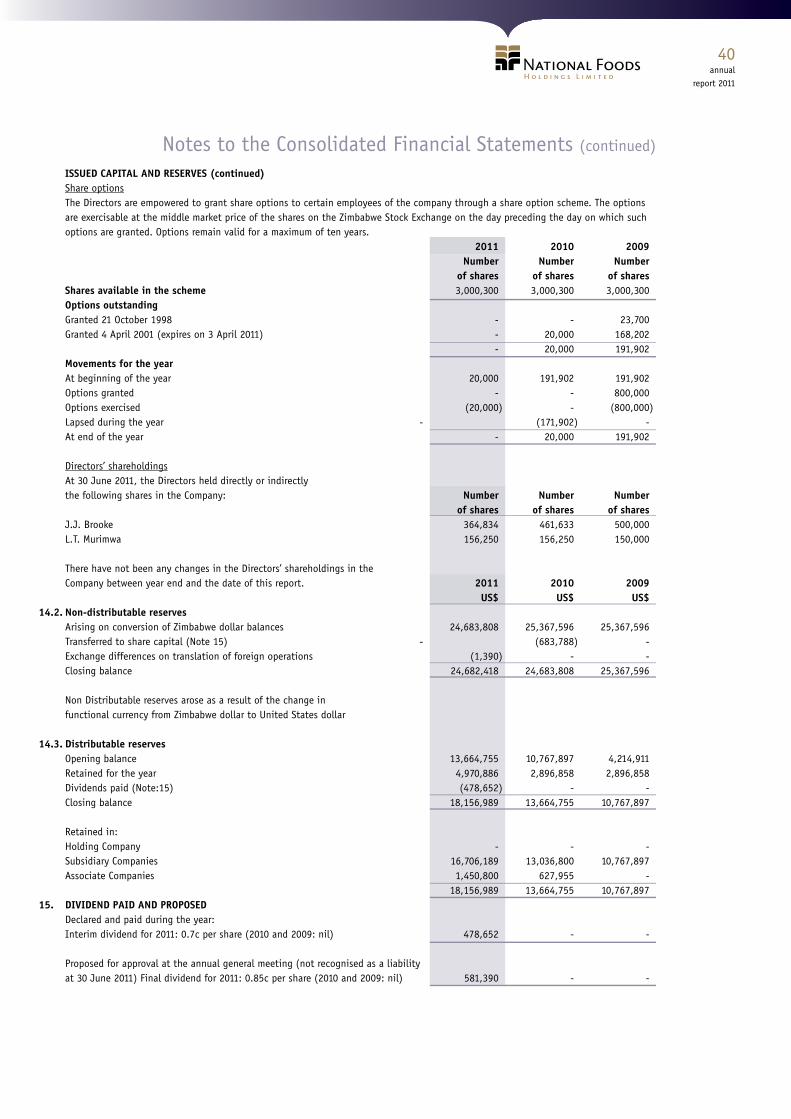
annualreport 2011
Notes to the Consolidated Financial Statements (continued)
ISSUED CAPITAL AND RESERVES (continued)Share options The Directors are empowered to grant share options to certain employees of the company through a share option scheme. The options are exercisable at the middle market price of the shares on the Zimbabwe Stock Exchange on the day preceding the day on which such options are granted. Options remain valid for a maximum of ten years.
2011 2010 2009 Number Number Number of shares of shares of shares Shares available in the scheme 3,000,300 3,000,300 3,000,300 Options outstanding Granted 21 October 1998 - - 23,700 Granted 4 April 2001 (expires on 3 April 2011) - 20,000 168,202 - 20,000 191,902 Movements for the year At beginning of the year 20,000 191,902 191,902 Options granted - - 800,000 Options exercised (20,000 ) - (800,000 ) Lapsed during the year - (171,902 ) - At end of the year - 20,000 191,902
Directors’ shareholdings At 30 June 2011, the Directors held directly or indirectly the following shares in the Company: Number Number Number of shares of shares of shares J.J. Brooke 364,834 461,633 500,000 L.T. Murimwa 156,250 156,250 150,000 There have not been any changes in the Directors’ shareholdings in the Company between year end and the date of this report. 2011 2010 2009 US$ US$ US$ 14.2. Non-distributable reserves Arising on conversion of Zimbabwe dollar balances 24,683,808 25,367,596 25,367,596 Transferred to share capital (Note 15) - (683,788 ) - Exchange differences on translation of foreign operations (1,390 ) - - Closing balance 24,682,418 24,683,808 25,367,596
Non Distributable reserves arose as a result of the change infunctional currency from Zimbabwe dollar to United States dollar
14.3. Distributable reserves Opening balance 13,664,755 10,767,897 4,214,911 Retained for the year 4,970,886 2,896,858 2,896,858 Dividends paid (Note:15) (478,652 ) - - Closing balance 18,156,989 13,664,755 10,767,897
Retained in: Holding Company - - - Subsidiary Companies 16,706,189 13,036,800 10,767,897 Associate Companies 1,450,800 627,955 - 18,156,989 13,664,755 10,767,89715. DIVIDEND PAID AND PROPOSED Declared and paid during the year: Interim dividend for 2011: 0.7c per share (2010 and 2009: nil) 478,652 - - Proposed for approval at the annual general meeting (not recognised as a liability at 30 June 2011) Final dividend for 2011: 0.85c per share (2010 and 2009: nil) 581,390 - -
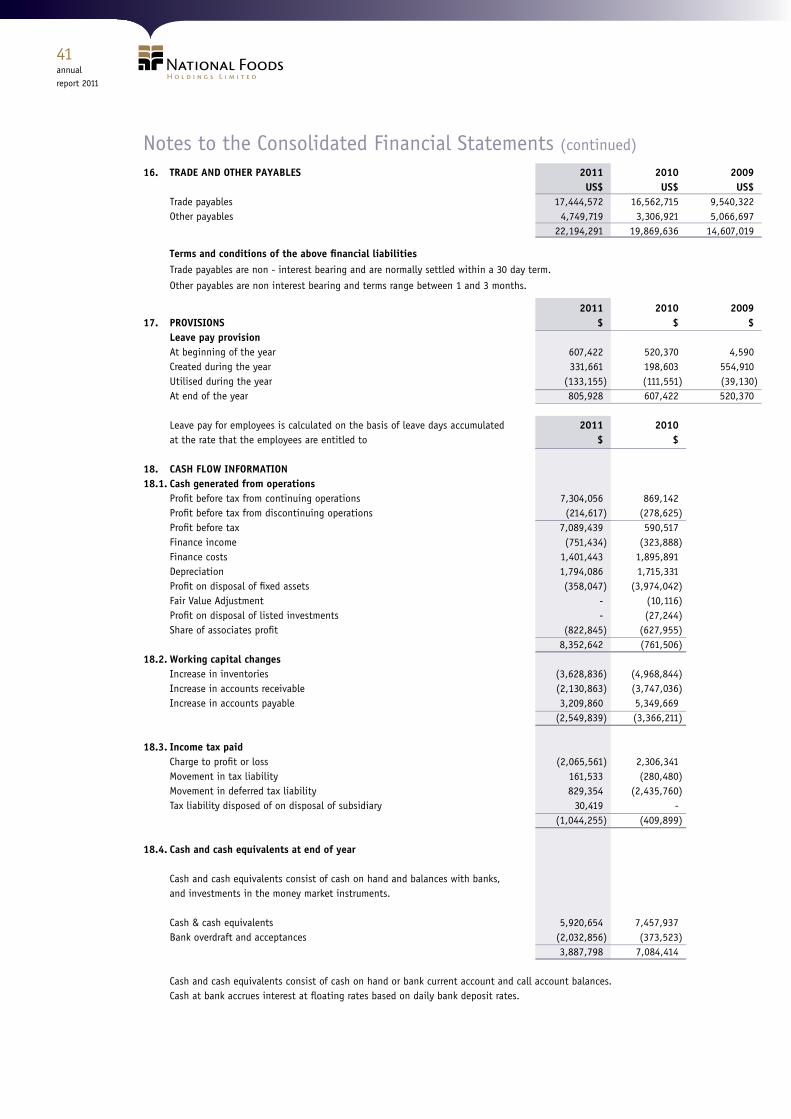
annualreport 2011
Notes to the Consolidated Financial Statements (continued)
16. TRADE AND OTHER PAYABLES 2011 2010 2009 US$ US$ US$ Trade payables 17,444,572 16,562,715 9,540,322 Other payables 4,749,719 3,306,921 5,066,697 22,194,291 19,869,636 14,607,019
Terms and conditions of the above financial liabilities Trade payables are non - interest bearing and are normally settled within a 30 day term.
Other payables are non interest bearing and terms range between 1 and 3 months.
2011 2010 200917. PROVISIONS $ $ $ Leave pay provision At beginning of the year 607,422 520,370 4,590 Created during the year 331,661 198,603 554,910 Utilised during the year (133,155 ) (111,551 ) (39,130 ) At end of the year 805,928 607,422 520,370
Leave pay for employees is calculated on the basis of leave days accumulated 2011 2010 at the rate that the employees are entitled to $ $
18. CASH FLOW INFORMATION 18.1. Cash generated from operations Profit before tax from continuing operations 7,304,056 869,142 Profit before tax from discontinuing operations (214,617 ) (278,625 ) Profit before tax 7,089,439 590,517 Finance income (751,434 ) (323,888 ) Finance costs 1,401,443 1,895,891 Depreciation 1,794,086 1,715,331 Profit on disposal of fixed assets (358,047 ) (3,974,042 ) Fair Value Adjustment - (10,116 ) Profit on disposal of listed investments - (27,244 ) Share of associates profit (822,845 ) (627,955 ) 8,352,642 (761,506 ) 18.2. Working capital changes Increase in inventories (3,628,836 ) (4,968,844 ) Increase in accounts receivable (2,130,863 ) (3,747,036 ) Increase in accounts payable 3,209,860 5,349,669 (2,549,839 ) (3,366,211 ) 18.3. Income tax paid Charge to profit or loss (2,065,561 ) 2,306,341 Movement in tax liability 161,533 (280,480 ) Movement in deferred tax liability 829,354 (2,435,760 ) Tax liability disposed of on disposal of subsidiary 30,419 - (1,044,255 ) (409,899 )
18.4. Cash and cash equivalents at end of year Cash and cash equivalents consist of cash on hand and balances with banks, and investments in the money market instruments. Cash & cash equivalents 5,920,654 7,457,937 Bank overdraft and acceptances (2,032,856 ) (373,523 ) 3,887,798 7,084,414
Cash and cash equivalents consist of cash on hand or bank current account and call account balances. Cash at bank accrues interest at floating rates based on daily bank deposit rates.
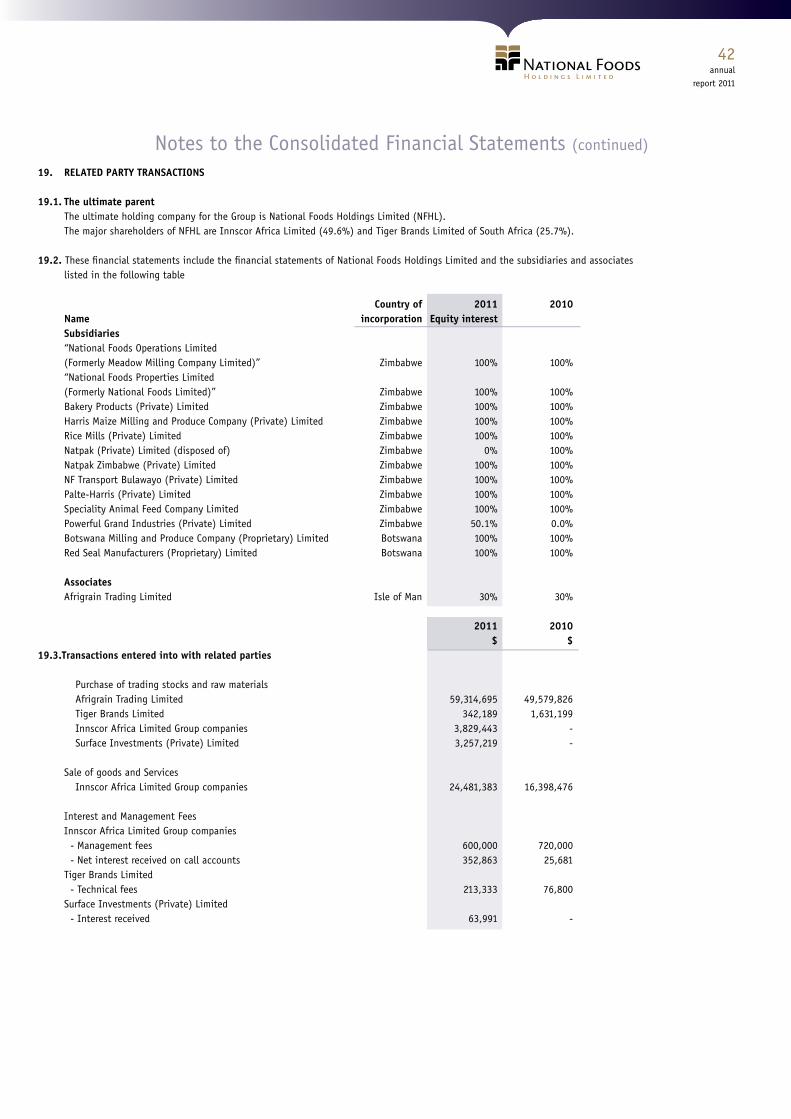
annualreport 2011
Notes to the Consolidated Financial Statements (continued)
19. RELATED PARTY TRANSACTIONS 19.1. The ultimate parent The ultimate holding company for the Group is National Foods Holdings Limited (NFHL). The major shareholders of NFHL are Innscor Africa Limited (49.6%) and Tiger Brands Limited of South Africa (25.7%). 19.2. These financial statements include the financial statements of National Foods Holdings Limited and the subsidiaries and associates listed in the following table
Country of 2011 2010 Name incorporation Equity interest Subsidiaries “National Foods Operations Limited (Formerly Meadow Milling Company Limited)” Zimbabwe 100% 100% “National Foods Properties Limited (Formerly National Foods Limited)” Zimbabwe 100% 100% Bakery Products (Private) Limited Zimbabwe 100% 100% Harris Maize Milling and Produce Company (Private) Limited Zimbabwe 100% 100% Rice Mills (Private) Limited Zimbabwe 100% 100% Natpak (Private) Limited (disposed of) Zimbabwe 0% 100% Natpak Zimbabwe (Private) Limited Zimbabwe 100% 100% NF Transport Bulawayo (Private) Limited Zimbabwe 100% 100% Palte-Harris (Private) Limited Zimbabwe 100% 100% Speciality Animal Feed Company Limited Zimbabwe 100% 100% Powerful Grand Industries (Private) Limited Zimbabwe 50.1% 0.0% Botswana Milling and Produce Company (Proprietary) Limited Botswana 100% 100% Red Seal Manufacturers (Proprietary) Limited Botswana 100% 100% Associates Afrigrain Trading Limited Isle of Man 30% 30% 2011 2010 $ $ 19.3.Transactions entered into with related parties
Purchase of trading stocks and raw materials Afrigrain Trading Limited 59,314,695 49,579,826 Tiger Brands Limited 342,189 1,631,199 Innscor Africa Limited Group companies 3,829,443 - Surface Investments (Private) Limited 3,257,219 -
Sale of goods and Services
Innscor Africa Limited Group companies 24,481,383 16,398,476 Interest and Management Fees Innscor Africa Limited Group companies - Management fees 600,000 720,000 - Net interest received on call accounts 352,863 25,681 Tiger Brands Limited - Technical fees 213,333 76,800 Surface Investments (Private) Limited - Interest received 63,991 -
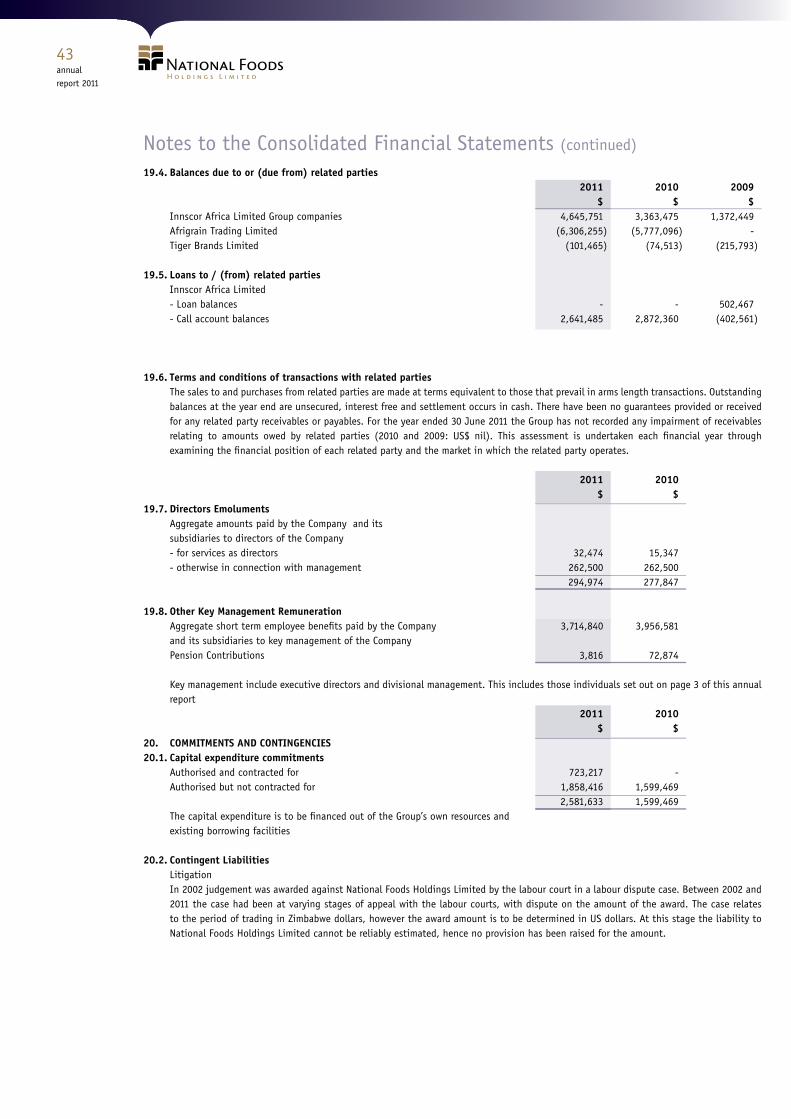
annualreport 2011
Notes to the Consolidated Financial Statements (continued)
19.4. Balances due to or (due from) related parties 2011 2010 2009 $ $ $ Innscor Africa Limited Group companies 4,645,751 3,363,475 1,372,449 Afrigrain Trading Limited (6,306,255 ) (5,777,096 ) - Tiger Brands Limited (101,465 ) (74,513 ) (215,793 ) 19.5. Loans to / (from) related parties Innscor Africa Limited - Loan balances - - 502,467 - Call account balances 2,641,485 2,872,360 (402,561 ) 19.6. Terms and conditions of transactions with related parties
The sales to and purchases from related parties are made at terms equivalent to those that prevail in arms length transactions. Outstanding balances at the year end are unsecured, interest free and settlement occurs in cash. There have been no guarantees provided or received for any related party receivables or payables. For the year ended 30 June 2011 the Group has not recorded any impairment of receivables relating to amounts owed by related parties (2010 and 2009: US$ nil). This assessment is undertaken each financial year through examining the financial position of each related party and the market in which the related party operates.
2011 2010 $ $ 19.7. Directors Emoluments Aggregate amounts paid by the Company and its subsidiaries to directors of the Company - for services as directors 32,474 15,347 - otherwise in connection with management 262,500 262,500 294,974 277,847 19.8. Other Key Management Remuneration Aggregate short term employee benefits paid by the Company 3,714,840 3,956,581 and its subsidiaries to key management of the Company Pension Contributions 3,816 72,874
Key management include executive directors and divisional management. This includes those individuals set out on page 3 of this annual report
2011 2010 $ $20. COMMITMENTS AND CONTINGENCIES 20.1. Capital expenditure commitments Authorised and contracted for 723,217 - Authorised but not contracted for 1,858,416 1,599,469 2,581,633 1,599,469 The capital expenditure is to be financed out of the Group’s own resources and existing borrowing facilities
20.2. Contingent Liabilities Litigation In 2002 judgement was awarded against National Foods Holdings Limited by the labour court in a labour dispute case. Between 2002 and 2011 the case had been at varying stages of appeal with the labour courts, with dispute on the amount of the award. The case relates to the period of trading in Zimbabwe dollars, however the award amount is to be determined in US dollars. At this stage the liability to National Foods Holdings Limited cannot be reliably estimated, hence no provision has been raised for the amount.
annualreport 2011
Notes to the Consolidated Financial Statements (continued)
21. PENSION SCHEMES All eligible employees are members of the following Group schemes which are independently administered:
21.1. Defined contribution plan In 1999, the rules of all Group schemes were amended, such that all retirement benefits for future services rendered will be provided for by contributions made to a defined contribution plan.
21.2. National Social Security Authority Scheme
This is a defined benefit scheme established under the National Social Security Authority Act (1989). Contributions by employees are 3% per month of pensionable monthly emoluments, up to a maximum of $200 per month. The Act requires that the long term benefits are actuarially valued every three years.
2011 2010 $ $21.3. Pension costs recognised as an expense
Defined contribution fund 341,530 301,274 National Social Security Authority Scheme 180,606 379,668 522,136 680,94222. FINANCIAL RISK MANAGEMENT OBJECTIVES AND POLICIES
22.1.Capital Management The objective of the Group is to ensure that the Group’s companies maintain healthy capital ratios in order to support the businessand maximise shareholder value. The Group manages its capital structure and makes adjustment to it in light of changes in the economic environment. To maintain or adjust the capital structure the Group may adjust the dividend payment to shareholders, return capital to shareholders or issue new shares. No changes were made to the objectives, policies or processes during the years ended 30 June 2010 and 30 June 2011.
2011 2010 2009 US$ US$ US$ Interest bearing borrowings net of cash and cash equivalents 1,112,202 4,310,430 852,386 Total Equity 43,523,395 39,032,351 36,135,493 Gearing ratio 3% 11% 2%
22.4. Financial risk management
22.4.1. Treasury risk A treasury management policy is in place to maximise returns on available surplus funds which is controlled by management.
22.4.2. Credit risk Financial assets of the Group which are subject to credit risk consist mainly of cash resources and debtors. Cash resources are placed with various approved financial institutions subject to approved limits. All these institutions are of a high standing. Substantially all accounts payable and accounts receivable are non- interest bearing and repayable within one year. Accounts receivable are disclosed net of a provision for doubtful debts. The management of credit risk of trade debtors is performed at an operational level through credit evaluations.
22.4.3. Interest risk Group policy is to adopt a non-speculative approach to manage interest rate risk whilst maximising profit. Approved short term investments and funding instruments are at variable interest rates and mature within one year.
annualreport 2011
Notes to the Consolidated Financial Statements (continued)
22.4.4. Liquidity riskThe Group manages liquidity risk by maintaining adequate reserves, banking facilities and reserve borrowing facilities, by continuously monitoring forecast and actual cash flows, and by matching the maturity profiles of financial assets and liabilities. Note 11.2.2 sets out details of additional undrawn facilities that the Group has at its disposal to further reduce liquidity risk.The following tables detail the Group’s remaining contractual maturity for its financial liabilities with agreed repayment periods. The tables have been drawn up based on the undiscounted cash flows of financial liabilities based on the earliest date on which the Group can be required to pay.
Less than 3 months 3-12 Months 1 - 5 years Total Year ended 30 June 2011 US$ US$ US$ US$ Interest bearing borrowings 3,000,000 2,000,000 5,000,000 Trade and other payables 22,194,291 22,194,291 Bank overdrafts and acceptances 2,032,856 2,032,856 27,227,147 2,000,000 - 29,227,147 Year ended 30 June 2010 Interest bearing borrowings 3,000,000 8,394,844 11,394,844 Trade and other payables 19,869,636 19,869,636 Bank overdrafts and acceptances 373,523 373,523 23,243,159 8,394,844 - 31,638,003 Year ended 30 June 2009 Interest bearing borrowings 3,135,425 3,135,425 Trade and other payables 14,607,019 14,607,019 Bank overdrafts and acceptances 402,561 402,561 18,145,005 - - 18,145,005
22.4.5. Foreign currency riskForeign currency risk is managed at an operational level monitored by the relevant head of department and Group Treasury. Exposure to losses on foreign creditors is managed through prompt payment of outstanding balances and forward contracts when available.
The carrying amount of the Group’s foreign currency denominated monetary assets and liabilities at the end of the reporting period is as follows:
2011 2010 2009 US$ US$ US$ Assets South African Rand 475,957 219,724 29,727 Botswana Pula 17,689 14,355 13,732 Euro 1,418 28,376 -
Liabilities South African Rand 324,556 217,780 9,818 Botswana Pula 105,244 14,129 13,732 Euro - 21,860 -
The Group is mainly exposed to the South African Rand. The following table details the Group’s sensitivity to a 10% strengthening in the US$ against the relevant currencies. The sensitivity analysis includes any outstanding foreign currency denominated monetary items and adjusts their translation at period end for a 10% strengthening of the US$. A positive number below indicates an increase in profit and equity where the US$ strenthens against the relevant currency. For a 10% weakening of the US$ against the relevant currencies there would be a comparable impact on the profit and equity in the opposite direction.
Profit or Loss 2011 2010 US$ US$ South African Rand 16,822 9,301 Botswana Pula (9,728 ) (10,184 ) Euro 158 4,567
The sensitivity is mainly attributable to receivables, payables and cash balances denominated in these currencies.
annualreport 2011
Notes to the Consolidated Financial Statements (continued)
23. SEGMENTAL ANALYSIS23.1. Operating segment information
For management purposes the Group is organised into business units based on their products and services and has two reportable operating segments as follows
Milling; Manufacturing and Distribution
This segment is involved in the milling of four and maize, manufacture of stockfeeds, edible oils and packaging and sale of other general household goods. It also involves the distribution and warehousing of those goods.
Properties
This segment includes all properties owned by the Group. Properties are leased out to business units in the Milling, Manufacturing and Distribution segment as well as to third parties.
Operating profit is used to measure segment performance.
Segment revenues and results
Period ended 30 June 2011 Milling, Manufacturing and Distribution Properties Eliminations Group US$ US$ US$ Segment revenue 200,607,392 1,594,337 (1,032,153 ) 201,169,576
Operating profit 6,750,138 282,406 7,032,544 Share of profits of associates 822,845 Net interest expense (551,333 ) Fair value adjustments - Profit before tax 7,304,056
Segment assets 44,925,895 37,060,123 81,986,018 Segment liabilities (32,100,659 ) (6,284,147 ) (38,384,806 ) Net segment assets 12,825,236 30,775,976 - 43,601,212
Depreciation charge for the year 1,116,069 478,547 - 1,594,616 Capital expenditure 1,708,176 509,005 - 2,217,181 Number of employees 924 - 924
Period ended 30 June 2010 Milling, Manufacturing and Distribution Properties Eliminations Group US$ US$ US$ Segment revenue 160,535,801 1,502,271 (1,219,857 ) 160,818,215 Operating profit 1,291,959 137,210 1,429,169 Share of profits of associates 627,955 Net interest expense (1,198,098 ) Fair value adjustments 10,116 Profit before tax 869,142
Segment assets 39,715,058 38,923,562 78,638,620 Segment liabilities (38,757,380 ) (848,889 ) (39,606,269 ) Net segment assets 957,678 38,074,673 - 39,032,351
Depreciation charge for the year 965,967 483,149 1,449,116 Capital expenditure 1,881,945 77,202 1,959,147 Number of employees 1,601 - 1,601
annualreport 2011
Company Statement of Financial Position At 30 June 2011 Notes RESTATED 2011 2010 2009 US$ US$ US$
ASSETS Non-current assets Investments A 25,367,596 25,367,596 25,367,596
Total assets 25,367,596 25,367,596 25,367,596
EQUITY AND LIABILITIES
Capital and reserves Share capital 12 683,788 683,788 - Non-distributable reserve B 24,683,808 24,683,808 25,367,596 Total Equity 25,367,596 25,367,596 25,367,596
NOTES TO THE COMPANY FINANCIAL STATEMENTS
A. INVESTMENTS Subsidiaries equity 25,367,596 25,367,596 25,367,596
B. NON-DISTRIBUTABLE RESERVE Arising on conversion of Zimbabwe dollar balances 25,367,596 25,367,596 3,135,425 Transferred to share capital (683,788 ) (683,788 ) - Closing balance 24,683,808 24,683,808 3,135,425
annualreport 2011
Shareholders’ AnalysisAt 30 June 2011
Shareholding No. of shareholders % Issued shares % 1-1000 559 55.7 204,405 0.31001-10000 336 33.5 1,037,713 1.510001 -50000 66 6.6 1,518,754 2.250001 and over 43 4.2 65,637,936 96.0 1,004 100 68,398,808 100 ShareholdersBanks and nominees 75 7.48 2 868 133 4.19 Deceased estates 7 0.70 8 577 0.01 External company 2 0.20 17 596 695 25.73 Insurance companies/societies 21 2.09 543 710 0.79 Employee 3 0.30 6 736 478 9.85 Pension funds 43 4.28 1 846 275 2.70 Resident individuals 603 60.06 1 777 778 2.60 Non-residents 68 6.78 102 311 0.15 Investment and trust companies 31 3.09 534 294 0.78 Other corporate holdings 151 15.02 36,384,557 53.20 1,004 100 68,398,808 100
At 30 June 2010 Shareholding No. of shareholders % Issued shares % 1-1000 627 55.7 232,402 0.21001-10000 369 32.8 1,186,350 1.710001-50000 86 7.6 1,914,498 2.850001 and over 44 3.9 65,045,558 95.3 1,126 100 68,378,808 100
ShareholdersBanks and nominees 67 5.95 2 569 990 3.76 Deceased estates 6 0.53 8 010 0.10 External companies 2 0.18 17 596 695 25.73 Insurance companies/societies 19 1.69 418 665 0.61 Employee 3 - 6 736 478 9.94 Pension funds 65 5.76 1 298 586 1.81 Resident individuals 704 63.33 2 258 173 3.30 Non-residents 69 6.60 312 648 0.12 Investment and trust companies 43 3.82 1 518 080 2.22 Other corporate holdings 148 12.14 35,661,483 52.41 1,126 100 68,378,808 100
Major Shareholders The top ten shareholders of the Company at 30 June 2011 and 30 June 2010: 2011 2010 No. of shares % No. of shares %Innscor Africa Limited 33 955 968 49.63 33 779 998 49.41 Tiger Foods Brands 17 596 695 25.73 17 596 695 25.73 National Foods Workers Trust 6 734 978 9.85 6 734 978 9.85 Barclays Zimbabwe Nominees 929 690 1.36 210 506 0.31 Amaval Investments (Private) Limited 870 544 1.27 854 311 1.25 Stanbic Nominees 662 309 0.97 670 450 0.98 Communications and Allied Industries 503 194 0.74 210 000 0.31 Brooke, Jeremy Joseph 364 834 0.53 461 653 0.68 Bard Nominees 351 695 0.51 561 191 0.82 Local Authorities Pension Funds 305,823 0.44 276,645 0.40
annualreport 2011
Shareholders’ DiaryFinancial year end 30 June 2011
Preliminary results 8 September 2011
Annual results published 12 October 2011
Annual General Meeting 15 November 2011
Half-year interim results and dividend declaration March 2012
Payment of final dividend 7 October 2011
Notice of Annual General MeetingNOTICE IS HEREBY GIVEN that the forty-second Annual General Meeting of National Foods Holdings Limited is to be held at the registered office, Gloria House, 10 Stirling Road, Workington, Harare on 15 November 2011 at 8.30am, to conduct the following business: -
Ordinary Business
1. To receive, approve and adopt the Financial Statements and Reports of the Directors and Auditors for the financial year ended 30 June 2011.
2. To elect the following Directors, Messrs L.T. Murimwa and J.P. Schonken who retire by rotation in terms of the Articles of Association of the Company and, being eligible, offer themselves for re-election.
3. To approve the appointment of Mr N.G. Brimacombe who was appointed as a Director of the Company with effect from 23 August 2011, and who in terms of the Articles of Association of the Company is required to retire from the Board at the Annual General Meeting and being eligible, offers himself for re-election.
4. To approve Directors’ fees for the financial year ended 30 June 2011.
5. To re-appoint Ernst & Young as Auditors of the Company until the conclusion of the next Annual General Meeting and to approve their remuneration for the past audit.
Special Business
6. Share Buy-Back
To consider, and if deemed appropriate, to pass with or without amendment, the following ordinary resolution: - “That the Company be authorised in advance, in terms of section 79 of the Companies Act [Chapter 24:03] and the Zimbabwe Stock Exchange Listing Requirements, to purchase its own shares, upon such terms and conditions and in such amounts as the Directors of the Company may from time to time determine, but subject to the following: -
i.) This authority shall expire on the date of the Company’s next Annual General Meeting; and
ii.) Acquisitions shall be of ordinary shares which, in aggregate in any one financial year, shall not exceed 10% (ten per cent) of the Company’s issued ordinary share capital as at the date of this resolution; and
iii.) The maximum and minimum prices respectively, at which such ordinary shares may be acquired will be 20% (twenty per cent) above and 25% ((twenty five per cent) below the weighted average of the market price at which such ordinary shares are traded on the Zimbabwe Stock Exchange, as determined over the 5 (five) business days immediately proceeding the date of purchase of such ordinary shares by the Company; and
iv.) A press announcement will be published as soon as the Company has acquired ordinary shares constituting on a cumulative basis in the period between annual general meetings, 3% (three per cent) of the number of ordinary shares in issue prior to the acquisition.”
Note: -
In terms of this resolution, the Directors are seeking authority to allow use of the Company’s available cash resources to purchase its own shares in the market in terms of the Companies Act and the regulations of the Zimbabwe Stock Exchange, for treasury purposes. The Directors will only exercise the authority if they believe that to do so would be in the best interests of shareholders generally. In exercising this authority the Directors will duly take into account following such repurchase, the ability of the Company to be able to pay its debts in the ordinary course of business, the maintenance of an excess of assets over liabilities, and for the Company the adequacy of ordinary capital and reserves as well as working capital.
annualreport 2011
7. Loans to Directors
To resolve as an ordinary resolution, with or without amendments: - “That the Company be and is hereby authorised to make any loan to any Executive Director or to enter into any guarantee or provide any security in connection with a loan to such Executive Director for the purpose of enabling him to properly perform his duty as an officer of the Company, as may be determined by the Remuneration Committee of the Board of Directors, provided that the amount of the loan or the extent of the guarantee or security shall not exceed the annual remuneration of that Director.”
Any Other Business
8. To transact any other business competent to be dealt with at an Annual General Meeting.
In terms of the Companies Act (Chapter 24:03), a member entitled to attend and vote at a meeting is entitled to appoint a proxy to attend and vote on a poll and speak in his stead. A proxy need not be a member of the Company. Proxy forms should be forwarded to reach the office of the Company Secretary at least 48 (forty-eight) hours before the commencement of the meeting.
BY ORDER OF THE BOARD
A.D. LORIMER
GROUP COMPANY SECRETARY
GLORIA HOUSE
10 STIRLING ROAD
WORKINGTON
P O. BOX 269
HARARE
12 October 2011