Embed Size (px)
Citation preview

Reorganization Feasibility Study
On Behalf of
Southampton UFSD and Tuckahoe Common SD
July, 2013
FINDINGS OF THE STUDY
Prepared by: The SES Study Team, LLC
Study Question of the school districts:
Would instructional opportunity be enhanced for all students at a similar or reduced cost to taxpayers by combining the two districts?
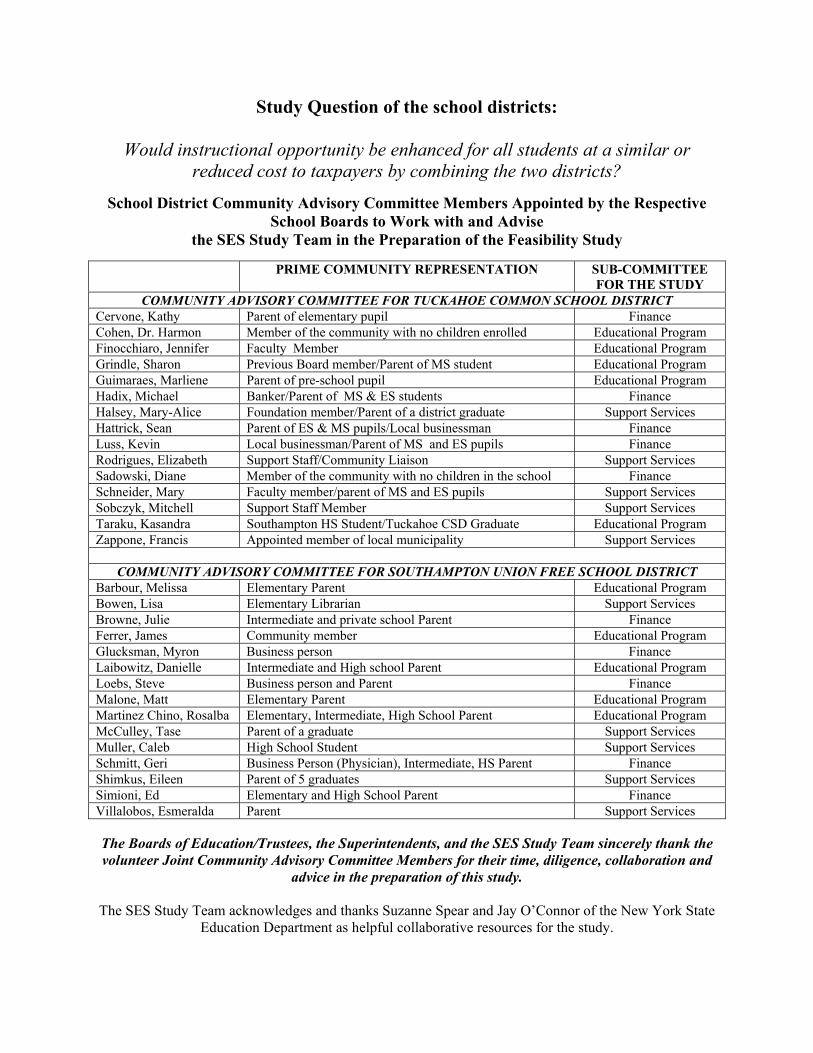
School District Community Advisory Committee Members Appointed by the Respective
School Boards to Work with and Advise the SES Study Team in the Preparation of the Feasibility Study
PRIME COMMUNITY REPRESENTATION SUB-COMMITTEE
FOR THE STUDY COMMUNITY ADVISORY COMMITTEE FOR TUCKAHOE COMMON SCHOOL DISTRICT
Cervone, Kathy Parent of elementary pupil Finance Cohen, Dr. Harmon Member of the community with no children enrolled Educational Program Finocchiaro, Jennifer Faculty Member Educational Program Grindle, Sharon Previous Board member/Parent of MS student Educational Program Guimaraes, Marliene Parent of pre-school pupil Educational Program Hadix, Michael Banker/Parent of MS & ES students Finance Halsey, Mary-Alice Foundation member/Parent of a district graduate Support Services Hattrick, Sean Parent of ES & MS pupils/Local businessman Finance Luss, Kevin Local businessman/Parent of MS and ES pupils Finance Rodrigues, Elizabeth Support Staff/Community Liaison Support Services Sadowski, Diane Member of the community with no children in the school Finance Schneider, Mary Faculty member/parent of MS and ES pupils Support Services Sobczyk, Mitchell Support Staff Member Support Services Taraku, Kasandra Southampton HS Student/Tuckahoe CSD Graduate Educational Program Zappone, Francis Appointed member of local municipality Support Services
COMMUNITY ADVISORY COMMITTEE FOR SOUTHAMPTON UNION FREE SCHOOL DISTRICT
Barbour, Melissa Elementary Parent Educational Program Bowen, Lisa Elementary Librarian Support Services Browne, Julie Intermediate and private school Parent Finance Ferrer, James Community member Educational Program Glucksman, Myron Business person Finance Laibowitz, Danielle Intermediate and High school Parent Educational Program Loebs, Steve Business person and Parent Finance Malone, Matt Elementary Parent Educational Program Martinez Chino, Rosalba Elementary, Intermediate, High School Parent Educational Program McCulley, Tase Parent of a graduate Support Services Muller, Caleb High School Student Support Services Schmitt, Geri Business Person (Physician), Intermediate, HS Parent Finance Shimkus, Eileen Parent of 5 graduates Support Services Simioni, Ed Elementary and High School Parent Finance Villalobos, Esmeralda Parent Support Services
The Boards of Education/Trustees, the Superintendents, and the SES Study Team sincerely thank the volunteer Joint Community Advisory Committee Members for their time, diligence, collaboration and
advice in the preparation of this study.
The SES Study Team acknowledges and thanks Suzanne Spear and Jay O’Connor of the New York State Education Department as helpful collaborative resources for the study.

i
Preface Southampton Union Free School District
Board of Trustee Members: Andy Brindle; Roberta Hunter; Donald J. King (vice president); Heather McCallion (president); Nicholas Palumbo; Christina Strassfield; Jake Wilson Superintendent of Schools: J. Richard Boyce; as of July 1, 2013 Scott Farina The Southampton School District is an area of approximately 51 square miles located in rural Suffolk County. The village of Southampton is an active and vibrant community, nestled between the Peconic Bay and the Atlantic Ocean on the east end of Long Island, 100 miles from New York City. An area rich in history, Southampton is a residential, beach and farming community served by art and historical museums and a library. Southampton Hospital and several retail business districts are found within the village. Its workforce includes trades people, entrepreneurs, artists, and working professionals. The year round population of 9876, which encompasses the village of Southampton, the Shinnecock Indian Nation, and the neighboring hamlets of North Sea and Water Mill, triples during the summer season. Southampton is a very culturally diverse community with many families having lived in the area for generations while others only recently immigrated to the United States. The richness of the high school's diversity is reflected by the 22 countries of origin, the 23 native languages spoken, and the vast range of socioeconomic differences of its students. The community is accessible via rail transportation provided by the Long Island Railroad. Highways include New York State Routes 27 and 27A.
Tuckahoe Common School District
Board of Trustee Members: Dr. Daniel Crough (chairperson); Robert E. Grisnik (vice chairperson); Harald G. Steudte; Superintendent of Schools: Christopher Dyer The Tuckahoe Common School District is located in the town of Southampton, Suffolk County, on the beautiful South Fork of Long Island. The district has a land area of approximately 11.5 square miles and a population estimated at 3200. Located within the boundaries of the district are all or part of the communities of Tuckahoe, the Art Village and Shinnecock Hills, as well as a portion of the Incorporated Village of Southampton. Tuckahoe's surrounding area is world-renowned as a summer resort. The nearby Atlantic Ocean, Shinnecock Bay and Great Peconic Bay provide opportunities for swimming and boating. Four famous golf courses are located within the boundaries of the school district: National Golf Links of America, Shinnecock Hills Golf Club, Sebonack and Southampton Golf Club. Also located nearby is the Southampton Campus of Stony Brook University. Tuckahoe has much to offer its residents as a place to live and work, with its winding roads, spectacular water views and rural atmosphere. The tone is one of tranquility and serenity. The district offers many cultural and recreational resources. Southampton College offers many opportunities for educational and cultural activities. Museums, civic organizations, libraries and churches are all readily available. Southampton Hospital and Southampton Village are a few minutes away. Rail transportation is provided by the Long Island Railroad. Highways include New York State Routes 27 and 27A.

ii
INTRODUCTION A MATTER OF THE ECONOMY AND NOT POOR STEWARDSHIP OF PUBLIC RESOURCES The Southampton and Tuckahoe School officials have been concerned about the financial resources available to support a quality educational program for their students. These districts, like many in New York State (as well as individuals and businesses) have had to adjust expenditures for staff, programs, and general operations to deal with the recession of 2008 and its continued fallout for the foreseeable future. With state aid revenues likely to remain ‘flat’ or slightly increasing for some districts, it is projected that school district expenditure decisions will need to be weighed carefully as state revenues remain flat or declining. It is believed by the Boards of the two school districts that local community members may be unable to shoulder the burden of a transfer of the shortfall in state aid revenues to increased property taxes to raise revenue and maintain the existing opportunities of the current student programming that the community supports and expects. In addition, with the passage of the 2% property tax levy limit law by the NYS Legislature and Governor in June 2011, schools cannot go legislatively beyond that measure without over 60% of their voting residents agreeing to do so. THE DILEMMA FACING COMMUNITIES AND THEIR RESPECTIVE BOARDS OF EDUCATION
1. State aid to support local school districts may stay close to flat for the foreseeable future; And,
2. The capacity for local taxpayers of a school district to shoulder more revenue responsibility through property taxes may or may not be possible;
And, 3. School district communities, the State of New York, and the Federal perspective are expecting
higher measured student achievement for all students; And,
4. School district communities, the State of New York, and the Federal perspective are requiring the delivery of an educational program to all students that will enable them to be productive citizens in the workforce, and to be competitive in the global economy, as well as have the basic skills to pursue post-high school specialized education opportunities.
DUE DILIGENT PLANNING BY THE SOUTHAMPTON AND TUCKAHOE BOARDS OF EDUCATION/TRUSTEES AND THIS STUDY The two Boards collaboratively commissioned a study to determine if reorganization could provide enhanced opportunities for all pupils of the two school districts and, at the same time, increase efficiencies, and lower cost for the overall operations by forming a reorganized school district. The two Boards reviewed carefully the two methods of school district reorganization: centralization and annexation. The two Boards directed that the feasibility study be guided using the method of annexation. If approved by referenda in both communities, the reorganization is based on the annexation of the Tuckahoe Common School District by Southampton Union Free School District.

iii
The two Boards and their superintendents had no pre-conceived notions about the findings of the study or a pre-conceived advocacy for what the findings should be. They believe they can work together to deliver the program and deal with the long-term financial reality facing school districts, other municipalities, and local school district residents. In addition, the Boards recognize that the enrollment, financial, and economic projections underscore that previously successful ways and decisions about serving pupils may not be viable solutions in ‘this new normal’ caused by economic conditions and demographic changes facing our region, the state and the nation. Because of the due diligence of the two Boards in exploring options, the information offered in this study provides a concrete way for the two communities and their Boards to engage public discussion in an open and transparent fashion. The SES Study Team ‘holds up a mirror’ in the study to various kinds of data about the two school districts; organizes that data into useable resource tools; and reports the findings of the analyses of the data without bias or advocacy as to what decision the Boards and communities should implement. We hope our work in collaboration with 30 volunteer community members from the two school districts is a valuable tool to help local decision-making. The study is just one source of information to help community discussion about how to deal with the dilemma facing public schools in an economy that likely will not provide increased financial support to deliver Pre-K through grade 12 public education. We thank the districts for allowing us to work with you and the Joint Community Advisory Committee on this study. The SES Study Team, LLC July, 2013

Please note:
If the communities choose to approve a reorganization of both districts into one, the reorganization would begin on July 1, 2014—a complete school year from the current
school year. Therefore, estimated numbers in the study may change once the 2013-2014 program, staffing and financial plan are implemented by the Southampton and
Tuckahoe School Districts.
TABLE OF CONTENTS Preface i Introduction ii Purpose of the Study 1 Methodology of the Study 1 FINDINGS OF THE RESEARCH AND ANALYSIS OF DATA ABOUT EACH SCHOOL DISTRICT A. Demographics of the Two School Districts 1. Estimated Enrollment Projections of the Two School Districts 3 2. Federal Census Demographic Data Snapshot of the Two School Districts 6 3. Geographic Distances Between the School Buildings of the Two Districts 8 4. Fiscal Condition Profiles of Each School District 9 5. Historical Perspective of Referendum Votes of Each District 13 B. The School Buildings in the Two School Districts 1. Pupil Capacity of Each of the School Buildings 14 2. Infrastructure Condition of the Existing School Buildings 16 C. The Educational Program Currently in the Two School Districts 1. Current Class Sizes Grades pre-K through Grade 12 18 2. The Pre-K through Grade 12 Program Offerings 20 3. Interscholastic Athletics/Co-curricular/Music/Drama Offerings 24 4. State Student Assessment Data and High School Graduation Data 26 5. Regional Sharing with Other School Districts 31 ANALYSIS BY THE JOINT COMMUNITY ADVISORY COMMITTEE ABOUT HOW TO USE THE EXISTING BUILDINGS WITH A POSSIBLE REORGANIZATION OF THE TWO DISTRICTS INTO ONE D. Building Use Options Identified by the Joint Community Advisory Committee 32 E. Pupil Transportation 33 CURRENT PERSONNEL DATA AS REVIEWED BY THE JOINT COMMUNITY ADVISORY COMMITTEE F. Profile of the Major Elements of Labor Contracts in Place in the Two Districts 35

G. Average Total Full Time Equivalent Personnel Expenditures Across the Two School Districts Benchmarked to the 2012-2013 School Year 36 H. Full Time Equivalents of Staff Who Have Left the Districts for All
Reasons Except Reduction in Force for the School Years 2008-2009 Through 2011-2012 37
WHAT MIGHT A ‘REORGANIZATION’ ROADMAP LOOK LIKE? Where would the students go to school? I. Suggested Prime Building Use Plan to Implement the Pre-K through 12 Program if the School Districts Reorganized into One 38 What might the program for students look like? J. Suggested Breadth of Student Program Elements if Reorganization of the Two School Districts into One is Approved by the Communities 39 What staff would the reorganized school district probably need? K. What if Picture of the Staff Necessary to Deliver the Program in a Reorganized District 51 What might be the plan for bus transportation? L. Example School Day Time Schedule and Pupil Transportation if the Prime Building Use Option is Implemented to Serve the Pupils in a Reorganized District 52 What might the financial picture look like for the new school district? M. What if Picture of the Estimated Long Term Budget Financials if the Two Districts Reorganize into One District 54 What is expected to happen to property taxes? N. What if Picture of the Estimated Property Taxes in the First Base Year on a $500,000 and a $1,000,000 Home in the Reorganized School District 63 What would the new school district need to do to prepare for the school year in ‘September’ 2014? O. Outline of Major Transition Steps to Create One School District if the Communities Approve the Reorganization Referendum 66 P. Feasibility Study Question Summary 67

DATA SETS OF THE STUDY ARE COMPILED AS A SEPARATE DOCUMENT IN ADDITION TO THE FINDINGS OF THE STUDY AND ARE AVAILABLE IN PRINT AND ON THE
WEBSITES OF THE DISTRICTS
Data Reference Tools Compiled by the Study, Analyzed by the Joint Community Advisory Committee, and Posted on the Website of Each School District as the Study Progressed
since January 2013 (Page numbers refer to the page numbers in the separate Data Sets Document compiled for the study.)
Criteria Used by the Boards of Education to Appoint Community Advisory Committee Members -1- What Questions Should the Community Advisory Joint Committee and the Two District Reorganization Study Address/Answer? -2- Agendas of the Work Session Meetings of the Community Advisory Joint Committee -5- Pupil Enrollment Projection Calculations -23- Federal Census Bureau Demographic Characteristic Estimates for the Two School Districts -56- School District Financial Characteristics/Fiscal Condition Profiles -69- 2012-2013 Grade Level Section Class Sizes -81- Pupil Capacity of Each School Building for Possible Use in a Reorganized School District -85- Summary Results of the 2010 Building Condition Surveys -99- Elements of the Grade Pre-Kindergarten through Grade 12 Program in 2012-2013 -104- 2012-2013 Program Elements: Interscholastic Athletics -113- 2007-2011 Summary of Elementary and High School Assessment Results -118- Labor Contract Profiles and Full Time Equivalent Cost Data -126- Some Possible ‘What If’ Ideas to Use the Existing School Buildings if the Communities Chose to Reorganize the Two Districts into One -147- A ‘What if’ Picture of a Pupil Transportation Plan -164- A ‘What if” Picture of the Program and Staffing -169- A ‘What if” Picture of a Financial Plan (Assurances not Crafted as Yet) -190- A ‘What if” Picture of a Financial Plan—Reflective of the Statement of Assurances Crafted and Agreed to by Both Boards -202-
APPENDIX
“Questions and Answers” to Commonly Asked Questions about School District Reorganization: Centralization of a Union Free School District and a Common School District; And, Annexation of a Common School District to a Union Free School District -216-

FINDINGS OF THE STUDY
1
PURPOSE OF THE STUDY The Boards of Trustees of Southampton and Tuckahoe School Districts engaged this study as part of their
on-going long-range planning efforts. The two Boards, similar to most school districts in New York State,
continuously balance the mission to provide a comprehensive educational program as a foundation that will
enable students to be ‘globally competitive’ as adult citizens, and the responsibility to provide such a
program within the financial means of the communities that the school districts serve.
The two districts commissioned the study with no preconceived conclusions as to what the findings of the
study might be. The two Boards of Trustees and their superintendents sought the study as a resource to
exercise their due diligence in providing information about a possible option for delivery of public education
by the two districts for review and possible consideration by the respective communities.
The two Boards of Trustees engaged the services of the SES Study Team, LLC to implement a feasibility
study to answer the question:
“Would instructional opportunity be enhanced for all students at a similar or reduced cost to taxpayers by combining the two school districts?”
The role of the SES Study Team is to prepare a study that provides practical, useful data to help the Boards
of Trustees, the Joint Community Advisory Committee, and the communities to engage first in a public
policy discussion as to how best to serve the young people of the communities in the future and, then, second
to make decisions about that future. The study also provides information to the Commissioner of Education.
METHODOLOGY OF THE STUDY
Guiding values and principles of the study process included: 1. Inclusion of, and sensitivity to, all points of view from the communities involved; 2. A focus on answering a set of questions by school district and community stakeholders; 3. An approach that begins with the collection of data, a review of major findings, sharing of
perceptions, recommendations based upon challenges and opportunities, and finally modeling of potential options as a result of reorganization;
4. The role of school district instructional, instructional support, and administrative staff in providing comprehensive data for the study to use to answer its questions;
5. Public transparency of the work and data developed and compiled by the Joint Community Advisory Committee and the Study Team;
6. The creation of a study report that becomes the prime useable tool by members of the communities as they decide how best to educate their children in the future.
FINDINGS OF THE STUDY
2
The key element of the methodology of the study is the Joint Community Advisory Committee. Thirty community members from the two school districts (fifteen from each district) met five times from February 2013 through May 2013 with the consultant team. The purpose of the Joint Community Advisory Committee is to provide representation for all residents, taxpayers, and stakeholders of each respective district in the study process. The charge given to the committee members respectively appointed by each Board was:
◊ To listen to presentations and discussions and provide perspectives and feedback about the data and their analysis during the study process.
◊ To advise the consultants on issues related to the study. ◊ To help keep district residents informed with accurate information about the study. ◊ To promote 3-way communication among school district officials and personnel, the citizens of
the districts, and the SES Study Team consultants. Starting on page -1- of the DATA section of the study report are the criteria used by the Boards to appoint Committee members from those who volunteered to be considered.
The Joint Community Advisory Committee first identified a set of questions that their work and the study should address. These questions became the guide for the research of the study and the agendas of the work sessions of the Joint Committee.
Starting on page -2- of the DATA section of the study report are the questions developed by the Joint Committee to guide the work of the study.
The Joint Community Advisory Committee met with the SES Study Team for five work sessions from February 2013 through May 2013. Data sets were collected, analyzed, and discussed by the Joint Community Advisory Committee and the SES Study Team to address the purpose of the study:
“Would instructional opportunity be enhanced for all students at a similar or reduced cost to taxpayers by combining the two school districts?”
The role of The SES Study Team was to “hold up a mirror” to data about each of the school districts; organize the data without analysis; provide the data to the Joint Community Advisory Committee in an unbiased manner; answer questions of the community volunteers; listen to the perceptions about what are the possible opportunities and challenges if the communities of the two school districts chose to reorganize into one school district. The data included information about the following major categories:
◊ Demographics of the two districts ◊ The current ‘fiscal condition profiles’ of each district ◊ Current property taxes ◊ Pupil capacities of the existing school buildings ◊ Building conditions of the existing school buildings ◊ Current class sizes in delivering the program currently ◊ The elementary program offerings ◊ The secondary program offerings ◊ Interscholastic athletic and co-curricular offerings ◊ State student assessment data ◊ College enrollment data about school district graduates ◊ How the school districts currently share regionally with other school districts ◊ Current instructional and instructional support staffing and deployment ◊ Current expenditures for staffing and program
FINDINGS OF THE STUDY
3
◊ Elements of current labor contracts ◊ Historical retention pattern of staff ◊ Current expenditures to deliver the educational program separately in the two districts
The agendas for each of the work session meetings of the Joint Community Advisory Committee are included starting on page -5- of the DATA section of the study report FINDINGS OF THE RESEARCH AND ANALYSIS OF DATA ABOUT EACH SCHOOL DISTRICT A. Demographics of the Two School Districts 1. Estimated Enrollment Projections of the two school districts. The six sources of current and projected school district enrollment are:
• live births within the school district and their eventual kindergarten enrollment in the district; • new household population with children who move to the district; • new population who move to the district who are at child-bearing age and plan to begin a family; • enrollment of students from non-public schools or from home schooling settings; • school program and academic intervention changes that may increase the success of the school
district in keeping existing enrollment as long as possible to culminate in high school graduation; • a change by other public schools, if any, who tuition students to attend the school district.
All enrollment projections have inherent uncertainties because the assumptions on which they are based can
be affected by changes in human behavior, by the economy, or by other events. Key factors of population
change relating to school enrollments are often interrelated and can multiply as one or more factors
unexpectedly change or change significantly from their status at the time of this study. Future enrollments
are positively affected by:
• Added births in the district and the resulting added kindergarten enrollments. • The reductions in private school/home school/charter school enrollments • The increase in the enrollment retention of students through grade 12 as completers of a
diploma program. • A robust employment market that can attract new residents with children and/or who are at
childbearing age. • A robust housing market that can attract new residents with children and/ or who are at
childbearing age. • Increased enrollment of tuitioned students from other school districts.
Similarly, future enrollment projections can be negatively affected by the antitheses of the same variables.
Therefore, the enrollment projection estimates should be revisited and updated yearly if there are any major
changes in: the assumptions that base the methodology of this study; the annual live birth data for the
district; major shifts in the housing market and employment market opportunities from what has been
expected; changes in the educational program offered; and/or changes in the non-public school, charter

FINDINGS OF THE STUDY
4
school, or out of school district enrollments by school district residents; or major immediate changes to the
numbers of pupils tuitioned from other school districts.
The enrollment projections calculation study data tool is in the DATA section of the study report starting on page -23-.
The separate baseline cohort enrollment projections for the two districts five years into the future for grades K-4, 5-8, and 9-12 are charted below. Note that the Southampton grades 9-12 estimates assume the continued enrollment of Tuckahoe CD 9-12 pupils as tuitioned students.
DATA SNAPSHOT SOUTHAMPTON UFSD Calculation Year Grades
K-4 Grades
5-8 Grades
9-12 (includes tuition pupils from
Tuckahoe SD) CURRENT ENROLLMENT 2012-2013 541 436 558
2014-2015 538 430 540 Baseline Cohort
Low Range 2017-2018 511 451 579
2014-2015 539 430 540 Baseline Cohort Mid Range 2017-2018 508 451 579
2014-2015 558 430 540 Baseline Cohort
High Range 2017-2018 564 451 579
DATA SNAPSHOT TUCKAHOE COMMON SD Calculation Year Grades
K-4 Grades
5-8 Grades
9-12 CURRENT ENROLLMENT 2012-2013 196 160 149
2014-2015 198 142 168 Baseline Cohort
Low Range 2017-2018 187 144 178
2014-2015 206 142 168 Baseline Cohort Mid Range 2017-2018 198 144 178
2014-2015 200 142 168 Baseline Cohort
High Range 2017-2018 203 144 178
Summarized below are the enrollment projection data calculations as they apply to a reorganization of the two districts into one K-12 school district.

FINDINGS OF THE STUDY
5
Calculation Year Grades K-6
Grades 7-8
Grades 9-12
Southampton Residents
Enrollment in Grades 9-12 at
Southampton by Students Who live in
the Tuckahoe Common SD
Area
Total Enrollment Grades 9-12
at Southampton
High School
Total K-12
Number of Grades 9-12 Tuckahoe Common
Students Who are Enrolled
at Westhampton High School
CURRENT COMBINED
ENROLLMENT OF THE TWO
DISTRICTS
2012-2013
977 356 461 97 558 1891 49
2013-2014 1013 299 446 127
573 1885 +40 = 1925
2014-2015 1013 296 452 139
591 1900 +29 = 1929
2015-2016 997 296 463 168
631 1924 +12 = 1934
2016-2017 1004 285 481 193
674 1963 + 0 = 1963
Baseline Cohort Low Range
2017-2018 976 302 490 178
668 1945 + 0 = 1945
2013-2014 1017 299 446 127
573 1889 + 40 = 1929
2014-2015 1021 296 452 139
591 1908 + 29 = 1937
2015-2016 1009 296 463 168
631 1936 + 12 = 1948
2016-2017 1012 285 481 193
674 1972 + 0 = 1972
Baseline Cohort Mid Range
2017-2018 991 302 490 178
668 1960 + 0 = 1960
2013-2014 1028 299 446 127
573 1900 + 40 = 1940
2014-2015 1035 296 452 139
591 1922 + 29 = 1951
2015-2016 1045 296 463 168
631 1973 + 12 = 1985
2016-2017 1067 285 481 193
674 2027 + 0 = 2027
Baseline Cohort High Range
2017-2018 1069 302 490 178
668 2038 + 0 = 2038

FINDINGS OF THE STUDY
6
FINDINGS: Southampton: Elementary grades K-4 enrollment may increase by 23 pupils if the high range estimate is used for planning. The mid-range estimate suggests a decrease of about 25 to 30 pupils over the next five years. Grades 5-8 enrollment may increase by about 15 pupils over the next five years. Resident (no tuition students included) grades 9-12 enrollment is estimated to increase by about 25 pupils over the next five years. Tuckahoe: Elementary grades K-4 enrollment is estimated to remain stable or increase slightly by about 7-10 pupils. Grades 5-8 enrollment may decrease by about 15 pupils over the next five years. Grades 9-12 enrollment is estimated to increase by about 30 pupils over the next five years. If the communities authorized a reorganization of the two districts into one, the earliest the new district could begin operation is on July 1, 2014. It is expected that the K-6 enrollment of a reorganized district will be between 1013 and 1035 pupils in 2014-2015. The new district can expect a grades 7-12 enrollment in 2014-2015 of about 916 pupils. The most conservative enrollment projection estimates a total of 1929 pupils in grades K-12 for a reorganized district in year one of operation in 2014-2015. A mid-range projection estimates a total of 1937 pupils and the high-range projection estimates a total of 1951 pupils for grades K-12. The study uses the high range projection estimates for 2017-2018, five years from the 2013-2014 school year, in its analyses. The enrollment projection of 2039 pupils in grades K-12 (1069 pupils in grades K-6 and 970 pupils in grades 7-12) is used as a baseline in reviewing program opportunities, staffing, and use of facilities to deliver a ‘what if’ program if the two districts reorganized into one. Themes of observations by the Joint Community Advisory Committee regarding the enrollment projections data: Possible Opportunities: Possible Challenges: ◊ The larger potential base of students combined allows more
participation in more and different classes. ◊ Keeping costs under ‘control’ by individual districts
while the student enrollment base may be declining at various grade levels probably will be difficult.
◊ Better use of the faculty and staff we have without increasing class sizes or running classes that are just too small because of declining overall enrollment.
◊ How can we use our current buildings the best given what the enrollment estimates suggest?
◊ When is the point when a high school student population is just too small to offer a set of highly specialized program choices with quality and the opportunities expected for all of the pupils?
2. Federal Census Demographic Data Snapshot of the Two School Districts A valuable tool to use as the Boards and communities make value judgments about future enrollments and
the outlook for the Southampton and Tuckahoe school districts is Federal Census data. Below is a chart that
lists some of the most salient demographic characteristics reported by the American Community Survey
estimate for the five year period 2007-2011. Discussing the similarities and dissimilarities of the
characteristics of the two school districts can be valuable as the Boards, senior leadership, and the
communities define short range and long-range plans for the districts. The Census data are meant to engage

FINDINGS OF THE STUDY
7
discussion about how to serve the pupils and the communities of the school districts. A review of the Census
data variables can provide insights into: community education program opportunities, K-12 program
variables related to the community profiles, public relations/communication strategies with various subsets
of the population in the district, and other school district issues and roles as the school districts plan for the
future.
The DATA section of the study report starting on page -56- includes a comprehensive list of demographic characteristics of each school district in two categories: Demographic and Housing Estimates, Social Characteristics, Economic Characteristics, and Housing Characteristics. An example discussion question for Southampton and Tuckahoe based on the Census data might include:
What challenges and/or opportunities do the following demographic characteristics present to the mission of providing public education in the two districts reorganized into one; or separately as two distinct districts? o 3.7% of the Southampton school district population is under five years old; 4% for the Tuckahoe
school district; What might encourage new population with pre-schoolers or school age children to move to the area?
o the median age of the Southampton school district is 48.7 years; 31.5 for Tuckahoe; Typically 20 to 44 is considered to be prime ‘childbearing years’. What might encourage new population in the 20 to 44 year age group to move to the area?
o 38.1% of the Southampton school district households include one or more people over 65; 32.7% for Tuckahoe; 26.3% of the Southampton school district households include one or more people under 18; 37.7% for Tuckahoe;
o 94.4% of the population in the Southampton school district were in the same residence one year ago; 87.4% of the population in the Tuckahoe school district were in the same residence one year ago;
o 91.5% of the Southampton population has a high school diploma or higher; 91.2% of the Tuckahoe school district population; 44.4% of the Southampton population has a bachelor’s degree or higher; 48.9% for the Tuckahoe school district;
o average household income in the Southampton district is $171,130; $145,337 in the Tuckahoe district;
o average family household income in the Southampton district is $193,723; $165,284 in the Tuckahoe district;
o 2.8% of all the family households in Southampton are below the poverty level; 16.6% in Tuckahoe;
o 5.7% of the total population of Southampton are below the poverty level; 16.1% in Tuckahoe; o 5.9% of all people under 18 in Southampton are below the poverty level; 33.4% in Tuckahoe; o 86.2% of the housing units in Southampton are owner-occupied; 66.7% in Tuckahoe.
A team of ‘guest outsiders’ cannot judge what characteristics are similar or dissimilar—only those who live
in the districts who are part of the culture and value system can make that judgment. The ‘number’ data
reported by the Census for many demographic characteristics of the two school districts seem to be in close
range to each other.
Themes of observations by the Joint Community Advisory Committee regarding the census demographic characteristic data:

FINDINGS OF THE STUDY
8
Possible Opportunities: Possible Challenges: ◊ Many demographics of the two districts are similar. ◊ Overcoming community resistance to giving up unique
sense of each school district. ◊ Given that the demographics are very similar it is possible
a merger would be cohesive. ◊ Poverty rates of the school aged-population are different.
◊ The median age of the Southampton population is ‘well-outside’ the range considered ‘child-bearing’ years. The median age of the population of Tuckahoe is in the low thirties range—well ‘within’ the range considered ‘child-bearing’ years. .
3. Geographic Distances between the School Buildings of the Two School Districts
Sizes of school districts in the region in square miles:
District Square Miles District Square Miles District Square Miles
Riverhead 68.56 Sag Harbor 22.26 Rocky Point 9.12 Connetquot 20.88 Center Moriches 8.95 Reorganized Southampton
UFSD and Tuckahoe Common SD
62.71
Hampton Bays 20.25 Sagaponack 8.82
Montauk 16.62 Wainscott 7.76 Southampton 51.18 East Moriches 16.41 Remsenburg 7.63
Longwood 50.75 Westhampton Beach 16.17 Central Islip 7.61 Amagansett 49.50 Middle Country 15.58 Mount Sinai 7.53
Eastport-So Manor 41.66 Brentwood 14.88 Port Jefferson 7.42 East Hampton 39.33 Shoreham -Wading 14.44 Comsewogue 6.47
Springs 37.52 East Islip 14.31 Sayville 6.32 South Country 34.57 Bridgehampton 14.10 Bay shore 6.30 Fishers Island 31.69 Miller Place 13.71 Quogue 6.04 Three Village 28.30 Oysterponds 12.04 Islip 6.04
Patchoque 27.73 Tuckahoe Common 11.53 Bayport Blue Point 6.02 Shelter Island 26.14 William Floyd 11.45 Greenport 5.41
Sachem 24.49 East Quogue 10.24 New Suffolk 1.63 Mattituck 23.99 Hauppauge 10.24 Fire Island .38 Southold 23.51 West Islip 9.65 Little Flower .10
Potential size of reorganized district made up of Southampton and Tuckahoe: 62.71 square
miles.
Distance in miles between the school district buildings:
Southampton Elementary
Southampton High School
Southampton Intermediate
Tuckahoe Common
2.06
3.06
3.24 Southampton Intermediate
.69
.63
Southampton High School
1.08
Themes of observations by the Joint Community Advisory Committee regarding the geography of the location of the existing school buildings of the two school districts:

FINDINGS OF THE STUDY
9
Possible Opportunities: Possible Challenges: ◊ Serving as many grade levels in one location
probably could provide better programs at a lower cost.
◊ Younger children (probably grades K through 4) should be bused the least. Possibly maintain local elementary schools in the overall plan.
◊ The Tuckahoe school building is very close to the school buildings of Southampton.
◊ Try to keep bus routes to no longer than the time length currently.
4. Fiscal Condition Profiles of the Two Districts
Each district is required to file an external audit report annually with the NYS Comptroller. Such reports
include observations about the finances as well as the practices that the school district employs to manage
funds securely. The annual external audit reports are public documents available from each respective
district. The external auditor for each school district expressed “an unqualified opinion” on the 2012-2013
fiscal year financial statements for each district. Both auditors concluded that “no significant deficiencies
were noted during the audit of the financial statements” for 2012-2013.
Mr. Patrick J. Powers, CPA, PFS senior partner of D’Arcangelo & Co. and a part of the Study Team
analyzed the financial characteristics of the two school districts. School District fiscal condition is
dependent on a number of issues. A major challenge in the current economic environment is that the school
districts need to be able to absorb State Aid decreases, maintain a sound educational program, and deal with
increasing expenses with such items as utilities, health insurance, employee retirement system payments.
Some indicators of fiscal health include such items as:
• Fund balance, including reserves? • Excess of revenues over expenditures? • How reliant is the school district on State aid? • Excess appropriation of fund balance? • Comparison of budgeted revenues and expenditures to actual? • School Lunch subsidies? • Status of tax certiorari or any litigation outstanding?
The DATA section of the study report starting on page -69- includes an analysis of expenditures, revenues, fund balances, and long-term debt of the two districts for the fiscal year ending June 30, 2012. Charted below are the unreserved/unallocated fund balance percentages of the annual approved budgets for
the fiscal year ending June 30, 2012. Both districts meet the 4% threshold.
Unreserved/Unallocated Fund Balance as a % of the Annual Approved Subsequent Year Budget (2012-2013)
Southampton Tuckahoe June 30, 2012 4% 3.71%
Below is a fiscal condition summary comparison of the two districts based on the 2012-2013 fiscal year.

FINDINGS OF THE STUDY
10
Southampton Union Free Tuckahoe Common
1 General Fund Excess Revenues Over Expenditures Last Two Years?2011 - Yes 2012 -
No2011 - No 2012 - Yes
In both districts, excess expenditures due to transfers to the Capital Funds.
2 State and Federal Aid / Total Revenue 3.56% 4.91%
3 K-12 Public School Enrollment including Charter Schools 1,512 347 These enrollment numbers are from 2011-2012.
4 General Fund Expenditures per Pupil $37,226 $46,415
5 Debt Service as a % of Expenditures 7.17% 2.48%Southampton debt service is higher due to new building construction and more renovations. Fixed assets net of depreciation are also approx. 10 times higher).
6 Percent of Unexpended 2012 Budget 4.5% 4.9% Both districts are not overbudgeting appropriations.
7 Percent of Revenue Over (Under) Budget 1.2% 1.5% Estimated revenues close to actual amounts received.
8 2012 Excess (Deficit) Revenues and Expenditures to Budget 5.8% 6.4% Both well within my 10% Rule of Thumb.
9 % of Pupils Eligible for Free/Reduced Price Lunches 25.0% 30.8% The numbers used to derive these percentages were taken from 2010-2011 enrollment summary.
10 School Lunch Fund Balance at June 30, 2012 $235,103 $49,446 Tuckahoe had a net loss of $23,073 in 2012 before a $39,649 transfer in from General Fund.
11 School Lunch Subsidy from General Fund? No Yes $50,000 for Southampton in 2011, none in 2012.
12 Other Post-Employment Benefits $852,345 $293,643Health insurance for premiums retirees. Districts currently have 133 and 24 retirees' receiving health insurance, respectively.
13 Total Medical Insurance expense. $5,677,930 $1,155,161 Amounts include retiree premiums of $852,345 and $293,643.
FINANCIAL CONDITION COMPARISONAS OF JUNE 30, 2012
INDICATORS SCHOOL DISTRICT OBSERVATIONS
9Sub-total General Support, Instruction, and Employee Benefits 49,110,749 14,470,697
10% Total General Support, Instruction, and Employee Benefits of Total 87.25 89.85 What I define as "core expenditures" (General Support, Instruction, and
Employee Benefits) are consistent.
13
11
15
682,174
6
16
Transportation 2,455,360
14 % Community Service of Total
12 % Transportation of Total 4.36
General Support
Financial Characteristic/ Element
1
2
3
7
8
EXPENDITURESFOR THE YEAR ENDED JUNE 30, 2012
4
5
Observation/Items to note or consider:
% Instruction of Total
10,213,374
588,670
7,151,052 1,894,364
12.71 11.76
52.70 63.41
Instruction 29,661,280
7.67
Employee Benefits
% Employee Benefits of Total 21.85 14.67 Percentage of employee benefits is lower in Tuckahoe in part since the district contracts some instructional expenditures through tuition payments.
12,298,417
Community Service
399,548 Debt Service is higher in Southampton due to recent renovation projects bonded in 2008 and 2010.
% Debt Service of Total 7.17 Per OSC ( Office Of the State Comptroller), in 2010, average for Long Island Region was 4.3%.2.48
Debt Service 4,036,892
Southampton Union Free Tuckahoe Common
% General Support of Total
Total 56,285,175 16,106,051
Expenditures-Excluding Transfers (2012):
1,235,806 Tuckahoe contracts out transportation which includes employee benefits in the contract price.
Excluding Capital Fund transfers, both District's expenditures were lower in 2012 from 2011.
2,362,959

FINDINGS OF THE STUDY
11
Financial Characteristic/ Element
Southampton Union Free Tuckahoe Common Observation/Items to note or consider:
***Miscellaneous and Others contains: Miscellaneous, Use of Money and Property and Sale of Property and Compensation for Loss
11 Miscellaneous & Others 627,360 175,739
10% Service Charges of Total 13.00 0.34
9 Charges for Services 7,565,923 56,958 Southampton charges other districts tuition for services, including $4,460,030 in ntuition fron NYS for Native American students.
Total 58,182,984
15,858,411
8
REVENUESFOR THE YEAR ENDED JUNE 30, 2012
1
2
Revenues (2012):
5
16,882,721
6
7
Real Property Taxes and Tax Items (including STAR) 47,920,330
4
3
37,110
% State Aid of Total 3.56
Tuckahoe more reliant on Real Property Tax revenue.% Real Property Taxes of Total 82.36 93.93
Medicaid assistance.
State Aid 2,069,371 791,613
Percentage to total revenue minimal for both Districts.4.69
% Federal Aid of Total 0.00 0.22
Federal Aid 0
Financial Characteristic/ Element Southampton Union Free Tuckahoe Common Observation/Items to note or consider:
Public school enrollment including charter schools per 2011-12 GEN report.
Serial Bonds Due at 6-30-12 48,020,000 1,425,000
Enrollment 1,512 347
Total Estimated Debt 48,020,000 1,425,000Southampton net fixed assets of $61,603,076. Tuckahoe net fixed assets of $6,350,533.
Anticipated Bonding on Projects
Building Aid % 10.0% 10.0% Building aid not a large factor as it is in upstate districts.
Funds Available:
Debt Service Fund
Funds Available Per Student406 0
3,696
Must be used to pay future debt service expense.613,413 0
4,107
12
OUTSTANDING DEBTAS OF JUNE 30, 2012
5
6
7
Net Debt Per Student 28,178
1
Estimated Aid Per Student 3,176 411
2
3
4
Total Estimated Debt Per Student 31,759
11
8
9
10
Debt Per Student 28,583 3,696

FINDINGS OF THE STUDY
12
Financial Characteristic/ Element Southampton Union Free Tuckahoe Common Observation/Items to note or consider:
Southampton has $613,413 in a Reserve for Debt in the General Fund, shown as a Mandatory Reserve above.0
Tuckahoe is appropriating 54% of unrestricted fund balance.
3.71%
Southampton has a high percentage of reserves to expenditures (13.0% excluding Capital Reserve).
4.35%
Tuckahoe's reserves only 5.7% of current year expenditures. 1,421,279
Insurance
Unrestricted Undesignated
580,000
-
8.82%
1,297,148
Unemployment Insurance
Mandatory Reserve Fund 613,413
100,696 Required contributions to the system for 2012 were $1,284,463 and $180,180, respectively.
This is a Debt Service Reserve.
Repair Reserve (Voter approval required to fund, public hearing to spend) 205,781 -
394,804
Encumbrances (Purchase Orders Still Open) 139,832 28,791
700,000
597,148
-
-
949,007
-
12
Appropriated Fund Balance to Reduce Taxes in 2012-13
18 2,380,236
Total Reserves 20,313,293
Tax Reduction
Unreserved Undesignated Fund Balance (Subject to 4.0% of subsequent year's budget)
Unassigned:
Compensated absences $5,031,302 and $257,749 at June 30, 2012.
Established and funded with voter approval.
Tax Certiorari
7
Worker's Compensation
517,037 8
245,495
-
2,960,236
6
Property Loss and Liability -
Employee Benefit Accrued Liability Reserve 3,571,741 Capital Reserve (Voter approval required to establish and fund) 12,941,435
9
Debt Service Fund Balance - 2012 0
Appropriated Fund Balance for Other Purposes
25
13
14
15
16
23
19
22
58,230
Employees' Retirement Contributions 1,833,854
24
Fund Balance as a % of 2012 Expenditures
Unrestricted Appropriated to Reduce Taxes in 2012-13
4.00%
36.09%
1.03%
Restricted
11
1
2
3
4
10
FUND BALANCEAS OF JUNE 30, 2012
20
21
Total Unrestricted:
5
134,456
Restricted:
OVERALL FINDINGS:
◊ Southampton is a larger district both in number of students and approved budgets. The “core expenditures” of General Support, Instruction, and Employee Benefits are consistent as a percentage of expenditures (87.25% for Southampton and 89.85% for Tuckahoe Common).
◊ Southampton fund balances total 41.35% of 2012 expenditures while Tuckahoe totals 16.88%. Southampton appropriated $580,000 for taxes, which equals 3% of the total fund balance from 2012. Tuckahoe appropriated $700,000 for taxes, which equals 20% of the total fund balance from 2012.
◊ Reserves are significantly higher in Southampton; 36.09% of 2012 expenditures ($20,313,293), including encumbrances, versus 8.82% of 2012 expenditures ($1,421,279) for Tuckahoe.
◊ Neither District is reliant on State Aid and both heavily reliant on real property taxes. ◊ Both Districts’ budgets are close to actual amounts. Revenues are within 1.2% and 1.5% of budgeted
amounts and expenditures are within 4.5% and 4.9% in Southampton and Tuckahoe, respectively. ◊ Southampton operates its transportation and purchases school buses in the General Fund while
Tuckahoe contracts out transportation services.

FINDINGS OF THE STUDY
13
◊ Southampton expended $21,991,532 in the Capital Fund over the past two years while Tuckahoe expended $308,427.
◊ Debt service expenditures are much higher in Southampton due to the recent renovation projects. Capital assets are also much higher.
◊ Capital assets (net of depreciation) are substantially higher in Southampton than Tuckahoe ($61,603,076 and $6,350,533). Outstanding debt is also substantially higher ($48,020,000 and $1,425,000).
◊ Both Districts have fund balances in their School Lunch Funds. In 2011, Southampton transferred $50,000 from the General Fund to the school lunch fund. In 2012, Southampton had excess revenues of $13,561 in the School Lunch Fund. In both 2011 and 2012, Tuckahoe subsidized the school lunch program; $47,918 in 2011, and $39,049 in 2012. In 2012, Tuckahoe had excess revenues of $16,076 in the School Lunch Fund after the transfer from the General Fund.
Below is a chart that shows the estimated 2013-2014 property tax levies and rates of each of the school districts.
School Year 2013-2014 Property Tax Shares and Rates as Developed by the Two Respective Districts in May of 2013
ESTIMATED ESTIMATEDAssessed Assessed
Value Value EstimatedTax Levy Apportionment Equalization Full School Tax Percent of Tax Levy 2013-2014
Town 2013-2014 2013-2014 Rate Value Levy Tax Levy Dollars Tax Rate
Southampton 20,756,082,864 20,756,082,864 1.0000 20,756,082,864 50,230,244 100.00% 50,230,244 $2.42
Total 20,756,082,864 20,756,082,864 20,756,082,864 100.00% 50,230,244 2.42 Tax rate on $1000 of Market Value
Southampton 2,193,749,324 2,193,749,324 1.0000 2,193,749,324 16,451,195 100.00% 16,451,195.00 $7.50
Total 2,193,749,324 2,193,749,324 2,193,749,324 100.00% 16,451,195.00 7.50 Tax rate on $1000 of Market Value
*Separate Community Propositions Not Included:Southampton Tuckahoe
Rogers Memorial Library Determined in August.Parish Art Museum $326,509 $7,868Southampton Youth Association $398,320 $53,320Southampton Historical Society $98,000
Southhampton UFSD*
Tuckahoe Common SD*
A major challenge in this time period of less state support of local school district expenditures with state aid
is the resulting influence on the local true tax rates of school districts. Historically, both the Southampton
and Tuckahoe school districts have diligently prepared yearly budget expenditures that as best as possible
balanced student program offerings with what state funds were available and with the level of local property
tax contribution thought to be affordable for their communities.
5. Historical Perspective of Referendum Votes of Each District
From 2005-2012 there have been a total of 40 public referenda in the two school districts for the
annual budgets, bus purchases, and capital projects. The voters approved all but 6 of the public
referenda.

FINDINGS OF THE STUDY
14
HISTORY OF PUBLIC REFERENDUM: SOUTHAMPTON UFSD
BUDGET REFERENDUM BUS REFERENDUM CAPITAL BUDGET REFERENDUM DATE $ AMOUNT #
VOTED ‘YES’
# VOTED
‘NO’
DATE $ AMOUNT # VOTED ‘YES’
# VOTED
‘NO’
DATE $ AMOUNT
# VOTED ‘YES’
# VOTED
‘NO’ 5/17/05 45,078,118 723 500 5/16/06 5,112,499 565 839 5/16/06 46,596,600 631 786 5/16/06 514,650 673 724 6/20/06 46,314,058 866 707 6/20/06 2,044,585 858 707 5/15/07 46,469,258 560 451 6/20/06 514,650 928 630 5/20/08 53,167,689 615 415 6/20/06 2,500,000 863 690 5/19/09 55,359,851 678 378 5/19/09 5,000,000 654 377 2/8/07 32,454,509 892 494 5/18/10 57,271,014 595 499 5/18/10 Bus reserve 661 424 2/8/07 14,776,574 770 603 5/17/11 58,485,815 621 363 5/17/11 Bus reserve 617 344 2/8/07 6,217,653 695 677 5/15/12 59,505,901 566 260 5/15/12 Bus reserve 596 224 5/15/07 2,500,000 663 356 5/15/07 10 yr reserve 590 422 5/20/08 610,000 669 345 5/19/09 2,800,000 723 320 5/19/09 10,000,000
bus/admin facilities reserve
612 414
5/17/11 Capital reserve 639 325 5/17/11 Property
acquisition 634 331
HISTORY OF PUBLIC REFERENDA: TUCKAHOE COMMON SD 5/17/05 11,715,297 253 162 5/16/06 13,009,000 209 268 3/6/07 95000 141 30 6/20/06 12,794,065 281 202 5/20/08 14,972,599 168 97 5/19/09 15,489,875 135 81 5/18/10 16,483,826 212 193 5/17/11 17,061,391 165 157 3/17/09 600,000 156 124 5/15/12 17,811,479 228 275 6/19/12 17,654,252 256 222 12/19/10 95,000 70 249
B. The School Buildings in the Two School Districts
1. Pupil Capacity of Each of the School Buildings
The study provides a school building pupil capacity assessment that first documents how the instructional
spaces in all of the school buildings of the two school districts are utilized in the 2012-2013 school year to
deliver the pre-kindergarten through grade twelve program including special education. Second, it provides
an assessment of pupil capacity of each building as defined by local class size teacher contractual definitions
and the local school district goals of each school district.
The pupil capacity analysis of each school building starts on page -85- in the DATA section of the study report.
The pupil capacity analysis is based on the following assumptions:
The pupil capacity analysis is based on delivering instruction with the following class size goals:
Pre-Kindergarten: 18 pupils Kindergarten, grade 1, grade 2: 20 pupils Grades 3, 4, and 5: 22 pupils Grades 6, 7, 8: 24 pupils Grades 7-12: 24 pupils

FINDINGS OF THE STUDY
15
(Note: Often for specialized Grades 7-12 courses, it is likely that the class sizes for such specialized courses may be between 10-(or fewer pupils as approved by the board)-and 24 pupils. During other instructional periods of the day, it is likely a classroom will host class sizes near the 24 pupil number for other courses less specialized.)
Spaces now designated for instructional support are generally assumed to continue for instructional
support. State Education Department square footage guidelines are applied in calculating the number of pupils
that a specific type of classroom should serve. The analysis, at the present time, does not include renting classrooms to the BOCES to host
consortium shared programs or to other community agencies. Current spaces used for central administration are not ‘re-claimed’ for instructional program pupil
capacity at the present time. It is assumed for the pupil capacity analysis that there are no renovations to change existing space or
the building of new additional space.
Given the above assumptions, the pupil capacity of the school buildings of the Southampton and Tuckahoe School Districts are charted below:
Tuckahoe Common Elementary
Pupil Capacity
Southampton K-6 Pupil Capacity
Southampton 7-12 Pupil Capacity
Elementary School K-4: 556
Intermediate School 7-8: 264
High School 9-12: 879
K-6:
406 Intermediate School 5-6:
276
Total 7-12: 1143
Total K-6 Pupil Capacity Currently Available:* Total 7-12 Pupil Capacity Currently Available:* 1238 1143
Anticipated K-6 Pupil Capacity Need in five years:
Anticipated 7-12 Pupil Capacity Need in five years:
976-1069 970 Current enrollment 2012-2013: 977 Current enrollment 2012-2013: 914
Estimated use of available pupil capacity in 5 years: 78.8% to 86.3%
Estimated use of available pupil capacity in 5 years: 84.9%
Themes of observations by the Joint Community Advisory Committee regarding the existing school building pupil capacity in the two school districts: Possible Opportunities: Possible Challenges: ◊ A reorganization of the two school districts into one
likely will not need new construction or massive renovations. Plenty of current pupil capacity to serve estimated future enrollments K-12.
◊ Determining which buildings get used for what purpose. Might be emotional for some.
◊ Reorganization might make better use of the school buildings of the current two school districts.
◊ The development of a student transportation program .
◊ Reconfiguration of grade levels housed in the various buildings could enhance education concentration and success; and could eliminate some costs for the short and long term.

FINDINGS OF THE STUDY
16
2. Infrastructure Condition of the Existing School Buildings
Combined, the two districts operate four buildings for instructional use. In addition, Southampton operates
an administration building (1968) and a bus facility (1920) and Tuckahoe has a portable unit (1999). The
three schools in Southampton; elementary (1932), intermediate (1958) and high school (1972) serve students
in Pre-Kindergarten through grade 12. Tuckahoe's instructional school serves Pre-K through grade 8.
Each of the districts completed its five-year Building Condition Survey (BCS) during the 2010-11 school
year as required by NYS law. Those documents, completed by licensed architects and/or engineers and filed
with the New York State Education Department provide a thorough assessment of each of the buildings
owned by the districts. In the hundreds of items and systems examined in each of the buildings, no items
were judged “non-functioning” or “critical failure” (see DATA Section page -103- for definitions).
The summary of the Building Condition Surveys of each School District building begins on page -99- in the DATA section of the study report.
A few minor items were deemed “Unsatisfactory” in the Southampton high school building; that being a
replacement of transformers, electrical panels, and generator; in the Intermediate School to improve field
drainage and at the bus garage to repave parking lots. There were no items labeled as “Unsatisfactory” in the
Tuckahoe buildings.
The total combined estimated capital construction expenses for the two districts through 2015-2016 as per
the Building Condition Survey Reports of 2010 would be approximately $10.4 million with most of this
found in the Southampton buildings
For a complete Building Condition Survey that was filed with SED, please contact the respective district
office. Please note that some of these items may have been addressed by the district after the Building
Condition Survey was filed. The condition of some of these items may have changed since the report was
filed with SED.
While the Building Condition Survey Reports do suggest some relatively minor repairs, renovations etc, it is
important to point out that the Study Team deems all the buildings as outstanding and inviting instructional
spaces. Further, none of the buildings would require major renovations to house students safely in the new
district should reorganization occur. That is not to say that the reorganized district could not benefit from
program enhancement renovations through a capital project. Upgrades to science classrooms; other
FINDINGS OF THE STUDY
17
instructional areas; software, hardware, networking, smartboards and other technology and computer
laboratory upgrades; and athletic facilities might be provided as program enhancements.
The two school communities, through their respective boards of trustees and administration, have maintained
their school buildings through periodic and responsible repairs, renovations, and additions via capital
projects over a sustained period of time. However, as with all facilities that experience hundreds of people
using them on a daily basis, there are some areas that would need attention in the coming years, regardless of
whether reorganization occurred or not.
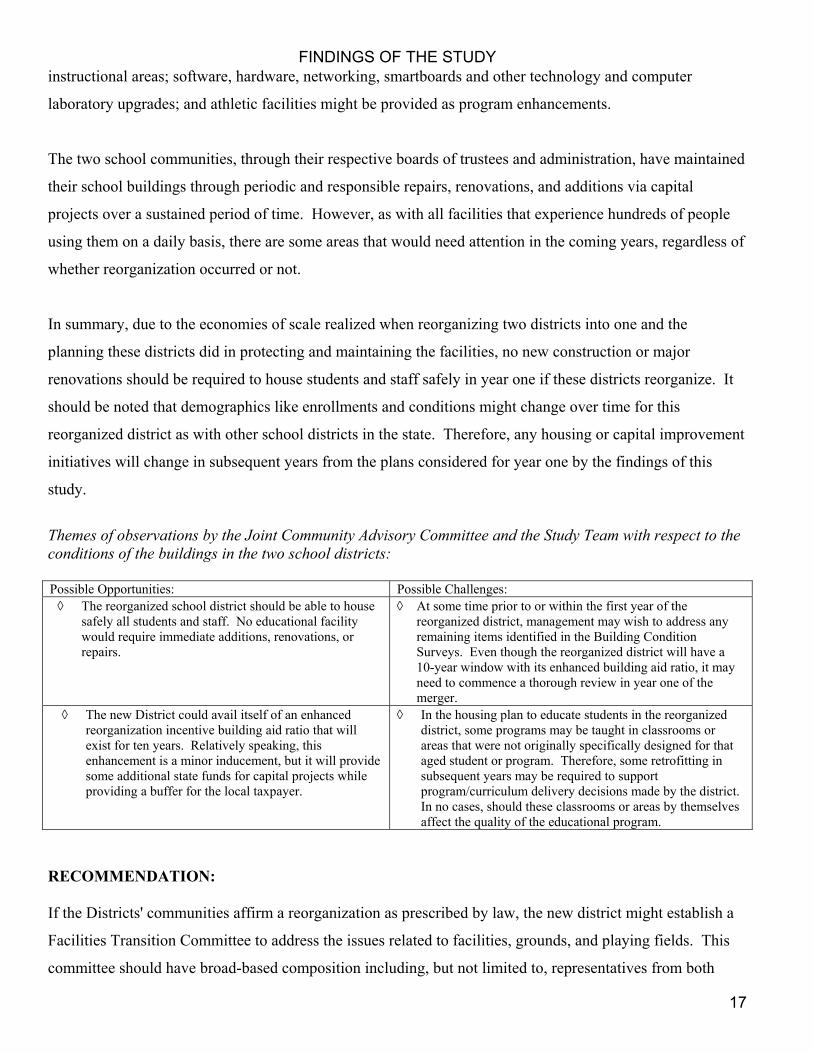
In summary, due to the economies of scale realized when reorganizing two districts into one and the
planning these districts did in protecting and maintaining the facilities, no new construction or major
renovations should be required to house students and staff safely in year one if these districts reorganize. It
should be noted that demographics like enrollments and conditions might change over time for this
reorganized district as with other school districts in the state. Therefore, any housing or capital improvement
initiatives will change in subsequent years from the plans considered for year one by the findings of this
study.
Themes of observations by the Joint Community Advisory Committee and the Study Team with respect to the conditions of the buildings in the two school districts: Possible Opportunities: Possible Challenges: ◊ The reorganized school district should be able to house
safely all students and staff. No educational facility would require immediate additions, renovations, or repairs.
◊ At some time prior to or within the first year of the reorganized district, management may wish to address any remaining items identified in the Building Condition Surveys. Even though the reorganized district will have a 10-year window with its enhanced building aid ratio, it may need to commence a thorough review in year one of the merger.
◊ The new District could avail itself of an enhanced reorganization incentive building aid ratio that will exist for ten years. Relatively speaking, this enhancement is a minor inducement, but it will provide some additional state funds for capital projects while providing a buffer for the local taxpayer.
◊ In the housing plan to educate students in the reorganized district, some programs may be taught in classrooms or areas that were not originally specifically designed for that aged student or program. Therefore, some retrofitting in subsequent years may be required to support program/curriculum delivery decisions made by the district. In no cases, should these classrooms or areas by themselves affect the quality of the educational program.
RECOMMENDATION: If the Districts' communities affirm a reorganization as prescribed by law, the new district might establish a
Facilities Transition Committee to address the issues related to facilities, grounds, and playing fields. This
committee should have broad-based composition including, but not limited to, representatives from both

FINDINGS OF THE STUDY
18
merged districts; buildings and grounds staff, students, faculty, support staff, administration, parents,
community, and perhaps a school architect as an advisor.
The new District could avail itself of the enhanced incentive building aid ratio that can be accessed during
the first ten years of the new district. This state building aid for a newly organized school district could
assist the funding of repairs or renovations to all facilities and grounds that could last and serve the
community and generations of pupils far into the future.
C. The Educational Program in the Two School Districts 1. Current Class Sizes Grades Pre-K-12 Charted below is a list of any teacher contract language and/or School Board policies currently in place that refers to class size.
Southampton School District Teacher Contract Language The Southampton UFSD Teacher Association contract states in Article XII, J. MAXIMUM CLASS SIZE: No class in the District will exceed a maximum of thirty students with the exception of physical education (45), typing (50), study halls (50), and band and chorus.
Tuckahoe School District Teacher Contract Language There are no specific sections of Board Policy or clauses/pages in the contract with the Faculty Association. The following on-average class size goals are identified by both superintendents as reflective of the instructional delivery values of both school districts. The pupil capacity analysis of each school building is based on delivering instruction with the following on-average class size goals:
Pre-Kindergarten: 18 pupils Kindergarten, grade 1, grade 2: 20 pupils Grades 3, 4, and 5: 22 pupils Grades 6, 7, 8: 24 pupils Grades 9-12: 24 pupils
Charted below is a summary of the grades kindergarten through grade 6 class section size ranges and
averages in each of the two school districts as of October 1, 2012.
The total collection of class size data, including the size of each grade level section across the two districts starts on page -81- of the DATA section of the study report.

FINDINGS OF THE STUDY
19
2012-2013 SCHOOL YEAR GRADE LEVEL CLASS SECTION ENROLLMENTS AS OF OCTOBER 1, 2012
GRADE LEVEL
Southampton Elementary Tuckahoe Elementary CLASS SIZE GOAL AS DEFINED BY THE DISTRICTS
Pre-K Range 19-21 16-16 Pre-K Average 20 16 18
K Range 22-24 20-21
K Average 22.8 20.5 20 GRADE 1 Range 19-21 18-19
GRADE 1 Average 19.8 18.5 20 GRADE 2 Range 21-25 21-21
GRADE 2 Average 22.4 21 20 GRADE 3 Range 19-22 17-18
GRADE 3 Average 19.8 17.5 22 GRADE 4 Range 18-23 17-18
GRADE 4 Average 21 17.5 22 GRADE 5 Range 17-23 19-20
GRADE 5 Average 20.4 19.5 22 GRADE 6 Range 16-17 20-22
GRADE 6 Average 16.6 21 24 Charted below is a summary of the grades 7 through 12 English class section size ranges and averages in each of the two school districts as of October 1, 2012.
2012-2013 SCHOOL YEAR GRADES 7-12 ENGLISH CLASS SECTION ENROLLMENTS AS OF OCTOBER 1, 2012
Findings:
All three sections of Pre-K at Southampton exceed the class size goal of 18. Both sections at Tuckahoe are below the class size goal of 18.
• Across the two school districts six of the seven sections at K are above the class size goal of 20 pupils; one is at the goal.
• Across the two school districts four of the seven sections at grade 1 are below the class size goal of 20 pupils; two are at goal; one is above.
• Across the two school districts, seven of the seven sections at grade 2 are above the class size goal of 20 pupils.
ENGLISH CLASSES GRADE LEVEL
Southampton High School
Tuckahoe High School
CLASS SIZE GOAL AS DEFINED BY THE DISTRICTS
GRADE 7 Range 22-25 17-18 GRADE 7 Average 23.2 17.5 24
GRADE 8 Range 18-26 22-22 GRADE 8 Average 22 22 24
GRADE 9 Range 11-23 GRADE 9 Average 15.3 24 GRADE 10 Range 11-30
GRADE 10 Average 19.4 24 GRADE 11 Range 7-22
GRADE 11 Average 16.9 24 GRADE 12 Range 5-24
GRADE 12 Average 14.3 24

FINDINGS OF THE STUDY
20
• Across the two school districts six of the seven sections at grade 3 are below the class size goal of 22 pupils; one is at the goal.
• Across the two school districts all four of the seven sections at grade 4 are below the class size goal of 22 pupils; two are above and one is at the goal.
• Across the two school districts five of the seven sections at grade 5 are below the class size goal of 22 pupils; one is above and one is at the goal.
• Across the two school districts, all seven of the seven sections at grade 6 are below the class size goal of 24 pupils.
• There are 14 class sections of English classes in grades 7 and across the two districts; two are at the class size goal of 24; ten are below and two are at the goal.
• There are 33 class sections of English classes in grades 9 through 12 at Southampton; one section is at the goal of 24 pupils; one section is above the goal; 31 class sections are below the class size goal.
Themes of observations by the Joint Community Advisory Committee regarding the class section sizes currently in the two school districts: Possible Opportunities: Possible Challenges: ◊ A larger geographic area to provide public education will
help the district deal with decreases or increases of school age population with more quality and efficiency than would be possible in separate districts.
◊ As finances get more challenging, will the separate districts have to raise the class size goals to meet an affordable/responsible total budget?
◊ A combined volume of students at each age level/grade level probably will allow the two districts to keep low class sizes and do it with the same or fewer employees than are now on staff.
◊ Currently, as separate districts, the lack of a volume of enrollment at certain grade levels in the two districts does not allow the individual school districts to fully use the skills of the staff they have already. For example, if there are only 15 pupils in a grade 7 class with a local class size cultural standard of 24 pupils, then only 17/24 or 73% of the professional skill sets of the instructor are being utilized to serve pupils. Working to reach at least 90% of the grade level section class size goal is a good instructional goal and a good financial goal.
◊ Together the districts might have a better chance of keeping the lower class size goals and maintaining educational programs.
◊ If enrollment in the Southampton 9-12 population declines, will the loss of these numbers be such that there will be a decline in the comprehensive set of courses able to be offered?
◊ Similar class sizes now generally indicate that the districts have similar philosophies regarding appropriate class size.
◊ There seems to be the availability of room in existing English classes at Southampton to serve more pupils.
2. The Pre-K through Grade 12 Program Offerings Members of the Joint Community Advisory Committee met to review elementary and middle level program
information from the leadership teams of Southampton and Tuckahoe. The 9-12 program review was
presented by the Southampton team as Tuckahoe’s instructional program consists of grades K-8.
The process of the review consisted of examination of the program elements charts by the CAC and then
questions of the instructional leadership teams of Southampton and Tuckahoe. The data sets found in the
data section provide an overview of the program by listing out the various program elements of each

FINDINGS OF THE STUDY
21
district’s elementary and middle level offerings and then Southampton’s secondary program. Members of
the CAC were able to review a side-by-side analysis of the core and encore area curriculum of each district.
During the panel presentations, district leadership teams responded to a wide range of questions from CAC
members. When the discussion shifted to a review of the secondary program, Southampton’s team was
asked to respond to a series of questions related to how a secondary school must serve a range of pupils who
have many different ideas about what their post graduate life might look like.
With these ideas in mind, the leadership teams provided guidance on many different questions/topics,
including responding to the overarching question below:
If resources were available, what added high school learning opportunities might increase the success of the current efforts to:
Help students have the skill sets and goal setting skills to consider a higher education opportunity after high school graduation?
Help the students—who choose not to pursue higher education options after high school graduation—have marketable employability skills for the work place as a major part of their high school programs for graduation?
Enlarge the range of higher education options that are academically considered for attendance by high school graduates?
Help students to learn how to best access resources in their postgraduate years? What are the networking skills students will need to further connections that will help them in their college and work years?
The data set which begins on page -104- of the DATA section of the study provides a snapshot of the programs by listing out the various program elements of each district’s instructional program offerings.
Major findings from the review of the program offerings include:
◊ Southampton and Tuckahoe have strong commitments to their Pre-K programs. Both districts have quality programs that are highly supported in both communities.
◊ Both programs use a traditional grade level model of instruction at the elementary level. Tuckahoe has grade level teams to support students and ensure consistency of support and instruction and Southampton has a unique Dual Language approach to help meet the needs of their diverse student population.
◊ Enrichment activities are integrated in the general education classroom throughout the school year. In addition, there are summer enrichment programs available at Tuckahoe for students in the areas of math, science, and technology.
◊ Both districts utilize an integrated teaching model to support students with special needs. Special education, general education, and ESL teachers provide a team approach to instruction.
◊ Speech instruction is available to meet mandated needs of students per IEP requirements and time is allocated for general education students.

FINDINGS OF THE STUDY
22
◊ Both districts support reading instruction with specialized reading teachers. At Southampton, a Reading Recovery Model is also used to support students’ needs.
◊ Both districts work hard to provide music and fine arts opportunities for their elementary and middle level students. There are many opportunities in these encore courses, and students also have the chance to participate in band and chorus. Lessons are available for students in both group and individual settings. Beyond the classroom day, there is a wide range of extra-curricular activities for students in the elementary and middle level. To highlight a few, students can take part in Gymnastics, Performance, Yearbook and Guitar Club at Southampton and at Tuckahoe, students can be in the Newspaper, Yearbook, Jazz Band, and Photography Club.
◊ Southampton and Tuckahoe provide counselors and social workers to support students at the elementary and secondary levels. There was discussion raised by members of the leadership teams and CAC members that it would be helpful to have more counselors on staff at the earlier levels. It was noted there appear to be more students entering school with greater social/emotional needs and having more staff at an earlier level could be beneficial.
◊ Both CAC members and district staff expressed the importance of the culture at their schools and the caring support of the faculty and staff for the students.There is a strong feeling about the importance of the schools as the educational and cultural hub of the local communities.
◊ Members of the CAC and the district leadership teams expressed concerns about what continued budget cuts will do to the elementary/middle programs of both districts. The discussion centered around the possibility of reduced staffing impacting opportunities for students and not being able to provide all the support necessary for students at a critical time of their development.
◊ Southampton has an extensive array of program opportunities for students at the secondary level. Beyond the core offerings available, there are many options for students to pursue areas of expanded instruction. Courses in Film Study, Journalism, Philosophy, Psychology, Astronomy, Physics, Science Research and Oceanography, Sports Management, Theatre Technology, Gourmet Foods, Advanced Drawing, Band, Chorus and Drama, are all available to meet the varied interests of students.
◊ The varied instructional needs of students are met at the secondary level by Southampton’s supportive instructional models. Special education resource rooms, integrated co-teaching instruction, general education and honors classes as well as college level and many options in AP courses are different ways that Southampton works to tailor their secondary program to their diverse student population.
◊ There are numerous clubs and extra-curricular program options available for students both during the school day and after hours. There is a wide range of options for students to pursue at this level. In this day of program cuts, it is impressive to see the number of programs Southampton has managed to continue to offer to their students.

FINDINGS OF THE STUDY
23
◊ Guidance counselors, social workers, and a school psychologist provide counseling services to students through an integrated support model at the secondary level.
◊ At all the schools, Southampton and Tuckahoe take school safety very seriously. Besides security staff that is present, teachers and support staff do an excellent job in assisting to maintain a safe and supportive school environment.
Themes of observations by the Joint Community Advisory Committee regarding the Pre- Kindergarten through grade 8 program offering in the two school districts and 9-12 in Southampton: Possible Opportunities: Possible Challenges: ◊ If the districts were to reorganize, CAC members felt that
Southampton and Tuckahoe would have the opportunity to provide more program options for students both during and after school. Both districts’ CAC members suggested that increased funding available through a reorganization could be used to support additional enrichment programs at the elementary and middle levels
◊ A potential challenge was related to curricular materials. Different reading/math series would need to be united to provide a unified program.
◊ With more students coming to school with emotional and family problems, CAC members felt the reorganization could help to support and provide enhanced services at the elementary level.
◊ The issue of school identity was discussed at length by members of the CAC. Strong feelings were expressed about the importance of school culture and traditions.
◊ A potential benefit of a reorganization could be the increased coordination of curriculum and instructional strategies at the elementary and middle levels. Bringing the two staffs together could provide enhanced opportunities through the combination of the two school districts’ staff and their shared expertise.
◊ Transportation issues were also a major concern reviewed by CAC members. Many spoke about the potential difficulties of new busing patterns and how that could affect what happens to children before and after school.
◊ A reorganization could allow the combining of the best of both districts. Combining outstanding elements of the two districts would enhance the opportunities of both Southampton and Tuckahoe students. Increasing both core and extra-curricular options through a reorganization becomes a ‘win-win’ situation for the students of the two districts.
◊ Blending the students of the two districts together could lead to some ‘growing pains’, although most felt that if there were difficulties they would be short lived. That said, CAC members of both Southampton and Tuckahoe expressed their thoughts that the leadership teams should proactively look at ways to make parents and community members as comfortable as possible with the many changes that could come about with a reorganization.
◊ CAC members and the school leadership teams expressed concern about the limited opportunities for professional development for staff members. A reorganization could provide some additional funding as well as utilizing the talents of the two staffs that would support increased opportunities for staff.
◊ The topic of new APPR regulations came up and how that would now work. There was some concern by staff members on the CAC about what this would mean as the two schools came together.
◊ Since so many of the students have known each other from an early age, CAC members felt that combing the two schools would not provide many problems for students. In fact, many CAC members expressed their thoughts that the two schools coming together could be a relatively smooth process. It was noted that it might not be so smooth for some of the parents.

FINDINGS OF THE STUDY
24
◊ A reorganized district could help to maintain current interscholastic sports opportunities and perhaps even add additional options. By having all the Tuckahoe secondary students attend Southampton there could be more opportunities for student involvement in sports and extra-curricular programs.
3. Interscholastic Athletics/Co-curricular/Music/Drama Offerings
Interscholastic athletics are an important aspect of a student's school life as well as a major source of
pride for students and local communities. Any discussion of a reorganization of schools and its impact
on athletics can be an emotional topic. This is less compelling in this annexation when Southampton
operates a high school and Tuckahoe serves students through grade 8 (and most of the Tuckahoe students
attend Southampton High School after grade 8). Currently, both districts offer athletic opportunities
through grade 8; while Southampton offers an array of high school interscholastic athletic teams for both
boys and girls encompassing the fall, winter, and spring seasons.
The complete inventory of co-curricular, athletic and music/drama program offerings are charted starting on page -113- of the DATA section of the study report. Both schools compete in Section XI of the New York State Public High School Athletic Association.
Based on student enrollment; Tuckahoe is classified as a “Class C” school, while Southampton is a
“Class B” school for five classification sports. In some sports, they are a “Class C” school. An
annexation of the two districts likely would result in few changes, if any, to the classifications,
competition schedule and travel distances and times since most of the Tuckahoe students currently
attend Southampton for high school and its athletic programs.
Southampton offers opportunities within each sport season. During the benchmarked 2012-2013
school year, Southampton offered 25 different interscholastic sports programs at the varsity, junior
varsity and modified levels (for a total of 58 teams). Tuckahoe also offered similar opportunities at the
modified level. Its high school students participated at the high school to which they attended
(mostly at Southampton, but also at Westhampton). This is exclusive of elementary programs.
Within those sports teams, there is also a range of participation levels. In some cases, the level of
student participation barely may be sufficient to field safely a competitive team. It should also be
pointed out that funds were budgeted for six boys and girls athletic teams in Southampton, but did not
have enough participants to field a team. One comment at the CAC level was that, if annexation were
to occur and all Tuckahoe students attended Southampton High School and were part of the same

FINDINGS OF THE STUDY
25
school system, it is possible that there may be enough students to field these teams. On other teams, the
participation level is sufficient to support the program.
Coaches in the sports within each district are remunerated for their services based upon contractual
agreements developed through the collective bargaining process.
During the study process, the two Directors of Athletics participated in discussions with the Joint
Community Advisory Committee. The Joint Community Advisory Committee and the athletic
directors discussed current offerings, various participation levels, opportunities available if
reorganization occurred and the challenges facing a new athletic program.
Some members of the Joint Community Advisory Committee believed it was important that additional
athletic opportunities be made available to order to ensure that if any student wants to participate
there is an athletic activity or team that the student can pursue.
Themes of observations by the Joint Community Advisory Committee, the Directors of Athletics and the Study Team with respect to interscholastic athletics:
Possible Opportunities: Possible Challenges: ◊ The reorganized district may be able to provide junior
varsity or modified teams in more sports in which they currently participate, pending student interest
◊ With the possibility of more student athletes to select from, the competition to be selected for a particular team or for playing time may increase. Some students may choose not to participate.
◊ An annexed school district with a slightly larger/stable student population base may be able to offer more and different athletic opportunities for its students.
◊ With more sports teams available, more students might have the opportunity to play a high school sport.
◊ Intramural sports opportunities to involve more students than those participating in interscholastic teams may be developed (elementary through high school).
◊ A larger talented pool of teachers and others who are available to coach specific sports.
◊ Additional late buses Monday through Friday may enable students to participate in athletics, co-curricular activities, and music/drama as an option because of the resources available to accommodate all students of the entire district.
◊ The town feeder programs (i.e. basketball; soccer) where youngsters already bond together could be further coordinated with community sponsors and coaches.
◊ Since each district prior to any reorganization has good quality facilities, gymnasiums and playing fields, there will be quality gym space available for practices at all levels as well as good quality fields for all playing levels.
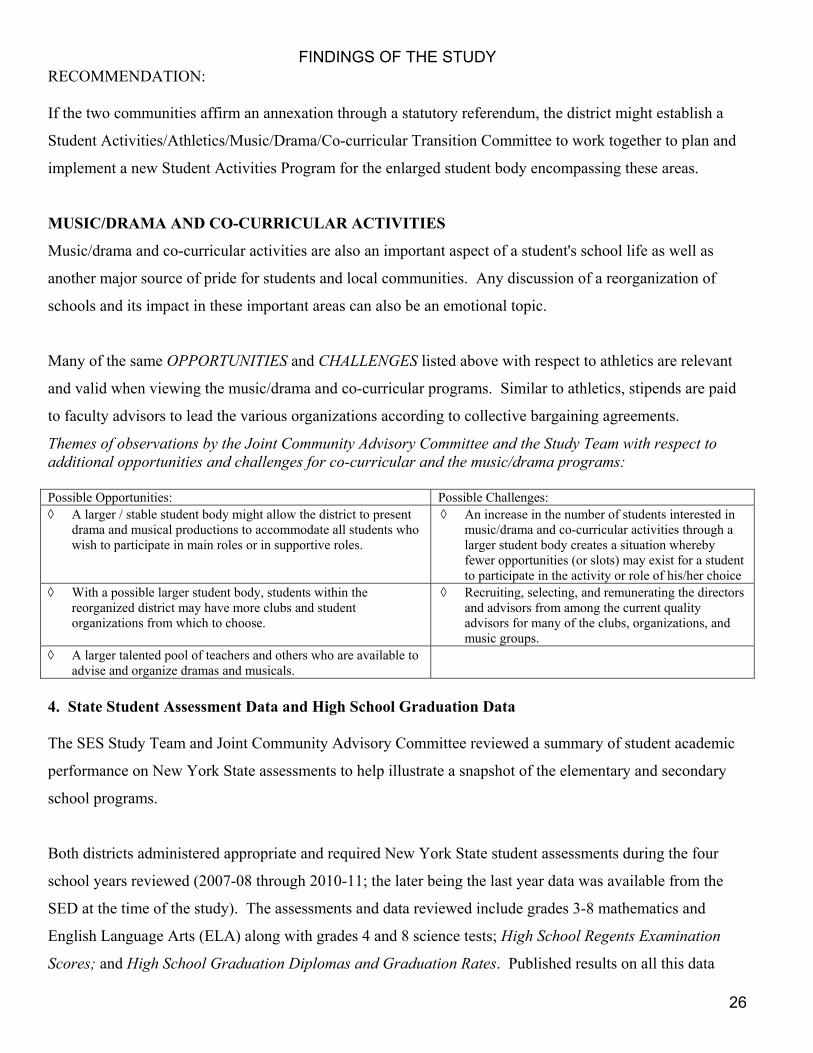
FINDINGS OF THE STUDY
26
RECOMMENDATION: If the two communities affirm an annexation through a statutory referendum, the district might establish a
Student Activities/Athletics/Music/Drama/Co-curricular Transition Committee to work together to plan and
implement a new Student Activities Program for the enlarged student body encompassing these areas.
MUSIC/DRAMA AND CO-CURRICULAR ACTIVITIES
Music/drama and co-curricular activities are also an important aspect of a student's school life as well as
another major source of pride for students and local communities. Any discussion of a reorganization of
schools and its impact in these important areas can also be an emotional topic.
Many of the same OPPORTUNITIES and CHALLENGES listed above with respect to athletics are relevant
and valid when viewing the music/drama and co-curricular programs. Similar to athletics, stipends are paid
to faculty advisors to lead the various organizations according to collective bargaining agreements.
Themes of observations by the Joint Community Advisory Committee and the Study Team with respect to additional opportunities and challenges for co-curricular and the music/drama programs: Possible Opportunities: Possible Challenges: ◊ A larger / stable student body might allow the district to present
drama and musical productions to accommodate all students who wish to participate in main roles or in supportive roles.
◊ An increase in the number of students interested in music/drama and co-curricular activities through a larger student body creates a situation whereby fewer opportunities (or slots) may exist for a student to participate in the activity or role of his/her choice
◊ With a possible larger student body, students within the reorganized district may have more clubs and student organizations from which to choose.
◊ Recruiting, selecting, and remunerating the directors and advisors from among the current quality advisors for many of the clubs, organizations, and music groups.
◊ A larger talented pool of teachers and others who are available to advise and organize dramas and musicals.
4. State Student Assessment Data and High School Graduation Data The SES Study Team and Joint Community Advisory Committee reviewed a summary of student academic
performance on New York State assessments to help illustrate a snapshot of the elementary and secondary
school programs.
Both districts administered appropriate and required New York State student assessments during the four
school years reviewed (2007-08 through 2010-11; the later being the last year data was available from the
SED at the time of the study). The assessments and data reviewed include grades 3-8 mathematics and
English Language Arts (ELA) along with grades 4 and 8 science tests; High School Regents Examination
Scores; and High School Graduation Diplomas and Graduation Rates. Published results on all this data

FINDINGS OF THE STUDY
27
have been obtained from the New York State Education Department website and can be found in the DATA
section of the study. Published results for 2011-2012 were not available at the time. In addition to
assessment data, the Study Team also collected a sample of student post secondary pursuits of each school
and listed the plans of graduates from the classes of 2009-2012.
The summary of the student performance measures and post secondary data begins on page –118- of the DATA section of the study document. Comparisons of assessment results among school buildings with relatively small student enrollments can
vary depending on the year and composition of a specific grade level. It is not uncommon also, for there to
be differences between schools depending on the grade level as the scope and sequence of the English
Language Arts, math, and science curricula are delivered over a set of years.
In reviewing the assessment results in totality, there appear to be more similarities than differences in the
student assessment performance as measured by the New York State Assessment tests between the two
school districts. The data consisting of the percentages of students who scored at or above a Level 3 for the
four school years from 2007-08 through 2010-2011 state assessments is charted below. Level 3 is defined as
“Meeting Learning Standards; student performance demonstrates an understanding of the content expected in
the subject and grade level.” It should also be noted the high percentage of students scoring at or above
Level 2. TUCKAHOE SCHOOL STUDENT PERFORMANCE - PERCENTAGE SCORING AT LEVELS * 2010-11 2009-10
TEST NO. TESTED
LEVEL 2-4
LEVEL 3-4
LEVEL 4
NO. TESTED
LEVEL 2-4
LEVEL 3-4
LEVEL 4
GR 3 ELA 39 72 38 3 44 80 48 14
GR 3 MATH 39 92 54 8 44 95 50 30
GR 4 ELA 49 86 33 0 38 89 55 0
GR 4 MATH 49 94 41 10 38 92 55 24
GR 4 SCIENCE 46 98 87 33 38 95 68 42
GR 5 ELA 35 83 49 6 50 90 56 16
GR 5 MATH 35 97 60 31 53 91 66 19
GR 6 ELA 46 89 57 0 22 91 68 14
GR 6 MATH 48 100 88 48 22 95 95 86
GR 7 ELA 24 92 67 0 36 92 53 8
GR 7 MATH 24 96 88 58 37 97 73 49
GR 8 ELA 33 100 70 0 43 95 65 14
GR 8 MATH 33 94 70 24 43 93 77 26
REGENTS SCI 33 33 31 10 43 39 37 16 2008-09 2007-08
TEST NO. TESTED
LEVEL 2-4
LEVEL 3-4
LEVEL 4
NO. TESTED
LEVEL 2-4
LEVEL 3-4
LEVEL 4
GR 3 ELA 42 93 71 17 45 100 60 9
GR 3 MATH 43 100 93 44 48 98 83 23
GR 4 ELA 49 96 69 0 30 93 77 7
GR 4 MATH 47 98 85 15 30 93 87 13
GR 4 SCI 48 96 88 33 29 97 83 38
GR 5 ELA 22 100 91 23 41 100 88 5
GR 5 MATH 23 100 91 61 42 100 93 26
GR 6 ELA 32 100 100 19 36 100 81 17
GR 6 MATH 34 100 97 35 39 97 87 64
GR 7 ELA 36 100 86 14 33 100 76 6
GR 7 MATH 35 97 89 34 33 100 91 24
GR 8 ELA 32 100 81 0 25 100 64 0
GR 8 MATH 32 100 88 3 27 89 74 33
REGENTS SCI 31 30 30 9 27 24 22 10 * New York State Education Department Accountability & Overview Report NO. TESTED = ALL STUDENTS
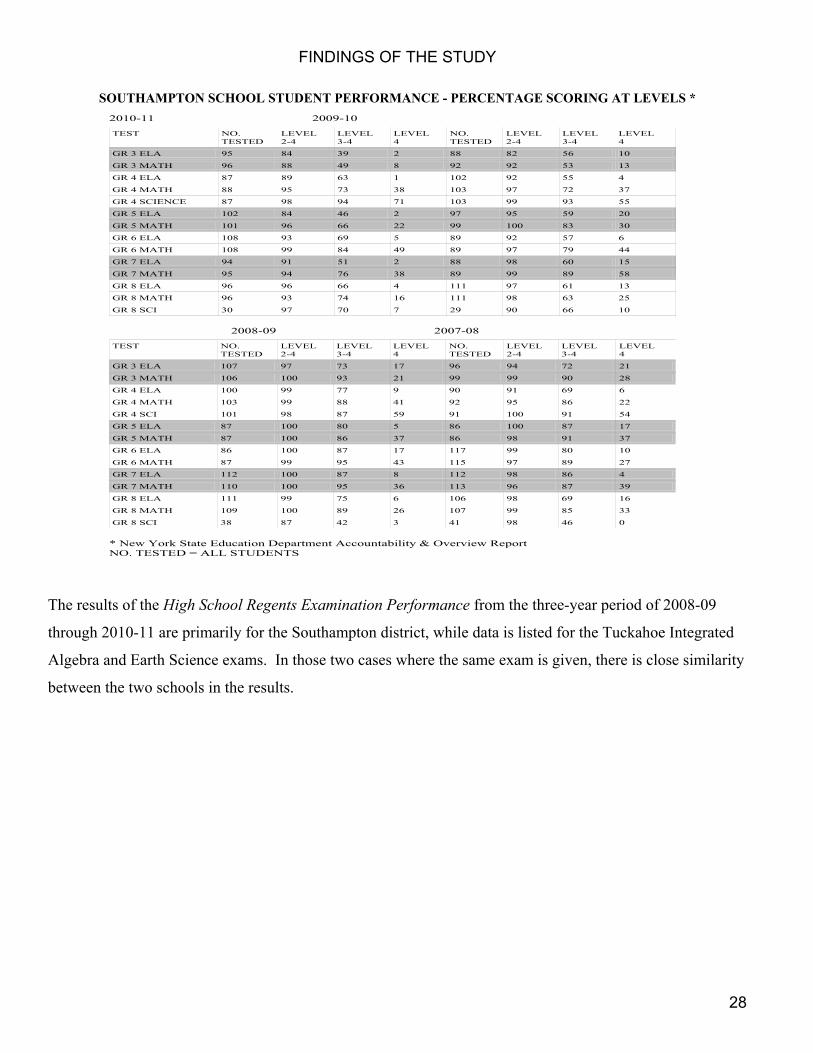
FINDINGS OF THE STUDY
28
SOUTHAMPTON SCHOOL STUDENT PERFORMANCE - PERCENTAGE SCORING AT LEVELS * 2010-11 2009-10
TEST NO. TESTED
LEVEL 2-4
LEVEL 3-4
LEVEL 4
NO. TESTED
LEVEL 2-4
LEVEL 3-4
LEVEL 4
GR 3 ELA 95 84 39 2 88 82 56 10
GR 3 MATH 96 88 49 8 92 92 53 13
GR 4 ELA 87 89 63 1 102 92 55 4
GR 4 MATH 88 95 73 38 103 97 72 37
GR 4 SCIENCE 87 98 94 71 103 99 93 55
GR 5 ELA 102 84 46 2 97 95 59 20
GR 5 MATH 101 96 66 22 99 100 83 30
GR 6 ELA 108 93 69 5 89 92 57 6
GR 6 MATH 108 99 84 49 89 97 79 44
GR 7 ELA 94 91 51 2 88 98 60 15
GR 7 MATH 95 94 76 38 89 99 89 58
GR 8 ELA 96 96 66 4 111 97 61 13
GR 8 MATH 96 93 74 16 111 98 63 25
GR 8 SCI 30 97 70 7 29 90 66 10 2008-09 2007-08
TEST NO. TESTED
LEVEL 2-4
LEVEL 3-4
LEVEL 4
NO. TESTED
LEVEL 2-4
LEVEL 3-4
LEVEL 4
GR 3 ELA 107 97 73 17 96 94 72 21
GR 3 MATH 106 100 93 21 99 99 90 28
GR 4 ELA 100 99 77 9 90 91 69 6
GR 4 MATH 103 99 88 41 92 95 86 22
GR 4 SCI 101 98 87 59 91 100 91 54
GR 5 ELA 87 100 80 5 86 100 87 17
GR 5 MATH 87 100 86 37 86 98 91 37
GR 6 ELA 86 100 87 17 117 99 80 10
GR 6 MATH 87 99 95 43 115 97 89 27
GR 7 ELA 112 100 87 8 112 98 86 4
GR 7 MATH 110 100 95 36 113 96 87 39
GR 8 ELA 111 99 75 6 106 98 69 16
GR 8 MATH 109 100 89 26 107 99 85 33
GR 8 SCI 38 87 42 3 41 98 46 0 * New York State Education Department Accountability & Overview Report NO. TESTED = ALL STUDENTS
The results of the High School Regents Examination Performance from the three-year period of 2008-09
through 2010-11 are primarily for the Southampton district, while data is listed for the Tuckahoe Integrated
Algebra and Earth Science exams. In those two cases where the same exam is given, there is close similarity
between the two schools in the results.

FINDINGS OF THE STUDY
29
HIGH SCHOOL REGENTS EXAMINATION PERFORMANCE * NUMBER TESTED
% AT OR ABOVE 55
% AT OR ABOVE 65
% AT OR ABOVE 85 REGENTS
YEAR
SOUTH TUCK SOUTH TUCK SOUTH TUCK SOUTH TUCK 10-11 154 0 95 NA 90 NA 44 NA 09-10 142 0 94 NA 92 NA 35 NA
COMPREHEN. ENGLISH
08-09 161 0 93 NA 89 NA 43 NA 10-11 140 17 96 100 89 100 14 71 09-10 167 23 92 100 86 100 10 78
INTEGRATED ALGEBRA
08-09 131 8 98 100 89 100 10 0 10-11 103 0 82 NA 66 NA 17 NA 09-10 89 0 81 NA 66 NA 31 NA
ALGEBRA 2/ TRIG
08-09 NA 0 NA NA NA NA NA NA 10-11 138 0 94 NA 86 NA 28 NA 09-10 97 0 99 NA 89 NA 39 NA
GEOMETRY
08-09 132 0 98 NA 92 NA 40 NA 10-11 169 0 89 NA 78 NA 28 NA 09-10 164 0 86 NA 81 NA 33 NA
GLOBAL HISTORY
08-09 166 0 91 NA 81 NA 31 NA 10-11 148 0 95 NA 88 NA 54 NA 09-10 143 0 97 NA 94 NA 44 NA
US HISTORY & GOV.
08-09 143 0 99 NA 92 NA 52 NA 10-11 200 0 98 NA 97 NA 48 NA 09-10 130 0 99 NA 98 NA 48 NA
LIVING ENVIRON.
08-09 198 0 99 NA 97 NA 57 NA 10-11 83 33 99 100 96 94 43 30 09-10 141 43 94 91 84 86 43 37
EARTH SCIENCE
08-09 120 31 93 97 88 97 49 29 10-11 91 0 96 NA 77 NA 18 NA 09-10 97 0 92 NA 77 NA 20 NA
CHEMISTRY
08-09 122 0 94 NA 71 NA 11 NA 10-11 36 0 89 NA 64 NA 17 NA 09-10 58 0 90 NA 74 NA 17 NA
PHYSICS
08-09 50 0 98 NA 98 NA 44 NA 10-11 127 0 98 NA 94 NA 54 NA 09-10 94 0 99 NA 94 NA 57 NA
SPANISH
08-09 94 0 99 NA 99 NA 64 NA 10-11 29 0 97 NA 86 NA 62 NA 09-10 31 0 100 NA 94 NA 58 NA
FRENCH
08-09 8 0 100 NA 100 NA 88 NA
* From New York State Education Department Report Cards Comprehensive Information Report
Charted below are the High School Graduation Rates for the graduation years 2007-2010 for Southampton
High School as recorded by the State Education Department Report Cards. They represent the percentage of
grade 9 students who four years later graduated with a high school diploma. The percentages represent a
high number and increasing number of students who graduate within the specified time frame.

FINDINGS OF THE STUDY
30
HIGH SCHOOL GRADUATION RATES * YEAR ** COHORT COUNT
SOUTHAMPTON
UNION FREE TUCKAHOE COMMON
2007 ALL STUDENTS 175 NA (2003 COHORT) GRADUATION
RATE % 81 NA
2008 ALL STUDENTS 156 NA (2004 COHORT) GRADUATION
RATE % 82 NA
2009 ALL STUDENTS 164 NA (2005 COHORT) GRADUATION
RATE % 90 NA
2010 ALL STUDENTS 152 NA (2006 COHORT) GRADUATION
RATE % 86 NA
^ From New York Education Department Comprehensive Information Reports * From New York Education Department Report Cards Accountability & Overview Reports ** Percentage of the Cohort that earned a local or Regents diploma by August 31 four years later
Also charted below are the High School Diploma Types awarded by the Southampton High School and
earned by students for the graduation years 2009, 2010 and 2011 as recorded by the New York State
Education Department. In reviewing this data, it should be noted the very high percentage of students
graduating with a Regents diploma and Regents diploma with Advanced Distinction. HIGH SCHOOL DIPLOMAS ^
YEAR OF GRAD
DIPLOMA TYPE SOUTHAMPTON UNION FREE
TUCKAHOE COMMON
2010-11 TOTAL GRADUATES 136 NA REGENTS 120 (88%) NA REGENTS ADVANCED DISTINCTION 51 (38%) NA IEP 1 NA APPROVED HS EQUIVALENT PREP 0 NA 2009-10 TOTAL GRADUATES 141 NA REGENTS 122 (87%) NA REGENTS ADVANCED DISTINCTION 75 (53%) NA IEP 3 NA APPROVED HS EQUIVALENT PREP 0 NA 2008-09 TOTAL GRADUATES 150 NA REGENTS 127 (85%) NA REGENTS ADVANCED DISTINCTION 81 (54%) NA IEP 3 NA APPROVED HS EQUIVALENT PREP 0 NA
The study documents a sample of pursuits of students from Southampton after they graduate from high
school. It appears that there is a wide variety of colleges and universities chosen by the students (see page -
124- in the DATA Section for a complete listing).
The important aspect of reviewing any student performance measures is to provide data for a school district
to determine an instructional delivery plan the school can implement to help all students achieve at least a

FINDINGS OF THE STUDY
31
Level 3 or 4 on the state assessments and to achieve a high school diploma in the prescribed four years. The
assessment data snapshot from the results and the graduation rate data were the springboard for the Joint
Community Advisory Committee and the school district program representatives to discuss and list other
instructional programs not now in place that could help increase the number of students who achieve at least
a 3 or 4 on the state assessments and increase the numbers of students who complete high school. The
discussion with staff helped the Joint Community Advisory Committee to formulate their vision of the
elementary and secondary programs if resources were available through an annexation of the two districts
into one.
It should be pointed out that even though there are some minor differences in the assessment scores between
the two school districts, there appear to be more similarities than differences. There is very little in this
section of the reorganization study that should pose a roadblock to a successful reorganization.
5. Regional Sharing with Other School Districts The new district, if created, may purchase a similar total of services from the local Eastern Suffolk BOCES
as well as through cross-contracts with other BOCES in the state. Many of the specific purchased services
may be the same. It is possible that the BOCES may turn to the new district to rent any available classroom
space in order to provide regional programming in the buildings of the newly organized district. The newly
formed district may have a more comprehensive set of programs that can be a major asset to integrate special
needs pupils in skill areas they can excel in like any other pupil.
Special Education Services:
It is possible that the newly organized school district may purchase different shared services for special
needs pupils because the new district may have enough students with a similar disability to provide the
service at the home school with home school staff. For example, charted below are the special needs
services purchased from the regional consortium in 2012 by Tuckahoe Common. 12:1:1 1 pupil 8:1:1 4 pupils 8:1:1+3 1 pupil
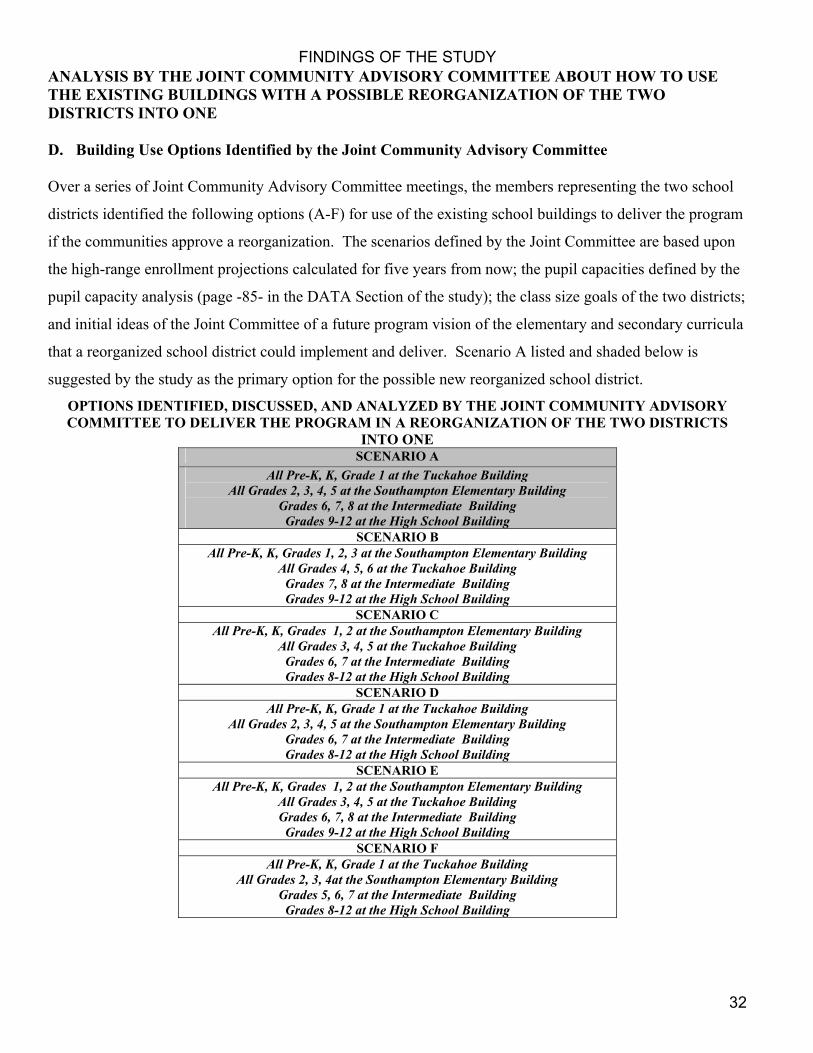
FINDINGS OF THE STUDY
32
ANALYSIS BY THE JOINT COMMUNITY ADVISORY COMMITTEE ABOUT HOW TO USE THE EXISTING BUILDINGS WITH A POSSIBLE REORGANIZATION OF THE TWO DISTRICTS INTO ONE D. Building Use Options Identified by the Joint Community Advisory Committee Over a series of Joint Community Advisory Committee meetings, the members representing the two school
districts identified the following options (A-F) for use of the existing school buildings to deliver the program
if the communities approve a reorganization. The scenarios defined by the Joint Committee are based upon
the high-range enrollment projections calculated for five years from now; the pupil capacities defined by the
pupil capacity analysis (page -85- in the DATA Section of the study); the class size goals of the two districts;
and initial ideas of the Joint Committee of a future program vision of the elementary and secondary curricula
that a reorganized school district could implement and deliver. Scenario A listed and shaded below is
suggested by the study as the primary option for the possible new reorganized school district.
OPTIONS IDENTIFIED, DISCUSSED, AND ANALYZED BY THE JOINT COMMUNITY ADVISORY COMMITTEE TO DELIVER THE PROGRAM IN A REORGANIZATION OF THE TWO DISTRICTS
INTO ONE SCENARIO A
All Pre-K, K, Grade 1 at the Tuckahoe Building All Grades 2, 3, 4, 5 at the Southampton Elementary Building
Grades 6, 7, 8 at the Intermediate Building Grades 9-12 at the High School Building
SCENARIO B All Pre-K, K, Grades 1, 2, 3 at the Southampton Elementary Building
All Grades 4, 5, 6 at the Tuckahoe Building Grades 7, 8 at the Intermediate Building Grades 9-12 at the High School Building
SCENARIO C All Pre-K, K, Grades 1, 2 at the Southampton Elementary Building
All Grades 3, 4, 5 at the Tuckahoe Building Grades 6, 7 at the Intermediate Building Grades 8-12 at the High School Building
SCENARIO D All Pre-K, K, Grade 1 at the Tuckahoe Building
All Grades 2, 3, 4, 5 at the Southampton Elementary Building Grades 6, 7 at the Intermediate Building Grades 8-12 at the High School Building
SCENARIO E All Pre-K, K, Grades 1, 2 at the Southampton Elementary Building
All Grades 3, 4, 5 at the Tuckahoe Building Grades 6, 7, 8 at the Intermediate Building Grades 9-12 at the High School Building
SCENARIO F All Pre-K, K, Grade 1 at the Tuckahoe Building
All Grades 2, 3, 4at the Southampton Elementary Building Grades 5, 6, 7 at the Intermediate Building Grades 8-12 at the High School Building

FINDINGS OF THE STUDY
33
The Joint Community Advisory Committee discussed the scenarios with the leadership teams from each
district in the context of opportunities and challenges associated with each scenario. Based on the discussion
and consensus of the Joint Community Advisory Committee, the Study Team identifies Scenario A--- All
Pre-K, K, Grade 1 at the Tuckahoe Building; All Grades 2, 3, 4, 5 at the Southampton Elementary
Building; Grades 6, 7, 8 at the Intermediate Building; Grades 9-12 at the High School Building --- as the
scenario which the study suggests as the Primary Option to deliver the Pre-K through grade 12 program if a
reorganization was approved by the communities.
Summarized below are opportunities and challenges of the prime building use option discussed by the Joint
Community Advisory Committee and the leadership teams from both school districts.
All Pre-K, K, Grade 1 at the Tuckahoe Building All Grades 2, 3, 4, 5 at the Southampton Elementary Building
Grades 6, 7, 8 at the Intermediate Building Grades 9-12 at the High School Building
OPPORTUNITIES
Establishes an early childhood education center for Pre-K, K, and grade 1. The ‘best and brightest’ of staff with the most talent to serve this critical early education age level can be assigned to work together under one roof. Uses the characteristics of the Tuckahoe building to serve the most appropriate age level of student. The pupil clients of both districts become one client base served without separation starting in Pre-K. Grade 5 pupils are no longer served at the middle school. They are served at an elementary school setting. A middle school of grades 6-8 can better implement a middle school delivery model geared to the social, emotional, academic, and physical needs of a three grade level span of pupils. Provides possible existing space to relocate the district offices from the existing ‘portable’ building. Since there is only one building site serving a set of grade levels, the option provides the best opportunity to efficiently assign staff to serve pupils at the class size goals of the district regardless of the ebbs and flows of pupil enrollment at each grade level year-to-year. Vertical and horizontal alignment of the curriculum is more possible – consistency. Completeness, and definition of mastery steps for pupils will be enabled and possible because there will be enough cohort of professionals working together to share best practices with instructional decision-making.
CHALLENGES
Providing district wide professional development opportunities for all grade and building level faculty to ensure common core is delivered consistently and efficiently with positive results. Merging of traditions between school districts and accepting change. Preserving core values and beliefs of both districts. Requires coordination of start and end times of the various buildings and a transportation plan to accommodate the programs and grade configurations. Deployment of best available talent to the grade level/building that best supports students. Clear understanding of the objectives by all stakeholders of the possible merger – maintain and enhance educational opportunities for all students while being financially responsible. E. Pupil Transportation After discussing various ways to organize the grade level configurations in the current school buildings, the
Joint Community Advisory Committee turned to analyzing pupil transportation. The Joint Community
Advisory Committee in summary suggested the following assumptions that should guide decisions about
school day times, transportation times, and bus runs/routing if the two districts did reorganize into one.
FINDINGS OF THE STUDY
34
Assumptions:
The goal is to reduce the current longest ride of a child on a bus, which is about 50 minutes.
Smaller (less than 66 passenger) buses will probably be used to transport pupils who currently live at the most outer limits of the current school district geographic boundaries.
It is expected that the reorganized school district continues the current practice of helping families as well as they can with transportation within the district to day care locations depending upon the number of available seats on specific bus routes.
The current Southampton practice of providing door-to-door transportation for Pre-K and Kindergarten and pick up points grades 1 through 12 unless a stop is determined unsafe by the district and then door-to-door transportation is provided in those stop locations judged unsafe.
Southampton does not provide a late bus for athletics or co-curricular activities after school; Tuckahoe does three days a week. The study assumes no late bus routes.
The current bus transportation plan for the Shinnecock Nation continues as mutually developed.
In 2012-2013, an additional third district-wide bus run was instituted to transport separately grades 9-12. This ‘What If’ transportation plan has grades 6-12 transported on one common bus run in the AM and in the PM. The youngest of pupils in Grade 5 are no longer at the Middle School. They are proposed to be served at the elementary school.
An additional resource is allocated to provide adult monitors on selected grades 6-12 to provide adult supervision if deemed necessary. Since 2012-2013, grades 5-8 and 9-12 have been transported separately. The study proposes an option that addresses the bus supervision of 6-12 students. The option is also more cost-effective in using the transportation resources of the district to benefit all the pupils in grades pre-K, K, and 1; grades 2-5; and grades 6-12.
An asset to the district is that the high school staff have built into their teaching daytime at the end of the period-by-period instructional an extra-help period to provide extra-help, advisement for clubs, and other student-related services. This implementation model of one district-wide route for grades 6-12 will have all high school pupils remaining in the building to receive such services and/or to meet for co-curricular activities. Already, the high school principal makes the cafeteria available for students not attending extra-help, or co-curricular activities, or are just waiting for the beginning of athletic practices that begin after the extra-help period at 2:38 each day.
All current pupil transportation runs and expenditures for transportation to private schools, and the BOCES are assumed to continue and therefore are not adjusted.
The Southampton UFSD currently has the bus/staff resources to implement three complete district bus runs for the 62.71 square miles of the newly reorganized school district. Southampton UFSD currently has 51.18 square miles and Tuckahoe Common SD has 11.53 square miles.
Southampton UFSD has a bus purchase reserve in place along with a planned bus replacement schedule that is an available resource in case different size buses might be better suited to achieve the three district-wide routes each day.
The bus loops at the Middle School and High School are reported to be undersized. It is suggested that the school district work with the village to accomplish what other school districts do with similar circumstances. In collaboration with village police, a side street is closed to traffic for about 15

FINDINGS OF THE STUDY
35
minutes each school day at dismissal time to ensure pupil safety and ‘quickness’ of boarding the buses.
F. CURRENT PERSONNEL DATA AS REVIEWED BY THE JOINT COMMUNITY ADVISORY COMMITTEE Profile of the Major Elements of the Labor Contracts in Southampton During the course of meetings with the Community Advisory Committee, the contracts of both Southampton
and Tuckahoe were reviewed. Committee members examined the differences and similarities of the
contracts as they related to the instructional and support staffs of the two school districts.
A profile of the major elements of the instructional and instructional support labor contracts starts on page -126- of the DATA section of the study.
The decision as to which reorganization method—centralization* or annexation— rests solely with both
Boards. The Southampton Board of Education and the Tuckahoe Common School District Board of
Trustees have endorsed annexation as the method for possible reorganization of both school districts into
one. The Tuckahoe Common School District would be annexed by Southampton UFSD if approved by both
communities.
Upon reorganization through annexation, all employees of the Tuckahoe Common SD at the time of
dissolution immediately become employees of the reorganized Southampton Union Free School District.
The collective bargaining agreements of Southampton UFSD remain in force and such agreements of the
annexed school district cease to exist.
Teachers in both districts are credited with seniority earned within a particular tenure area at their respective
school districts. The seniority lists of certified staff of each former school district are merged to form a
single seniority list. Similarly, the local Civil Service Commission will prepare one seniority list of
classified personnel for the reorganized school district. The merging of seniority lists is as per statute.
For more detailed information about process in a reorganization through annexation, the appendix of the
Data Sets Document of the study provides “Questions and Answers” to Commonly Asked Questions about
School District Reorganization starting on page -216-.
Should the annexation occur, there will need to be close communication between the districts and the staffs
to ensure a smooth transition of former Tuckahoe Common SD employees to their new status as employees
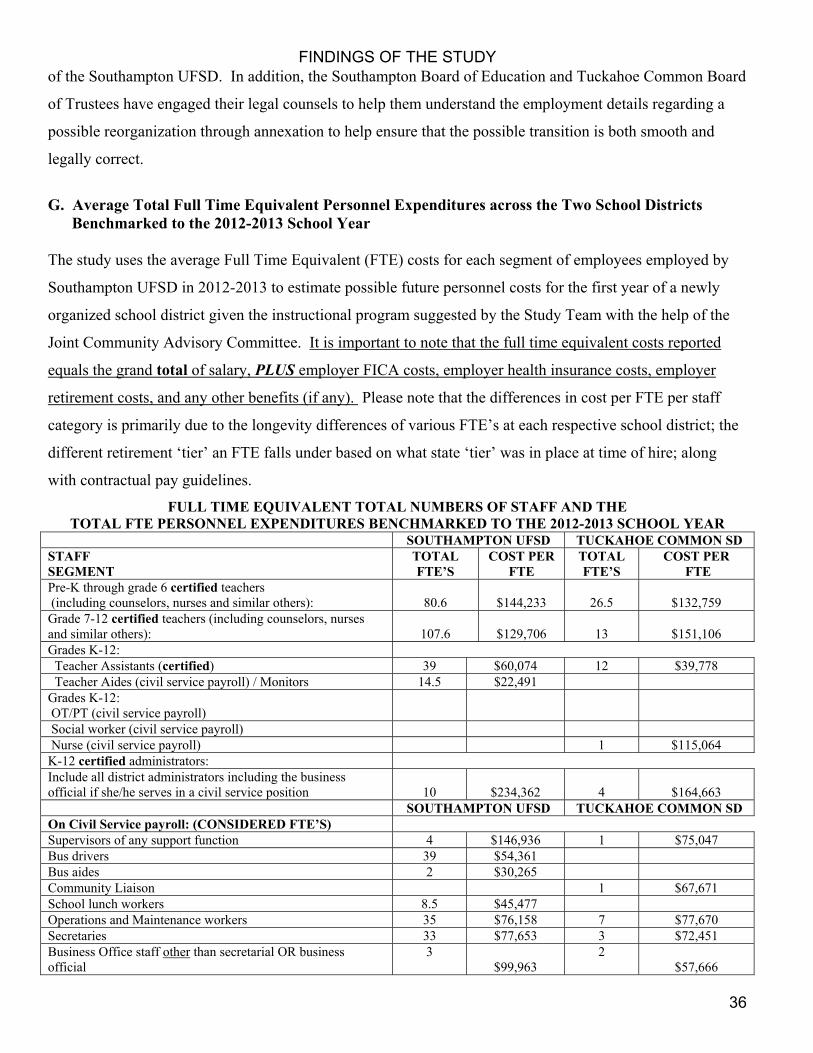
FINDINGS OF THE STUDY
36
of the Southampton UFSD. In addition, the Southampton Board of Education and Tuckahoe Common Board
of Trustees have engaged their legal counsels to help them understand the employment details regarding a
possible reorganization through annexation to help ensure that the possible transition is both smooth and
legally correct.
G. Average Total Full Time Equivalent Personnel Expenditures across the Two School Districts
Benchmarked to the 2012-2013 School Year The study uses the average Full Time Equivalent (FTE) costs for each segment of employees employed by
Southampton UFSD in 2012-2013 to estimate possible future personnel costs for the first year of a newly
organized school district given the instructional program suggested by the Study Team with the help of the
Joint Community Advisory Committee. It is important to note that the full time equivalent costs reported
equals the grand total of salary, PLUS employer FICA costs, employer health insurance costs, employer
retirement costs, and any other benefits (if any). Please note that the differences in cost per FTE per staff
category is primarily due to the longevity differences of various FTE’s at each respective school district; the
different retirement ‘tier’ an FTE falls under based on what state ‘tier’ was in place at time of hire; along
with contractual pay guidelines.
FULL TIME EQUIVALENT TOTAL NUMBERS OF STAFF AND THE TOTAL FTE PERSONNEL EXPENDITURES BENCHMARKED TO THE 2012-2013 SCHOOL YEAR
SOUTHAMPTON UFSD TUCKAHOE COMMON SD STAFF SEGMENT
TOTAL FTE’S
COST PER FTE
TOTAL FTE’S
COST PER FTE
Pre-K through grade 6 certified teachers (including counselors, nurses and similar others):
80.6 $144,233
26.5 $132,759
Grade 7-12 certified teachers (including counselors, nurses and similar others):
107.6 $129,706
13 $151,106
Grades K-12: Teacher Assistants (certified) 39 $60,074 12 $39,778 Teacher Aides (civil service payroll) / Monitors 14.5 $22,491 Grades K-12: OT/PT (civil service payroll)
Social worker (civil service payroll) Nurse (civil service payroll) 1 $115,064 K-12 certified administrators: Include all district administrators including the business official if she/he serves in a civil service position
10 $234,362
4 $164,663
SOUTHAMPTON UFSD TUCKAHOE COMMON SD On Civil Service payroll: (CONSIDERED FTE’S) Supervisors of any support function 4 $146,936 1 $75,047 Bus drivers 39 $54,361 Bus aides 2 $30,265 Community Liaison 1 $67,671 School lunch workers 8.5 $45,477 Operations and Maintenance workers 35 $76,158 7 $77,670 Secretaries 33 $77,653 3 $72,451 Business Office staff other than secretarial OR business official
3 $99,963
2 $57,666
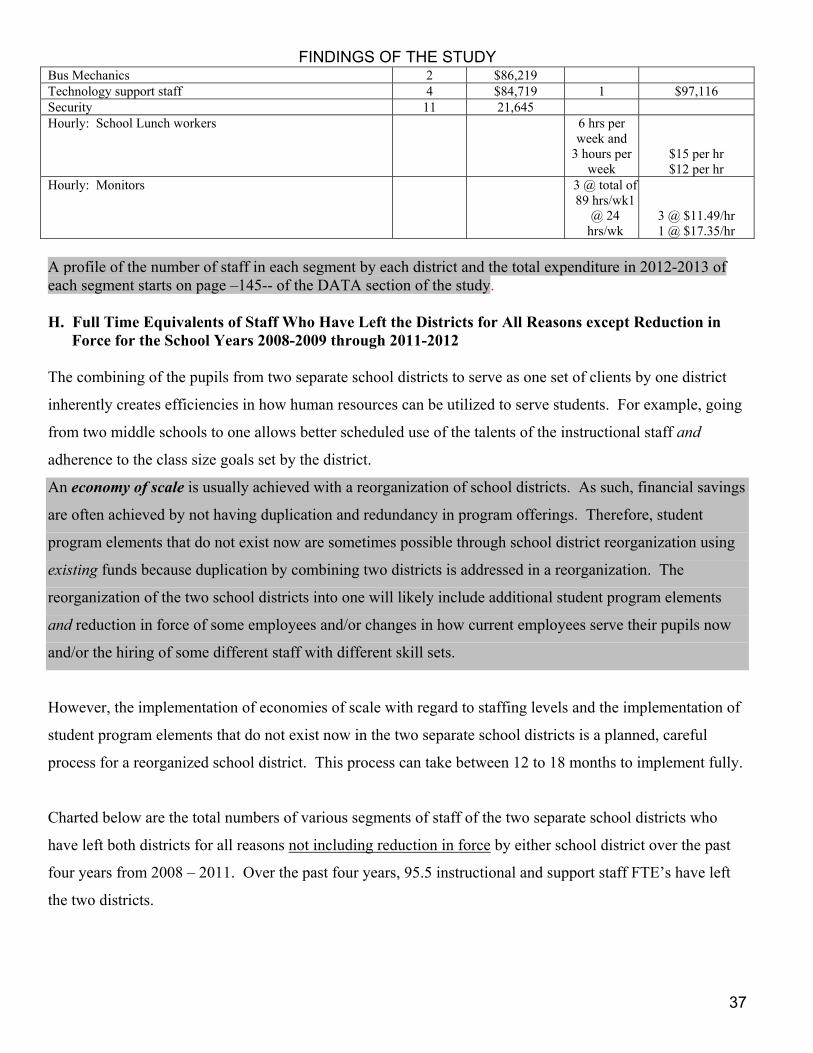
FINDINGS OF THE STUDY
37
Bus Mechanics 2 $86,219 Technology support staff 4 $84,719 1 $97,116 Security 11 21,645 Hourly: School Lunch workers
6 hrs per week and
3 hours per week
$15 per hr $12 per hr
Hourly: Monitors
3 @ total of 89 hrs/wk1
@ 24 hrs/wk
3 @ $11.49/hr 1 @ $17.35/hr
A profile of the number of staff in each segment by each district and the total expenditure in 2012-2013 of each segment starts on page –145-- of the DATA section of the study.
H. Full Time Equivalents of Staff Who Have Left the Districts for All Reasons except Reduction in
Force for the School Years 2008-2009 through 2011-2012 The combining of the pupils from two separate school districts to serve as one set of clients by one district
inherently creates efficiencies in how human resources can be utilized to serve students. For example, going
from two middle schools to one allows better scheduled use of the talents of the instructional staff and
adherence to the class size goals set by the district.
An economy of scale is usually achieved with a reorganization of school districts. As such, financial savings
are often achieved by not having duplication and redundancy in program offerings. Therefore, student
program elements that do not exist now are sometimes possible through school district reorganization using
existing funds because duplication by combining two districts is addressed in a reorganization. The
reorganization of the two school districts into one will likely include additional student program elements
and reduction in force of some employees and/or changes in how current employees serve their pupils now
and/or the hiring of some different staff with different skill sets.
However, the implementation of economies of scale with regard to staffing levels and the implementation of
student program elements that do not exist now in the two separate school districts is a planned, careful
process for a reorganized school district. This process can take between 12 to 18 months to implement fully.
Charted below are the total numbers of various segments of staff of the two separate school districts who
have left both districts for all reasons not including reduction in force by either school district over the past
four years from 2008 – 2011. Over the past four years, 95.5 instructional and support staff FTE’s have left
the two districts.
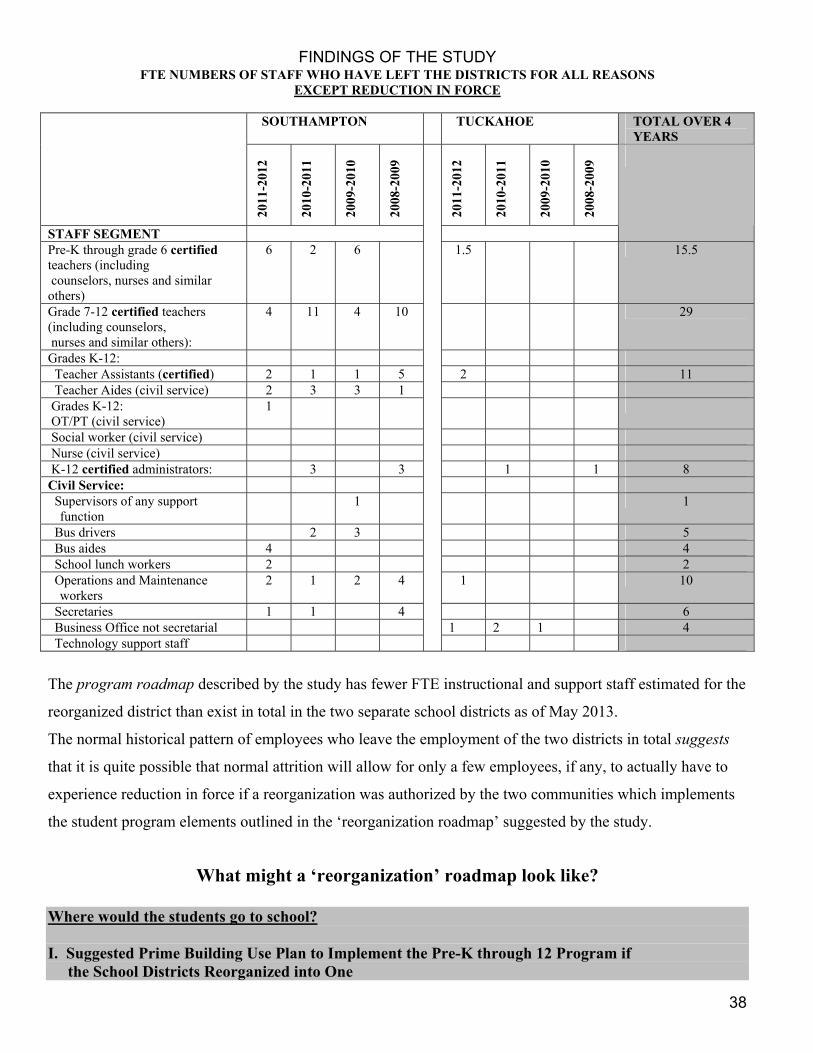
FINDINGS OF THE STUDY
38
FTE NUMBERS OF STAFF WHO HAVE LEFT THE DISTRICTS FOR ALL REASONS EXCEPT REDUCTION IN FORCE
SOUTHAMPTON TUCKAHOE TOTAL OVER 4
YEARS
2011
-201
2
2010
-201
1
2009
-201
0
2008
-200
9
2011
-201
2
2010
-201
1
2009
-201
0
2008
-200
9
STAFF SEGMENT
Pre-K through grade 6 certified teachers (including counselors, nurses and similar others)
6 2 6 1.5 15.5
Grade 7-12 certified teachers (including counselors, nurses and similar others):
4 11 4 10 29
Grades K-12: Teacher Assistants (certified) 2 1 1 5 2 11 Teacher Aides (civil service) 2 3 3 1 Grades K-12: OT/PT (civil service)
1
Social worker (civil service) Nurse (civil service) K-12 certified administrators: 3 3 1 1 8 Civil Service: Supervisors of any support
function 1 1
Bus drivers 2 3 5 Bus aides 4 4 School lunch workers 2 2 Operations and Maintenance
workers 2 1 2 4 1 10
Secretaries 1 1 4 6 Business Office not secretarial 1 2 1 4 Technology support staff
The program roadmap described by the study has fewer FTE instructional and support staff estimated for the
reorganized district than exist in total in the two separate school districts as of May 2013.
The normal historical pattern of employees who leave the employment of the two districts in total suggests
that it is quite possible that normal attrition will allow for only a few employees, if any, to actually have to
experience reduction in force if a reorganization was authorized by the two communities which implements
the student program elements outlined in the ‘reorganization roadmap’ suggested by the study.
What might a ‘reorganization’ roadmap look like?
Where would the students go to school? I. Suggested Prime Building Use Plan to Implement the Pre-K through 12 Program if the School Districts Reorganized into One

FINDINGS OF THE STUDY
39
The SES Study Team recommends the following use of the school buildings to deliver instruction as discussed and reviewed by the Joint Community Advisory Committee and leadership teams.
All Pre-K, K, Grade 1 at the Tuckahoe Building
All Grades 2, 3, 4, 5 at the Southampton Elementary Building Grades 6, 7, 8 at the Intermediate Building Grades 9-12 at the High School Building
Tuckahoe Southampton
School PUPIL CAPACITY
EST. ENROLL.
School PUPIL CAPACITY
EST. ENROLL.
Grades K, 1:
Pre-Kindergarten:
390
90
311 (79.7% of building
capacity)
90
Grades 2-5
644
612 (95% of building
capacity)
Grades 6-8:
606 448 (73.9% of building
capacity)
Grades 9-12:
879 668 (76% of building
capacity) What might the program for students look like? J. Suggested Breadth of Student Program Elements if Reorganization of the Two School Districts
into One is Approved by the Communities
Over a series of meetings, the Joint Community Advisory Committee met with teams consisting of teachers,
counselors, principals and the superintendents to discuss and analyze the current elementary and secondary
program offerings at both school districts. At each of the meetings, the staff representatives answered
questions from Joint Community Advisory members about the delivery of their instructional programs. As
part of those conversations, school representatives were asked to respond to the following question:
“What are specific ideas and examples about enhanced (elementary/secondary) program/learning opportunities that are possible for the pupils of the two districts if resources were available through
reorganization?” From the responses to the question by the different sets of school staff (superintendent, principals,
elementary and secondary teachers, and guidance personnel) the Community Advisory Joint Committee
heard what district staff believed could be program elements to address the needs of the students of the two
school districts if a reorganization did occur.
FINDINGS OF THE STUDY
40
The two Boards of Education appointed members to the Joint Community Advisory Committee who are
representatives of the diverse stakeholder groups of each community. The Study Team asked all of the
members of the Joint Committee in a large group discussion to answer the following question:
What do you believe could be program enhancements if the two districts were to reorganize?
The Joint Committee was not asked to form a consensus about the items. The purpose of asking for insights
about ‘what’s in it for kids’ was to help the Study Team prepare a suggested “What if” Program and Staff
Picture” as part of the possible reorganization roadmap in the study report. The Study Team believes that
the study should not just suggest a student program scope for a potential reorganized district without a local
community context, which the Joint Committee gave the study. As ‘guest outsiders’ the Study Team listened
to and recorded the perceptions of the diversely representative community members serving on the Joint
Committee. They helped to give insights about what the communities value about possible opportunities that
should be available through the public school system. If a reorganization of Southampton and Tuckahoe is
approved by both sets of community voters, the specific program elements of a reorganized district are the
decision of the newly elected Board of Education for the newly organized school district.
Listed below (not in any rank order or priority) are insights shared by the Joint Community Advisory
Committee members and the sets of school staff who met with the committee regarding the pupil program
benefits if a reorganization of the two districts was approved by the respective communities.
The increase of enrollment at Southampton High School will help maintain a wide scope of electives, including advanced courses, and athletic programs. The maintenance of AP programs and HS electives with 140 HS students from TCSD allows greater academic course selection and enrichment for all levels of learners.
The increased enrollment of Pre-K through 8 will allow for more diverse grouping of regular classes, inclusion and self-contained classes, and for an expanded dual language program (made possible by demographic of Tuckahoe).
The establishment of a true middle school for Grades 6-8 is more in keeping with educational practice, grouping, and the developmental needs of students at these levels. It allows for a gradual transition to a departmentalized setting with multiple teachers.
Realignment of an elementary school around Grades 2-5 would be academically sound in terms of clustering higher elementary grades together in a self-contained setting. 5th grade belongs with the other elementary grades versus the current location as part of a Grade 5-8 intermediate school.
Establishment of a single location Early Childhood Center for Grades Pre-K, K, and 1st would be better for transportation and would enable a clear focus and integration of early childhood programs so integral to ongoing success through the grades.

FINDINGS OF THE STUDY
41
There is a potential to establish a learning schedule that will allow early childhood programs to be geographically centered for OT/PT/Speech specialists and dedicated space to be more effective. It is likely going forward that local staff will provide services to special needs pupils so less student transportation (BOCES) will be required equating to more time in class. Probably more Special education programs will be offered at the home school district with greater focus on owned results for "our" kids.
The athletic programs will have less transportation time required; therefore, more event engagement time for all athletes for practice and games.
Additional funding will potentially be available for school wide applications of Federal grant money to support Title 1 and high-density ESL populations with SES grant qualification characteristics.
The Parent Teachers Organization and Educational Foundation Programs strengthened by one combined district.
The best practices of both districts can be combined to benefit all pupils in such example areas as:
o Technology o Health, nutritional practices and physical education programs o Band and fine arts o Adult education programs o Professional development and professional learning communities
The population demographics of the Tuckahoe area of the Town of Southampton will likely help inhibit the trend of lower public school pupil enrollments. Future enrollments of the newly reorganized school likely will have a consistent total enrollment to serve thus allowing stability in class sizes, teacher and support staffing, and in use of the school buildings.
The Southampton community will have one school district—community pride will be jointly applied and not compared.
Additional educational opportunity through reorganization likely will add another viable reason for future homebuyers, businesses and others to consider Southampton.
Based on the student program suggestions and perceptions shared by the Joint Committee members and
others, the Study Team suggests a student program/staffing plan as a Roadmap to be considered for a
reorganization of Southampton and Tuckahoe into one district. The final established scope of programming
and staffing rests with the newly elected Board and the community if both school district communities
approve a reorganization.

FINDINGS OF THE STUDY
42
PROGRAM ELEMENTS OF THE POSSIBLE ROADMAP OPTION
FOR REORGANIZATION TO CONSIDER Class sizes The reorganization ‘What if’ student program picture outlined in the study is based on the current class size goals endorsed and used by both school districts.
Pre-Kindergarten: 18 pupils Kindergarten, grade 1, grade 2: 20 pupils Grades 3, 4, and 5: 22 pupils Grades 6, 7, 8: 24 pupils Grades 9-12: 24 pupils
The ‘What if” Program Picture that follows is only a roadmap. It suggests the total staff resource to
implement a comprehensive Pre-K through grade 12 program if a reorganization is approved. The estimates
are based on what it might take to deliver the current program offerings of the two school districts and other
educational opportunities discussed and suggested by the Joint Community Advisory Committee. The
specific number of full time equivalent staff and who is assigned to a particular building in a given school
year will be judged by the Board of Education as they work with staff given the actual number of pupils
enrolled and a profile of their educational needs in that given school year. The Full Time Equivalent
Instructional staffing listed should be viewed in light of what type of resource may be provided to the
students in a reorganized district. All of the Full Time Equivalents listed in the ‘What if Picture‘do not
necessarily exist now on staff. Therefore, the ‘What if’ scenario should be viewed as a plan that may take up
to 12 months to implement completely.
K-6 Elementary Program-Classroom Instruction Planned by Both Districts for the 2013-2014 School Year
Southampton Tuckahoe Common K-6 FTE’s assigned to grade level (grades K-6) sections: EXPECTED ENROLLMENT K-6:
36 554
K-6 FTE’s assigned to grade level (grades K-6) sections: EXPECTED ENROLLMENT K-6:
14 298
Total Elementary Classroom Teachers Planned for 2013-2014 in both districts: 50 Average class size of 15.4 pupils grades K-6 Average class size of 21.3 pupils grades K-6

FINDINGS OF THE STUDY
43
What if picture of a K-6 Elementary Program-Classroom Instruction Roadmap for 2014-2015, First Year of the Reorganization of Both Districts into One Benchmarked to Class Size Goals of the District
Estimated
Enrollment Estimated Classroom
Section FTE’s
Estimated Average
Class Size:
FTE’s Roadmap for first
year of the reorganized
school district:
Southampton FTE’s in
2013-2014
Tuckahoe Common FTE’s in
2013-2014
Net change in FTE’s to the Southampton
UFSD estimated budget for
2014-2015; first year of the
reorganization:
Estimated FTE’s may be
subject to reduction:
Grades K, 1:
311 16 19.4
Grades 2-5:
612 28 21.9
Grade 6:
146 6 24.3
50
36
14
+14
0
Total K-6 Instructional FTE’s: 50 36 14 +14 0 The Program/Staffing Roadmap suggests the grade level instructional staffing for grades K-6 will be the same in a reorganized school district. Pre-K-6 Instructional Support Services
Southampton Tuckahoe Common
Total of both
school districts:
Roadmap for first
year of the reorganized
school district:
Net change in FTE’s to the Southampton
UFSD estimated budget for
2014-2015; first year of the
reorganization:
Estimated FTE’s may be
subject to reduction:
BUDGET PLANNED FOR IN THE
2013-2014 SCHOOL YEAR:
FTE FTE FTE FTE FTE FTE Pre-K 3 2 5 5 +2 0 Special education specialist (ex. consulting teacher, special education, reading, math, ESL, ELA)
12 12 24 20 +8 -4
Vocal Music and Instrumental Music 3.5 1 4.5 4.5 +1 0 Art 1.5 1 2.5 2.5 +1 0 Second Language 2 1 3 3 +1 0 Social Worker .5 .5 1 1 +.5 0 Nurse 2.5 1 3.5 3.5 +1 0 Guidance Counselor 2 1 3 3 +1 0 Speech 3 1 4 4 +1 0 Occupational Therapist 0 0 0 0 0 0 Physical Therapist 0 0 0 0 0 0 Physical Education 4.5 2 6.5 6.5 +2 0 Psychologist 2.5 1 3.5 2.5 0 -1 Librarian 1.5 1 2.5 2.5 +1 0
Instructional Support Total FTE’s Pre-K through Grade 6:
38.5 24.5 63 58 +19.5 -5

FINDINGS OF THE STUDY
44
The Program/Staffing Roadmap suggests the need for 5 fewer Pre-K through grade 6 instructional program support positions in a reorganized district.
What if picture of a 7-12 Secondary Program-Classroom Instruction Roadmap for 2014-2015, First Year of the Reorganization of Both Districts into One
Southampton Tuckahoe
Common
Total of both
school districts:
Roadmap for first year of
the reorganized
school district:
Net change in FTE’s to the
Southampton UFSD estimated budget for 2014-2015; first year
of reorganization:
Estimated FTE’s may be subject to reduction:
PLANNED FOR IN THE
2013-2014 SCHOOL YEAR:
FTE FTE FTE FTE FTE FTE Special education specialist (ex. consulting teacher,special education, reading, math, ESL,ELA)
14.6 14.6 14.6 0 0
English 10.4 1 11.4 10.4 0 -1 Social Studies 8.2 1 9.2 8.2 0 -1 Math 8.6 1 9.6 8.6 0 -1 General Science Earth Science Biology (Living Environment) Chemistry Physics
12
1
13
12
0
-1
Second Language 7.8 0 7.8 7.8 0 0 Health 1.5 0 1.5 1.5 0 0 Art 2.5 0 2.5 2.5 0 0 General Music Vocal Music Instrumental Music
2
0
2
2
0
0 Technology/Engineering 2.6 1 3.6 2.6 0 -1
Southampton Tuckahoe Common
Total of both
school districts:
Roadmap for first year of
the reorganized
school district:
Net change in FTE’s to the
Southampton UFSD estimated budget for 2014-2015; first year
of reorganization:
Estimated FTE’s may be subject to reduction:
PLANNED FOR IN THE
2013-2014 SCHOOL YEAR:
FTE FTE FTE FTE FTE FTE Agriculture 0 0 0 0 0 0 Driver Education 0 0 0 0 0 0 Family Consumer Science 2 0 2 2 0 0 Business 1 0 1 1 0 0 Physical Education 4.5 0 4.5 4.5 0 0 Total Instructional FTE’s
Grade 7 through Grade 12:
77.7 5 82.7 77.7 0 -5
The Program/Staffing Roadmap suggests the need for 5 fewer grade 7 through grade 12 instructional subject positions in a reorganized district.

FINDINGS OF THE STUDY
45
Grades 7-12 Instructional Support Services
Southampton Tuckahoe Common
Total of both school
districts:
Roadmap for first year of the
reorganized school district:
Net change in FTE’s to the Southampton UFSD
estimated budget for 2014-2015; first year of the
reorganization:
Estimated FTE’s may be
subject to reduction:
PLANNED FOR IN THE
2013-2014 SCHOOL
YEAR: FTE FTE FTE FTE FTE FTE
Social Worker 1.5 0 1.5 1.5 0 0 Nurse 1.5 0 1.5 1.5 0 0 Guidance Counselor
5 0 5 5 0 0
Speech 1.5 0 1.5 1.5 0 0 Occupational Therapist
0 0 0 0 0 0
Physical Therapist
0 0 0 0 0 0
Psychologist 1.5 0 1.5 1.5 0 0 Librarian 1.5 0 1.5 1.5 0 0
Instructional Support
Total FTE’s Grades
7 through 12
12.5
0
12.5
12.5
0
0
The Program/Staffing Roadmap suggests the grade level instructional support services staffing for grades 7-12 will be the same in a reorganized school district. Grades Pre-K through 12 Teacher Assistants, Aides, Monitors:
Southampton Tuckahoe
Common
Total of both
school districts:
Roadmap for first year of the
reorganized school district:
Net change in FTE’s to the Southampton UFSD
estimated budget for 2014-2015; first year of
the reorganization:
Estimated FTE’s may be subject to reduction:
PLANNED FOR IN THE
2013-2014 SCHOOL YEAR:
FTE FTE FTE FTE FTE FTE Teacher Assistants 40 8 48 48 +8 0 Neighborhood Aids/Community Service
2
1
3
3
+1
0 Monitors 2 Circa 1
FTE 3 3 +1 0
Teacher Assistants, Aides,
Monitors
44
10
54
54
+10
0
The Program/Staffing Roadmap suggests the Pre-K through grade 12 teacher assistant, aide, and monitor staffing will be the same in a reorganized school district.

FINDINGS OF THE STUDY
46
What if picture of how supervisory/administrative building services might be provided in a
reorganized district:
Southampton Tuckahoe Common
Total of both
school districts:
Roadmap for first year of
the reorganized
school district:
Net change in FTE’s to the
Southampton UFSD estimated budget for 2014-2015; first year
of the reorganization:
Estimated FTE’s may be subject to reduction:
PLANNED FOR IN THE 2013-2014
SCHOOL YEAR:
FTE FTE FTE FTE FTE FTE Pre-K-8 1 1 Pre-K-4 2 2 5-8 2 2 9-12 2 2 Pre-K, K, 1 1 +1 0 2-5 2 0 0 6-8 2 0 0 9-12 2 0 0 Supervisory/Administrative
Building Resources:
6
1
7
7
+1
0
The Program/Staffing Roadmap suggests the building level administrator staffing for grades K-12 will be the same in a reorganized school district.

FIN
DIN
GS
OF
THE
STU
DY
47
Wha
t if p
ictu
re o
f how
dis
tric
t cen
tral
serv
ices
/off
ice
supe
rvis
ion
and
adm
inis
trat
ion
mig
ht b
e pr
ovid
ed in
a r
eorg
aniz
ed d
istr
ict:
Southampton
Tuckahoe Common
Tot
al
of
bot
h sc
hool
di
stri
cts:
Roa
dmap
for
first
yea
r o
f the
re
orga
nize
d sc
hool
di
stri
ct:
Net
cha
nge
in
FTE
’s
to th
e S
outh
ampt
on
UF
SD
est
imat
ed
budg
et
for 2
014-
2015
; fi
rst y
ear
of th
e re
orga
niza
tion:
Est
imat
ed
FTE
’s
may
be
subj
ect
to
redu
ctio
n:
PLA
NN
ED
FO
R I
N
TH
E
201
3-20
14
SCH
OO
L Y
EA
R:
Prim
ary
Res
ourc
e Fu
nctio
n
FTE
FT
E
FTE
FT
E
FTE
FT
E
Supe
rinte
nden
t C
hief
Exe
cutiv
e O
ffic
er
1 1
2 1
0 -1
A
ssis
tant
Sup
t. B
usin
ess
Chi
ef F
inan
cial
Off
icer
1
1 2
1 0
-1
Ass
ista
nt S
upt.
Inst
ruct
ion
Plan
s ins
truct
ion,
impl
emen
ts, a
nd e
valu
ates
all
pupi
l sup
port
serv
ices
col
labo
rativ
ely
with
the
build
ing
prin
cipa
ls.
1
0 1
1 0
0
Dire
ctor
y of
Pup
il Pe
rson
nel S
ervi
ces
Coo
rdin
ates
spec
ial n
eeds
pro
gram
min
g. T
he ro
le a
lso
coor
dina
tes,
impl
emen
ts, a
nd e
valu
ates
all
gove
rnm
ent e
ntitl
emen
t gr
ants
and
oth
er g
rant
s tha
t ser
ve in
stru
ctio
n. C
oord
inat
es th
e ce
rtifie
d st
aff w
ho im
plem
ent t
he in
tegr
atio
n of
supp
ort i
nstru
ctio
n fo
r all
pupi
ls.
1 1
2 1
0 -1
Dire
ctor
of H
ealth
&
Wel
lnes
s, Ph
ysic
al E
d &
Ath
letic
s
Plan
s, co
ordi
nate
s, im
plem
ents
, and
eva
luat
es a
ll in
ters
chol
astic
an
d in
tram
ural
pro
gram
ele
men
ts fo
r Pre
-K th
roug
h 12
and
su
perv
ises
all
coac
hes a
nd p
hysi
cal e
duca
tion
1
0
1
1
0
0 D
irect
or o
f Col
lege
, C
aree
r Cou
nsel
ing
Coo
rdin
ates
, pla
ns, d
evel
ops t
he im
plem
enta
tion
of a
co
mpr
ehen
sive
scho
ol c
ouns
elin
g pr
ogra
m p
re-K
-12
1 0
1 1
0 0
Dire
ctor
of
Inst
ruct
iona
l Te
chno
logy
Coo
rdin
ates
, pla
ns w
ith o
ther
s, an
d im
plem
ents
the
tech
nolo
gy
plan
for t
he d
istri
ct fo
r bot
h in
stru
ctio
n an
d ad
min
istra
tive
serv
ices
.
1 0
1 1
0 0
Com
mun
ity R
elat
ions
Sp
ecia
list
Plan
s, co
ordi
nate
s, an
d im
plem
ents
an
ongo
ing
publ
ic in
form
atio
n pl
an to
kee
p th
e co
mm
uniti
es in
form
ed.
1
0 1
1 0
0 D
irect
or o
f Fac
ilitie
s En
sure
s the
mai
nten
ance
and
upk
eep
of a
ll of
the
faci
lity
reso
urce
s of
the
dist
rict.
1 0
1 1
0 0
Dire
ctor
of F
ood
Serv
ices
O
rgan
izes
and
impl
emen
ts a
ll sc
hool
lunc
h an
d br
eakf
ast s
ervi
ces
of th
e di
stric
t. 1
1 2
1 0
-1
Dire
ctor
of
Tran
spor
tatio
n O
rgan
izes
and
impl
emen
ts a
ll tra
nspo
rtatio
n se
rvic
es
1 0
1 1
0 0
Cen
tral
Ser
vice
s Res
ourc
es:
11
4 15
11
0
-4
The
Prog
ram
/Sta
ffing
Roa
dmap
sugg
ests
the
need
for 4
few
er d
istri
ct-w
ide
adm
inis
trativ
e po
sitio
ns in
a re
orga
nize
d di
stric
t.
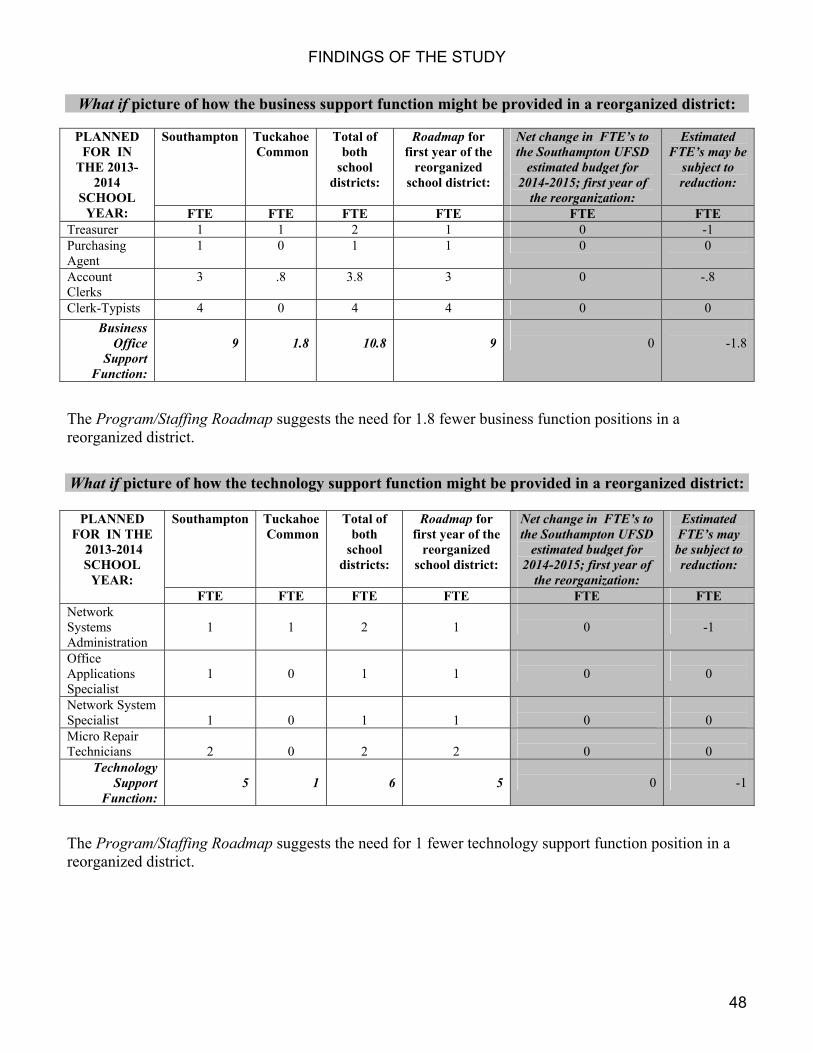
FINDINGS OF THE STUDY
48
What if picture of how the business support function might be provided in a reorganized district:
Southampton Tuckahoe Common
Total of both
school districts:
Roadmap for first year of the
reorganized school district:
Net change in FTE’s to the Southampton UFSD
estimated budget for 2014-2015; first year of
the reorganization:
Estimated FTE’s may be
subject to reduction:
PLANNED FOR IN
THE 2013-2014
SCHOOL YEAR: FTE FTE FTE FTE FTE FTE
Treasurer 1 1 2 1 0 -1 Purchasing Agent
1 0 1 1 0 0
Account Clerks
3 .8 3.8 3 0 -.8
Clerk-Typists 4 0 4 4 0 0 Business
Office Support
Function:
9
1.8
10.8
9
0
-1.8
The Program/Staffing Roadmap suggests the need for 1.8 fewer business function positions in a reorganized district.
What if picture of how the technology support function might be provided in a reorganized district:
Southampton Tuckahoe Common
Total of both
school districts:
Roadmap for first year of the
reorganized school district:
Net change in FTE’s to the Southampton UFSD
estimated budget for 2014-2015; first year of
the reorganization:
Estimated FTE’s may be subject to reduction:
PLANNED FOR IN THE
2013-2014 SCHOOL
YEAR: FTE FTE FTE FTE FTE FTE
Network Systems Administration
1
1
2
1
0
-1
Office Applications Specialist
1
0
1
1
0
0
Network System Specialist
1
0
1
1
0
0
Micro Repair Technicians
2
0
2
2
0
0
Technology Support
Function:
5
1
6
5
0
-1
The Program/Staffing Roadmap suggests the need for 1 fewer technology support function position in a reorganized district.
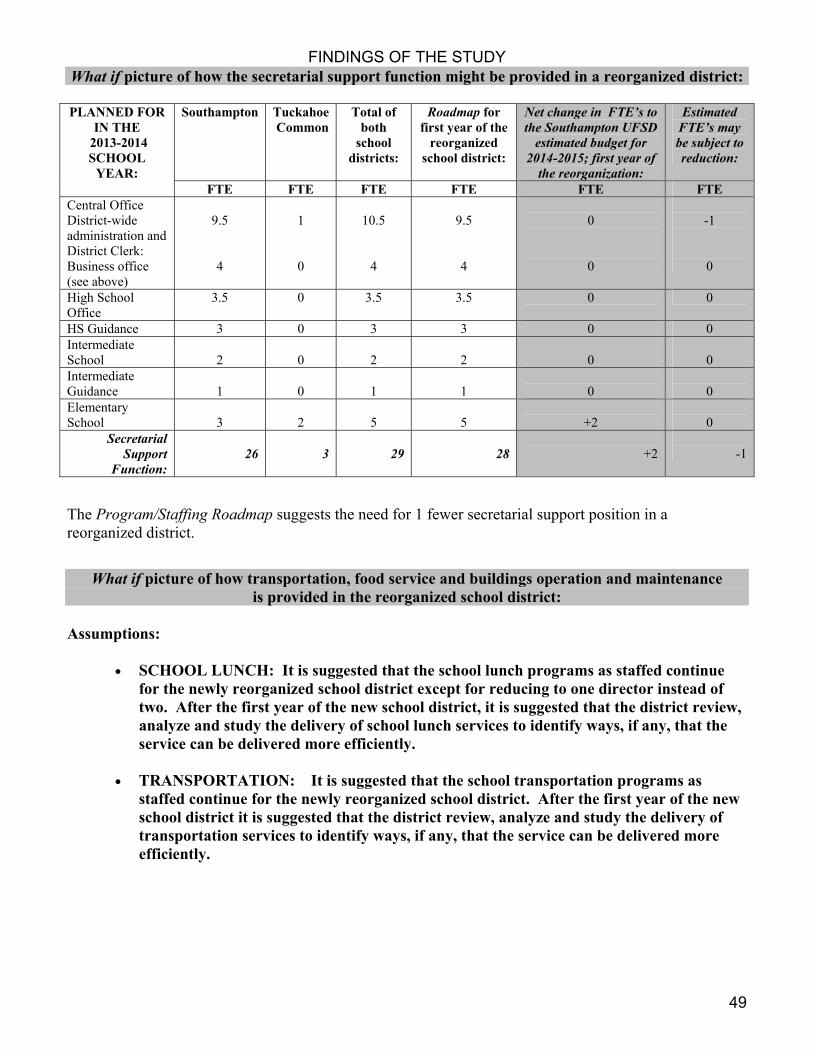
FINDINGS OF THE STUDY
49
What if picture of how the secretarial support function might be provided in a reorganized district:
Southampton Tuckahoe Common
Total of both
school districts:
Roadmap for first year of the
reorganized school district:
Net change in FTE’s to the Southampton UFSD
estimated budget for 2014-2015; first year of
the reorganization:
Estimated FTE’s may be subject to reduction:
PLANNED FOR IN THE
2013-2014 SCHOOL
YEAR: FTE FTE FTE FTE FTE FTE
Central Office District-wide administration and District Clerk: Business office (see above)
9.5
4
1
0
10.5
4
9.5
4
0
0
-1
0
High School Office
3.5 0 3.5 3.5 0 0
HS Guidance 3 0 3 3 0 0 Intermediate School
2
0
2
2
0
0
Intermediate Guidance
1
0
1
1
0
0
Elementary School
3
2
5
5
+2
0
Secretarial Support
Function:
26
3
29
28
+2
-1
The Program/Staffing Roadmap suggests the need for 1 fewer secretarial support position in a reorganized district.
What if picture of how transportation, food service and buildings operation and maintenance is provided in the reorganized school district:
Assumptions:
• SCHOOL LUNCH: It is suggested that the school lunch programs as staffed continue for the newly reorganized school district except for reducing to one director instead of two. After the first year of the new school district, it is suggested that the district review, analyze and study the delivery of school lunch services to identify ways, if any, that the service can be delivered more efficiently.
• TRANSPORTATION: It is suggested that the school transportation programs as
staffed continue for the newly reorganized school district. After the first year of the new school district it is suggested that the district review, analyze and study the delivery of transportation services to identify ways, if any, that the service can be delivered more efficiently.

FINDINGS OF THE STUDY
50
What if picture of how the pupil transportation support function might be provided in a reorganized district:
Southampton Tuckahoe
Common
Total of both
school districts:
Roadmap for first year of the
reorganized school district:
Net change in FTE’s to the Southampton UFSD
estimated budget for 2014-2015; first year of
the reorganization:
Estimated FTE’s may be subject to reduction:
PLANNED FOR IN THE
2013-2014 SCHOOL
YEAR: FTE FTE FTE FTE FTE FTE
Bus Mechanics 2 0 2 2 0 0 Dispatcher 1 0 1 1 0 0 Bus Drivers 39 0 39 39 0 0 Bus Aides 2 0 2 2 0 0
Pupil Transportation
Support Function:
44
0
44
44
0
0
What if picture of how the buildings operations support function might be provided in a reorganized district:
Southampton Tuckahoe
Common
Total of both
school districts:
Roadmap for first year of
the reorganized
school district:
Net change in FTE’s to the Southampton
UFSD estimated budget for 2014-
2015; first year of the reorganization:
Estimated FTE’s may be subject
to reduction:
PLANNED FOR IN THE
2013-2014 SCHOOL
YEAR:
Square Footage:
FTE FTE FTE FTE FTE FTE District Office 4556 1 0 1 1 0 0 High School 188,220 10.75 0 10.75 10.75 0 0 Intermediate School
102,951
7.5 0 7.5 7.5 0 0
Elementary Schools
Southampton Tuckahoe
95,152 66,200
6
7
13
9
+3
-4
Bus Garage 4431 .5 0 .5 .5 0 0 District-wide Maintenance Mechanics and Dispatcher
5
1
6
6
+1
0
Buildings Operations
Support Function:
30.75
8
38.75
34.75
+4
-4
Security 7 plus 8 PT 0 7 plus 8 PT
7 plus 8 PT 0 0
The Program/Staffing Roadmap suggests the need for 4 fewer buildings operations staff in a reorganized district.

FINDINGS OF THE STUDY
51
K. What staff would the reorganized school district probably need? Summary: Estimated Additional Staff FTE’s to the 2014-2015 Southampton UFSD Budget as a Result of a Reorganization with the Tuckahoe Common School District Starting July 1, 2014
Grade Level Estimated Added
FTE’s Estimated Average
Cost per FTE* Estimated Total Added
Expenditure K-6 +14 $144,233 +$2,019,262
K-6 Instructional Support +19.5 $144,233 +$2,812,544 7-12 0 $129,706 0
7-12 Instructional Support 0 $129,706 0 Teacher Assistants
Pre-K-12 +8 $60,074 +$480,592
Community Liaison Aide +1 $67,671 +$67,671 Monitor +1 $30,265 +$30,265
Supervisory/Administrative Building Resources
and Central Administration Resources
+1
$234,362
+$234,362
Business Office Function (not including secretarial)
0 $99,963 0
Technology Support Function
0 $84,719 0
Secretarial Support Function
+2 $77,653 +$155,306
Buildings Operations and Support Function:
+4
$76,158
+$304,632
Security 0 Total Expenditure: $238,104
0
Pupil Transportation Support Function
Bus Mechanics 0 $86,219 0 Bus Drivers 0 $54,361 0
Bus Aides 0 $30,265 0 TOTAL ESTIMATED ADDITIONAL STAFF EXPENDITURE TO
THE 2014-2015 SOUTHAMPTON UFSD BUDGET FOR THE FIRST YEAR OF REORGANIZATION WITH TUCKAHOE COMMON IN
2014-2015:
+$6,104,634
*Total personnel expenditures at Southampton UFSD in 2012-2013 for each staff segment category equals the total of salary, employer FICA costs, employer health insurance costs, employer retirement costs, and any other benefits
(if any). Please note that the differences in cost per FTE per staff category is primarily due to the longevity differences of various FTE’s at each respective school district.

FINDINGS OF THE STUDY
52
What might be the plan for bus transportation? L. Example School Day Time Schedule and Pupil Transportation if the Prime Building Use Option
is Implemented to Serve the Pupils in a Reorganized District
Preliminary Framework Plan for School Day Times, Transportation Times, and Bus Run Resources in a Reorganization of the Districts into One
Assumptions: The goal is to reduce the current longest ride of a child on a bus which is about 50 minutes.
Smaller (less than 66 passenger) buses will probably be used to transport pupils who currently live at the most outer limits of the current school district geographic boundaries.
It is expected that the reorganized school district continues the current practice of helping families as well as they can with transportation within the district to day care locations depending upon the number of available seats on specific bus routes.
The current Southampton practice of providing door-to-door transportation for Pre-K and Kindergarten and pick up points grades 1 through 12 unless a stop is determined unsafe by the district and then door-to-door transportation is provided in those stop locations judged unsafe.
Southampton does not provide a late bus for athletics or co-curricular activities after school; Tuckahoe does three days a week. The study assumes no late bus routes.
The current bus transportation plan for the Shinnecock Nation continues as mutually developed.
In 2012-2013, an additional third district-wide bus run was instituted to transport separately the grades 9-12. This ‘What If’ transportation plan has grades 6-12 transported on one common bus run in the AM and in the PM. The youngest of pupils in Grade 5 are no longer at the Middle School. They are proposed to be served at the elementary school.
An additional resource is allocated to provide adult monitors on selected grades 6-12 to provide adult supervision if deemed necessary. Since 2012-2013, grades 5-8 and 9-12 have been transported separately. The study proposes an option that addresses the bus supervision of 6-12 students. The option is also more cost-effective in using the transportation resources of the district to benefit all the pupils in grades pre-K, K, and 1; grades 2-5; and grades 6-12.
An asset to the district is that the high school staff has built into their required teaching day an extra-help period to provide extra-help, advisement for clubs, and other student-related services at the end of each school day. The implementation of the model of one district-wide route for grades 6-12 will have all high school pupils remain in the building to receive the benefit of the end of the day extra help time and/or to meet for co-curricular activities. Already, the high school principal makes the cafeteria available for students not attending extra-help, or co-curricular activities, or are just waiting for the beginning of athletic practices that begin after the extra-help period at 2:38 each day.
All current pupil transportation runs and expenditures for transportation to private schools, and the BOCES are assumed to continue and therefore are not adjusted.
The Southampton UFSD currently has the bus/staff resources to implement three complete district bus runs for the 62.71 square miles of the newly reorganized school district. Southampton UFSD currently has 51.18 square miles and Tuckahoe Common SD has 11.53 square miles.

FINDINGS OF THE STUDY
53
Southampton UFSD has a bus purchase reserve in place along with a planned bus replacement schedule that is an available resource in case different size buses might be better suited to achieve the three district-wide routes each day.
The bus loops at the Middle School and High School are reported to be undersized. It is suggested that the school district work with the village to accomplish what other school districts do with similar circumstances. In collaboration with village police, a side street is closed to traffic for about 15 minutes each school day at dismissal time to ensure pupil safety and ‘quickness’ of boarding the buses.
Please note that outlined below is one possible framework scenario to provide transportation in a reorganized school district taking into account the assumptions listed above. The scenario described below is used as an element of the ‘What if’ financials picture for a reorganized school district and it is described here to give the communities a preliminary idea of what the student day and transportation may look like. It is expected that the student day in a reorganized school district may closely follow the times below. Please focus in on the staggered pattern of student school day times. Actual times may be different in the final plan to be developed by the district.
Grade Levels
Enrollment Location of School
Student Day Instructional Contact Time
Grades pre-K, K and 1
Estimated Number of Pupils if all ride a bus route: 401 including 90 pre-K pupils
Tuckahoe Building
8:45-3:30 6 hours, 45 minutes
Grades 2,3,4,5
Estimated Number of Pupils if all ride a bus route: 612
Southampton Elementary
8:15-2:45 6 hours, 45 minutes
Grades 6,7,8 Intermediate School
7:15-2:15
7 hours
Grades 9-12
Estimated Number of Pupils if all ride a bus route: 1116
High School
7:15-2:15
7 hours
The study suggests that the current bus transportation resources of the Southampton UFSD can accommodate a reorganized district with Tuckahoe SD. Southampton now provides three district-wide routes in the morning and the afternoon. If reorganization occurs, the draft transportation implementation plan calls for three district-wide bus runs:
a district-wide bus run just for grades pre-K, K and grade one attending the Tuckahoe School;
a district-wide bus run just for grades 2 through 5 attending the Southampton Elementary School;
and, a district-wide bus run for grades 6-12 attending the adjacently located middle school and high school.

FINDINGS OF THE STUDY
54
It is suggested that the current Southampton bus fleet is of sufficient size to transport the set of pupils of each district-wide bus run safely and without overcrowding. The study adds $50,000 to the “What if” Transportation and Financials as a resource to enable the use of adult bus monitors on selected secondary routes if judged appropriate. It is suggested that a comprehensive transportation review be undertaken after the first year of the newly reorganized district. Such a refined review could help ensure that the students are transported in the safest and most cost-effective manner. Estimated Cost and Revenue Basis for Transportation: Currently by Southampton: Expected with Reorganization by
Southampton: Number of Single Bus Routes AM and PM:
90 90
Number of district-wide runs AM and PM:
3 3
Expenditure for Bus Monitors on High School run if selectively needed:
$0
$50,000
Estimated transportation cost basis 2012-2013:
Southampton UFSD: $11,769 (average for each of 90 bus trips)
Where the estimates come from: The total transportation budget NOT INCLUDING SPECIAL RUNS FOR SPECIAL NEEDS PUPILS, FIELD TRIPS, VOCATIONAL CENTER RUNS, ATHLETIC AND CO-CURRICULAR RUNS that can vary yearly based on student programs and needs; divide that resulting expenditure number by the number of roundtrip bus runs to and from school in 2012-2013.
Transportation State Aid 2012-2013: Transportation aid from the State of New York can equal up to 90% of all approved expenses
depending upon the expenditures made and the property/income wealth of the district. The transportation aid currently received by Southampton is 6.5% for all transportation expenses
submitted for approval by the State in 2011-2012 payable in 2012-2013. Therefore, the local taxpayer on-average cost currently for each bus route one-way trip in Southampton is $11,005.
What might the financial picture look like for the new school district? M. What if Picture of the Estimated Long Term Budget Financials if the Two Districts Reorganize into One District Statement of Assurances Prepared by Both Boards When a reorganization is accomplished through annexation, the State Education Department suggests
both boards agree to a set of assurances that will be followed by the Board of Education of the school
district to which another school district is annexed. Below is the Statement of Assurances agreed to by
the Tuckahoe Common School District Board of Trustees and the Southampton UFSD Board of

FINDINGS OF THE STUDY
55
Education. The ‘What if Financial Picture’ offered by the study takes into account these agreed to
assurances.
STATEMENT OF ASSURANCES
• Governance
Upon an Annexation Event, the Southampton BOE agrees to permit a representative of the Tuckahoe Board of Trustees to attend all Southampton BOE executive and public sessions in an observer, non-voting role, and the Tuckahoe BOT agrees to permit a representative of the Southampton BOE to attend all Tuckahoe BOT executive and public sessions in an observer, non-voting role, until June 30, 2014. Non-voting representatives will be required to execute confidentiality agreements in connection with their attendance at executive sessions. Furthermore, in the event a Tuckahoe resident is not elected to the Southampton BOE at its annual meeting in May 2014, then the Southampton BOE agrees to extend the observer, non-voting role of the representative of the former Tuckahoe Board of Trustees until June 30, 2015.
• Continued Use of Tuckahoe School Name
Upon an Annexation Event, the Southampton Board of Education agrees that the school building currently known as the Tuckahoe School will retain its name for as long as it continues to operate as a school within the Southampton Union Free School District.
• Out-of-District Sending Arrangements
Upon an Annexation Event, and effective July 1, 2014, the Southampton Board of Education will not enter into any sending arrangement to another school district for any out-of-district services where such services can be provided within the merged district.
• Rights of Tuckahoe School Personnel
Upon an Annexation Event, and effective July 1, 2014, all Tuckahoe school personnel will merge into Southampton personnel groups based on mutual seniority lists to be exchanged and will retain equal rights and benefits as conferred by law and Southampton collective bargaining agreements where applicable.
The members of the Joint Community Advisory Committee are in concert with the two Boards of
Education and superintendents regarding long-term financial viability and sustainability of a reorganized
district if approved by the communities. All advise that a reorganized school district must institutionalize
a clear planning process to monitor the annual expenditures and revenues to ensure that the reorganization
incentive aid is prudently managed over the 14 years.
Therefore, the financial plan framework suggested by the study reflects this explicit guidance by outlining
a financial blueprint that ends the budget and property tax reliance on reorganization incentive aid
terminating in the same year that the aid stops coming to the newly organized school district.

FINDINGS OF THE STUDY
56
Estimated first year EXPENDITURE budget of a newly organized school district in 2014-2015. Assumption: The estimated first year budget and financial plan framework is based on the vision of the program elements for Pre-K through 12 in a reorganized school district developed with the insights and advice of the Joint Community Advisory Committee. This vision includes which buildings will host the various grade level configurations. Assumption: The estimated first year budget for the reorganized school district is guided by and reflects the pattern of delivery of instruction and services as included in the 2013-2014 Southampton budget plan. Therefore, it is estimated that the cost for staffing to serve the Pre-K through grade 8 pupils from Tuckahoe SD is about $6,104,634. Assumption: The Tuckahoe School Building will host grades Pre-K, K, and 1. The estimated costs to operate the building in 2014-2015 based on 2013-2014 expected costs are listed below: Operation of Plant-Contractual
Peconic Fire $ 1000 Pest Control 2000
Heating Controls 11,700 Bellringer $850 Sanitation 13,000
Snow Removal $5000 HVAC 16.000
Steam Boiler Services 350 SCWA 2000
Clean NEUT Tank 3750 Ansul System Inspection 1000
Verizon 12,000 AVI Inspection 1000
Elevator Service 2700 Clock Maintenance 8000
Operation of Plant-Supplies Custodial Supplies 40,000
Tractor and Equipment supplies 3000 Gasoline: Van and mowers 5000
School Grounds 6000 Operation of Plant- Fuel Oil, Natural Gas, and Electricity 143,211 Operation of Plant BOCES Health and Safety
Asbestos Quality Assurance 1751 Maintenance of Plant-Supplies 24,000 Maintenance of Plant-In-house repairs/improvements 146,000
Total: $433,328 Plus anticipated 2.5% inflation: 10,834
Estimated Total for 2014-2015: $444,162* *Tuckahoe accomplished an energy performance contract for capital work that guarantees energy savings will equate the local cost to pay for the renovations work. At the end of the ‘lease purchase’ for the facility energy improvements, the savings generated because of the work lowers budgeted energy expenditures at that time. The term of the lease purchase is from 2013-2028. During that term, $23,399.10 that once was paid to the energy providers out of this building budget goes instead to pay for the energy performance contract. That is, resulting lower energy costs resulting from the performance contract pay for the energy improvements to the building. Assumption: About 285 more pupils will be served by Southampton UFSD as a result of the reorganization. The Southampton UFSD is budgeting on average $2952 per pupil for instructional supplies, textbooks, and equipment. Therefore, the 2014-2015 estimated expenditure budget includes $841,320.

FINDINGS OF THE STUDY
57
Assumption: The long-term debt for the Tuckahoe School Building is listed below:
Fiscal year ended June 30, Principal Interest Total 2015 360,000 22,200 382,200 2016 375,000 7,500 382,500 735,000 29,700 764,700
The study suggests and recommends that Tuckahoe Common pre-pay the outstanding debt of $764,700 with anticipated cash and reserve funds available on June 30, 2014. In this way, the building aid on the $764,700 will be received as‘unencumbered’ revenue to the reorganized district in 2015 and 2016. It is estimated that the yearly building aid is about $37,000 for each of the two years. Assumption: It is estimated that the Tuckahoe Common SD will have $2,826,501 in cash from reserves and fund balance on June 30, 2014. The ‘What if Financials’ Picture incorporates the $2,826,501 as follows: Pre-payment of Tuckahoe Common outstanding debt service by June 30, 2014 before reorganization.
$764,700
Estimated Tuckahoe Common SD cash carried over to the newly organized school district on July 1, 2014
Allocation to the existing employee benefit reserve by Southampton for new employees to Southampton UFSD from Tuckahoe Common. In 2012-13, Tuckahoe Common expended $235,592 for retiree benefits.
$ 710,000
The Tuckahoe Common SD has a long history of maintaining its school building and upgrading it as may be necessary. Southampton allocation into a capital reserve (with appropriate approvals) to help fund future improvements/updates to the Tuckahoe School Building.
$ 300,000
Revenue allocation to the (2014-2015) first budget year of the newly reorganized district for the tuition of possible Tuckahoe special needs pupils who currently are served at placements out of the Tuckahoe Common SD in a BOCES consortium program. (State aid on the 2013-2014 expenditure is included in the 2014-2015 estimated regular state aid for the newly reorganized school district.)
$ 605,000
Revenue allocation to the 2014-2015 first year budget of the newly reorganized district to reduce the property tax levy.
$ 200,000
Revenue allocation to a Reserve for Unemployment. In this way, if there are unemployment costs resulting from the reorganization, there is a source of funds. However, if there are no inordinate unemployment expenses, Southampton may remove funds from such an Unemployment Reserve and apply those funds to the general fund to reduce the property tax levy in future budget years. The establishment, funding of, and use of an Unemployment Reserve rests solely with the authority of the Board of Education.
$ 246,801
Total cash carried over to the newly reorganized school district from Tuckahoe Common SD:
$2,061,801

FINDINGS OF THE STUDY
58
Assumption: As described in the “What if” Transportation Picture, $50,000 is suggested to be a resource to assign bus monitors as may be appropriate. If the communities approve a reorganization of the two districts with an annexation of Tuckahoe Common SD with Southampton UFSD, it likely will occur sometime before the end of the 2013-2014 school year. If the reorganization is approved, the instructional leadership and staff will begin to work together to prepare for the beginning of the reorganized school district from about January through June 2014. It is suggested that if the district decides not to implement additional bus monitoring, then the $50,000 resource be used to support continued instructional staff collaboration after July 1, 2014. Profile of the major elements of the first year’s expenditure budget of the newly organized school district in 2014-2015:
Total of the 2013-2014 Budget Presented by Southampton UFSD to its voters: $61,877,948Anticipated inflation between 2013-2014 and 2014-2015 of 2.5%. + 1,546,949
Anticipated total of the 2014-2015 budget of Southampton UFSD without reorganizing:
$63,424,897
Program Elements Resulting from Reorganization: Staffing: +$6,104,634
Operation of the Tuckahoe School Building: + 444,162Estimated Additional Instructional Supplies, Textbooks, and Equipment
to serve an additional 285 pupil Pre-K through grade 8 at the average allocation per pupil that is reflected in the 2013-2014 Southampton UFSD budget
($2952 per pupil estimate): + 841,320
Estimated Tuition for Tuckahoe Students served by BOCES special needs programming:
+ 605,000
Resource to assign bus monitors as needed and/or unassigned resource to support staff collaboration in the first year of reorganization:
+ 50,000
Net estimated expenditure budget in 2014-2015 for the first year of the newly organized district:
$71,470,013*
* This is a baseline planning total budget. It does not include expenditures for added retiree health benefits or possible unemployment benefits. Once these expenses are known, though, a corresponding revenue from established reserves for these purposes is applied thus the net to the baseline budget total is zero.

FINDINGS OF THE STUDY
59
Estimated first year REVENUE budget of a newly organized school district in 2014-2015: Assumption: The newly organized school district will receive $351,680 in legislatively defined school district reorganization incentive aid in the first year of reorganization. The schedule of reorganization aid for the two districts reorganized into one as per current legislation and state policy over the next fourteen years is:
REORGANIZATION INCENTIVE OPERATING AID
Base Aid as per SED (GEN report line 75):Districts: Southampton UFSD $710,000
Tuckahoe Common SD $169,200Total base a $879,200
Anticipated first year of reorganization: 2014-2015Therefore, last of 14 years of incentive aid: 2027-2028
MERGER YEAR TOTAL BASE AID INCENTIVE AID % EST. INCENTIVE1 $879,200 40% $351,6802 $879,200 40% $351,6803 $879,200 40% $351,6804 $879,200 40% $351,6805 $879,200 40% $351,680 Total est.first five years: $1,758,4006 $879,200 36% $316,5127 $879,200 32% $281,3448 $879,200 28% $246,1769 $879,200 24% $211,008
10 $879,200 20% $175,84011 $879,200 16% $140,67212 $879,200 12% $105,50413 $879,200 8% $70,33614 $879,200 4% $35,168 Total est. incentive aid
2028-2029 0% $0 over 14 years: $3,340,960
Assumption: Both school districts are members of the State Aid Planning Service of the Questar III BOCES. Working with the resources of the service, the study estimates the Combined Wealth Ratio of the newly organized district for 2014-2015 is:
Southampton Tuckahoe Combined
2010 Full Value 20,618,525,948 2,422,799,272 23,041,325,220 2011-12 TWPU 1,792 611 2,403 FV/TWPU 11,505,873.85 3,965,301.59 9,588,566.47 State Average 561,400 561,400 561,400Pupil Wealth Ratio 20.494 7.063 17.079PWR * .5 10.247 3.531 8.539
2010 Income 900,622,620 105,692,749 1,006,315,369 2011-12 TWPU 1,792 611 2,403 Inc/TWPU 502,579.59 172,983.22 418,774.60 State Average 169,300 169,300 169,300 Alt. Pupil Wealth Ratio 2.968 1.021 2.473APWR *.5 1.484 0.51 1.236
Combined Wealth Ratio 11.731 4.041 9.775

FINDINGS OF THE STUDY
60
Assumption: The SED reported estimate of state aid to both districts for 2013-2014 is listed below:
2013-14 State Aid Southhampton Tuckahoe Total
Foundation 1,468,448 433,600 UPK 102,600 54,000 BOCES 302,752 57,731
Admin 65,669 11,336 Services 237,083 46,395
Capital 0 0High Cost 61,324 24,412 Private Excess Cost 54,579 48,147 Hardware 0 0Textbook 93,841 32,504 Software 27,653 5,452 Library 11,537 2,275 Transportation 211,284 64,886 Building 381,120 32,252 High Tax 119,010 287,815 Supplemental Excess Cost 4,890 15,263 Gap Elimination Adjustment (494,176) (184,403) GEA Restoration 100,000 79,293 Net Gap Elimination AdjustmentTotal Aid 2,444,862 953,227 3,398,089
Listed below is the estimate of state aid that the newly organized school district might receive in 2014-2015. The estimate is based on applying the 2013-2014 legislatively approved state aid allocation methodologies and formulas to the school district data estimated of one newly organized school district formed with the annexation of the Tuckahoe Common SD to the Southampton UFSD. The study assumes a 2% increase in Foundation Aid statewide in 2014-2015. The study also assumes that a $150,000 Gap Elimination Adjustment Restoration for the newly reorganized district for 2014-2015. In 2013-2014 the enacted law provided both districts a combined $179,293 in gap elimination adjustment.
2014-15 Estimated State Aid Combined Tuckahoe and Southampton
Foundation 1,940,089 (estimate of 102% of the aid from 2013-2014)UPK 156,600BOCES
Admin 77,005Services 237,083 (Southampton only)
Capital 0High Cost 90,652 (Southampton data adding Tuckahoe's 11 high cost students)Private Excess Cost 109,158 (Southampton data adding Tuckahoe's private special ed students)Hardware 0Textbook 126,345Software 33,105Library 13,812Transportation 211,284 (Southampton only)Building 413,372High Tax 406,825Supplemental Excess Cost 20,153Gap Elimination Adjustment -678,579GEA Restoration 150,000 (estimated for 2014-15)Net Gap Elimination Adjustment -528,579Total Estimated Aid 2014-2015 $3,306,904
BOCES services aid from theservices purchases by Tuckahoe in 2013-2014 $46,395
Transportation aid based onTuckahoe transportation costs in2013-2014 $64,886
Total aid from expendituresmade by Tuckahoe in 2013-2014: $111,281
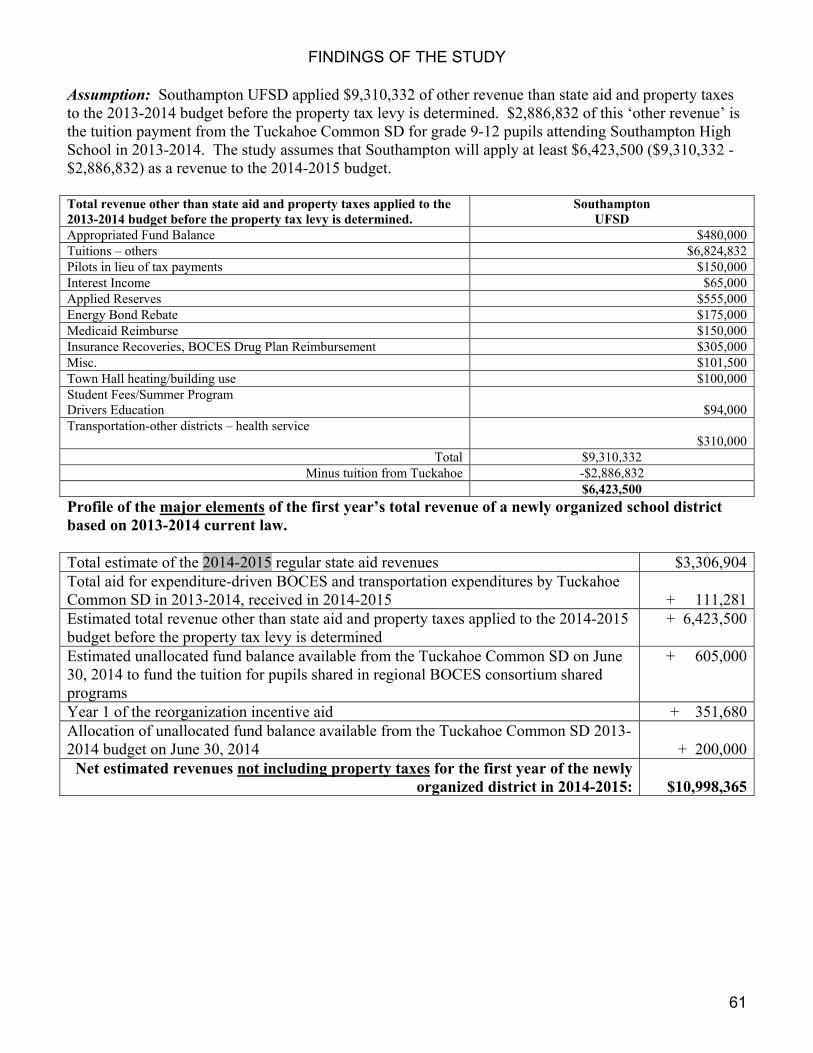
FINDINGS OF THE STUDY
61
Assumption: Southampton UFSD applied $9,310,332 of other revenue than state aid and property taxes to the 2013-2014 budget before the property tax levy is determined. $2,886,832 of this ‘other revenue’ is the tuition payment from the Tuckahoe Common SD for grade 9-12 pupils attending Southampton High School in 2013-2014. The study assumes that Southampton will apply at least $6,423,500 ($9,310,332 - $2,886,832) as a revenue to the 2014-2015 budget. Total revenue other than state aid and property taxes applied to the 2013-2014 budget before the property tax levy is determined.
Southampton UFSD
Appropriated Fund Balance $480,000 Tuitions – others $6,824,832 Pilots in lieu of tax payments $150,000 Interest Income $65,000 Applied Reserves $555,000 Energy Bond Rebate $175,000 Medicaid Reimburse $150,000 Insurance Recoveries, BOCES Drug Plan Reimbursement $305,000 Misc. $101,500 Town Hall heating/building use $100,000 Student Fees/Summer Program Drivers Education
$94,000
Transportation-other districts – health service $310,000
Total $9,310,332 Minus tuition from Tuckahoe -$2,886,832
$6,423,500 Profile of the major elements of the first year’s total revenue of a newly organized school district based on 2013-2014 current law. Total estimate of the 2014-2015 regular state aid revenues $3,306,904Total aid for expenditure-driven BOCES and transportation expenditures by Tuckahoe Common SD in 2013-2014, received in 2014-2015 + 111,281Estimated total revenue other than state aid and property taxes applied to the 2014-2015 budget before the property tax levy is determined
+ 6,423,500
Estimated unallocated fund balance available from the Tuckahoe Common SD on June 30, 2014 to fund the tuition for pupils shared in regional BOCES consortium shared programs
+ 605,000
Year 1 of the reorganization incentive aid + 351,680Allocation of unallocated fund balance available from the Tuckahoe Common SD 2013-2014 budget on June 30, 2014 + 200,000
Net estimated revenues not including property taxes for the first year of the newly organized district in 2014-2015:
$10,998,365
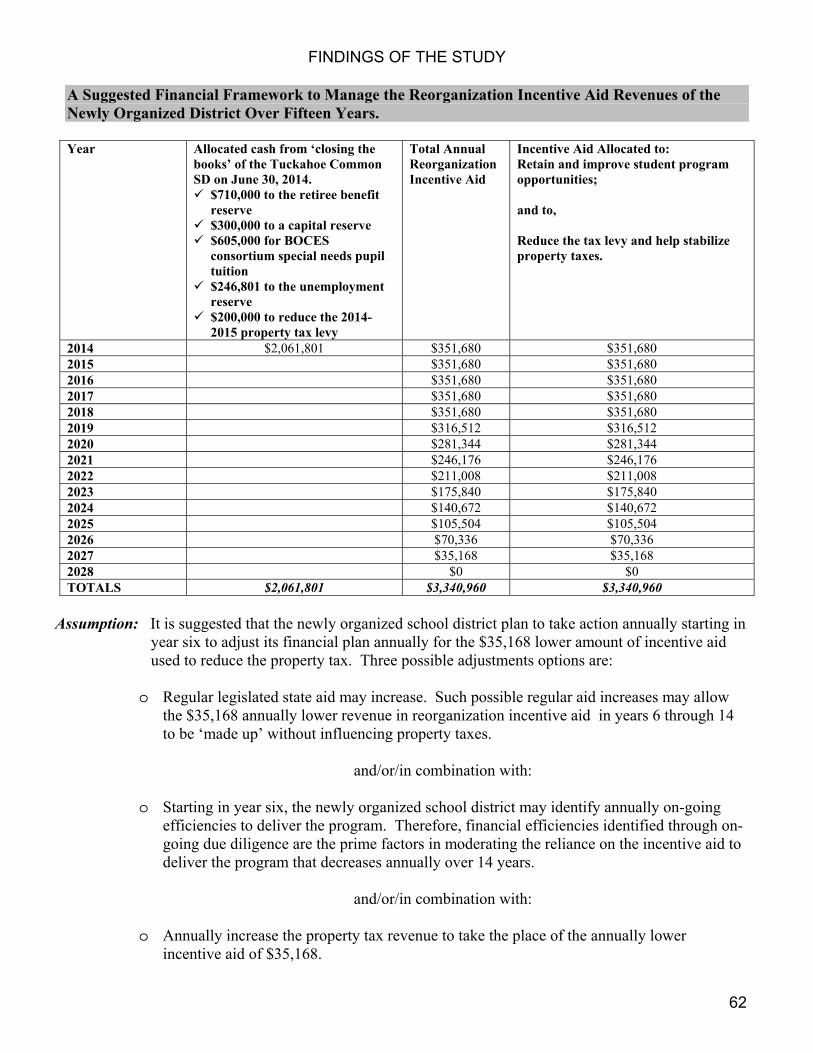
FINDINGS OF THE STUDY
62
A Suggested Financial Framework to Manage the Reorganization Incentive Aid Revenues of the Newly Organized District Over Fifteen Years. Year Allocated cash from ‘closing the
books’ of the Tuckahoe Common SD on June 30, 2014.
$710,000 to the retiree benefit reserve
$300,000 to a capital reserve $605,000 for BOCES consortium special needs pupil tuition
$246,801 to the unemployment reserve
$200,000 to reduce the 2014-2015 property tax levy
Total Annual Reorganization Incentive Aid
Incentive Aid Allocated to: Retain and improve student program opportunities; and to, Reduce the tax levy and help stabilize property taxes.
2014 $2,061,801 $351,680 $351,680 2015 $351,680 $351,680 2016 $351,680 $351,680 2017 $351,680 $351,680 2018 $351,680 $351,680 2019 $316,512 $316,512 2020 $281,344 $281,344 2021 $246,176 $246,176 2022 $211,008 $211,008 2023 $175,840 $175,840 2024 $140,672 $140,672 2025 $105,504 $105,504 2026 $70,336 $70,336 2027 $35,168 $35,168 2028 $0 $0 TOTALS $2,061,801 $3,340,960 $3,340,960
Assumption: It is suggested that the newly organized school district plan to take action annually starting in year six to adjust its financial plan annually for the $35,168 lower amount of incentive aid used to reduce the property tax. Three possible adjustments options are:
o Regular legislated state aid may increase. Such possible regular aid increases may allow
the $35,168 annually lower revenue in reorganization incentive aid in years 6 through 14 to be ‘made up’ without influencing property taxes.
and/or/in combination with:
o Starting in year six, the newly organized school district may identify annually on-going
efficiencies to deliver the program. Therefore, financial efficiencies identified through on-going due diligence are the prime factors in moderating the reliance on the incentive aid to deliver the program that decreases annually over 14 years.
and/or/in combination with:
o Annually increase the property tax revenue to take the place of the annually lower
incentive aid of $35,168.

FINDINGS OF THE STUDY
63
N. What is expected to happen to property taxes? Following is a projected 2014-2015 tax levy for the reorganized school district based on the financial framework described. Please note that the calculations are based on current property assessments and equalization rates that only the Town and State Board of Equalization can affect. The calculations are based on the 2013-2014 school property tax rates of the two individual school districts estimated to their respective communities in May of 2013. What if Picture of the Estimated Property Taxes if the Two Communities Choose to Reorganize the Two Districts into One Using the Student/Staffing Program Roadmap and the Financial Roadmap Suggested by the Study: Estimated budget for the first year of a reorganized district in 2014-2015 including a 2.5% inflation factor over the 2013-2014 budget:
$71,470,013
Total estimate of the 2014-2015 regular state aid revenues. - 3,306,904Total aid for expenditure-driven BOCES and transportation expenditures by Tuckahoe Common SD in 2013-2014, received in 2014-2015 by the reorganized school district - 111,281Estimated total revenue other than state aid and property taxes applied to the 2014-2015 budget before the property tax levy is determined
- 6,423,500
Revenue from Tuckahoe SD fund balance on June 30, 2014 to fund tuitions for pupils in BOCES consortium shared programming.
- 605,000
Revenue from Tuckahoe SD fund balance on June 30, 2014 to reduce the tax levy in 2014-2015 - 200,000Year 1 of the reorganization incentive aid - 351,680
Estimated tax levy for the first year of a reorganized district in 2014-2015: $60,471,648
School Year 2013-2014 Property Tax Shares and Rates as Developed by the Two Respective Districts in May of 2013
ESTIMATED ESTIMATEDAssessed Assessed
Value Value EstimatedTax Levy Apportionment Equalization Full School Tax Percent of Tax Levy 2013-2014
Town 2013-2014 2013-2014 Rate Value Levy Tax Levy Dollars Tax Rate
Southampton 20,756,082,864 20,756,082,864 1.0000 20,756,082,864 50,230,244 100.00% 50,230,244 $2.42
Total 20,756,082,864 20,756,082,864 20,756,082,864 100.00% 50,230,244 2.42 Tax rate on $1000 of Market Value
Southampton 2,193,749,324 2,193,749,324 1.0000 2,193,749,324 16,451,195 100.00% 16,451,195.00 $7.50
Total 2,193,749,324 2,193,749,324 2,193,749,324 100.00% 16,451,195.00 7.50 Tax rate on $1000 of Market Value
*Separate Community Propositions Not Included:Southampton Tuckahoe
Rogers Memorial Library Determined in August.Parish Art Museum $326,509 $7,868Southampton Youth Association $398,320 $53,320Southampton Historical Society $98,000
Southhampton UFSD*
Tuckahoe Common SD*

FINDINGS OF THE STUDY
64
EXAMPLE SCHOOL PROPERTY TAXES FOR THE UPCOMING 2013-2014 SCHOOL YEAR School District
Town
Example
True Value
Corresponding
Assessed Value
Estimated 2013-2014
Tax Rate Per $1000
Assessed Value
Estimated 2013-
2014 Property Taxes
$500,000 $500,000 $2.42 $1210 Southampton UFSD Southampton $1,000,000 $1,000,000 $2.42 $2420
$500,000 $500,000 $7.50 $3750 Tuckahoe
Common SD Southampton $1,000,000 $1,000,000 $7.50 $7750
ESTIMATED PROPERTY TAXES IN 2014-2015 IF THE TWO DISTRICTS REORGANIZE INTO ONE
ESTIMATED ESTIMATEDAssessed Assessed
Value Value EstimatedTax Levy Apportionment Equalization Full School Tax Percent of Tax Levy 2014-2015
Town 2013-2014 2013-2014 Rate Value Levy Tax Levy Dollars Tax Rate
reorganized with the annexation of Tuckahoe Common SD:
Southampton 22,949,832,188 22,949,832,188 1.0000 22,949,832,188 60,471,648 100.00% 60,471,648.00 $2.63
Total 22,949,832,188 22,949,832,188 22,949,832,188 100.00% 60,471,648.00 2.63 Tax rate on $1000 of Market Value
*Separate Community Propositions Not Included:Rogers Memorial LibraryParish Art MuseumSouthampton Youth AssociationSouthampton Historical Society
Southhampton UFSD*
ESTIMATED EXAMPLE SCHOOL PROPERTY TAXES FOR THE 2014-2015 SCHOOL YEAR IF BOTH SCHOOL DISTRICTS REORGANIZE INTO ONE
School District
Town
Example True Value
CorrespondingAssessed
Value
Estimated 2014-2015
Tax Rate Per $1000
Assessed Value
Estimated 2014-2015
Property Taxes
$500,000
$500,000 $2.63
$1315
Reorganized Southampton and Tuckahoe into one district
Southampton
$1,000,000
$1,000,000 $2.63
$2630

FINDINGS OF THE STUDY
65
Epilogue:
The Joint Community Advisory Committee suggested that the housing market of both districts continues
to include new construction and major renovations of existing residential and commercial properties. A
general perception shared by the Committee is that the property values will increase between 3% and 5%
over the next three years. If the outlook of the Joint Committee comes to fruition, charted below is an
estimated impact the added property values may have on a reorganized school district combining
Southampton UFSD and Tuckahoe Common. If the total property value of the reorganized school district
increases by 3% in the next 12 to 18 months, then the estimated property taxes for a newly organized
school district in 2014-2015 might be:
ESTIMATED ESTIMATED
Assessed AssessedValue Value Estimated
With a CAC Committee anticipated increase by at least 3%Tax Levy Apportionment Equalization Full School Tax Percent of Tax Levy 2014-2015
Town 2014-2015 2014-2015 Rate Value Levy Tax Levy Dollars Tax Rate
reorganized with the annexation of Tuckahoe Common SD:
Southampton 23,638,327,154 23,638,327,154 1.0000 23,638,327,154 60,471,648 100.00% 60,471,648.00 $2.56
Total 23,638,327,154 23,638,327,154 23,638,327,154 100.00% 60,471,648.00 2.56 Tax rate on $1000 of Market Value
*Separate Community Propositions Not Included:Rogers Memorial LibraryParish Art MuseumSouthampton Youth AssociationSouthampton Historical Society
Southhampton UFSD*
ESTIMATED EXAMPLE SCHOOL PROPERTY TAXES FOR THE 2014-2015 SCHOOL YEAR IF BOTH SCHOOL DISTRICTS REORGANIZE INTO ONE AND THE TOTAL VALUE OF THE
PROPERTIES IN THE NEWLY ORGANIZED SCHOOL DISTRICT INCREASE BY 3% AS SUGGESTED THEY MIGHT BY THE JOINT COMMUNITY ADVISORY COMMITTEE
School District
Town
Example True
Value
Corresponding
Assessed Value
Estimated 2014-
2015 Tax Rate
Per $1000 Assessed Value
Estimated 2014-
2015 Property Taxes
$500,000
$500,000 $2.56
$1280
Reorganized Southampton and Tuckahoe into one district
Southampton
$1,000,000
$1,000,000 $2.56
$2560

FINDINGS OF THE STUDY
66
The New York State Property Levy Tax Limit Legislation:
During the 2010-11 session, the New York State Legislature and Governor Cuomo enacted a “Property Tax Cap” (now referred to as a “Property Tax Levy Limit”). This new legislation limits the increases in annual school district property tax levies (not the tax rate). This “property tax levy limit” is determined by each school district according to an eight-step complex formula outlined in the law. During the budget preparation process for the 2012-2013 proposed operating budget, each separate district calculated that “limit” and that percentage varied by district. School districts have the option to exceed their 'tax levy limit” with at least 60% voter approval. This new law first affected the 2012-13 tax levies. Since school districts are currently operating under this new legislation and no reorganized district has been affected by it as of this writing, the full impact of this newly enacted Property Tax Levy Limit may not be known. Any long-range financial planning (including expenditures, revenues and fund balance) will be influenced by it. It is suggested that if the districts do reorganize, then they should maintain close communications with the State Education Department starting in year one of the budgeting process on how the limit will be calculated.
Below is the language in the Property Tax Law with respect to setting the property tax levy limit for reorganized districts: REORGANIZED SCHOOL DISTRICTS: WHEN TWO OR MORE SCHOOL DISTRICTS REORGANIZE, THE COMMISSIONER SHALL DETERMINE THE TAX LEVY LIMIT FOR THE REORGANIZED SCHOOL DISTRICT FOR THE FIRST SCHOOL YEAR FOLLOWING THE REORGANIZATION BASED ON THE RESPECTIVE TAX LEVY LIMITS OF THE SCHOOL DISTRICTS THAT FORMED THE REORGANIZED DISTRICT FROM THE LAST SCHOOL YEAR IN WHICH THEY WERE SEPARATE DISTRICTS, PROVIDED THAT IN THE EVENT OF FORMATION OF A NEW HIGH SCHOOL DISTRICT, THE TAX LEVY LIMITS FOR THE NEW HIGH SCHOOL DISTRICT AND ITS COMPONENT SCHOOL DISTRICTS SHALL BE DETERMINED IN ACCORDANCE WITH A METHODOLOGY PRESCRIBED BY THE COMMISSIONER.
What would the new school district need to do to prepare for the school year in ‘September 2014’? O. Outline of Major Transition Steps to Create One School District if the Communities Approve the Reorganization Referendum If the two district communities affirm an annexation of the two districts by statutory referendum, the reorganized district faces a series of transition decisions that should be addressed prior to or following formal establishment of the newly annexed district on July 1, 2014. It is rare that communities have the opportunity to create an entirely new school district, even though this is an annexation with the primary policies, governance, programs, etc resting with the Southampton district. It still provides an opportunity for a creation of a new vision for its students, the possibility of a united educational culture focused on students and teaching and learning; and a chance to increase the opportunities for student growth and development. In order to combine effectively and efficiently the two systems into one culturally coherent, coordinated, and seamless school district, a transition plan might be developed if the communities elect to reorganize. The reorganized school district would be operating concurrently with the two original school districts for a period of time. Each district has its own activities, instructional calendar, assessment program and the

FINDINGS OF THE STUDY
67
like to conduct while the same people will be planning for a new school district to take affect July 1, 2014. Establishing a viable transition team and plan is critical to the smooth and successful implementation of a newly reorganized district. Implementing a transition plan will require the cooperation and collegiality of all aspects of the school and communities of each district. Some of the transition decisions (in no priority order) include, but are not limited to: By September 1, 2014:
Finalize the plan to house K-12 students and staff within the grade level configurations and the buildings of the reorganized district for educational programming.
Assign administrative staff, instructional staff, and support staff Determine, implement and schedule grade 9-12 course offerings Establish bus transportation routes and pick up schedules Prepare and approve unified student handbooks; code of conduct; faculty and parent handbooks Develop a student orientation plan for each school building
Within the first 12 to 24 months:
◊ Commence a long-range facilities plan ◊ Study and review the school lunch, operations and maintenance, and transportation programs.
The range of tasks and decisions are relatively routine given the nature of the annexation, but it would be exciting as a new district becomes set to serve the communities and the students. Establishing a thorough, well-managed, participatory transition process that includes representatives from both former districts to guide the board of trustees, administration, and staff in establishing this new district is recommended.
P. Feasibility Study Question Summary The two Boards of Trustees commissioned the feasibility study to research data to answer the question: “Would instructional opportunity be enhanced for all students at a similar or reduced cost to taxpayers
by combining the two school districts?”
The study report has been reviewed and approved by the SED for public release. The major question facing the two communities is:
The definitive opinion about the value of the study question asked in the study rests with the two communities. The Boards encourage public discussion to advise them about reorganization. The ultimate decision to proceed or not to proceed with the implementation of reorganization into one school district rests with the two Boards of Trustees. The opportunities and challenges documented in the study by the Joint Community Advisory Committee and the SES Study Team can help the public discussion about an important public policy decision. The findings of the study suggest the following major items along with others for consideration by both communities:
◊ Educational program offerings for students and long-term program viability as two separate school districts as compared to the long-term viability of one reorganized school district.
◊ The likelihood of smaller total enrollments in both separate school districts over at least the next 5 to 8 school years.

FINDINGS OF THE STUDY
68
◊ Financial stability long-term as two separate school districts compared to one reorganized school district.
◊ Property tax estimated outlook as two separate school districts long-term as compared to the estimated property tax outlook for one reorganized school district.
Whichever direction the districts choose to take in the future remains a local decision to be determined by
the Boards of Trustees and the residents of the two districts. It is the intent of the study to provide as
much information as possible to help that process and support an informed electorate in both districts
about school district reorganization. The SES Study Team appreciates the opportunity to provide this
information and we thank again the community advisory groups of Southampton and Tuckahoe for their
time and insights throughout the study process.

The Feasibility Study contains original text, concepts, and formats crafted by the SES Study Team, LLC.