Embed Size (px)
Citation preview

Renewable Energy Integration
http://www.eia.doe.gov/kids/energyfacts/sources/images/left.gif http://www.re-energy.ca/
Professor Stephen LawrenceLeeds School of BusinessUniversity of Colorado at Boulder
Agenda Current and future sources of energy
What’s best? Distributed Generation

World primary energy consumption
BP website (BP.com)

World Energy Consumption to 2025
http://www.eia.doe.gov/oiaf/ieo/world.html

Energy Forecasts by Sector
http://www.eia.doe.gov/oiaf/ieo/world.html
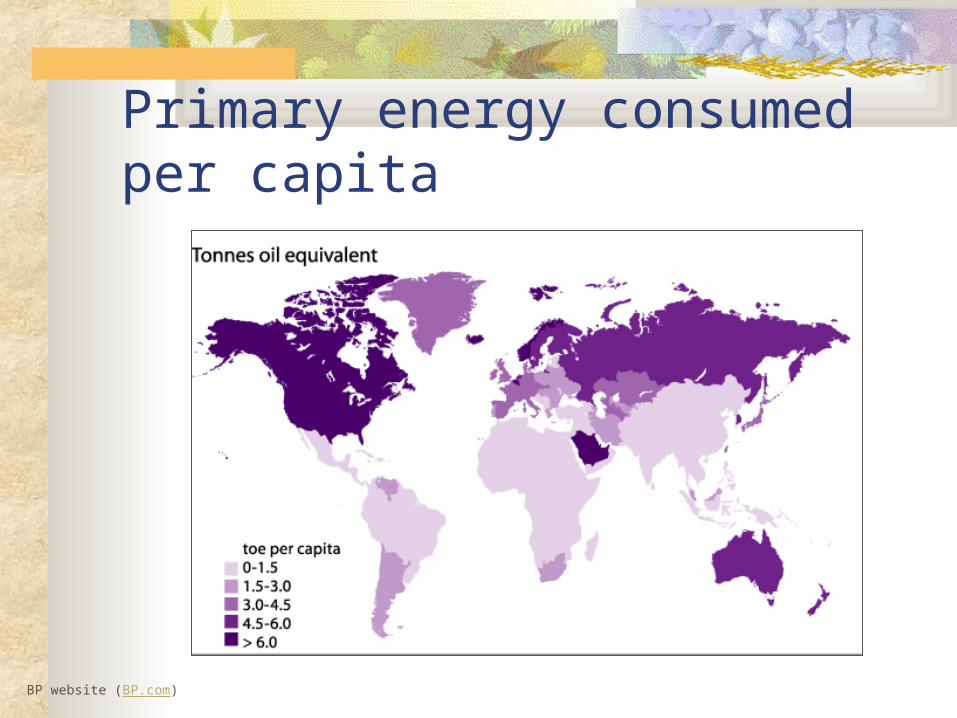
Primary energy consumed per capita
BP website (BP.com)
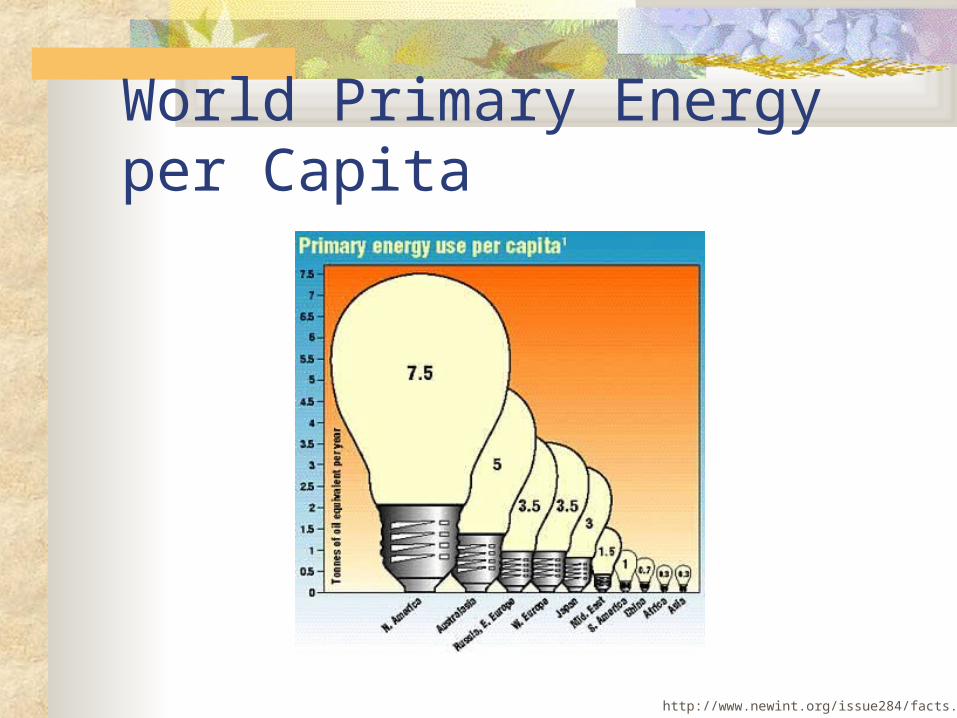
World Primary Energy per Capita
http://www.newint.org/issue284/facts.html

Oil & Gas Production Forecasts
Boyle, Renewable Energy, Oxford University Press (2004)

Global Fossil Carbon Emissions
Wikipedia.org, Climate Change, Global Warming articles

Carbon Dioxide Concentrations
Wikipedia.org, Climate Change, Global Warming articles


Fossil Fuels
BP website (BP.com)

Petroleum
http://www.lakesoil.com.au/photo6.jpg

Natural Gas
http://www.energy.gov.ab.ca/222.aspwww.citypublicservice.com

Coal
http://buildingsdatabook.eren.doe.gov/default.asp?id=fow&num=30

Tar Sands
http://www.protectowire.com/applications/profiles/electric_shovels.htm http://www.aapg.org/explorer/2005/05may/dinning.cfm
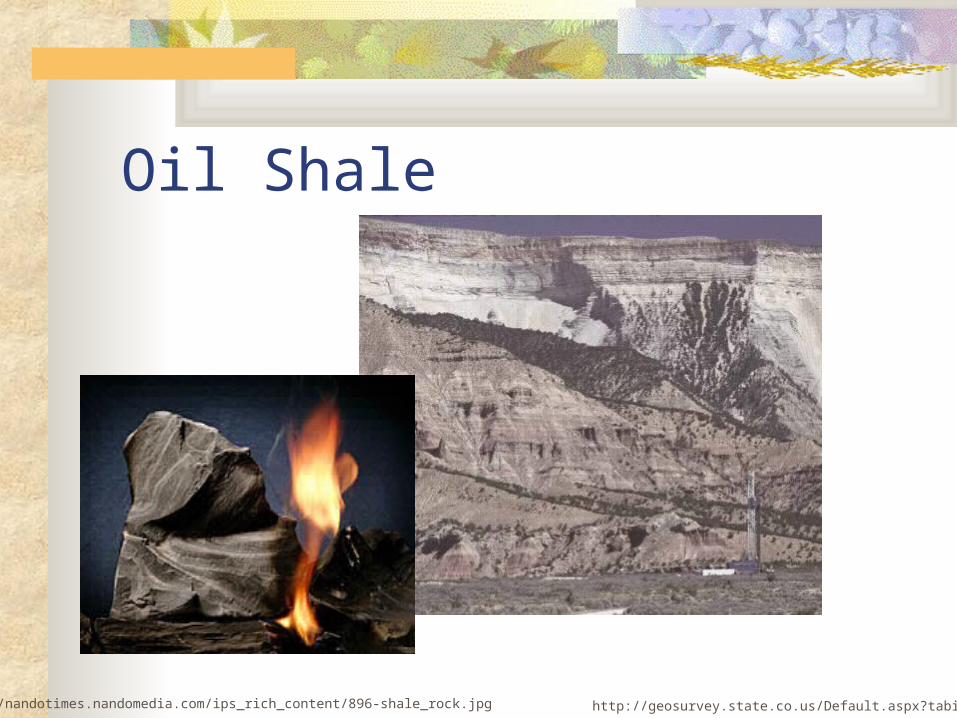
Oil Shale
http://nandotimes.nandomedia.com/ips_rich_content/896-shale_rock.jpg http://geosurvey.state.co.us/Default.aspx?tabid=104

Problems with Fossil Fuels/Coal Large source of atmospheric pollution
Create carbon dioxide (CO2) when burned Implicated in global warming
Nitrous oxides (NOx) – smog
Sulfur dioxide (SO2) – acid rain
Measurable amounts of radioactive material Naturally present in coal More than a nuclear power plant
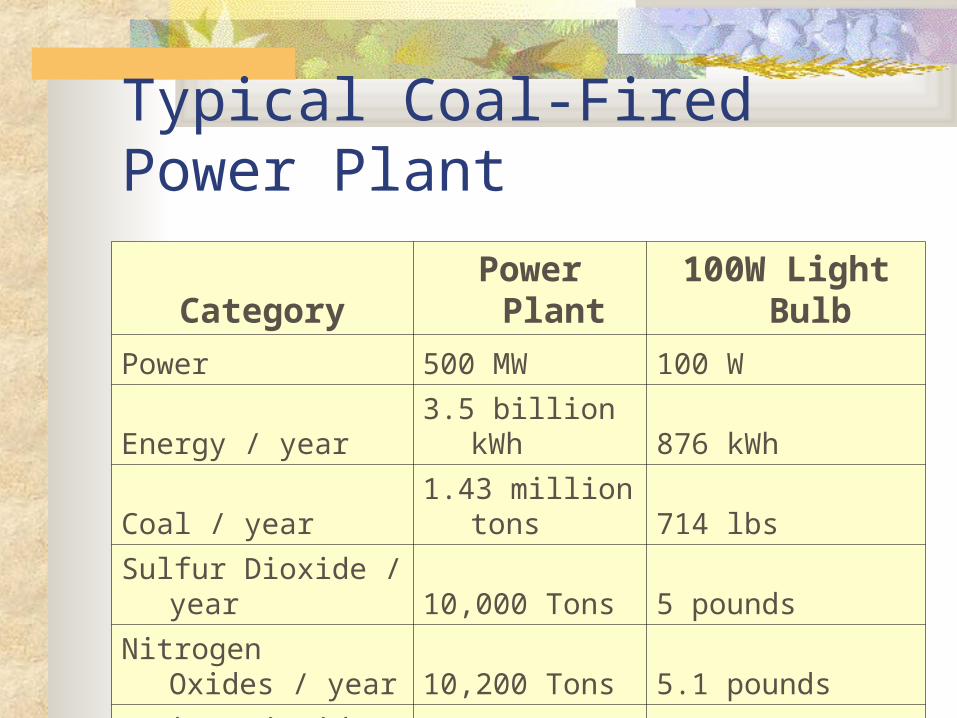
Typical Coal-Fired Power Plant
Category Power Plant 100W Light Bulb
Power 500 MW 100 W
Energy / year 3.5 billion kWh 876 kWh
Coal / year 1.43 million tons 714 lbs
Sulfur Dioxide / year 10,000 Tons 5 pounds
Nitrogen Oxides / year 10,200 Tons 5.1 pounds
Carbon Dioxide / year 3,700,000 Tons 1,852 pounds

CO2 Mitigation Options
http://www.netl.doe.gov

Carbon Sequestration Options
http://www.whitehouse.gov/omb/budget/fy2006/energy.html

Ocean Sequestration
http://www.lbl.gov/Science-Articles/Archive/sea-carb-bish.html
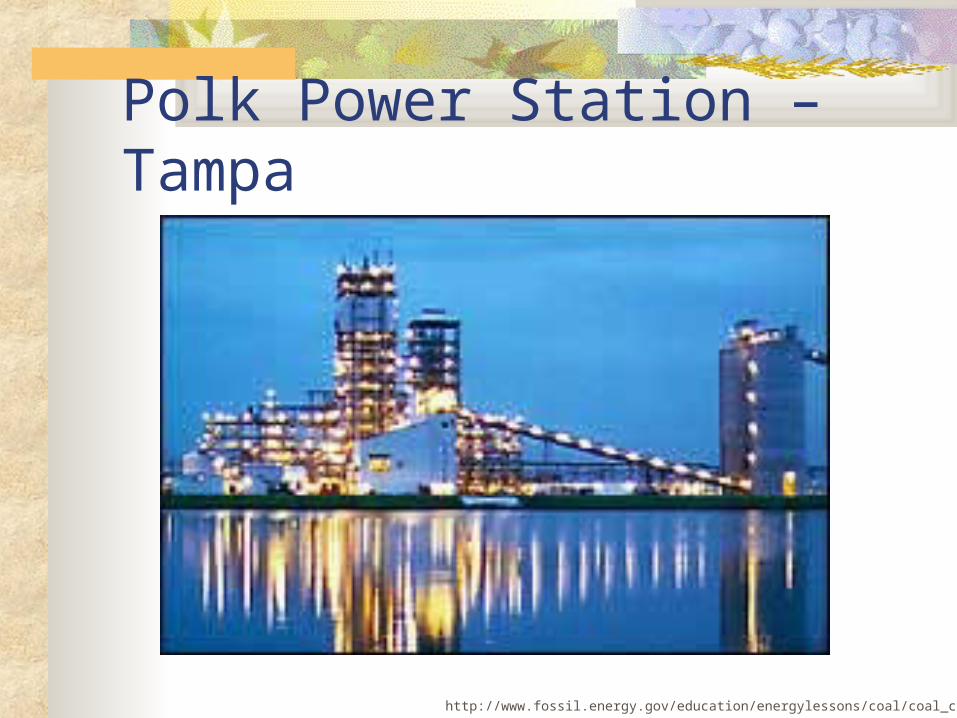
Polk Power Station – Tampa
http://www.fossil.energy.gov/education/energylessons/coal/coal_cct5.html

FutureGen

Nuclear Energy

Nuclear Energy Consumption
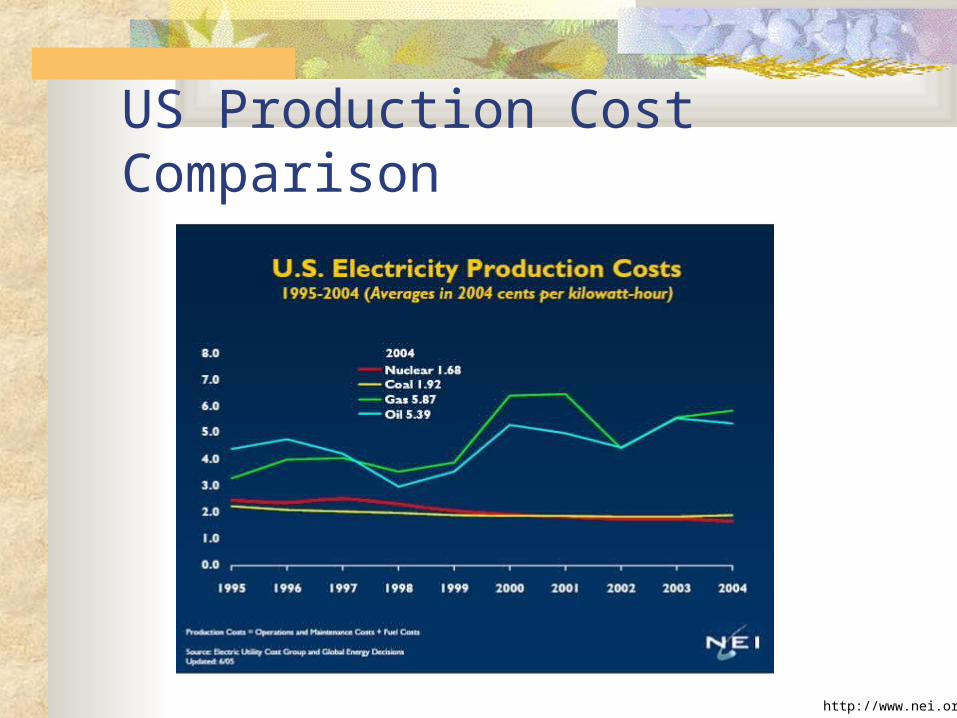
US Production Cost Comparison
http://www.nei.org

Spent Fuel Cooling Pool
http://www.uic.com.au/opinion6.html

Yucca Mountain Cross Section
http://www.nrc.gov/waste/hlw-disposal/design.html
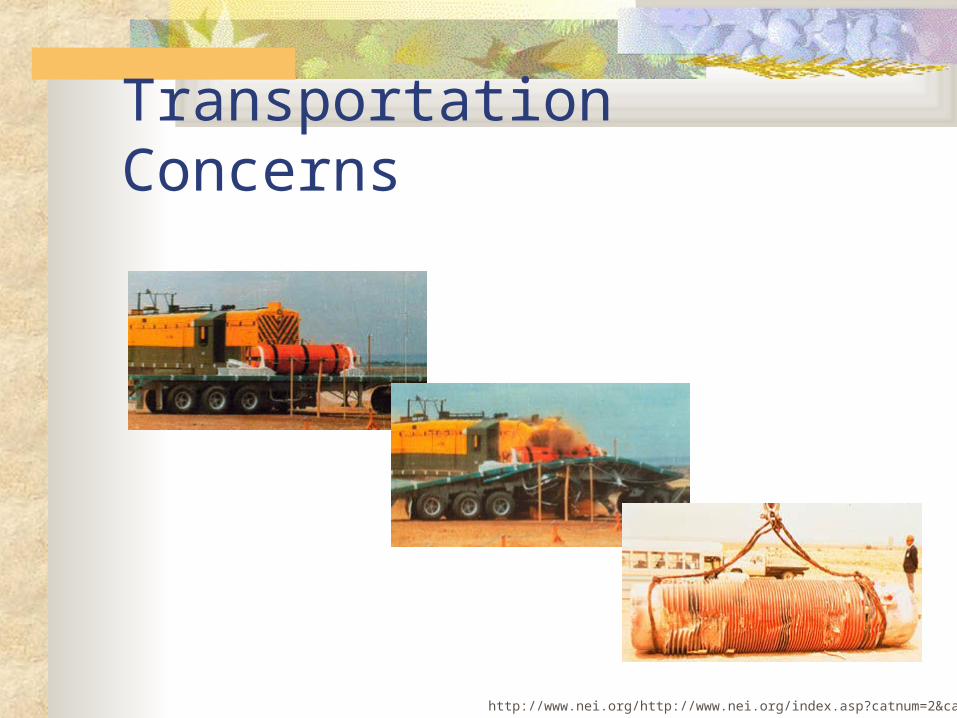
Transportation Concerns
http://www.nei.org/http://www.nei.org/index.asp?catnum=2&catid=84

Anti-Nuclear Ad
http://perth.indymedia.org/storyuploads/13114/en_4b.jpg

Hydropower
http://las-vegas.travelnice.com/dbi/hooverdam-225x300.jpg

Impacts of Hydroelectric Dams

Wind Energy

US Wind Energy Capacity
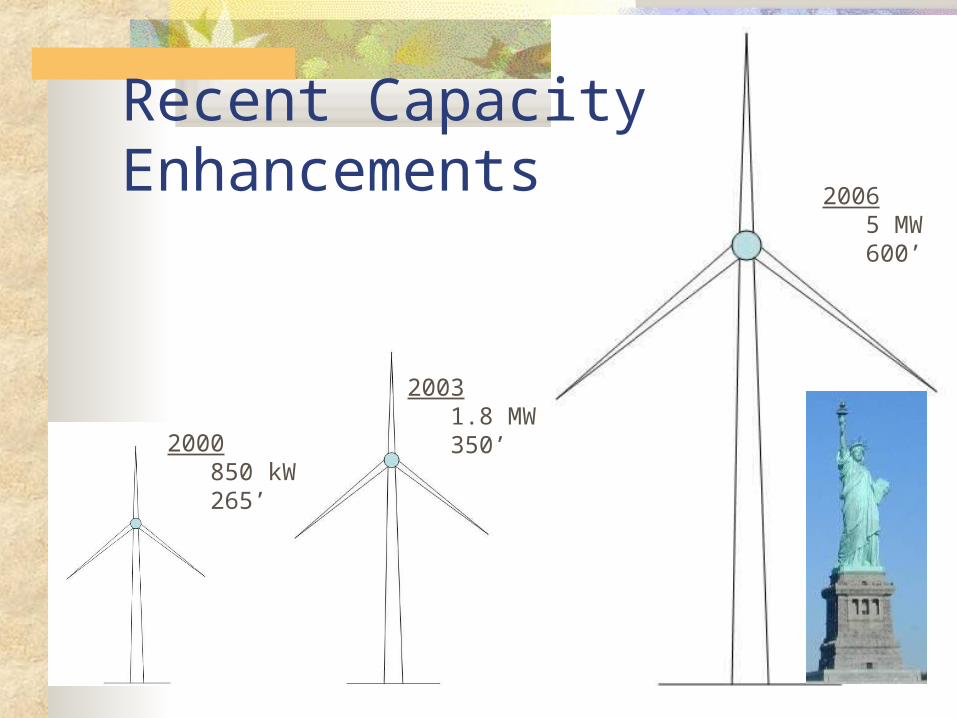
2003 1.8 MW 350’2000
850 kW 265’
2006 5 MW 600’
Recent Capacity Enhancements

$0.00
$0.10
$0.20
$0.30
$0.40
1980 1984 1988 1991 1995 2000 2005
38 cents/kWh
Costs Nosedive Wind’s Success
3.5-5.0 cents/kWh
Levelized cost at good wind sites in nominal dollars, not including tax credit
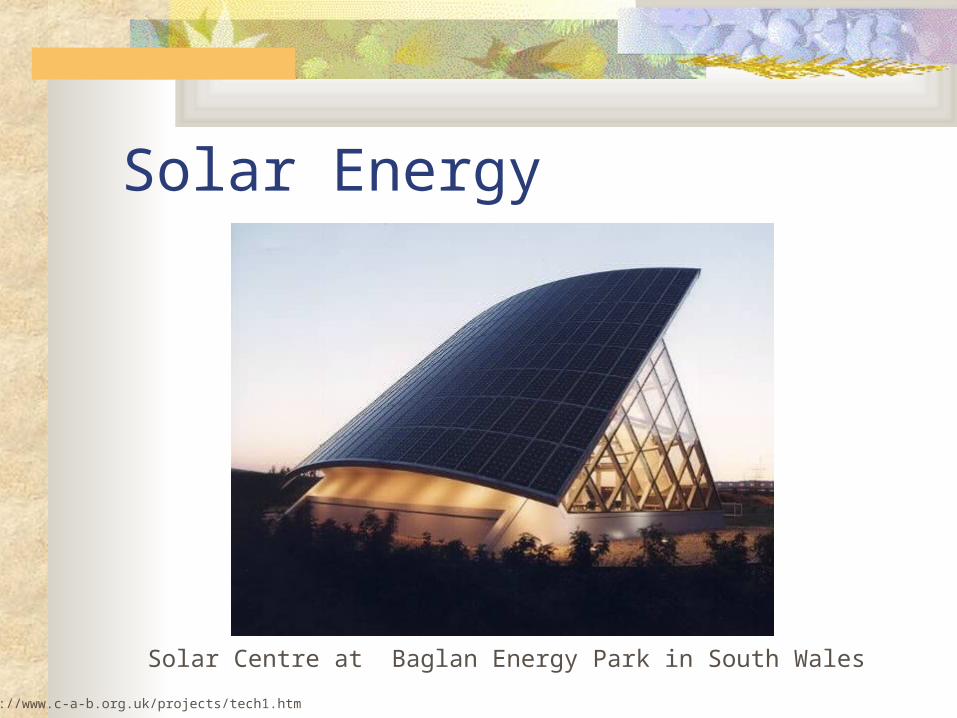
Solar Energy
http://www.c-a-b.org.uk/projects/tech1.htm
Solar Centre at Baglan Energy Park in South Wales

Large Scale Solar
http://en.wikipedia.org/wiki/Solar_panel

Small Scale Solar

Solar Cell Production Volume
http://sharp-world.com/solar/generation/images/graph_2004.gif
Sharp Corporation

http://en.wikipedia.org/wiki/Image:Nrel_best_research_pv_cell_efficiencies.png
PV Cell Efficiencies

Solar Thermal Energy
http://solstice.crest.org/renewables/re-kiosk/solar/solar-thermal/case-studies/central-receiver.shtml
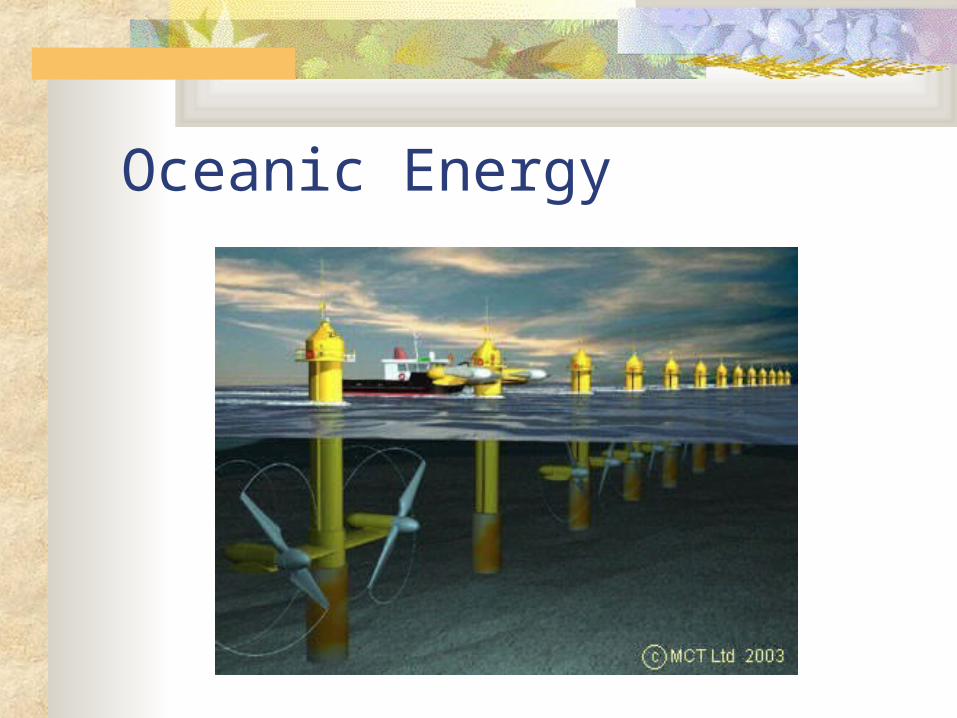
Oceanic Energy

Tidal Turbines (Swanturbines)
Direct drive to generator No gearboxes
Gravity base Versus a bored
foundation
Fixed pitch turbine blades Improved reliability But trades off efficiency
http://www.darvill.clara.net/altenerg/tidal.htm

Cross Section of a Tidal Barrage
http://europa.eu.int/comm/energy_transport/atlas/htmlu/tidal.html

Tapered Channel (Tapchan)
http://www.eia.doe.gov/kids/energyfacts/sources/renewable/ocean.html

LIMPET Oscillating Water Column Completed 2000 Scottish Isles Two counter-rotating
Wells turbines Two generators 500 kW max power
Boyle, Renewable Energy, Oxford University Press (2004)

“Mighty Whale” Design – Japan
http://www.jamstec.go.jp/jamstec/MTD/Whale/
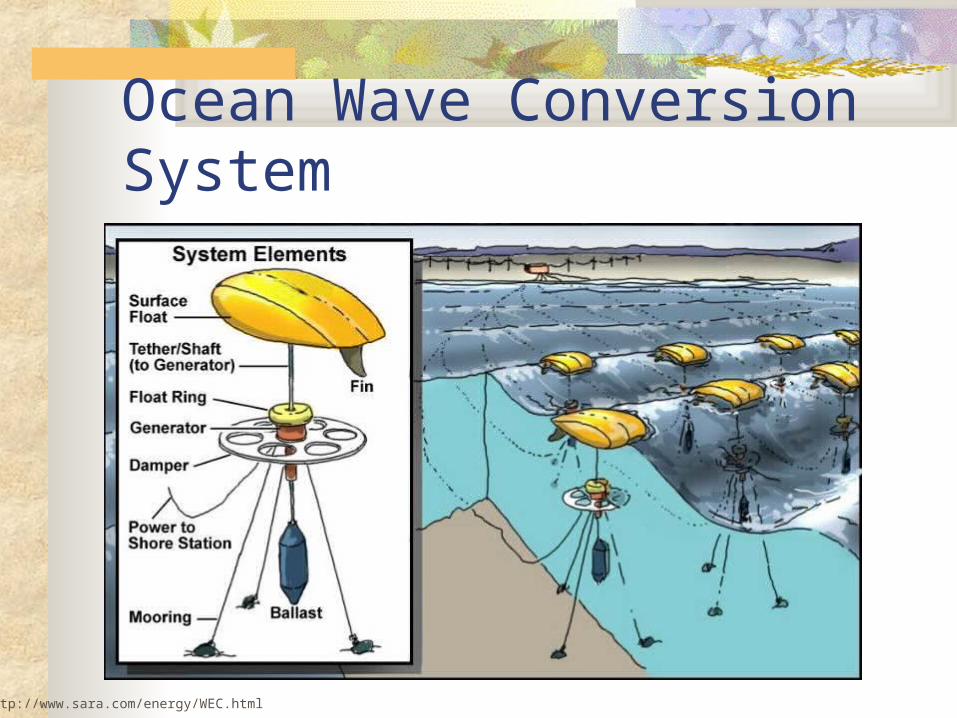
Ocean Wave Conversion System
http://www.sara.com/energy/WEC.html

World Oceanic Energy Potentials (GW)
Source Tides Waves Currents OTEC1
Salinity World electric2
World hydro
Potential (est) 2,500 GW 2,7003
5,000 200,000 1,000,000
4,000
Practical (est) 20 GW 500 50 40 NPA4
2,800 550
1 Temperature gradients2 As of 1998
3 Along coastlines4 Not presently available
Tester et al., Sustainable Energy, MIT Press, 2005

Geothermal Energy Plant
Geothermal energy plant in Icelandhttp://www.wateryear2003.org/en/

Geothermal Site Schematic
Boyle, Renewable Energy, 2nd edition, 2004

Methods of Heat Extraction
http://www.geothermal.ch/eng/vision.html

Global Geothermal Sites
http://www.deutsches-museum.de/ausstell/dauer/umwelt/img/geothe.jpg

Bioenergy Cycle
http://www.repp.org/bioenergy/bioenergy-cycle-med2.jpg

Types of Biomass
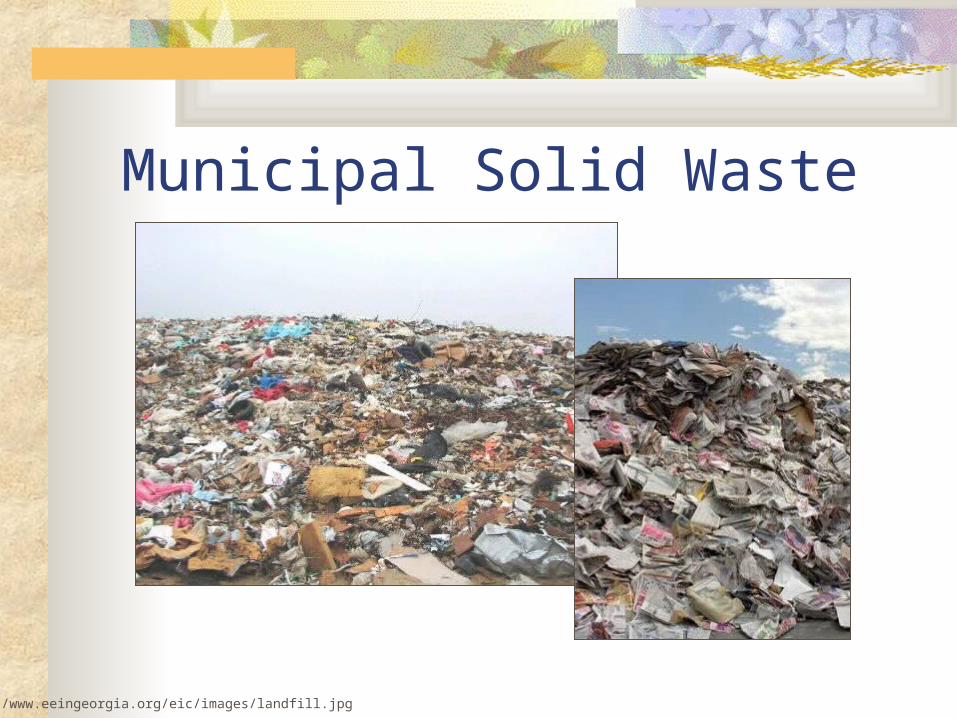
Municipal Solid Waste
http://www.eeingeorgia.org/eic/images/landfill.jpg

Landfill Gasses
Boyle, Renewable Energy, Oxford University Press (2004)


Hydrogen Economy Schematic

Electrolysis of Water (H2O)
http://www.gm.com/company/gmability/edu_k-12/9-12/fc_energy/make_your_own_hydrogen_results.html
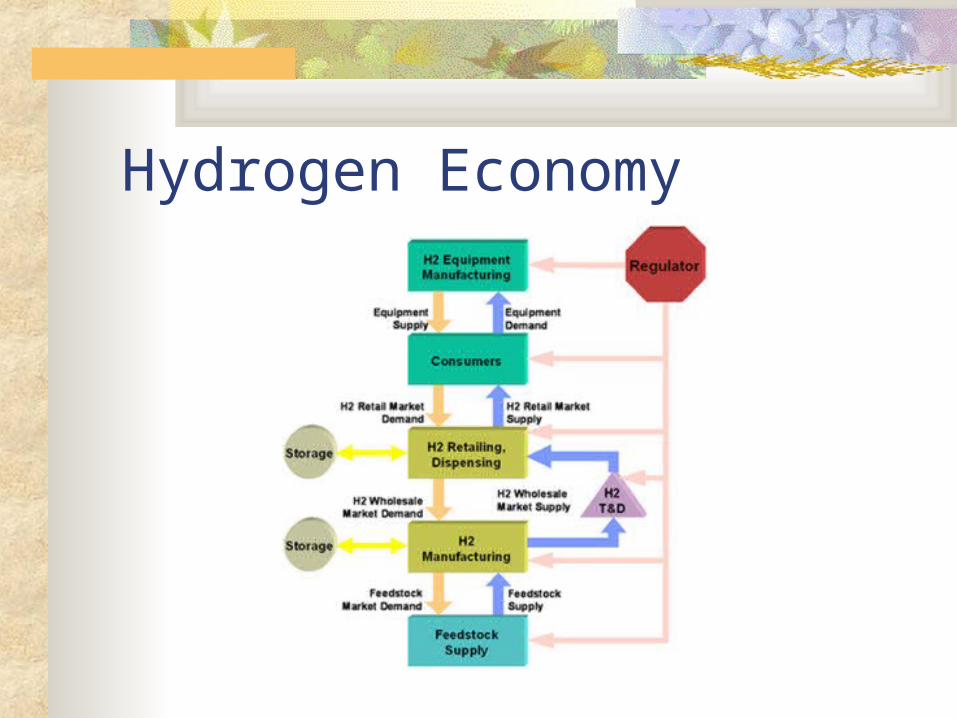
Hydrogen Economy

Transporting Hydrogen

UNIDO-ICHET Projection
http://www.unido-ichet.org/ICHET-transition.php
UNITED NATIONS INDUSTRIAL DEVELOPMENT ORGANIZATIONINTERNATIONAL CENTRE FOR HYDROGEN ENERGY TECHNOLOGIES

What to do? What’s best?

Distributed Generation
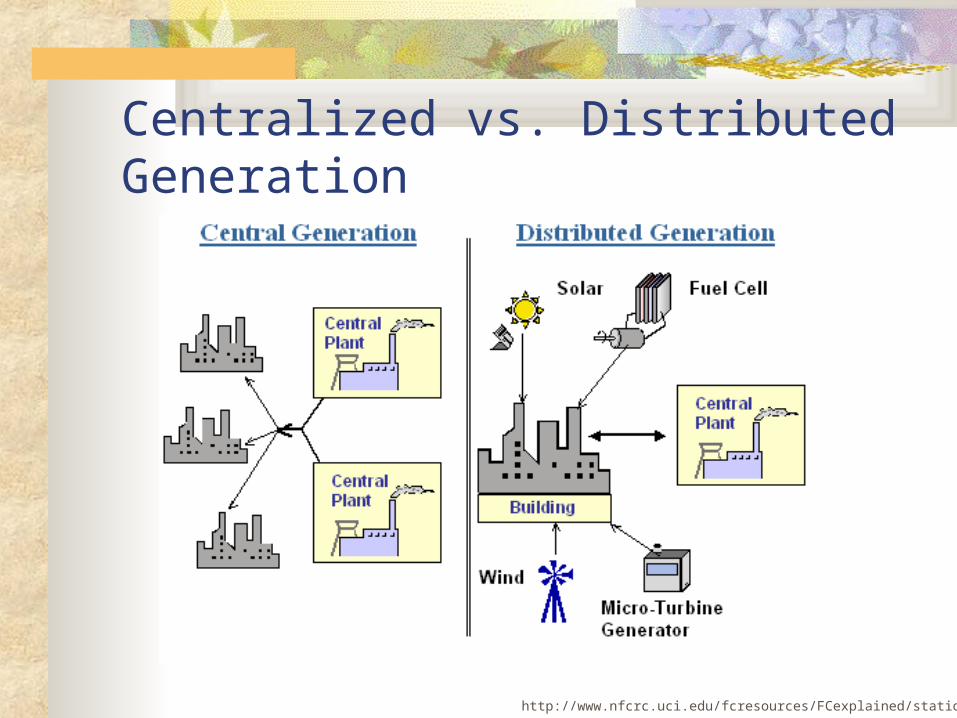
Centralized vs. Distributed Generation
http://www.nfcrc.uci.edu/fcresources/FCexplained/stationary.htm
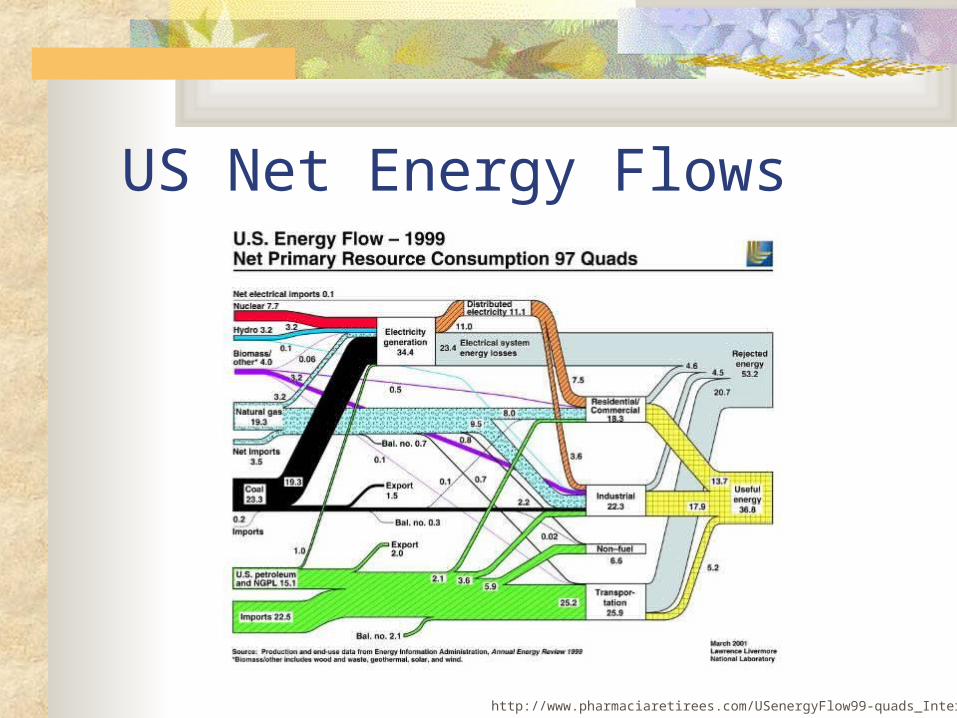
US Net Energy Flows
http://www.pharmaciaretirees.com/USenergyFlow99-quads_Internet.jpg

Power Generation Efficiency
http://www.pharmaciaretirees.com/distributed_generation.htm

Central Power Generation (today) Remote, Large, Expensive Long Distance Delivery Fossil Fuel Plants
Waste Heat (Nuclear) Environment Unfriendly (Co2) Health Unfriendly (Nox, So2, Pm10, Hg)
Nuclear Plants Waste Disposal
Hydroelectric Plants Flooding
Unreliable (2000-2003) 110 Grid Failures Cost $80-123 B./Yr Adds 29-45% To Electric Bill
http://www.pharmaciaretirees.com/distributed_generation.htm

Current Power Industry - Opinion Monopolies
Regulated No competition Ossified Expensive Inefficient Unreliable Unfriendly
“Time has come for an energy revolution”
http://www.pharmaciaretirees.com/distributed_generation.htm

Distributed Generation Located next to user Range of energy sources
Fossil fuel, waste gas, renewables, Hydrogen, nuclear
Capacity kw –Mw Economic benefits
“Waste” heat used Lowers fossil fuel use Low investment Power failure losses eliminated Environmental/ health costs reduced Grid costs – peak/capital Lower electric bills
Flexibility of location Cogeneration
Combined heat & power (CHP) Micropower
http://www.pharmaciaretirees.com/distributed_generation.htm

Opinions Regarding DG DG Can Play a Key Role
Where reliability is crucial- emergency capacity Alternative to local network expansion
Opinions “Has potential to fundamentally alter structure and organization of
our electric power system” (IEA) “Micropower passes nuclear as technology of choice for new plants
globally. We really could be seeing the revival of Edison’s dream” (VVV)
“The era of monopolization, centralization and other regulation has started to give way to market forces in electricity” (VVV)
United States today 931 DG Plants Deliver 72,800 MW 8.1% Of total US Power
http://www.pharmaciaretirees.com/distributed_generation.htm

Sources of DG Solar – photovoltaic and thermal Wind Turbines Hydroelectric (large scale and micro) Geothermal Oceanic Nuclear Fossil Fuels
Combined Heat & Power (CHP)
http://www.pharmaciaretirees.com/distributed_generation.htm

CG vs. DG TodayCG DG
Waste Energy % 67 10 Delivered Electricity % 33 90 Total Costs ($)
Generation 4.2 5.2 T & D 6.6 0.6 Total 10.8 5.8
CO2 X 0.5X Oil Equivalent (BB) Y -122 Fossil Fuel Sales (Trillions $) Z -2.87
http://www.pharmaciaretirees.com/distributed_generation.htm

CG vs. DG in 2020CG DG
Capital $B 831 504 Total Power Cost $B 145 55 Unit Power Cost ¢/kWh 8.6 5.5 Emissions
CO2 X 0.5X NOx A 0.4A SO2 B 0.1B
http://www.pharmaciaretirees.com/distributed_generation.htm

Enabling DG Technologies

Microturbines Low to moderate initial capital cost Fuel flexibility,
burn either gaseous (natural gas, propane, biogases, oil-field flared gas) or liquid fuels (diesel, kerosene)
Heat released from burning the fuel also providing heating and cooling needs (CHP
Extremely low air emissions NOx, CO, and SOx
Continuous operating even during brownout or blackout A cutaway of a microturbine; 30 and 60-
kilowatt units have just one moving part – a shaft that turns at 96,000 rpm.

Microturbine Systems
http://www.wapa.gov/es/pubs/esb/2001/01Jun/microturbine.htmhttp://www.cleanenergyresourceteams.org/microturbines.html

Micro-Hydro
http://www.itdg.org/?id=micro_hydro_expertise http://www.greenhouse.gov.au/yourhome/technical/fs46.htm

Porker Power – Lamar Colorado
http://www.state.co.us/oemc/programs/distributed/
Video

Distributed Generation Summary
Advantages of DG Local positioning avoids transmission and
distribution losses Generation adjacent to loads allows convenient use
of heat energy Combined heat and power (CHP)
Local positioning enables available sources of energy to be used, Waste products or renewable resources may be easily
utilized to supplement fossil fuels Local positioning allows the use of available single
or three phase generation
http://www.rglsolutions.com/Distributed_Generation.htm

Disadvantages of DG Disadvantages
Conventional distribution systems need adequate protection in order to accommodate exchange of power
Signaling for dispatch of resources becomes extremely complicated
Connection and revenue contracts are difficult to establish Issues with DG
The use of “Net Power” in certain areas of the US Power companies must by power from distributors a market rates
IEEE 1547 standard, still under formulation Standard for interconnecting distributed resources with electric
power systems Safety concerns with energy generated from multiple sources System protection under two way exchange of power
http://www.rglsolutions.com/Distributed_Generation.htm

Extra Slides
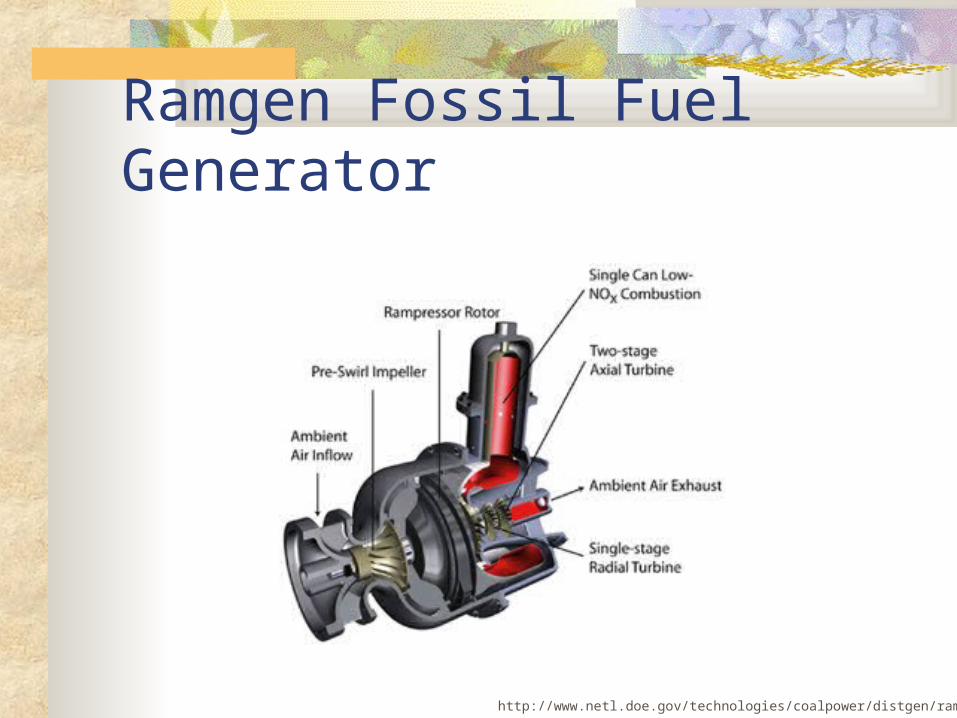
Ramgen Fossil Fuel Generator
http://www.netl.doe.gov/technologies/coalpower/distgen/ramgen.html