Embed Size (px)
Citation preview
Antitrust/Competition Commercial Damages Environmental Litigation and Regulation Forensic Economics Intellectual Property International ArbitrationInternational Trade Product Liability Regulatory Finance and Accounting Risk Management Securities Tax Utility Regulatory Policy and Ratemaking ValuationElectric Power Financial Institutions Natural Gas Petroleum Pharmaceuticals, Medical Devices, and Biotechnology Telecommunications and Media Transportation
Copyright © 2010 The Brattle Group, Inc. www.brattle.com
Renewable Energy IntegrationIssues and Analysis
Presented to:
EUCI Conference on Renewable Energy Development and Transmission Expansion
Portland, Oregon
Presented by: Judy Chang
August 11, 2010
2
Contents
Overview of the operational impact of integrating renewable energy
Defining the problem
How are renewable integration costs estimated?
How are utilities and RTOs addressing the problem?

3
What is the big fuss about renewable integration?
The ultimate question that RTOs and transmission utilities are asking is:
“How would adding significant amounts of variable resources impact operations and costs?”
… the natural next question is:
“Who should pay for these costs?”

4
What are the relevant renewable integration issues? FERC, in its January 2010 Notice of Inquiry, identified the following topics:♦ Data and forecasting♦ Scheduling flexibility and incentives♦ Day-ahead market participation and reliability commitments♦ Balancing authority coordination♦ Reserve products and ancillary services♦ Capacity markets♦ Real-time adjustments
Today, we are going to touch on the highlighted items.

5
Defining the renewable integration problem
Variability and Unpredictability associated with some renewable resources may require specific operational changes♦ When variability and unpredictability are smaller than that of
load, the existing system may be able to accommodate the wind and solar resource additions without significant operational or investment changes
♦ However, as large volumes of wind and solar resources are added to the system, large swings can significantly affect system reliability
So how do we measure the variability and unpredictability to assess whether they may impose additional costs to the system?
6
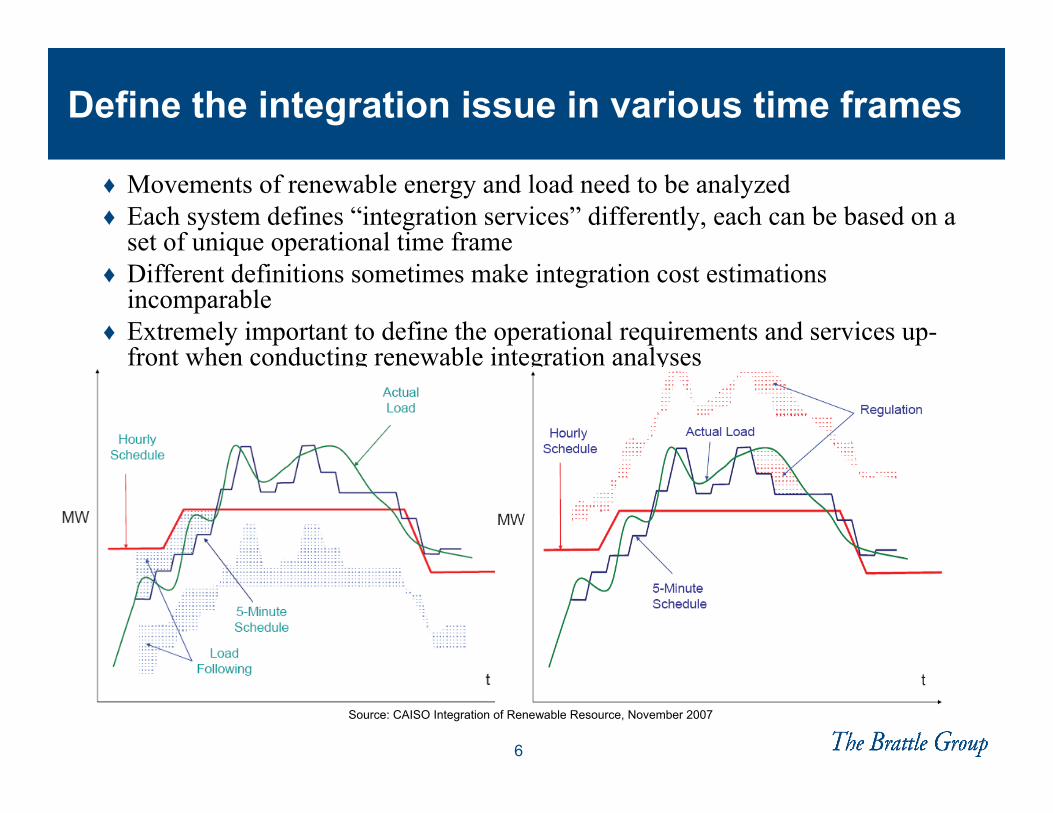
Define the integration issue in various time frames
♦ Movements of renewable energy and load need to be analyzed♦ Each system defines “integration services” differently, each can be based on a
set of unique operational time frame♦ Different definitions sometimes make integration cost estimations
incomparable♦ Extremely important to define the operational requirements and services up-
front when conducting renewable integration analyses
Source: CAISO Integration of Renewable Resource, November 2007

7
To simplify, the overall method compares scheduled energy with actual delivery within various time frames
♦ Deviations from schedules are central to the question and analysis• Deviations from schedules simultaneously measures variability and unpredictability • Quantifying these deviations is the first step in the analysis
♦ Start by asking system operations some critical questions:• When and how often are wind and solar generation forecasts performed?• When and how are the forecast data incorporated into operations?• When are conventional resources scheduled? When are those schedules adjusted?• What resources are asked to respond to changes determined at different time frames?• How is load variability accommodated today? How is load forecast data incorporated into
day-to-day operations?
Sample forecast and actual comparison
8
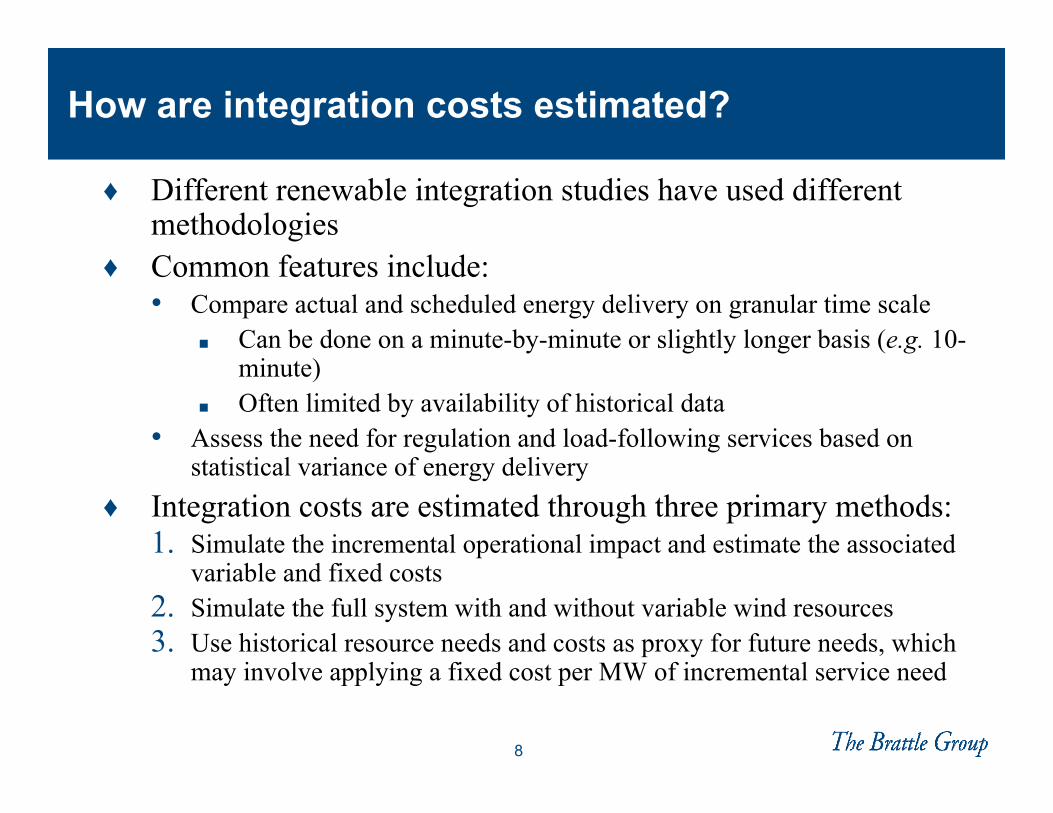
How are integration costs estimated?
♦ Different renewable integration studies have used different methodologies
♦ Common features include:• Compare actual and scheduled energy delivery on granular time scale
■ Can be done on a minute-by-minute or slightly longer basis (e.g. 10-minute)
■ Often limited by availability of historical data• Assess the need for regulation and load-following services based on
statistical variance of energy delivery♦ Integration costs are estimated through three primary methods:
1. Simulate the incremental operational impact and estimate the associated variable and fixed costs
2. Simulate the full system with and without variable wind resources3. Use historical resource needs and costs as proxy for future needs, which
may involve applying a fixed cost per MW of incremental service need

9
Each method has its own advantages and disadvantages
• Resource needs and associated costs may change over time
• Ignores any incremental capital cost implications
• Simple calculations• Can be adjusted over time
3. Use historical resource needs and costs as proxy for future needs
• Not model full systems on a hour-by-hour basis
• Not model the unit commitment under different renewable assumptions
• Focus on the central issue• Estimate the incremental impact • Can conduct quick estimations under
many different assumptions• Easy to benchmark
2. Simulate incremental operational and capacity needs
• Many assumptions can bog down the analysis and mask the central issue
• Must simulate scenarios of “with” and “without” variable renewables resources –which are never easy to define
• Must translate needs into ancillary services that the models can accept
• Ignores incremental capital cost implications
• Simulate the details of the system’s capability
• Can show each generator’s actual service delivery and system performance in each hour
• Many modelers are used to using production cost models
1. Simulate full system with production cost models
DisadvantagesAdvantagesMethodology

10
Renewable integration analyses show that additional ancillary services will be needed Various studies for CAISO, NYISO, ERCOT, NREL, and SPP employing a range of distinct methodologies,
yielding different results
But all studies agree that challenges include:• Increased need for regulation, spinning reserves, and load-following• Steeper system ramping requirements • More frequent and more serious over-generation events• Less efficient dispatch of conventional resources• Suppressed energy market prices
Graphs show the California
ISO’s estimated
Regulation need for
adding ~6,700 MW of wind to its system

11
Some studies have quantified the variable integration costs
♦ NREL’s Eastern Wind Study estimated the variable portion of wind integration cost to be between $3.5 to $5.0/MWh of wind in the future (in 2024 dollars)
♦ The study also shows that without transmission enhancements, substantial curtailment of wind generation would be required for a 20% wind penetration
♦ Further, NREL concludes that significant market, tariff, and operational changes would be needed across the eastern interconnection to manage the cost of integration large amounts of wind

12
Some key issues are not yet addressed
♦ Incremental capacity may be needed in the future to help integrate variable renewable resources, implying additional capital cost may be incurred
• As more wind and solar are added to the system, most planners expect existing conventional resources to run less
• But wind resources add little capacity value, and therefore much of the conventional resources will continue to be needed
• Operational needs can exceed the resource adequacy need on a system• Thus, integration cost includes more than the variable costs associated with
operating the existing resources♦ Ramp rate requirements will increase with additional wind
resources, implying new technology may be needed • Purchasing faster ramping resources may require additional costs
♦ Unit commitment may significantly change depending on how wind and solar participate in the day-ahead schedule/market

13
Renewable Integration Model (RIM) focuses on the heart of the issue directly
Historical load and wind/solar
data
Estimated amount of regulation, load-following, day-ahead unit
commitment, and ramping needed by season
Estimate incremental system-wide operational need to integrate
renewable resources
Quantify the conventional generation capacity needed using
a technology screening curve
Estimate fixed and variable costs of integrating renewable energy
resources
Data Input
Generation’s capital and operational costs and
capabilities
Output
Optimal mix of resources (based on input assumptions of available
technologies and costs)
Fixed and variable costs of integration (based on assumptions)
Simulation
Estimate system’s reliability needGenerating capacity need for
renewable integration (assuming not provided by existing system)

14
RIM can be used to help utilities and RTOs conduct cost estimations as assumptions change
Most studies are based on current technologies and costs
Capacity and variable costs can be adjusted to account for technology improvements and market dynamics
Cost assumptions
Most studies are static in nature, with assumptions about the size and mix of renewable resources
Accommodates portfolios of mixed resources, accounting for geographical and technology diversities
Renewable Portfolio Combinations
Most studies focuses on certain load and renewable levels
Can provide “incremental” or “aggregate”analyses to better estimate the effects of adding certain resources onto an existing system
Incremental Analysis
Most studies are static in nature. While studies report that forecast improvements will have a significant impact, that impact is not readily quantified
Input assumptions are user-driven which allows one to estimate impact of forecast and operations improvements
User Driven
Some studies aggregate granular data into average hourly information and in turn loses the important intra-hour information
Uses the most granular data available to derive regulation and load-following and ramping requirements
Data Usage
Compared to Existing StudiesThe Brattle Group’s Renewable Integration Model (RIM)
Functionality
15
What are utilities and RTOs doing to address integration cost issues?Generally, the renewable integration analyses have fallen under three categories of uses:♦ Utilities (e.g. Xcel, PacifiCorp) are estimating the integration costs associated with
procuring certain renewable resources, as part of system resource plans♦ Utilities (e.g. Westar, Puget Sound, BPA) are estimating the integration cost associated
with wind resources “exported” off their system♦ RTOs (NYISO, ISO-NE, CAISO, ERCOT) are estimating the likely system operational
impact and potential associated costsAbove analyses are then translating into:♦ Requiring renewable energy resource buyers to purchase more ancillary services♦ Some RTOs are considering charging wind generators for a portion of ancillary services
needs and credit them for supply others• Charges for regulation and reserve (for schedule deviation that increase A/S needs)• “Reliability credits” for wind generators that can offer primary frequency response, voltage
support, inertial-like response, metered contribution during ERCOT peak♦ Limit wind ramp rates when given (or released from) curtailment instructions♦ Further improve wind forecasting to reduce wind-related ancillary services requirements♦ Evaluating new resources that can address ramping challenge

16
Related renewable energy issues explored in various markets♦ Integrate wind into energy markets (bid-based dispatch) and ancillary
services provision♦ Improve balancing area coordination, such as WECC’s effort to create
region-wide residual energy imbalance market with dynamic interchange schedules
♦ Integrate wind with electricity storage and demand-response initiatives♦ Improve wind forecasting services (e.g., CAISO, ERCOT) and visualization
tools for real-time system operations that incorporate real-time wind output and forecast data
♦ Analyze wind integration on operating costs• CAISO simulations of operating requirements (locational A/S, ramping, economic
dispatch)• Expanding models to address sub-hourly operational challenges• Expansive data collection for better system dispatch, forecasting, and integration
studies♦ Transmission overlay planning:
• Efforts in MISO, SPP, ISO-NE (including analyses of cost allocation proposals)• Eastern Interconnection-wide planning studies

17
Additional Reading
Chang and Hanser, “Renewable Integration Model”, California Long-Term Procurement Plan Workshop, Energy Division of the California Public Utilities Commission (CPUC), CPUC Auditorium, San Francisco, August 25, 2010
Chang, Madjarov, Baldick, Alvarez, Hanser, "Renewable Integration Model and Analysis," IEEE 2010 Transmission and Distribution Conference and Exposition, New Orleans, LA, April 21, 2010.
Pfeifenberger, Chang, Hou, Madjarov, “Job and Economic Benefits of Transmission and Wind Generation Investments in the SPP Region,” The Brattle Group, Inc., March 2010.
Murphy, Aydin, Chupka, Chang, "Plugging In: Can the grid handle the coming electric vehicle load?" Public Utilities Fortnightly, June 2010.
Fox-Penner, Chang, Hou, Hledik, "Transmission Super Highways: Assessing the Potential Benefits of Extra-High-Voltage Transmission Overlays in the Midwest" The Brattle Group, Inc., March 2009.

18
About The Brattle Group: Services and Contact
Climate Change Policy and Planning Cost of Capital Demand Forecasting and Weather Normalization Demand Response and Energy Efficiency Electricity Market Modeling Energy Asset Valuation Energy Contract Litigation Environmental Compliance Fuel and Power Procurement Incentive Regulation
Rate Design, Cost Allocation, and Rate Structure Regulatory Strategy and Litigation Support Renewables Resource Planning Retail Access and Restructuring Risk Management Market-Based Rates Market Design and Competitive Analysis Mergers and Acquisitions Transmission
The Brattle Group provides consulting and expert testimony in economics, finance, and regulation to corporations, law firms, and governmental agencies around the world.
We combine in-depth industry experience, rigorous analyses, and principled techniques to help clients answer complex economic and financial questions in litigation and regulation, develop strategies for changing markets, and make critical business decisions.
Judy Chang ([email protected])44 Brattle Street, Cambridge, MA 02138
617-864-7900 www.brattle.com