Embed Size (px)
Citation preview

NitiAayog – IEA – ADB Western Regional Workshop on Indian Power Sector: Supporting a Low Carbon Transition, Pune, 18 April, 2018
Rangan BanerjeeDepartment of Energy Science and EngineeringIndian Institute of Technology Bombay
1
Renewable Energy Grid Integration and Flexibility

What is Flexibility ?
• Flexibility of operation in Power Systems – Ability of a power system to respond to a change in demand or supply
•Normal Operation
• Faults, Sudden tripping of units

Variability in Demand
0
100
200
300
400
500
600
700
800
900
1000
Load
(M
W)
Mumbai (2017)
Hottest Week Coldest Week
0
500
1000
1500
2000
2500
3000
Load
(M
W)
Delhi
Hottest Week Coldest Week
What is Flexibility ?
• Flexibility of operation in Power Systems – Ability of a power system to respond to a change in demand or supply
• Becoming more important with increasing share of renewables -wind and solar in the supply mix
• Flexible Generation• Flexible Transmission• Flexible Demand Side Resources• Flexible System Operation

Source: Powergrid 2012
0
500
1000
1500
2000
2500
3000
3500
1 2 3 4 5 6 7 8 9 10 11 12 13 14 15 16 17 18 19 20 21 22 23 24
MW
HOUR
Apr
Jun
Sep
Dec
Wind Power Tamil Nadu 2012
Wind – Seasonal and Daily Variation
Wind speed(m/s) measured at 10m at Chandrodistation, Kutch Gujarat
0
2
4
6
8
10
12
13
77
31
09
14
51
81
21
72
53
28
93
25
36
13
97
43
34
69
50
55
41
57
76
13
64
96
85
72
17
57
79
38
29
86
59
01
93
79
73
10
09
10
45
10
81
11
17
11
53
11
89
12
25
12
61
12
97
13
33
13
69
14
05
Win
d s
pee
d(m
/s)
Time(minutes)
Variation in Wind speed10.01.2016 10.04.2016

Source: Gujarat SLDC
0.00
20.00
40.00
60.00
80.00
100.00
120.00
140.00
160.00
180.00
06:30
07:00
07:30
08:00
08:30
09:00
09:30
10:00
10:30
11:00
11:30
12:00
12:30
13:00
13:30
14:00
14:30
15:00
15:30
16:00
16:30
17:00
17:30
18:00
18:30
19:00
MW
Time of the Day
Charanka (Gujarat) Solar Generation
11/4/2012
13/4/2012
29/4/2012
0
100
200
300
400
500
600
700
800
900
1000
1
44
87
130
173
216
259
302
345
388
431
474
517
560
603
646
689
732
775
818
861
904
947
990
1033
1076
1119
1162
1205
1248
1291
1334
1377
1420
Sola
r Ir
radia
nce(W
/m2)
Time(Minutes)
Variation in solar Irradiance for a day
10.01.2016 10.04.2016 10.08.2016
Solar PV Variation
GHI(W/m2)measured at Chandrodi station,Kutch Gujarat
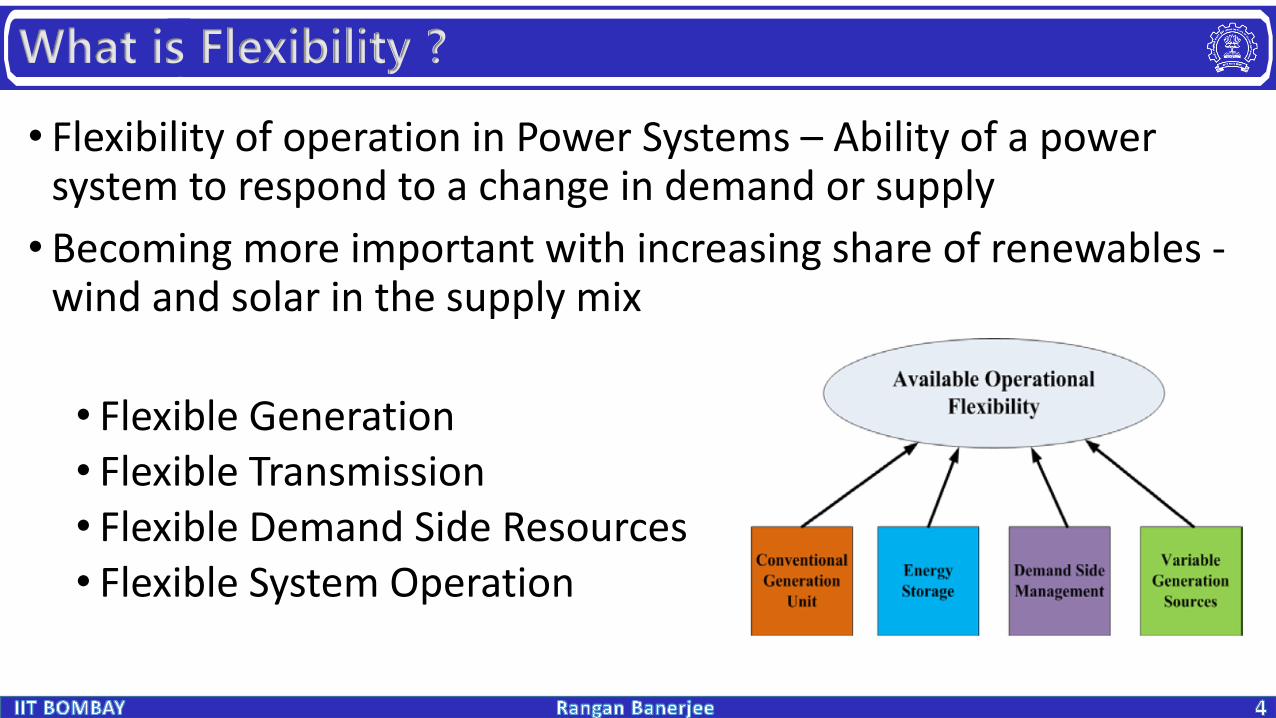
Renewable Generation 2015-16
7
Source: Prayas Oct 2016 India’s journey towards 175 GW

Context
2040

Ecofys (2014)

Characteristics of Thermal Power Plants
• Minimum Ramp Rate
• Minimum Up/Down time
• Minimum Stable Generation
• Start Up time
• Idle Time
• Insufficient Ramping Resource Expectation – Expected percentage of incidents
In a time period when a power system cannot cope with the changes in the net load,

Supply and demand options for flexibility
Supply-side measures
Operating existing plants flexibly
CoalGasStorage-hydroRun-of-river hydro
Build new flexible plant
Flexible gas HydroConcentrated solarBiomassTidal or wave power
Renewable curtailment
Wind, SolarImproved forecasting
Delayed plant retirement
CoalGas
Demand-side Measures
Industrial demand response
Steel, Aluminium, Chemicals Pulp and paper, CementManufacturing
Commercial & residential demand response
Heating, Cooling, Lighting, Water heating, RefrigerationData CentresAppliances & electronics
Water and waste
PumpingDesalination
Real-time response (By-sector)
Behavioural response (By-sector)
Automation-direct control
Consumer aggregation, by sector

Energy Storage for flexibility
Conversion to other Energy Forms
Heat and thermal inertia
Storage heatingStorage coolingCHP and district heating
Transport
Light vehicle chargingFleet LV charging Bus and rail
Hydrogen production and similar
Hydrogen production and storage Synthetic fuels Fertiliser
Other industrial products
Production and storage of chemicalsSteel Cement
Direct Electricity Storage
Batteries
Lithium ionLead acid Zinc bromine flowOther flow batteries Lithium air Solid-stateAqueous salt water
Flywheels
Supercapacitors
Pumped storage hydro
Pure pumped storageMixed pump-reservoirStorage
Compressed air energy storage

Degree of technical fitSpinning /load following
Short term reserve
Ramp-up capacity
Load shifting (day-night)
Seasonal shifting
Supply-side measures
Operating existing fossil plant flexibly
Build new flexible plant
Renewable energy curtailment
Delayed plant retirement
Demand side measures
Industrial demand response
Commercial/residential demand response
Water and waste
Real-time pricing
Behavioural response
Automation and direct control
Degree of technical fit – Supply and demand side
High Medium high Low-medium Low
Degree of technical fit Spinning /load following
Short term reserve
Ramp-up capacity
Load shifting (day-night)
Seasonal shifting
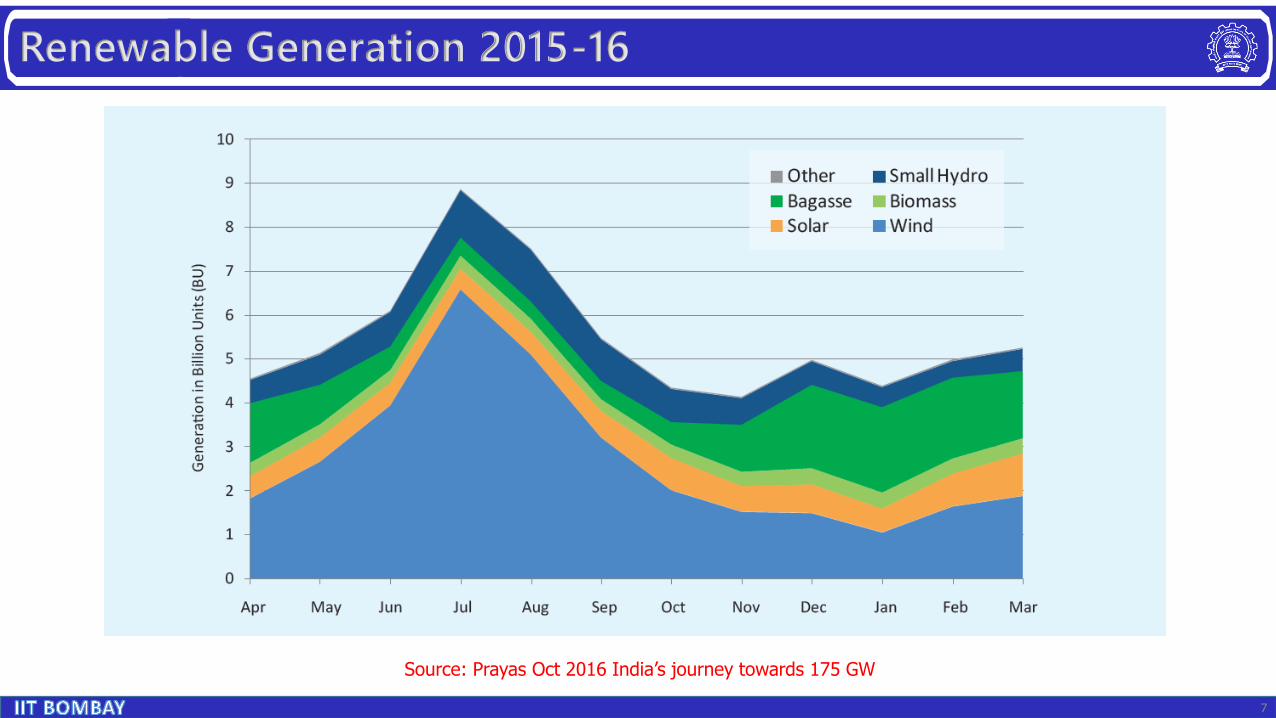
Direct electricity storage
Batteries, flywheels, supercapacitors
Compressed air energy storage
Pumped storage hydro
Degree of technical fit – Energy Storage
Conversion to other forms of energy
Electric storage heating and cooling
Transport (electric vehicle charging)
Hydrogen production
Other industrial products
High Medium high Low-medium Low


U. Andreas (2014)


Source: CEEW

Flexibility Retrofits
Source: Siemens presentation 2018

Methodology – Aggregate

0
50
100
150
200
250
300
1 2 3 4 5 6 7 8 9 10 11 12 13 14 15 16 17 18 19 20 21 22 23 24
Coal + Gas Generation
-30GW/hr
Filling of Curve
0
100
200
300
400
500
1 3 5 7 9 11 13 15 17 19 21 23
GW
h
Hours of Representative Day
January 2040 Duck Curve with Hydro
Hydro Demand -Solar - Wind Demand
0
50
100
150
200
250
300
350
400
450
1 2 3 4 5 6 7 8 9 10 11 12 13 14 15 16 17 18 19 20 21 22 23 24
GW
h
Hours of Representative Day
Jan-40
Solar Wind Nuclear Hydro Gas Coal
30GW/hr
January Coal PLF = 47.5%

Generation in 2040
0100200300400
GW
h G
ener
atio
n
Renewable Generation 2040 (Solar and Wind)
Solar Generation Wind Generation
0
100
200
300
400
500
GW
h
Generation by Source
Solar Wind Nuclear Hydro Gas Coal
Solar21%
Wind15%
Nuclear7%
Hydro9%
Coal40%
Gas8%
SHARE OF FUEL BY GENERATION

Conclusion
• Storage requirements start at 39% renewable generation
-500
-400
-300
-200
-100
0
100
200
300
400
500
1 2 3 4 5 6 7 8 9 10 11 12 13 14 15 16 17 18 19 20 21 22 23 24GW
h
Hours of Representative Day
Jun-40
Demand 15% 35% 50% 80%
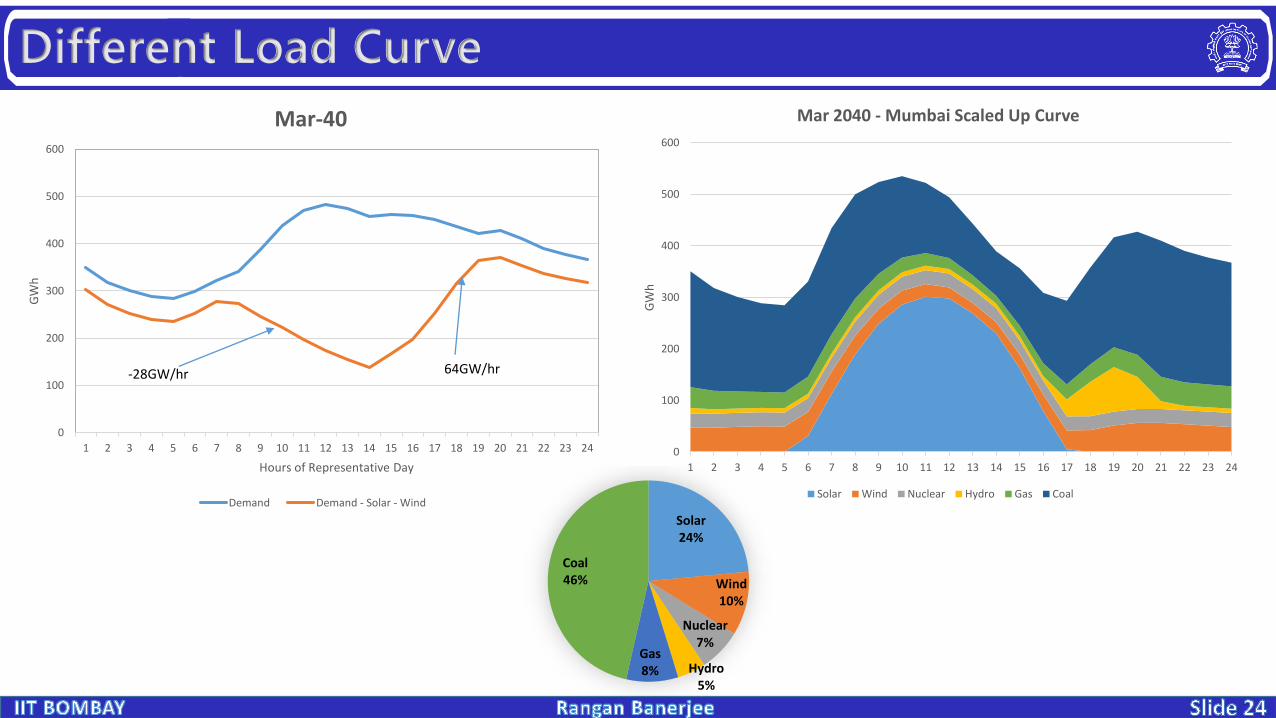
Different Load Curve
0
100
200
300
400
500
600
1 2 3 4 5 6 7 8 9 10 11 12 13 14 15 16 17 18 19 20 21 22 23 24
GW
h
Hours of Day
Mar-40 Demand Curve
Mumbai Scaled Up India
0
100
200
300
400
500
600
1 2 3 4 5 6 7 8 9 10 11 12 13 14 15 16 17 18 19 20 21 22 23 24
GW
h
Hours of Representative Day
Mar-40
Demand Demand - Solar - Wind
-28GW/hr
0
100
200
300
400
500
600
1 2 3 4 5 6 7 8 9 10 11 12 13 14 15 16 17 18 19 20 21 22 23 24
GW
h
Mar 2040 - Mumbai Scaled Up Curve
Solar Wind Nuclear Hydro Gas Coal
Solar24%
Wind10%
Nuclear7%
Hydro5%
Gas8%
Coal46%
64GW/hr

Research Framework – Disaggregate
Yearly DemandAnd seasonal load profiles
Thermal and nuclear power plants modeled unit-wise(571 coal, 199 gas units, 6
nuclear plants)
Solar, wind, hydro, bio energy
(region-wise)
TIMES
Hourly electricity generation
Cost of electricity Plant load factors Emission
Demand satisfaction,Capacity transfer constraint,
Capacity use, emission constraint,
Min share of technologies
Cost Minimization
Constraints
Emissions Minimization

Results – Age of operating units
• Avg age higher in Min cost (14.3yrs)• Newer plants with less emission factor in Min
Emissions. (10.6yrs)• 7GW of older units, not operating in both have
average age of 21.3.
0
10
20
30
40
50
60
31 to 35 36 to 40 More than 40
Num
ber
of
Units
Age
Min cost Min Emi
0
50
100
150
200
250
300
350
400
450
<5 <10 <15 <20 <25 <30 <35 <40 All
Num
ber
of
Units
Age
Min cost Min Emi
0
10
20
30
40
50
60
70
80
0 to 5 6 to 10 11 to 15 16 to 20 21 to 25 26 to 30 31 to 35 36 to 40 40+
Perc
enta
ge (
%)
Age
Min Emi Min Cost

Results – Cost of Electricity and Emissions
3.393.72
4.01
0
0.5
1
1.5
2
2.5
3
3.5
4
4.5
Min Cost Min Emissions Min Emissions- no gasconstraint
Co
st o
f El
ect
rici
ty (
Rs/
kWh
)
937.2844.7
749.3
0
100
200
300
400
500
600
700
800
900
1000
Min Cost Min Emissions Min Emissions - nogas constraint
Emis
sio
ns
(kt)
Gas consumption with and without gas generation constraint
9.7% higher 18.2% higher20% reduction9.8% reduction

Concentrated Solar Power (CSP) with Storage
PCM storage andSteam accumulator
Turbine
F
Condenser
LFR Superheater
solar field
Thermocline molten salt storage
Central tower receiver
LFR evaporator solar field
Heliostat solar field
Heat exchangers
24x7
Dis
patc
habl
e ou
tput
Boiler feed water pumps
/
/

• Hybrid solar fields –
• Linear Fresnel Reflectors – 1092 m2
• Heliostats – 800 m2
• Thermal storage–
• 1 MWhth thermocline molten salt storage
• 2 GJ PCM (latent heat) and steam accumulator storage
• 24x7 425 °C, 40 bar turbine grade steam
0
500
1000
1500
2000
2500
3000
3500
4000
4500
5000
0
100
200
300
400
500
6 7 8 9 10 11 12 13 14 15 16 17 18 19 20 21 22 23 0 1 2 3 4 5
Net
een
rgy
(kW
h)
Mas
s fl
ow
rat
e (k
g/h
r) /
DN
I (W
/m2
)
24x7 CST plant output
Energy input from solar field (kWh) Net thermal storage (kWh)
Steam at outlet (kg/hr) DNI (W/m2)

Andasol 3 – Flexibility - CSP
Sr. No.
Attribute Observations
1 Base load Andasol 3 continuously for a week
2 Intermittency of solar radiation
Power output maintained
3 Dispatchability tests
Met grid operator schedules
4 Power reduction requests
Demonstrated reduction capability, restored to full load
5 Shifting generation to the highest-value times
High output when prices rose in late evening
Crescent Dunes CSP plant (110 MW x 10h) remained unaffected during the solar eclipse

Redox Flow Batteries
SEI (2011)

Redox Flow Batteries
6 MW Battery Tanks (Electrolyte) NEDO
SEI (2011)
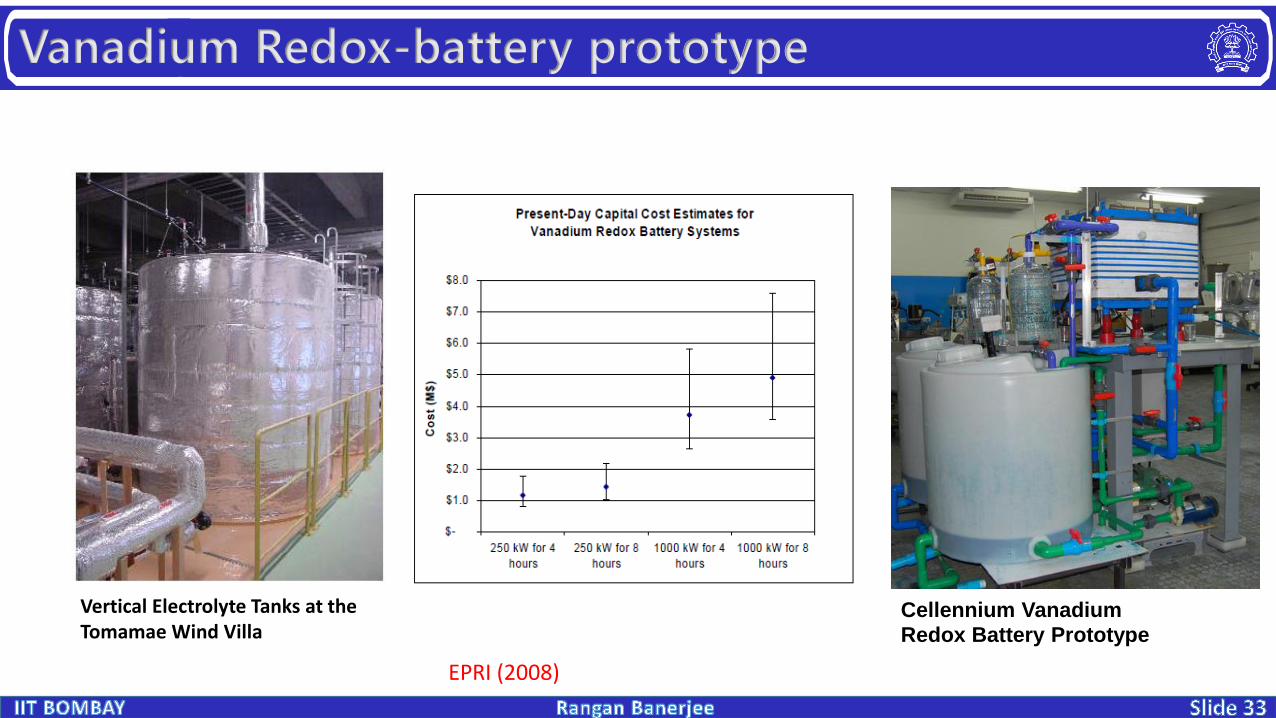
Vanadium Redox-battery prototype
Vertical Electrolyte Tanks at the Tomamae Wind Villa
Cellennium Vanadium
Redox Battery Prototype
EPRI (2008)

Research Needs
• Research Agenda for changing power system
• Improved forecasting techniques
• Access to public domain data
• Diversify Renewable supply Technology – CSP, Small hydro, Biomass
• Understand nature of demand, supply variability – effect of temperature, shifting peak periods – modify TOU
• DSM, DR – large scale pilots
• Cost effectiveness of Options – Least Cost Flexibility Plan, Capacity value decreases with higher renewable penetration
• Need for new methodologies – Hydro-Thermal- PV-Wind scheduling
• Academia – Power sector interface
• Indigenous Technology Development, Modelling and Analysis Capability
• Land, Water, Affordability
• Impact on Economy, Equity

References
• Flexibility in 21st Century Power Systems, NREL/TP-6A20-61721, May 2014.
• Ecofys (2014) Flexibility options in electricity systems, Geogios Papaefthymiou, K. Grave, K. Dragon, ECOFYS Germany GmbH, March 2014.
• U. Andreas (2014) Operational Flexibility in Electric Power systems, U. Andreas, Doctoral thesis, ETH Zurich Research Collection, 2014.
• EPRI (2008) https://www.epri.com/#/pages/product/1014836/ (last accessed April 17, 2018)
• SEI (2011) SEI TECHNICAL REVIEW · NUMBER 73 · OCTOBER 2011, http://global-sei.com/technology/tr/bn73/pdf/73-01.pdf (last accessed April 17, 2018)
• Bokoport - http://www.pennenergy.com/articles/pennenergy/2017/12/south-africa-s-bokpoort-csp-celebrates-another-solar-power-production-milestone.html (last accessed April 17, 2018)
• Andasol 3 - F. Dintera,*, D. Mayorga Gonzalez, Operability, reliability and economic benefits of CSP with thermal energy storage: first year of operation of ANDASOL 3, Proceedings of SolarPACES 2013.
• India's Journey towards 175 GW Renewables by 2022, Ashwin Gambhir, Rohil Jethmalani, Jatin Sarode, Nikita Das, Shantanu Dixit, November 2016.
Acknowledgement: Jani Das, Aishwarya Iyer, Ajit Paul, Nikhil Salunkhe, Pankaj Kumar, Balkrishna Surve,Karthik Ganesan (CEEW), Sandeep Chittora (Siemens) Thank You
Email: [email protected], [email protected]