Embed Size (px)
Citation preview
RENAULT SA – page 1
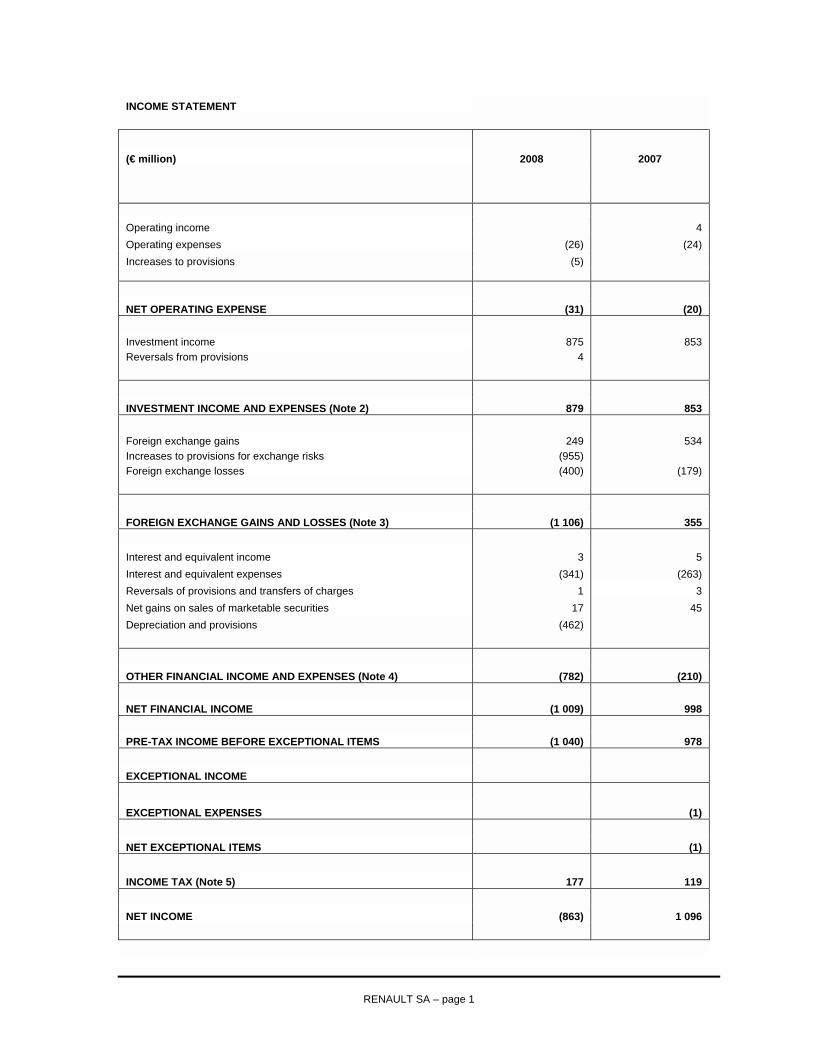
INCOME STATEMENT
(€ million) 2008 2007
Operating income 4 Operating expenses (26) (24) Increases to provisions (5) NET OPERATING EXPENSE (31) (20) Investment income 875 853 Reversals from provisions 4
INVESTMENT INCOME AND EXPENSES (Note 2) 879 853 Foreign exchange gains 249 534 Increases to provisions for exchange risks (955) Foreign exchange losses (400) (179) FOREIGN EXCHANGE GAINS AND LOSSES (Note 3) (1 106) 355 Interest and equivalent income 3 5 Interest and equivalent expenses (341) (263) Reversals of provisions and transfers of charges 1 3 Net gains on sales of marketable securities 17 45 Depreciation and provisions (462) OTHER FINANCIAL INCOME AND EXPENSES (Note 4) (782) (210) NET FINANCIAL INCOME (1 009) 998 PRE-TAX INCOME BEFORE EXCEPTIONAL ITEMS (1 040) 978 EXCEPTIONAL INCOME
EXCEPTIONAL EXPENSES (1) NET EXCEPTIONAL ITEMS (1) INCOME TAX (Note 5) 177 119 NET INCOME (863) 1 096

RENAULT SA – page 2
BALANCE SHEET
2008 2007 Depreciation ASSETS (€ million) Gross amortisation Net Net & provisions Investments stated at equity (Note 6) 7 459 7 459 8 490 Investment in Nissan Motor (Note 6) 6 413 0 6 413 6 413 Other investments (Note 6) 376 310 66 232 Advances to subsidiaries and affiliates (Note 7) 11 801 14 11 787 9 648 FINANCIAL ASSETS 26 049 324 25 725 24 784
TOTAL FIXED ASSETS 26 049 324 25 725 24 784 RECEIVABLES 18 18 15 MARKETABLE SECURITIES (Note 8) 251 163 88 582 CASH AND CASH EQUIVALENTS 2 2 9 OTHER ASSETS (Note 9) 363 363 35 TOTAL ASSETS 26 683 487 26 196 25 425
RENAULT SA – page 3
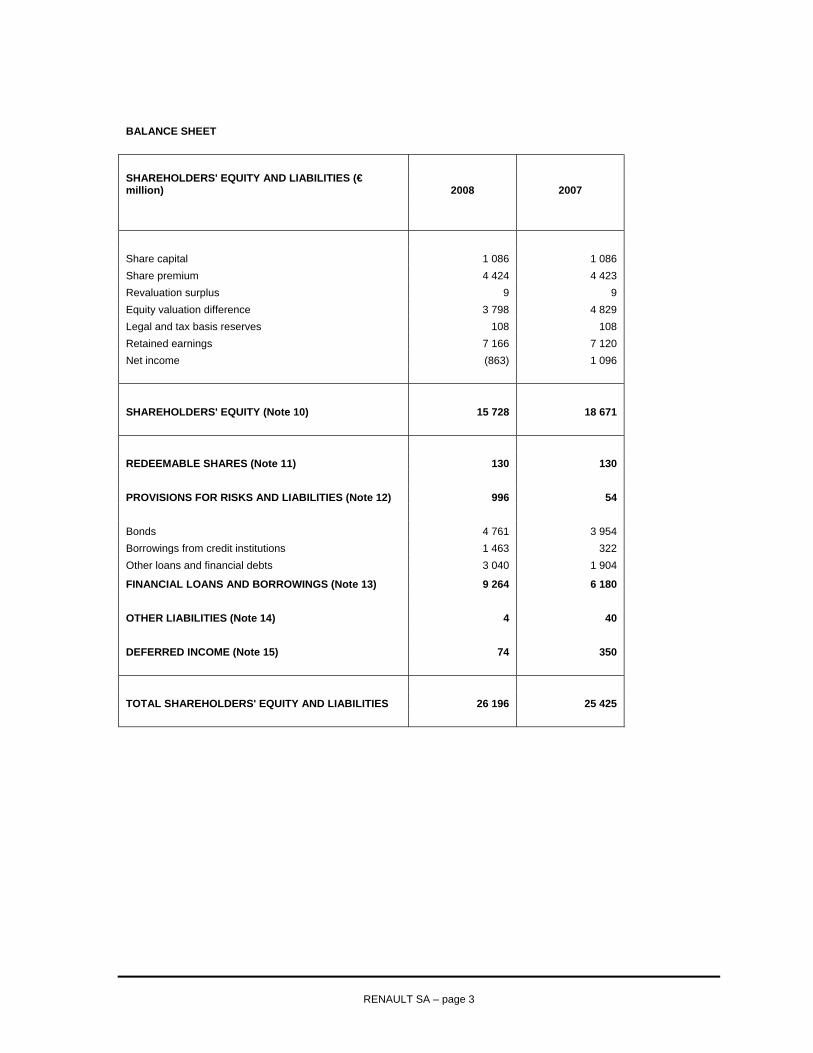
BALANCE SHEET
SHAREHOLDERS' EQUITY AND LIABILITIES (€ million) 2008 2007 Share capital 1 086 1 086 Share premium 4 424 4 423 Revaluation surplus 9 9 Equity valuation difference 3 798 4 829 Legal and tax basis reserves 108 108 Retained earnings 7 166 7 120 Net income (863) 1 096 SHAREHOLDERS' EQUITY (Note 10) 15 728 18 671
REDEEMABLE SHARES (Note 11) 130 130 PROVISIONS FOR RISKS AND LIABILITIES (Note 12) 996 54 Bonds 4 761 3 954 Borrowings from credit institutions 1 463 322 Other loans and financial debts 3 040 1 904
FINANCIAL LOANS AND BORROWINGS (Note 13) 9 264 6 180 OTHER LIABILITIES (Note 14) 4 40 DEFERRED INCOME (Note 15) 74 350 TOTAL SHAREHOLDERS' EQUITY AND LIABILITIES 26 196 25 425

RENAULT SA – page 4
STATEMENT OF CHANGES IN CASH (€ million) 2008 2007 Cash flow (Note 19) 554 1 064 Change in working capital requirements (49) 9 Cash flow from operating activities 505 1 073 Net decrease (increase) in other investments 231 (232) Net decrease (increase) in loans (2 143) (128) Net decrease (increase) in marketable securities (31) 620 Cash flow from investing activities (1 943) 260 Bond issues 682 588 Bond redemptions (435) (597) Net increase (decrease) in other interest-bearing borrowings 2 222 (492) Dividends paid to shareholders (1 049) (863) Bond redemption premiums (19) Cash flow from financing activities 1 401 (1 364) Cash and cash equivalents: opening balance (1) 30 Increase (decrease) in cash and cash equivalents (37) (31) Cash and cash equivalents: closing balance (38) (1)
RENAULT SA – page 5
NOTES TO THE FINANCIAL
STATEMENTS
1. ACCOUNTING POLICIES Renault SA draws up its accounts in accordance with French law and accounting regulations. The annual financial statements are presented using French chart of accounts 99-03 of April 29, 1999, amended by CRC (Comité de la Règlementation Comptable) regulations.
The following methods were applied in valuing balance sheet and income statement items:
A - NET FINANCIAL INCOME
The net financial income comprises interest income and expenses related to Renault SA’s indebtedness and short-term investment activities. Financial expenses correspond to charges payable on borrowing sources, which depend on the level of indebtedness and interest rates. Financial income includes gains on short-term investments (marketable securities, loans) and dividends received. The net financial income includes realised foreign exchange gains and losses.
B - NET EXCEPTIONAL ITEMS
Exceptional items are revenues and expenses resulting from events or transactions that are clearly distinct from the company’s normal business operations, and are not expected to recur on a frequent or regular basis.
C - INVESTMENTS
As allowed by CNC (Conseil National de la Comptabilité) avis N°34 (July 1988), as an alternative to the standard valuation method for investments carried in the balance sheet, Renault SA has opted to state investments in wholly-controlled companies at equity:
• this method is applied to all fully consolidated companies, • the shareholders’ equity of these companies is determined under the accounting policies applied in the consolidated
financial statements; as this is a valuation method, intercompany eliminations are not taken into account, • in valuing a subsidiary, its holdings in companies wholly controlled by the Group are valued in the same way, • the change during the year in the overall percentage of shareholders' equity corresponding to these interests is not
an income or loss item; it is included in shareholders' equity under "equity valuation difference". This amount cannot be distributed or used to offset losses. When it is negative, a provision for general depreciation is established as a charge against income.
Investments in companies not wholly controlled by Renault SA are valued at acquisition cost, less related expenses, or at their book value if this is lower. Provisions are established when the book value of the investments is lower than the gross value. The book value takes account of profitability and commercial prospects, and the share of net assets.
Other investments include treasury shares acquired for the purposes of share subscription option plans.

RENAULT SA – page 6
D - ADVANCES TO SUBSIDIARIES AND AFFILIATES
Loans to related companies and advances to subsidiaries and affiliates are recorded at historical cost. Impairment is recognised when there is a probability that these loans will not be recovered.
E - MARKETABLE SECURITIES
Marketable securities are valued at acquisition cost, excluding related expenses and accrued interest for bonds, or at market value if this is lower.
Treasury shares held for the purposes of stock option plans awarded to Group managers and executives are recorded in marketable securities at the lower of purchase price and stock market price. A provision equivalent to the difference is established where relevant. An additional provision for risks and liabilities is established when the option exercise price falls below the net book value.
F - LOAN COSTS AND ISSUANCE EXPENSES
Loan costs, including issuance expenses, and bond redemption premiums are amortised over the corresponding duration.
G - TRANSLATION OF FOREIGN CURRENCY RECEIVABLES AND LIABILITIES
Receivables and liabilities denominated in foreign currencies are translated as follows:
• all receivables and liabilities in foreign currencies are converted at the year-end exchange rate, • exchange differences arising between the date of transactions and December 31 are recorded in Other assets
and Deferred income (translation adjustment), • a provision for risk equal to the unrealised exchange losses is established as follows:
- a foreign exchange position is determined for each currency and term, based on balance sheet items stated in foreign currencies and derivatives entered into to hedge foreign exchange risks;
- unrealised foreign exchange gains are netted against unrealised foreign exchange losses with a similar term in the same currency;
- any residual unrealised foreign exchange losses by currency and term are recognised.
H - PROVISIONS FOR RISKS AND LIABILITIES
Provisions for risks and liabilities are established for obligations that are probable or definite at year-end. A contingent liability is an obligation that is neither probable nor definite at the date the financial statements are established, or a probable obligation for which expenditure of resources is not probable. Provisions are not established for contingent liabilities, but an off-balance sheet commitment is reported where relevant.
I - DERIVATIVES
Gains and losses on derivatives designated as hedges are recorded in the income statement in the same way as the revenues and expenses relating to the hedged item.
Derivatives not designated as hedges are adjusted to fair value at each closing date. Any resulting unrealised loss is recognised in the income statement, while in application of the conservatism principle, unrealised gains are not taken to income.
The fair value of forward exchange contracts is based on market conditions. The fair value of currency swaps is determined by discounting future cash flows, using closing-date market rates (exchange and interest rates). The fair value of interest rate derivatives is the amount the Group would receive (or pay) to settle outstanding contracts at the closing date, taking year-end market conditions into consideration.

RENAULT SA – page 7
2. INVESTMENT INCOME AND EXPENSES Details are as follows:
(€ million) 2008 2007
Dividends received from Nissan Motor Co Ltd 418 456 Dividends received from Sofasa 5 4 Interest on loans 452 393 Increases/Reversals from provisions related to subsidiaries and affiliates 4 TOTAL 879 853
Interest on loans breaks down as follows:
(€ million) 2008 2007 Interest on loans RENAULT s.a.s. 209 93 RENAULT FINANCE 46 100 SNC RENAULT CLEON 23 24 COGERA 23 20 PÔLES RFA 21 20 SNC RENAULT SANDOUVILLE 19 19 SNC RENAULT DOUAI 17 14 MAUBEUGE CONSTRUCTION AUTOMOBILE 16 13 SNC RENAULT FLINS 14 16 AUTO CHASSIS INTERNATIONAL 11 17 SOVAB 9 6 COFAL 6 4 ACI VILLEURBANNE 5 4 EMBOUTISSAGE TOLERIE GENNEVILLIERS 5 4 RENAULT BRUSSEL 4 2 RDIC 3 10 SIMCRA 3 3 SIRHA 2 2 SCI du Plateau de Guyancourt 2 SOCIETE NOUVELLE DE ROULEMENTS 1 4 SOCIETE DE TRANSMISSIONS AUTOMATIQUES 1 1 TEI 1 1 RENAULT UK 1 1 RENAULT WIEN 1 1 RENAULT AMSTERDAM 1 RENAULT IRELAND 1 FONDERIE DE NORMANDIE 1 RENAULT FORMULE 1 1 3 REAGROUP ESTATE POLSKA 1 RENAULT SPORT 1 1 SOCIETE CABLAGE DE L'OISE 1 1 OTHER COMPANIES 4 9 TOTAL 452 393
RENAULT SA – page 8
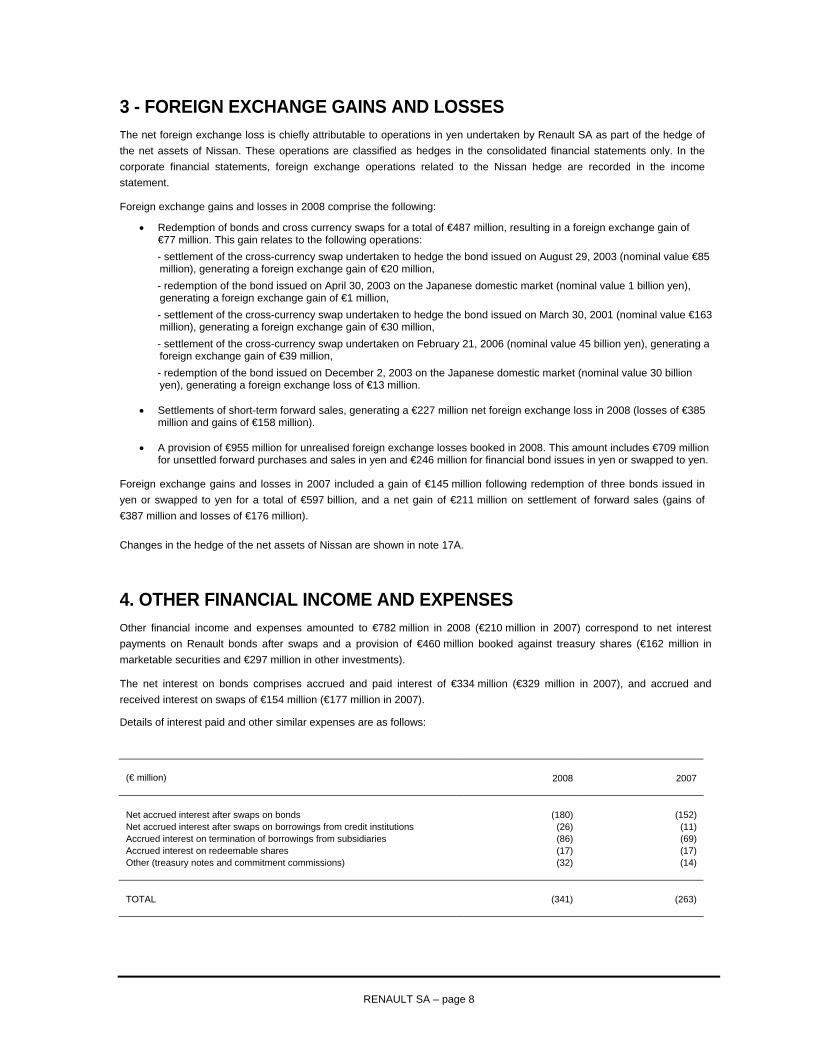
3 - FOREIGN EXCHANGE GAINS AND LOSSES The net foreign exchange loss is chiefly attributable to operations in yen undertaken by Renault SA as part of the hedge of the net assets of Nissan. These operations are classified as hedges in the consolidated financial statements only. In the corporate financial statements, foreign exchange operations related to the Nissan hedge are recorded in the income statement.
Foreign exchange gains and losses in 2008 comprise the following:
• Redemption of bonds and cross currency swaps for a total of €487 million, resulting in a foreign exchange gain of €77 million. This gain relates to the following operations:
- settlement of the cross-currency swap undertaken to hedge the bond issued on August 29, 2003 (nominal value €85 million), generating a foreign exchange gain of €20 million,
- redemption of the bond issued on April 30, 2003 on the Japanese domestic market (nominal value 1 billion yen), generating a foreign exchange gain of €1 million,
- settlement of the cross-currency swap undertaken to hedge the bond issued on March 30, 2001 (nominal value €163 million), generating a foreign exchange gain of €30 million,
- settlement of the cross-currency swap undertaken on February 21, 2006 (nominal value 45 billion yen), generating a foreign exchange gain of €39 million,
- redemption of the bond issued on December 2, 2003 on the Japanese domestic market (nominal value 30 billion yen), generating a foreign exchange loss of €13 million.
• Settlements of short-term forward sales, generating a €227 million net foreign exchange loss in 2008 (losses of €385 million and gains of €158 million).
• A provision of €955 million for unrealised foreign exchange losses booked in 2008. This amount includes €709 million
for unsettled forward purchases and sales in yen and €246 million for financial bond issues in yen or swapped to yen.
Foreign exchange gains and losses in 2007 included a gain of €145 million following redemption of three bonds issued in yen or swapped to yen for a total of €597 billion, and a net gain of €211 million on settlement of forward sales (gains of €387 million and losses of €176 million).
Changes in the hedge of the net assets of Nissan are shown in note 17A.
4. OTHER FINANCIAL INCOME AND EXPENSES Other financial income and expenses amounted to €782 million in 2008 (€210 million in 2007) correspond to net interest payments on Renault bonds after swaps and a provision of €460 million booked against treasury shares (€162 million in marketable securities and €297 million in other investments).
The net interest on bonds comprises accrued and paid interest of €334 million (€329 million in 2007), and accrued and received interest on swaps of €154 million (€177 million in 2007).
Details of interest paid and other similar expenses are as follows:
(€ million) 2008 2007 Net accrued interest after swaps on bonds (180) (152) Net accrued interest after swaps on borrowings from credit institutions (26) (11) Accrued interest on termination of borrowings from subsidiaries (86) (69) Accrued interest on redeemable shares (17) (17) Other (treasury notes and commitment commissions) (32) (14) TOTAL (341) (263)
RENAULT SA – page 9
In 2008, the €180 million of interest payable or paid, after swaps, mainly comprise:
• €73 million on the swapped bond issued on June 26, 2002, • €28 million on the swapped bond issued on May 24, 2006, • €26 million on the swapped bond issued on April 16, 2007, • €8 million on the swapped bond issued on May 28, 2003,
The net interest receivable on the swapped portion of bonds amounted to €18 million: €185 million on the paying leg and €167 million on the receiving leg.
In 2007, the €152 million of interest payable or paid, after swaps, included €65 million on the swapped bond issued on June 26, 2002.
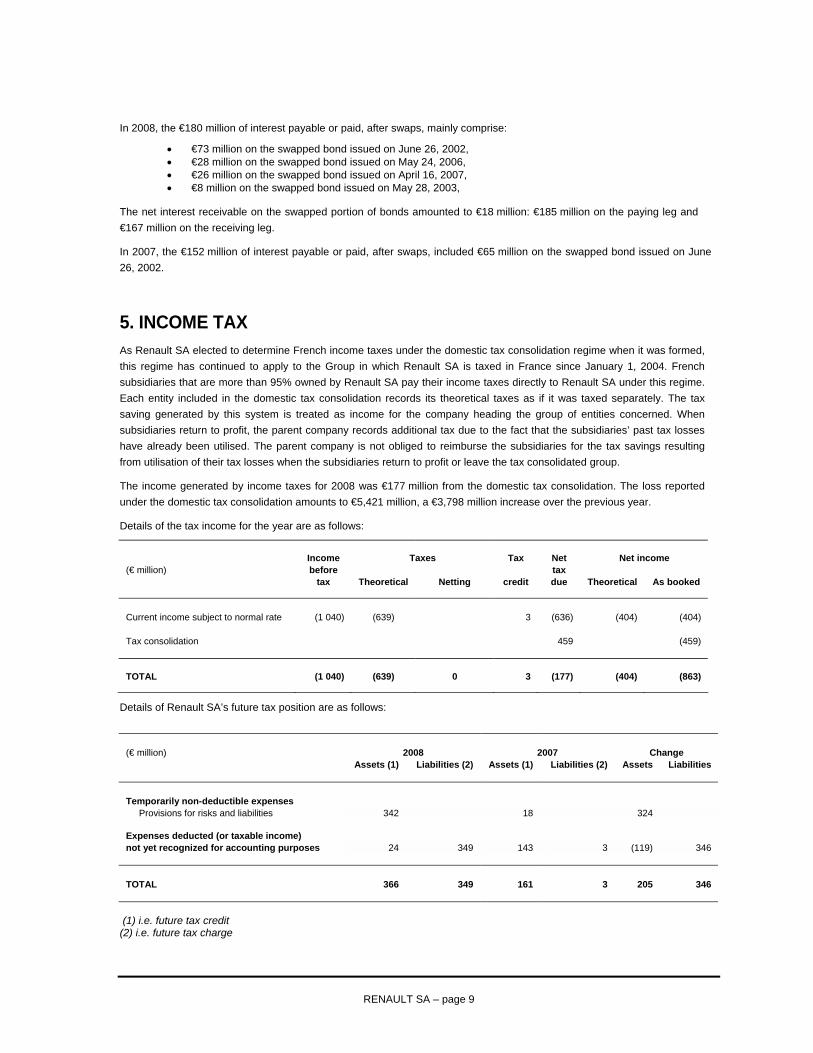
5. INCOME TAX As Renault SA elected to determine French income taxes under the domestic tax consolidation regime when it was formed, this regime has continued to apply to the Group in which Renault SA is taxed in France since January 1, 2004. French subsidiaries that are more than 95% owned by Renault SA pay their income taxes directly to Renault SA under this regime. Each entity included in the domestic tax consolidation records its theoretical taxes as if it was taxed separately. The tax saving generated by this system is treated as income for the company heading the group of entities concerned. When subsidiaries return to profit, the parent company records additional tax due to the fact that the subsidiaries’ past tax losses have already been utilised. The parent company is not obliged to reimburse the subsidiaries for the tax savings resulting from utilisation of their tax losses when the subsidiaries return to profit or leave the tax consolidated group.
The income generated by income taxes for 2008 was €177 million from the domestic tax consolidation. The loss reported under the domestic tax consolidation amounts to €5,421 million, a €3,798 million increase over the previous year.
Details of the tax income for the year are as follows:
Income Taxes Tax Net Net income (€ million) before tax tax Theoretical Netting credit due Theoretical As booked Current income subject to normal rate (1 040) (639) 3 (636) (404) (404) Tax consolidation 459 (459) TOTAL (1 040) (639) 0 3 (177) (404) (863)
Details of Renault SA’s future tax position are as follows:
(€ million) 2008 2007 Change Assets (1) Liabilities (2) Assets (1) Liabilities (2) Assets Liabilities Temporarily non-deductible expenses Provisions for risks and liabilities 342 18 324 Expenses deducted (or taxable income) not yet recognized for accounting purposes 24 349 143 3 (119) 346 TOTAL 366 349 161 3 205 346
(1) i.e. future tax credit (2) i.e. future tax charge

RENAULT SA – page 10
6. INVESTMENTS Changes during the year were as follows:
(€ million) At start of year Change over the year At year-end
Investments stated at equity 8 490 (1 031) 7 459
Investment in Nissan Motor Co. Ltd. 6 413 6 413
Other investments 245 131 376
Provisions on other investments (13) (297) (310) TOTAL 15 135 (1 197) 13 938
The €1 031 million change during the year in investments stated at equity is taken to shareholders’ equity (see note 11). No new investments or disposals took place in 2008.
The €131 million increase in other investments corresponds to purchases of 1 618 000 treasury shares. Impairment of €297 million, based on the average of the 20 last stock market prices, was recorded at December 31, 2008 in view of the significant decline in the Renault share price.
7. ADVANCES TO SUBSIDIARIES AND AFFILIATES Changes during the year were as follows:
(€ million) At start of year Increases Decreases At year-end
Capitalisable advances 5 5 Dividends receivable 3 3 Loans 9 642 5 123 (2 972) 11 793
Total before provisions (1) 9 647 5 126 (2 972) 11 801 Provisions (5) (9) (14) Net total 9 642 5 117 (2 972) 11 787 (1) Current portion (less than one year) 9 549 5 122 (2 965) 11 706 Long-term portion (over 1 year) 98 4 (7) 95
Advances to subsidiaries and affiliates include:
• €238 million in short-term investments with Group finance companies as part of the Group’s cash management programme (€1,785 million in 2007);

RENAULT SA – page 11
• €25 million in long-term loans to Renault s.a.s. (identical to 2007); • €11,530 million in current accounts resulting from centralised cash management agreements with Group
subsidiaries (€7,832 million in 2007). A reorganisation of cash flow management was set up in 2008. Henceforth, Euro cash management is centralised by Renault SA via internal accounts with the subsidiaries which are pooled in other accounts opened with non-group banks.

RENAULT SA – page 12
Details of the “loans” (€11,793 million) are as follows:
(€ million) Dec 31, 2008 Dec 31, 2007 Increases
2008 / 2007 Decreases 2008 / 2007
Renault SAS 7 751 3 040 4 711 SNC Renault Cléon 481 556 (75) Cogéra 450 450 SNC Renault Douai 432 337 95 SNC Renault Sandouville 364 465 (101) Maubeuge Construction Automobile 364 331 33 SNC Renault Flins 303 348 (45) Pôles RFA and former French sales companies 265 366 14 (115) Renault Finance 238 1 745 (1 507) Auto Chassis International 204 374 (170) SOVAB 201 156 45 COFAL 131 104 27 ACI Villeurbanne 115 106 9 Renault Brussels 65 48 17 SIMCRA 64 61 3 SIRHA 50 57 (7) Renault Nissan Deutsche AG 31 31 Société de Transmissions Automatiques 27 25 2 Renault Sport 26 18 8 Renault s.a.s. 25 25 Fonderie de Normandie 23 23 TEI 22 26 (4) Renault Irlande 19 19 Renault Wien 18 17 1 Renault Amsterdam 12 13 (1) Renault Alpine 12 12 Immo Réa Polska 10 11 (1) Renault Mexico 10 10 Valin 8 1 8 (1) Emboutissage Tôlerie Gennevilliers 8 107 8 (107) Car life 8 8 8 (8) Renault Luxembourg 7 15 (8) Renault Industrie Belgique 7 5 2 SRAC (China) USD 7 6 1 Française de Mécanique 6 6 Renault Italia spa 6 6 SAGA 5 5 5 (5) Renault Retail Group Estate Deutschland 4 4 0 SCI Parc industriel Le Mans 3 5 (2) RRG Allemagne 2 2 Somac 2 2 Société Câblage de l'Oise 1 24 (23) Auto Veeneman 1 1 IDVU 0 0 RDIC 245 (245) Sci du Plateau de Guyancourt 233 (233) Société Nouvelle de Roulements 96 14 (110) Renault UK 60 (60) Renault formula 1 ltd 41 (41) SFF 40 (40) ACI Valladolid 26 (26) Renault Antwerpen 16 (16) Sofrastock 7 (7) Renault Retail Group Estate CZ S.R.O 3 (3) Renault Hungarian alliance logistique 1 (1) Other companies 4 8 7 (12) TOTAL 11 793 9 642 5 123 (2 972)

RENAULT SA – page 13
8. MARKETABLE SECURITIES
In 2007, Renault SA invested its cash surpluses in coherence with the Group's aim to develop a more active cash investment policy. Investments in monetary investment funds were carried out with a view to achieving close to Eonia returns while retaining perfect liquidity. These short-term investment securities met strict risk control requirements such as capital guarantees, and no foreign exchange or liquidity risk was accepted.
In 2008, Renault SA sold its entire investment fund portfolio at a value of €314 million. All surpluses were invested daily to guarantee the Group's liquidity in an environment marked by falling cash surpluses and heightened market volatility.
Marketable securities only include €251 million for Renault SA’s treasury shares, against which impairment of €163 million has been booked.
In 2007, marketable securities included €314 million of investment funds and €371 million of treasury shares held for the purposes of stock option plans.
Changes in treasury shares were as follows:
At start of year Options exercised Early exercise of
share subscription options
At year-end
Number of shares 5 414 989 384 441 11 000 5 019 548
Value (€ million) 268 17 251 Impairment (163) TOTAL 88
9. OTHER ASSETS The major item included in Other assets is the €24 million payment made in connection with the Calyon loan (€26 million at December 31, 2007). For the purposes of the 1%-rate housing loan financing operation introduced in 2004, Renault contracted a loan from Calyon with nominal value of €112 million, bearing interest at the floating rate of 6-month Euribor + 0.67%, terminating on December 31, 2019. An interest rate swap was undertaken to convert this to a fixed rate of approximately 0.13%, and Renault SA also paid a sum of €33 million corresponding to the discounted interest differential recorded over the duration of the operation. This payment is amortised over the duration of the loan (15 years) at the same rate as the interest paid on the debt.
Other assets include €313 million of translation adjustments resulting from unrealised foreign exchange losses on bonds issued in or swapped to yen as a partial hedge of the investment in Nissan.

RENAULT SA – page 14
10. SHAREHOLDERS' EQUITY Changes in shareholders' equity were as follows:
(€ million) Balance at start of year
Allocation of 2007 net income
Dividends 2008 net income Other Balance at
year-end
Share capital 1 086 1 086 Share premium 4 423 4 423 Revaluation surplus 9 9 Equity valuation difference 4 829 (1 031) 3 798 Legal and tax basis reserves 108 108 Retained earnings 7 119 1 096 (1 049) 7 166 Net income 1 096 (1 096) (863) (863) TOTAL 18 671 0 (1 049) (863) (1 031) 15 728
At the General Shareholders’ Meeting of April 29, 2008, it was decided to allocate the net income for 2007 as follows: €1,083 million (€3.80 per share) to distribution of dividends, including €34 million of non-distributable funds attached to treasury shares, and €47 million to retained earnings.
Non-distributable reserves amounted to €3,915 million at December 31, 2008.
A total of €612 million of reserves corresponds to the treasury share accounts.
Renault SA's shareholding structure was as follows at December 31, 2008:
Ownership structure Voting rights
Number of shares held % of capital Number %
French state 42 759 571 15,01% 42 759 571 18,32% Employees 9 530 004 3,34% 9 530 004 4,08% Treasury shares 8 773 698 3,08% Nissan 42 740 568 15,00% Other 181 133 277 63,57% 181 133 277 77,60% TOTAL 284 937 118 100% 233 422 852 100%
The par value of a Renault SA share is €3.81.
11. REDEEMABLE SHARES These shares, issued in October 1983 and April 1984 by Renault SA, can be redeemed with a premium on the sole initiative of Renault SA. They earn a minimum annual return of 9% comprising a fixed portion (6.75%) and a variable portion that depends on consolidated revenues and is calculated based on identical structure and methods.
In March and April 2004, Renault made a cash tender offer to buy back its redeemable shares at €450 per share, representing a 21% premium over market price. This operation generated a loss of €343 million.

RENAULT SA – page 15
797,659 redeemable shares remained on the market at December 31, 2008, with an average weighted cost of €158.93 each or a total of €130 million including accrued interest. These shares are listed on the Paris Bourse, and closed at €236 on December 31, 2008 for par value of €153 (€874 on December 31, 2007).
The 2008 return on redeemable shares, amounting to €17 million (identical to 2007), is included in interest expenses.
12. PROVISIONS FOR RISKS AND LIABILITIES Provisions for risks and liabilities break down as follows:
(€ million) 2007 Increases Reversals 2008 Sirha 1% housing loan 20 (2) 18 China SRAC SANJIANG 33 (11) 22 Risk on treasury shares 1 1 Foreign exchange losses 0 955 955 TOTAL 54 955 (13) 996 Current (less than 1 year) 33 (11) 22 Long-term (over 1 year) 21 955 (2) 974
All known litigation in which Renault SA is involved is examined at year-end. After seeking the opinion of legal and tax advisors, the provisions deemed necessary are, where appropriate, established to cover the estimated risk.
13. FINANCIAL LOANS AND BORROWINGS A. BONDS
The principal changes in bonds over 2008 were as follows:
• issuance on January 23, 2008 on the Japanese market of a 3-year bond with total nominal value of 12,5 billion yen, at the floating rate of 6-month Libor +0.80%,
• issuance on January 23, 2008 on the Japanese market of a 3-year bond with total nominal value of 32.5 billion yen,
at the fixed rate of 1.70%, • issuance on January 23, 2008 on the Japanese market of a 5-year bond with total nominal value of 5 billion yen, at
the fixed rate of 2.09%, • issuance on April 16, 2008 of a 5-year bond with total nominal value of €300 million, at the fixed rate of 4.375%, • issuance on December 9, 2008 of a 5-year bond with total nominal value of 7 billion yen, at the floating rate of 3-
month Libor +3.2%, • redemption of the April 30, 2003 5-year bond issue totalling 1 billion yen at the fixed rate of 1.013%, • redemption of the June 26, 2003 5-year bond issue totalling €85 million at the floating rate of 6-month Euribor +
0.76% (swapped to yens with a fixed rate of 0.715%%), • redemption of the October 27, 2003 5-year bond issue totalling €65 million at the floating rate of 6-month Euribor +
1% (swapped to a fixed rate of 4.25375%),

RENAULT SA – page 16
• redemption of the November 14, 2003 5-year bond issue totalling €35 million at the floating rate of 6-month Euribor +1% (swapped to a fixed rate of 4.2675%),
• redemption of the November 18, 2003 5-year bond issue totalling €10 million at the floating rate of 6-month Euribor
+0.57% (swapped to a fixed rate of 4.41%), • redemption of the December 2, 2003 5-year bond issue totalling 30 billion yen at the fixed rate of 1.23%.
Breakdown by maturity
December 31, 2008 (€ million) Total - 1 yr 1 to 2 yrs 2 to 3 yrs 3 to 4 yrs 4 to 5 yrs + 5 yrs 2002 1 000 1 000 2003 855 814 41 2004 326 276 50 2005 277 198 79 2006 924 396 500 28 2007 603 16 524 63 2008 752 357 395 Accrued interest 24 24 TOTAL 4 761 1 300 1 028 803 603 895 132
December 31, 2007 (€ million) Total - 1 yr 1 to 2 yrs 2 to 3 yrs 3 to 4 yrs 4 to 5 yrs + 5 yrs 2002 1 000 1 000 2003 1 031 365 625 41 2004 278 228 50 2005 213 152 61 2006 831 303 528 2007 588 12 519 57 Intérêts courus 13 13 TOTAL 3 954 378 1 228 789 353 580 626

RENAULT SA – page 17
Breakdown by currency
December 31, 2008 December 31, 2007 (€ million) before after before after derivatives derivatives derivatives derivatives Euro 3 362 2 567 3 044 2 370 Yen 1 399 2 194 910 1 584 TOTAL 4 761 4 761 3 954 3 954
Breakdown by interest rate
December 31, 2008 December 31, 2007 (€ million) after after derivatives derivatives Fixed rate 2 409 1 757 Floating rate 2 352 2 197 TOTAL 4 761 3 954
B. BORROWINGS FROM CREDIT INSTITUTIONS
Borrowings from credit institutions stood at €1,463 million at December 31, 2008 (€322 million in 2007), and are mainly contracted on the market.
The principal changes in bonds over 2008 were as follows:
• issuance on March 14, 2008 of a 6-year bond with total nominal value of €78 million, at the floating rate of 3-month Euribor + 1.20%, swapped to the floating rate of 3-month Euribor +0.66%.
• issuance on March 14, 2008 of a 6-year bond with total nominal value of €147 million, at the fixed rate of 4.80%,
swapped to the floating rate of 3-month Euribor+0.66%. • issuance on June 19, 2008 of a 5-year bond with total nominal value of €178 million, at the floating rate of 3-month
Euribor +1.10%. • issuance on June 19, 2008 of a 7-year bond with total nominal value of €42 million, at the floating rate of 3-month
Euribor +1.20%. • issuance on September 19, 2008 of a 3-year bond with total nominal value of €75 million, at the floating rate of 3-
month Euribor +1%. • issuance on December 5, 2008 of a 2-year bond with total nominal value of €150 million, at the floating rate of 3-
month Euribor +1.75%. • issuance on December 9, 2008 of a 2-year bond with total nominal value of 6 billion yen, at the fixed rate of 2.98%, • issuance on December 15, 2008 of a 4-year bond with total nominal value of 50 billion yen, at the fixed rate of
4.62%, • redemption of the March 30, 2001 7-year bond issue totalling €163 million, swapped to yen at the fixed rate of
2.65%.
Borrowings from credit institutions due after one year include short-term drawings on long-term credit lines (due after one year). They bear interest at market rates, and amounted to €475 million at December 31, 2008.
RENAULT SA – page 18
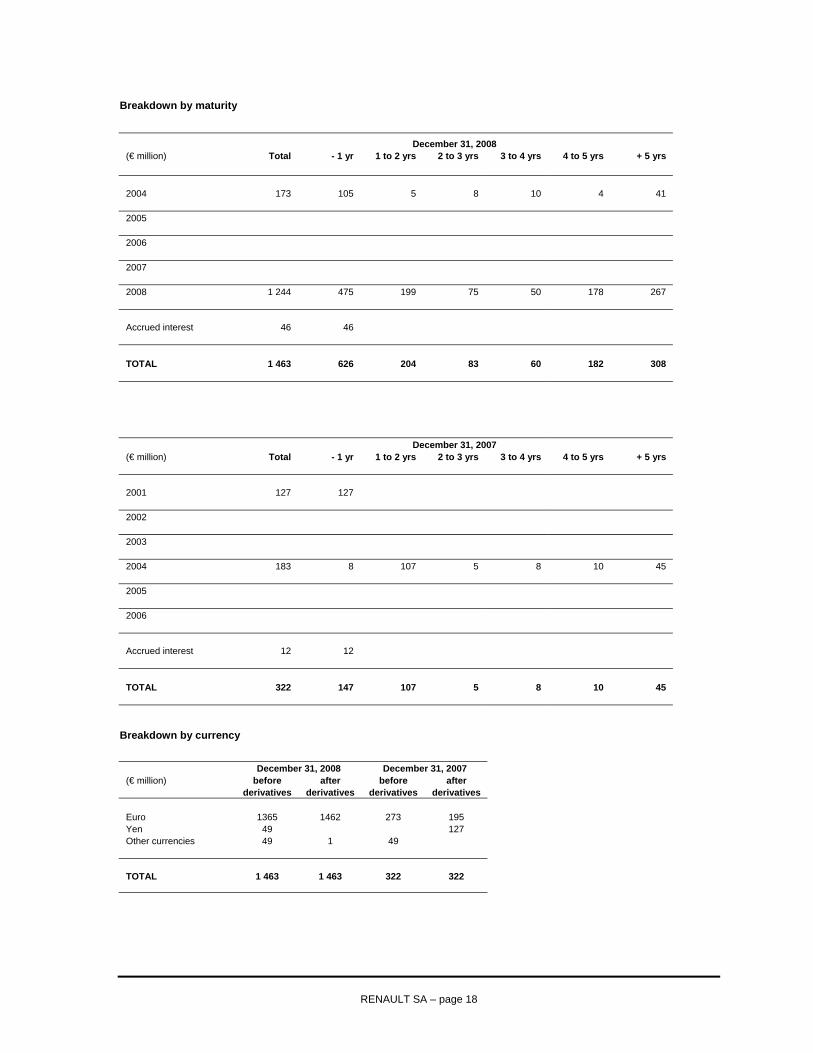
Breakdown by maturity
December 31, 2008 (€ million) Total - 1 yr 1 to 2 yrs 2 to 3 yrs 3 to 4 yrs 4 to 5 yrs + 5 yrs 2004 173 105 5 8 10 4 41 2005 2006 2007 2008 1 244 475 199 75 50 178 267 Accrued interest 46 46 TOTAL 1 463 626 204 83 60 182 308
December 31, 2007 (€ million) Total - 1 yr 1 to 2 yrs 2 to 3 yrs 3 to 4 yrs 4 to 5 yrs + 5 yrs 2001 127 127 2002 2003 2004 183 8 107 5 8 10 45 2005 2006 Accrued interest 12 12 TOTAL 322 147 107 5 8 10 45
Breakdown by currency
December 31, 2008 December 31, 2007 (€ million) before after before after derivatives derivatives derivatives derivatives Euro 1365 1462 273 195 Yen 49 127 Other currencies 49 1 49 TOTAL 1 463 1 463 322 322
RENAULT SA – page 19
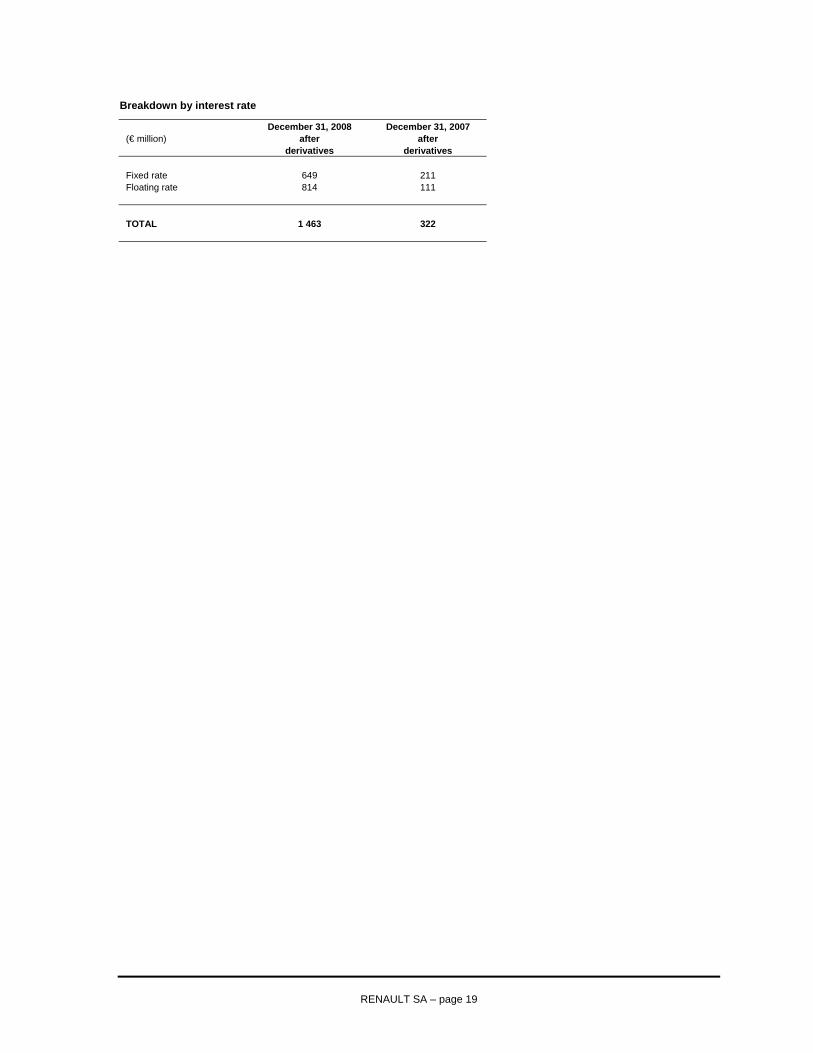
Breakdown by interest rate
December 31, 2008 December 31, 2007 (€ million) after after derivatives derivatives Fixed rate 649 211 Floating rate 814 111 TOTAL 1 463 322
RENAULT SA – page 20
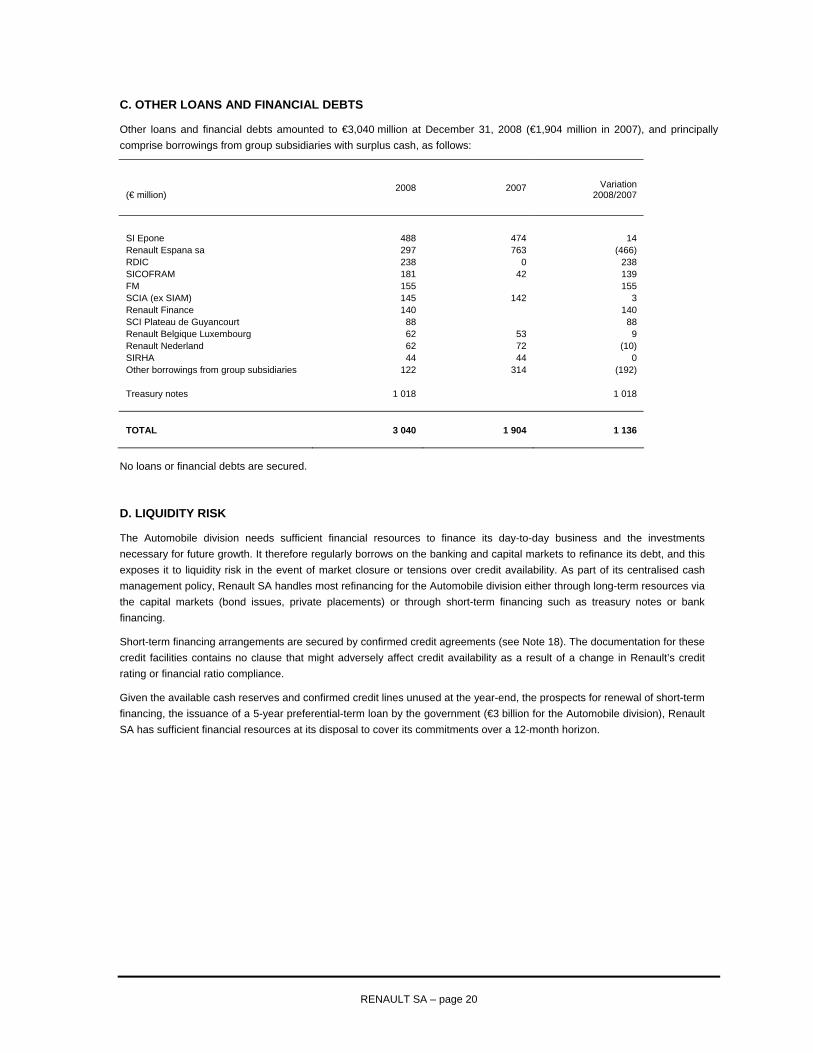
C. OTHER LOANS AND FINANCIAL DEBTS
Other loans and financial debts amounted to €3,040 million at December 31, 2008 (€1,904 million in 2007), and principally comprise borrowings from group subsidiaries with surplus cash, as follows:
(€ million) 2008 2007 Variation
2008/2007 SI Epone 488 474 14 Renault Espana sa 297 763 (466) RDIC 238 0 238 SICOFRAM 181 42 139 FM 155 155 SCIA (ex SIAM) 145 142 3 Renault Finance 140 140 SCI Plateau de Guyancourt 88 88 Renault Belgique Luxembourg 62 53 9 Renault Nederland 62 72 (10) SIRHA 44 44 0 Other borrowings from group subsidiaries 122 314 (192) Treasury notes 1 018 1 018 TOTAL 3 040 1 904 1 136
No loans or financial debts are secured.
D. LIQUIDITY RISK
The Automobile division needs sufficient financial resources to finance its day-to-day business and the investments necessary for future growth. It therefore regularly borrows on the banking and capital markets to refinance its debt, and this exposes it to liquidity risk in the event of market closure or tensions over credit availability. As part of its centralised cash management policy, Renault SA handles most refinancing for the Automobile division either through long-term resources via the capital markets (bond issues, private placements) or through short-term financing such as treasury notes or bank financing.
Short-term financing arrangements are secured by confirmed credit agreements (see Note 18). The documentation for these credit facilities contains no clause that might adversely affect credit availability as a result of a change in Renault’s credit rating or financial ratio compliance.
Given the available cash reserves and confirmed credit lines unused at the year-end, the prospects for renewal of short-term financing, the issuance of a 5-year preferential-term loan by the government (€3 billion for the Automobile division), Renault SA has sufficient financial resources at its disposal to cover its commitments over a 12-month horizon.

RENAULT SA – page 21
14. OTHER LIABILITIES Changes in other liabilities were as follows:
(€ million) 2008 2007 Variation
2008 / 2007 Tax liabilities 4 40 (36) TOTAL 4 40 (36)
The €36 million reduction in other liabilities results from a €19 million decrease in tax liabilities and a €17 million decrease in the liability for taxes payable to subsidiaries under the French domestic tax consolidation system.
15. DEFERRED INCOME Deferred income mainly comprises unrealised foreign exchange gains on bond issues in yen or swapped to yen, totalling €68 million. These borrowings were subscribed as part of the hedge of the net assets of Nissan.
16. INFORMATION CONCERNING RELATED COMPANIES “Related companies” are all entities fully consolidated in the Group’s consolidated financial statements.
Income statement
2008 2007
(€ million) Total Related
companies Total Related companies
Interest on loans 452 443 393 390 Interest and equivalent expenses (341) (100) (263) (45) Reversals of provisions and transfers of charges 13 3
Balance sheet
2008 2007
(€ million) Total Related companies Total Related
companies Loans 11 793 11 709 9 649 9 577 Receivables 18 15 Cash and cash equivalents 2 9 6 Loans and financial debts 3 040 2 971 1 904 1 851 Other liabilities 24 40

RENAULT SA – page 22
17. FINANCIAL INSTRUMENTS A - MANAGEMENT OF EXCHANGE AND INTEREST RATE RISK
The corresponding commitments, expressed in terms of notional amount where appropriate, are shown below:
At December 31 2008 2007 (€ million) Foreign exchange risks Currency swaps Purchases 1 159 1 120 with Renault Finance 365 513 Sales 1 107 1 367 with Renault Finance 357 617 Other forward exchange contracts and options Purchases 4 522 3 174 with Renault Finance 4 522 3 174 Sales 5 225 3 149 with Renault Finance 5 225 3 149 Interest rate risks Interest rate swaps 2 428 2 569 with Renault Finance 2 312 2 282
Transactions undertaken to manage exchange rate exposure principally comprise currency swaps and forward sales of yen, with respectively total nominal value of €3,990 million (503 billion yen) at December 31, 2008 and €4,996 million (824 billion yen) at December 31, 2007. These operations form a partial hedge of Renault’s investment in Nissan’s net assets in yen.
They comprise 182 billion yen (€1,444 million) of bonds issued directly in yen, 100 billion yen (€793 million) of loans issued in Euro and swaped to yen, and 221 billion yen (€1,753 million) of forward sales.
Renault SA also carries out forward sales to hedge loans to subsidiaries denominated in foreign currencies with non-significant impact.
Renault SA carries most of the Group’s indebtedness. Its interest rate risk management policy applies two basic principles: long-term investments use fixed-rate financing, and investments for liquidity reserves use variable-rate financing. The financing in yen undertaken as part of the hedge of Nissan equity is fixed-rate, over terms varying from 1 month to 7 years.
Renault SA uses derivatives to implement the above interest rate and exchange risk management policies. Most of its operations on the forward markets are with Renault Finance, a wholly-owned Group subsidiary.
RENAULT SA – page 23
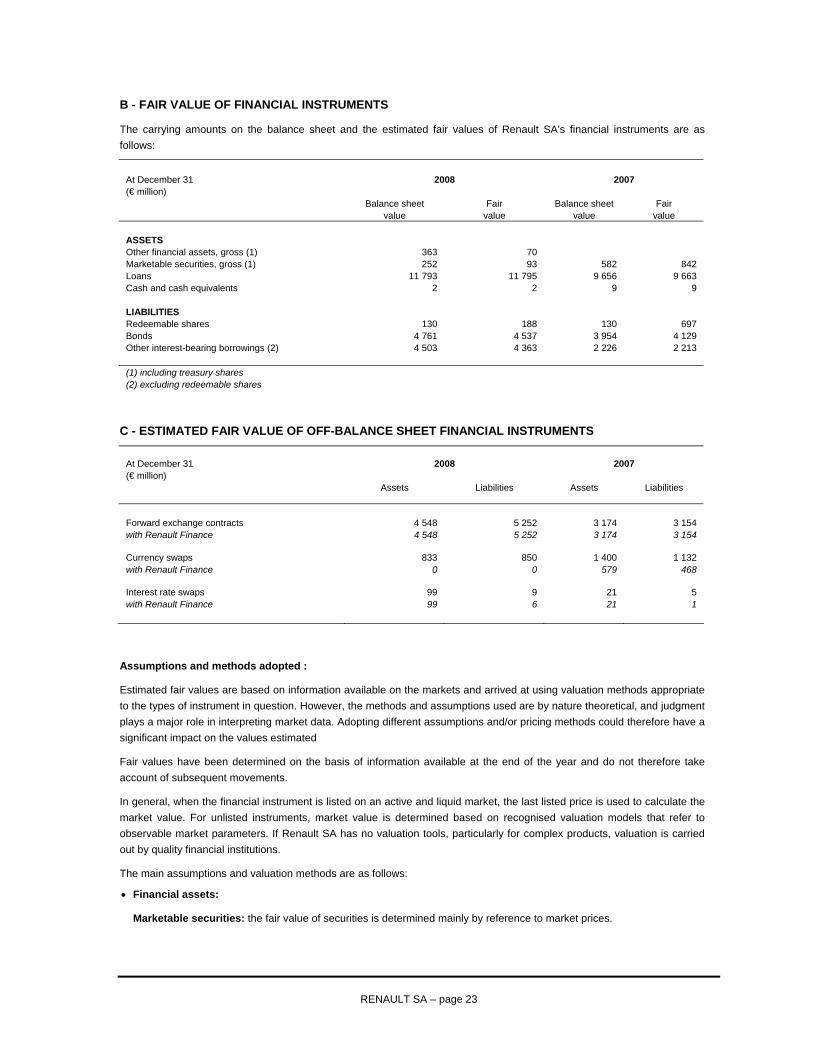
B - FAIR VALUE OF FINANCIAL INSTRUMENTS
The carrying amounts on the balance sheet and the estimated fair values of Renault SA's financial instruments are as follows:
At December 31 2008 2007 (€ million) Balance sheet Fair Balance sheet Fair value value value value ASSETS Other financial assets, gross (1) 363 70 Marketable securities, gross (1) 252 93 582 842 Loans 11 793 11 795 9 656 9 663 Cash and cash equivalents 2 2 9 9 LIABILITIES Redeemable shares 130 188 130 697 Bonds 4 761 4 537 3 954 4 129 Other interest-bearing borrowings (2) 4 503 4 363 2 226 2 213 (1) including treasury shares (2) excluding redeemable shares
C - ESTIMATED FAIR VALUE OF OFF-BALANCE SHEET FINANCIAL INSTRUMENTS At December 31 2008 2007 (€ million) Assets Liabilities Assets Liabilities Forward exchange contracts 4 548 5 252 3 174 3 154 with Renault Finance 4 548 5 252 3 174 3 154 Currency swaps 833 850 1 400 1 132 with Renault Finance 0 0 579 468 Interest rate swaps 99 9 21 5 with Renault Finance 99 6 21 1
Assumptions and methods adopted :
Estimated fair values are based on information available on the markets and arrived at using valuation methods appropriate to the types of instrument in question. However, the methods and assumptions used are by nature theoretical, and judgment plays a major role in interpreting market data. Adopting different assumptions and/or pricing methods could therefore have a significant impact on the values estimated
Fair values have been determined on the basis of information available at the end of the year and do not therefore take account of subsequent movements.
In general, when the financial instrument is listed on an active and liquid market, the last listed price is used to calculate the market value. For unlisted instruments, market value is determined based on recognised valuation models that refer to observable market parameters. If Renault SA has no valuation tools, particularly for complex products, valuation is carried out by quality financial institutions.
The main assumptions and valuation methods are as follows:
• Financial assets:
Marketable securities: the fair value of securities is determined mainly by reference to market prices.

RENAULT SA – page 24
Loans and advances to subsidiaries and affiliates: for loans with original maturity of less than three months, floating-rate loans and advances to subsidiaries and affiliates, the value recorded in the balance sheet is considered to be the fair value. Other fixed-rate loans have been measured by discounting future cash flows using the rates offered to Renault SA at December 31, 2008 and December 31, 2007 for loans with similar conditions and maturities.
• Liabilities: the fair value of financial liabilities is determined by discounting future cash flows at the rates offered to Renault SA at December 31, 2008 and December 31, 2007 for borrowings with similar conditions and maturities. The fair value of redeemable shares is based on their year-end stock market value. • Off-balance sheet foreign exchange instruments: the fair value of forward contracts is estimated on the basis of prevailing market conditions. The fair value of currency swaps is determined by discounting cash flows using exchange rates and interest rates prevailing at December 31, 2008 and December 31, 2007 for the contracts' residual terms. • Off-balance sheet interest rate instruments: the fair value of interest rate swaps represents the amount Renault would receive (or pay) if it settled outstanding contracts at the end of the year. Unrealised capital gains or losses, determined on the basis of prevailing interest rates and the quality of the counterparty to each contract, are taken into account at December 31, 2008 and December 31, 2007.
18. COMMITMENTS GIVEN AND RECEIVED Off-balance-sheet commitments are as follows:
2008 2007
(€ million) Total Concerning related
companies Total Concerning related companies
Commitments received Unused credit lines 3 904 202 4 677 205 TOTAL 3 904 202 4 677 205 Commitments given Guarantees and deposits 451 450 453 450 Unused credit lines 119 119 141 141
TOTAL 570 569 594 591 Financial commitments Forward currency sales 5 225 5 225 3 149 3 149 Forward currency purchases 4 522 4 522 3 174 3 174 Currency swaps: loan 1 107 357 1 367 617 Currency swaps: borrowing 1 159 365 1 120 513 Interest rate swaps 2 428 2 312 2 569 2 282
As part of the management of RCI Banque’s major risk ratio, Renault SA has provided Cogera (a fully-owned RCI Banque subsidiary) with a €450 million credit line since December 2004. For purposes of compliance with French Banking Commission requirements, Renault SA will only be reimbursed by Cogera to the extent of the amounts Cogera recovers from Renault Retail Group in repayment of its financing for inventories. Furthermore, to guarantee payment by Renault Retail Group to Cogera of the receivables resulting from this financing arrangement, Renault SA’s receivable related to the credit line is pledged in favour of Cogera. The value of this pledge at December 31, 2008 was €450 million.
Open unused credit lines carry no restrictive clauses.
The forward sales and swaps undertaken by Renault SA are described above (note 18.A - Management of exchange and interest rate risk).

RENAULT SA – page 25
19. CASH FLOW Cash flow is determined as follows:
(€ million) 2008 2007 Net income (863) 1 096 Increases to provisions and deferred charges 8 5 Net increase to provisions for risks and liabilities 942 (36) Net increases to impairment 467 Transfer of financial charges (1)
TOTAL 554 1 064
20. WORKFORCE Renault SA has no employees.
21. FEES PAID TO DIRECTORS AND EXECUTIVE MANAGERS Fees paid to members of the Board of Directors amounted to €557,475 in 2008 (€557,770 in 2007), including €56,000 for the Chairman (€56,000 in 2007).
22. SUBSEQUENT EVENTS Government support for Renault – announcements of February 9, 2009
In response to the economic crisis sweeping the automobile industry, the French government announced a package of support measures for the sector on February 9, 2009.
For Renault, this support will take the form of a preferential-rate €3 billion loan, and extension of the authorization of the loan by Société de Financement de l’Economie Française (SFEF) to RCI Banque from €500 million to €1 billion.
Renault has renewed its undertaking not to close any vehicle assembly plants in France in the next few years. The Group is also committed to developing systems and technologies for clean vehicles, principally in France, and to maintaining the necessary research, engineering and test resources in the country. It will allocate its income in priority to strengthening equity and investments, to ensure it has all the resources needed to pursue development. Lastly, because Renault cannot grow without strong suppliers, the Group will improve its support for companies in the automotive sector, notably by doubling its contribution to the Automobile Investment Fund (to a total €200 million).
Nissan – announcements of February 9, 2009
In announcing its third-quarter financial results, Nissan revised its forecasts for the fiscal year ending March 31, 2009. The company expects a net loss of 265 million yen. Excluding the effect of restatements for accounting harmonisation and fair value measurement of assets and liabilities applied by Renault, this would result in a negative first-quarter contribution of some €1,100 million to the Renault group’s net income for the first half-year of 2009.
Nissan intends to introduce a plan during the next fiscal year to reduce its global headcount by 20,000.
Nissan also announced it was to cut back on industrial investments, through a plan that will involve a review of Nissan’s participation in some of the Alliance’s joint industrial projects:
• in India (Chennai), ramp-up at the joint Renault-Nissan plant will be delayed; • in Morocco (Tangiers), Nissan is suspending its participation in the plans for a joint plant.

RENAULT SA – page 26
OTHER INFORMATION – SUBSIDIARIES AND AFFILIATES (€ million)
Companies Share capital
Shareholders' equity before share capital
% of capital held Book value of shares owned
INVESTMENTS Renault s.a.s. 534 1 070 100,00 6 701 Dacia (2) 632 49 99,31 746 Nissan Motor Co Ltd (1) 4 803 20 867 44,33 6 413 Sofasa (2) 1 83 23,71 12
TOTAL INVESTMENTS 13 872
(1) exchange rate: 126.14 yen = 1 euro
(2) the exchange rates used for Dacia and Sofasa are 4.0225 Romanian lei = 1 euro and 3,112 Colombian peso = 1 euro respectively
OTHER INFORMATION – SUBSIDIARIES AND AFFILIATES (€ million)
Companies
Outstanding loans and
advances from Renault SA
12-months sales
revenues, closed at
december 31, 2008
Net income (loss), prior year
Dividends received by
Renault SA in 2008
INVESTMENTS Renault s.a.s. 7 776 30 221 (1 626) Dacia (3) 2 074 60 Nissan Motor Co Ltd (4) 63 516 1 235 418 Sofasa (3) 523 (24) 2
(3) the exchange rates used for Dacia and Sofasa are 3,684 Romanian lei = 1 euro and 2,87 Colombian peso = 1 euro respectively
(4) exchange rate: 152.33 yen = 1 euro
ACQUISITION OF INVESTMENTS IN OTHER COMPANIES
No investments were acquired during 2008.