Embed Size (px)
Citation preview

WORCESTER POLYTECHNIC INSTITUTE
Department of Civil & Environmental Engineering
REMOVAL OF CHLOROFORM AND MTBE FROM WATER BY ADSORPTION ONTO GRANULAR ZEOLITES:
EQUILIBRIUM, KINETIC, AND MATHEMATICAL MODELING STUDY
A Dissertation in
Civil & Environmental Engineering
By
Laila I. Abu-Lail
Submitted in Partial Fulfillment
Of the Requirements for the Degree of
Doctor of Philosophy
November, 12st 2010
------------------------------------------------- --------------------------------------
John A. Bergendahl, Ph.D. Advisor Associate Professor of Civil & Environmental Engineering Worcester Polytechnic Institute ------------------------------------------------- --------------------------------------
Robert W. Thompson, Ph.D. Committee Professor of Chemical Engineering Worcester Polytechnic Institute
------------------------------------------------- --------------------------------------
James C. O’Shaughnessy, Ph.D. Committee Professor of Civil & Environmental Engineering Worcester Polytechnic Institute
i
Abstract
Many parts of the world are facing water crises due to the lack of clean drinking water.
Growing industrialization in many areas and extensive use of chemicals for various concerns has
increased the burden of deleterious contaminants in drinking water especially in developing
countries. It is reported that nearly half of the population in developing countries suffers from
health problems associated with lack of potable drinking water as well as the presence of
microbiologically contaminated water [1] . Synthetic and natural organic contaminants are
considered among the most undesirable contaminants found in water. Various treatment
processes are applied for the removal of organic contaminants from water including reverse
osmosis membranes, ion exchange, oxidation, nanofiltration, and adsorption. The adsorption
process is a widely-used technology for the removal of organic compounds from water. In this
work, the adsorption of chloroform and methyl tertiary butyl ether (MTBE) onto granular
zeolites was investigated. Zeolites were specifically chosen because they have shown higher
efficiency in removing certain organics from water than granular activated carbon (GAC).
Batch adsorption experiments to evaluate the effectiveness of several granular zeolites for
the removal of MTBE and chloroform from water were conducted and the results compared with
GAC performance. Results of these batch equilibrium experiments showed that ZSM-5 was the
granular zeolite adsorbent with the greatest removal capacity for MTBE and chloroform from
water, and outperformed GAC.
Fixed-bed adsorption experiments with MTBE and chloroform were performed using
granular ZSM-5. Breakthrough curves obtained from these column experiments were used to
understand and predict the dynamic behavior of fixed bed adsorbers with granular ZSM-5. The
ii
film pore and surface diffusion model (FPSDM) was fit to the breakthrough curve data obtained
from the fixed bed adsorption experiments. The FPSDM model takes into account the effects of
axial dispersion, film diffusion, and intraparticle diffusion mechanisms during fixed bed
adsorption. Generally, good agreement was obtained between the FPSDM simulated results and
experimental breakthrough profiles. This study demonstrated that film diffusion is the primary
controlling mass transfer mechanism and therefore must be accurately determined for good
breakthrough predictions.
iii
Dedicated to
My Mom: Saleema Alyuosef
&
My Dad: the late Ibrahim Abu-Lail

iv
Acknowledgements
I would like to sincerely thank my advisors Professor John A. Bergendahl and Professor
Robert W. Thompson for their friendship, support, insights, guidance and inspirations throughout
my Ph.D. years in WPI. I would like also to thank Professor James O‘Shaughnessy for reviewing
my thesis. Many thanks go to Professor John M. Sullivan from the Mechanical Engineering
Department for his helpful discussions and Professor Terri Camesano for her friendship and
support all the time. I would like also to thank Gerardo Hernandez and Chase Johnson from the
Department of Mathematical Sciences for their help in using Matlab, and Donald Pellegrino from
the Civil and Environmental Engineering Department for his help with setting up lab
experiments. I would like to thank the Department of Civil and Environmental Engineering at
WPI for giving me the chance to pursue my doctorate and for providing me with a graduate
Teaching Assistantship. The financial support from Triton Systems, Inc. of Chelmsford, MA,
and the support by the National Institutes of Health through grant 2R44 ES012784-02 are
gratefully acknowledged. My sincere thanks go to all my faithful friends who were always
concerned about me. More than all, I would like to thank my family, especially my mom and my
sister Nehal, without their support this could not be done. I would like to thank the rest of my
family members (Hussein, Omar, Zaina, Seren, Abd-Almajid, Areej, and Alaa) for their love,
patience, and encouragement.
v
Table of Contents Abstract ......................................................................................................................................................... i
Acknowledgements ..................................................................................................................................... iv
Table of Tables............................................................................................................................................. ix
Table of Figures ............................................................................................................................................ x
1 Introduction .......................................................................................................................................... 1
1.1 Research Objectives ...................................................................................................................... 3
1.2 Background ................................................................................................................................... 4
1.2.1 Adsorption............................................................................................................................. 4
1.2.2 Adsorbents ............................................................................................................................ 5
1.2.2.1 Activated Carbons ............................................................................................................. 5
1.2.2.2 Zeolites .............................................................................................................................. 5
1.2.2.2.1 ZSM-5/Silicalite (MFI) .................................................................................................. 6
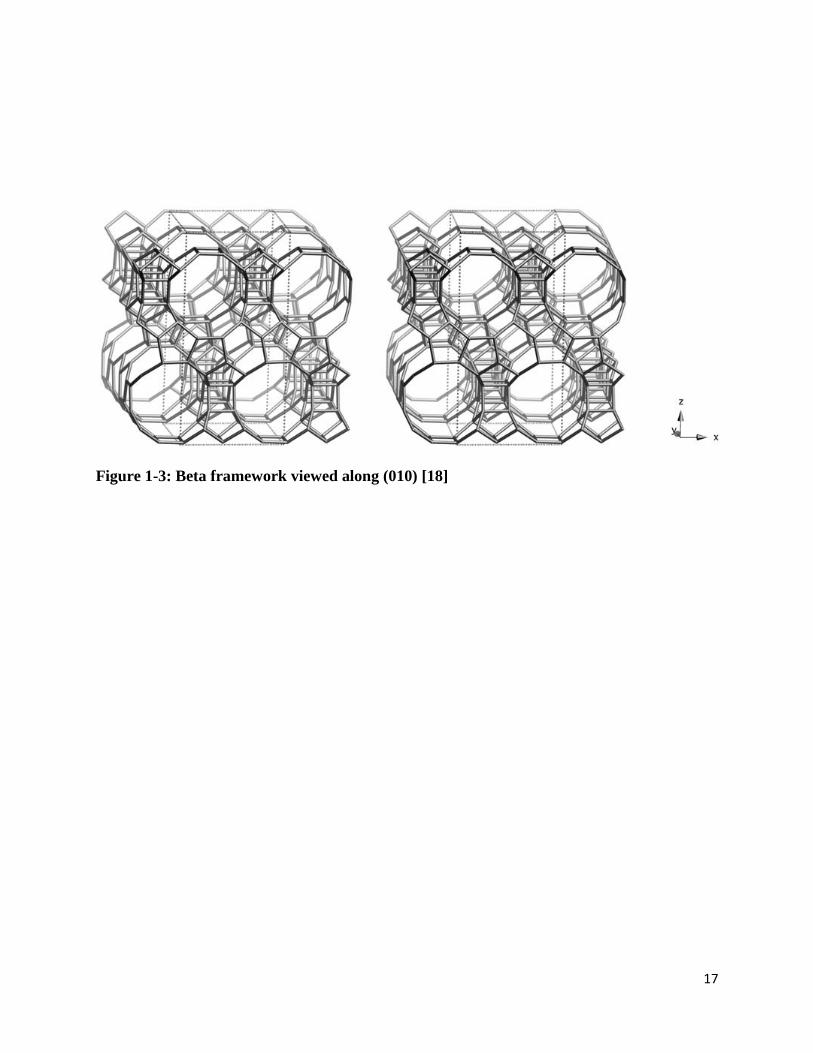
1.2.2.2.2 Beta (*BEA) Zeolite ..................................................................................................... 7
1.2.2.2.3 Mordenite (MOR) Zeolite ............................................................................................ 7
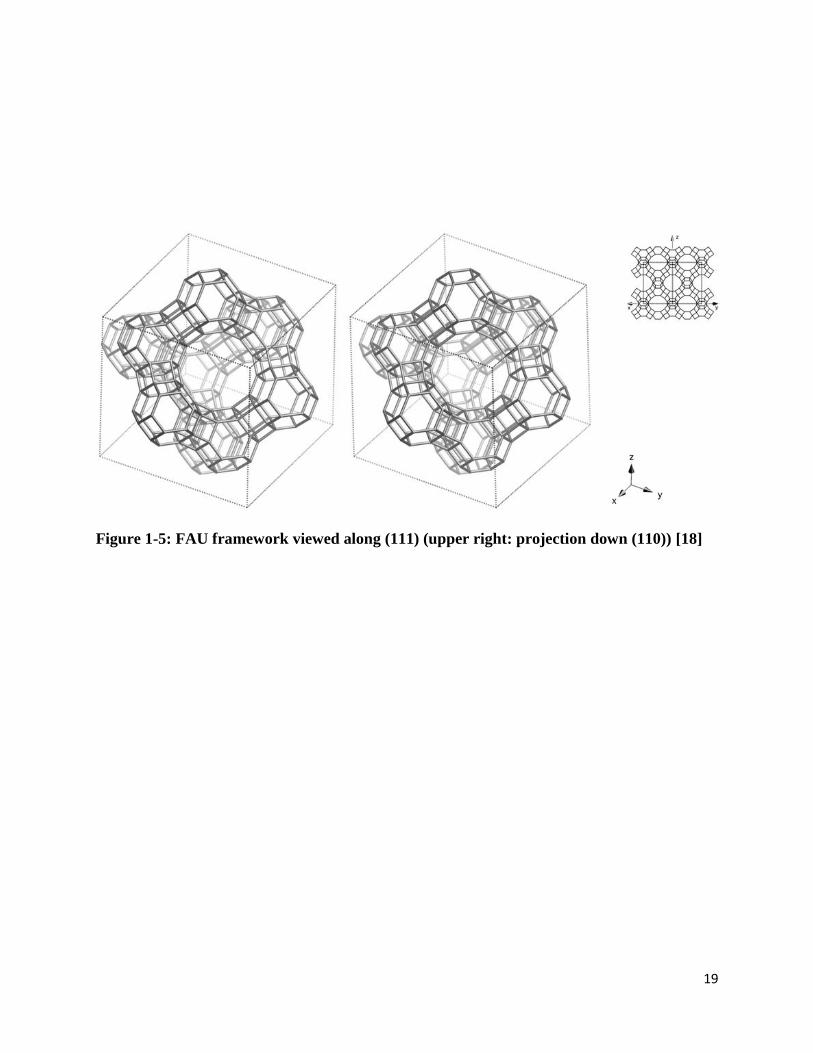
1.2.2.2.4 Y (FAU) Zeolite ............................................................................................................ 8
1.2.3 Adsorbates ............................................................................................................................ 8
1.2.3.1 Methyl Tertiary-Butyl Ether (MTBE) ................................................................................. 8
1.2.3.2 Chloroform ........................................................................................................................ 9
1.2.4 Treatment Technologies for the Removal of Chloroform and MTBE from Water ............. 10
1.2.5 Theory and Design of Fixed-Bed Adsorption Systems ........................................................ 12
2 Adsorption of Methyl Tertiary Butyl Ether on Granular Zeolites: Batch and Column Studies ........... 21
2.1 Abstract ....................................................................................................................................... 21
2.2 Introduction ................................................................................................................................ 22
2.3 Materials and Methods ............................................................................................................... 23
2.3.1 Materials ............................................................................................................................. 23
2.3.2 Batch Adsorption Experiments ........................................................................................... 24
2.3.3 Large Diameter Fixed-Bed Adsorption Experiments ........................................................... 24
2.3.4 Small Diameter Fixed-Bed Adsorption Experiments ........................................................... 25
2.3.5 Gas Chromatography Methodology.................................................................................... 25
2.4 Results & Discussion ................................................................................................................... 26
2.4.1 MTBE Sorption Isotherms ................................................................................................... 26
vi
2.4.2 MTBE Fixed-Bed Adsorption ............................................................................................... 32
2.5 Conclusions ................................................................................................................................. 36
2.6 Acknowledgments ....................................................................................................................... 37
3 Removal of Chloroform from Drinking Water by Adsorption onto Granular Zeolites ....................... 48
3.1 Abstract ....................................................................................................................................... 48
3.2 Introduction ................................................................................................................................ 49
3.3 Materials and Methods ............................................................................................................... 51
3.3.1 Materials ............................................................................................................................. 51
3.3.2 Batch Adsorption Experiments ........................................................................................... 51
3.3.3 Fixed-Bed Adsorption Experiments .................................................................................... 52
3.3.3.1 Large Diameter Fixed-Beds ............................................................................................. 52
3.3.3.2 Small Diameter Fixed-Beds ............................................................................................. 52
3.3.4 Gas Chromatography Methodology.................................................................................... 53
3.4 Results and Discussion ................................................................................................................ 54
3.4.1 Chloroform Adsorption Isotherms ...................................................................................... 54
3.4.1.1 Chloroform Sorption onto Granular Zeolites .................................................................. 54
3.4.1.2 Effect of Adsorbent Grain Size ........................................................................................ 56
3.4.1.3 Chloroform Sorption onto Granular ZSM-5, GAC, and CCA Using Purified Water and a
Challenge Solution .......................................................................................................................... 58
3.4.2 Chloroform Fixed-Bed Adsorption ...................................................................................... 60
3.4.2.1 Large Diameter Fixed-Bed Adsorption Experiments ....................................................... 60
3.4.2.2 Smaller Diameter Fixed-Bed Adsorption Experiments ................................................... 61
3.4.3 BDST model ......................................................................................................................... 63
3.5 Conclusions ................................................................................................................................. 66
3.6 Acknowledgments ....................................................................................................................... 67
4 Mathematical Modeling of Chloroform Adsorption onto Fixed Bed Columns of Highly Siliceous
Zeolites ........................................................................................................................................................ 79
4.1 Abstract ....................................................................................................................................... 79
4.2 Introduction ................................................................................................................................ 80
4.3 Mathematical Model .................................................................................................................. 82
4.4 Model Parameter Estimation ...................................................................................................... 85

vii
4.4.1 Determining Linear Isotherm Constant (K) and Effective Pore Diffusivity Coefficient (Dp,e)
in Batch Tests ...................................................................................................................................... 86
4.4.1.1 Pore Diffusion-Sorption Model Applied to the Batch Tests ............................................ 86
4.4.2 Correlations for Estimating the External Film Transfer Coefficient (kf), the Axial Dispersion
coefficient (Ez), and the Free Liquid Diffusivity (Dl)............................................................................. 88
4.5 Experimental Materials and Procedures..................................................................................... 89
4.5.1 Adsorbent ............................................................................................................................ 89
4.5.2 Adsorbate ............................................................................................................................ 89
4.5.3 Procedures .......................................................................................................................... 89
4.5.3.1 Batch Adsorption Experiments ....................................................................................... 89
4.5.3.2 Batch Kinetic Experiments .............................................................................................. 90
4.5.3.3 Fixed-Bed Experiments ................................................................................................... 90
4.6 Results and Discussion ................................................................................................................ 91
4.6.1 Batch Adsorption Equilibrium Isotherm ............................................................................. 91
4.6.2 Batch Adsorption Rate Studies ........................................................................................... 91
4.6.2.1 Effect of Particle Sizes and the Pore Diffusion-Sorption Model ..................................... 91
4.6.3 Fixed-Bed Adsorption Results ............................................................................................. 93
4.6.3.1 Effect of Bed Height ........................................................................................................ 93
4.6.3.2 FPSDM Results ................................................................................................................ 93
4.6.4 Sensitivity Analysis .............................................................................................................. 95
4.7 Conclusions ................................................................................................................................. 96
4.8 Acknowledgements ..................................................................................................................... 97
4.9 Nomenclature ............................................................................................................................. 98
5 Conclusions and Recommendations for Future Work ...................................................................... 113
5.1 Conclusions ............................................................................................................................... 113
5.2 Recommendations for Future Work ......................................................................................... 116
5.2.1 Regeneration of Zeolite-Bound Contaminants by Advanced Oxidation ........................... 116
5.2.2 Study the Effects of Solution Flow Rate, Initial Solute Concentration, and Adsorbent
Particle Size on Fixed-Bed Adsorption Systems ................................................................................ 117
6 References ........................................................................................................................................ 118
7 Appendices ........................................................................................................................................ 129
7.1 Appendix A: Supplementary Equations for Chapter 4 .............................................................. 129

viii
7.2 Appendix B: The Matlab Program for the FPSDM Model in Chapter 4 .................................... 131
ix
Table of Tables
Table 1-1: Physicochemical properties and molecular structures of MTBE and chloroform ..................... 14
Table 2-1: Summary of zeolite samples used in the batch adsorption experiments.................................... 38
Table 2-2: The Freundlich and Langmuir isotherms parameters ................................................................ 39
Table 2-3: A list of constituents used in preparing the challenge solution ................................................ 40
Table 2-4: BDST equation parameters, adsorption capacity (N0), adsorption rate constant (k), service
time, volume treated for different MTBE removal percentages and the minimum depth of adsorbent
required to achieve the effluent criterion (Z0). Flow rate was 5.2 mL/min. ................................................ 41
Table 3-1: Properties of granular zeolites tested in the batch adsorption experiments. .............................. 68
Table 3-2: A list of all constituents used in preparing the challenge solution. ........................................... 69
Table 3-3: Comparisons of chloroform column performances at breakthrough (effluent concentration =
18% of influent concentration) obtained from the small diameter fixed-bed adsorption experiments (Co =
450 µg/L, flow rate = 5.2 ml/min). ............................................................................................................. 70
Table 3-4: BDST equations for chloroform adsorption onto granular ZSM-5 at various breakthrough
percentages. Flow rate was 5.2 mL/min. .................................................................................................... 71
Table 4-1: Dimensionless parameters. ...................................................................................................... 101
Table 4-2: FPSDM parameters. ................................................................................................................ 102
Table 4-3: Correlations for obtaining external mass transfer coefficient, axial dispersion coefficient, and
free liquid diffusivity. ............................................................................................................................... 104
Table 4-4: Characterization of the adsorbent. ........................................................................................... 105
Table 4-5: The values of dimensionless mass transport parameters at different bed heights. .................. 106
x
Table of Figures
Figure 1-1: A drawing of the adsorption process ........................................................................................ 15
Figure 1-2: ZSM-5 framework viewed along (010)[18] ............................................................................. 16
Figure 1-3: Beta framework viewed along (010) [18] ................................................................................ 17
Figure 1-4: Mordenite framework viewed along (001) [18] ....................................................................... 18
Figure 1-5: FAU framework viewed along (111) (upper right: projection down (110)) [18] ..................... 19
Figure 1-6: Dynamic behavior of fixed-bed adsorption systems ................................................................ 20
Figure 2-1: MTBE sorption from the aqueous phase onto granular zeolites, using a minimum of 24 h
equilibration time. Initial MTBE concentrations were in the range of (0.01-150 mg/L). ........................... 42
Figure 2-2: MTBE sorption from the aqueous phase onto granular ZSM-5 with three different grain sizes
compare to the original ZSM-5 size of 1.6 mm. Initial MTBE concentrations were in the range of 85-7500
μg/L. ............................................................................................................................................................ 43
Figure 2-3: MTBE sorption from the aqueous phase onto granular ZSM-5, (CS-1240) & CCA with and
without the presence of natural organic matter (NOM = 5 mg/L) in the solution. Initial MTBE
concentrations were in the range of 85-5000 μg/L ..................................................................................... 44
Figure 2-4: Breakthrough curves of MTBE adsorption onto granular ZSM-5, CCA, & (CS-1240) from the
large diameter fixed-bed adsorption experiments (C0 = 50 µg/L, flow rate = 32.5 ml/min) ...................... 45
Figure 2-5: Breakthrough curves of MTBE adsorption onto ZSM-5 from the small diameter fixed-bed
adsorption experiments using three different bed heights (Co = 50 µg/L, flow rate = 5.2 ml/min) ............ 46
Figure 2-6: BDST curves (flow rate = 5.2 ml/min, Co = 50 g/L) ............................................................. 47
Figure 3-1: Chloroform sorption from the aqueous phase onto granular zeolites, using a minimum 24 h
equilibrium time. ......................................................................................................................................... 72
Figure 3-2: Chloroform sorption from the aqueous phase onto ZSM-5 with three different grain sizes
compared to the original ZSM-5 size of 1.6 mm. Lines are best linear fits. .............................................. 73
Figure 3-3: Average removal percentages of chloroform from the aqueous phase by adsorption to granular
ZSM-5, CS-1240 & CCA using chloroform-spiked purified water and ―challenge‖ water. The error bars
signify 95% confidence. Initial chloroform concentrations were in the range of 1400-10000 µg/L. ......... 74
Figure 3-4: Normalized breakthrough curves of chloroform adsorption onto ZSM-5, CCA, & CS-1240 in
the large diameter fixed-bed adsorption experiments (C0 = 450 µg/L, flow rate = 32.5 ml/min, & EBCT =
0.15 min). .................................................................................................................................................... 75
xi
Figure 3-5: Normalized breakthrough curves of chloroform adsorption onto ZSM-5 in the small diameter
fixed-bed adsorption experiments using three different bed heights (C0 = 450 µg/L, flow rate = 5.2
ml/min). ....................................................................................................................................................... 76
Figure 3-6: Comparison between the batch equilibrium data obtained with the smallest size granular
ZSM-5 (between 250 and 425 µm) and the adsorption capacities at saturation found from the fixed-bed
data for the 6, 9, and 12 cm beds using the same ZSM-5 size. The line is the best linear regression fit to
the equilibrium data. ................................................................................................................................... 77
Figure 3-7: BDST curves at various breakthrough points (as percentage of influent concentration) (flow
rate = 5.2 ml/min, C0 = 450 ppb). Lines are best fit to respective data. ..................................................... 78
Figure 4-1: Adsorption isotherm for chloroform onto ZSM-5 zeolite. The line represents the linear
isotherm model.......................................................................................................................................... 107
Figure 4-2: Comparison of the measured concentration-time data with that predicted by the pore-sorption
diffusion model for the adsorption of chloroform onto four sizes of granular zeolite ZSM-5 in batch
adsorber. .................................................................................................................................................... 108
Figure 4-3: The experimental and predicted (by the FPSDM) breakthrough curves for the adsorption of
chloroform onto granular ZSM-5 at different bed heights. ....................................................................... 109
Figure 4-4: Sensitivity analysis of the FPSDM to the film diffusion coefficient (kf) for the 6 cm bed. ... 110
Figure 4-5: Sensitivity analysis of the FPSDM to the film diffusion coefficient (Ez) for the 6 cm bed. .. 111
Figure 4-6: Sensitivity analysis of the FPSDM to the film diffusion coefficient (Dp,e) for the 6 cm bed. 112

1
1 Introduction
Removal of a wide range of trace organic contaminants from water to concentrations
below USEPA Maximum Contaminant Levels (MCL) remains an important goal for the water
industry. Volatile organic compounds (VOCs) and polar organic compounds (POCs) are two
classes of organic contaminants that have received increasing attention in the recent years
because of the difficulty associated with their removal from water systems and due to the serious
health problems they can pose if allowed to enter the human environment. Removal of organic
contaminates from water and wastewater has been achieved using several treatment technologies.
Examples of such technologies include; advanced oxidation processes, air stripping, reverse
osmosis, ultrafiltration, and adsorption. In particular, there is a growing interest in the application
of adsorption processes for the removal of organic compounds from aqueous solutions.
Adsorption processes can be successfully used when contaminants are not amenable to biological
degradation. Granular activated carbon (GAC) is the most widely used adsorbent material for the
removal of organic contaminants in water and wastewater applications [2-5] . However, the
design and operation of fixed-bed GAC systems can be complicated by the presence of dissolved
natural organic matter in the water stream being treated [6] .
In addition, bacterial growth on the carbon grains, which can be enhanced by the
adsorbed organic substrates, can lead to relatively high operational maintenance associated with
frequent replacement or reactivation of the GAC bed. Recently, researchers have found that
high-silica zeolites, a class of crystalline adsorbents with well defined pore sizes, were shown to
be more effective in removing certain organics from water than activated carbon [6-10] .

2
Adsorption processes are usually accomplished in fixed bed contactors because of their
lower labor costs and high utilization rate of the adsorbent. In addition, granular materials with
relatively large grain sizes are employed in fixed-bed adsorbers to avoid high friction losses
which can be associated with passing water through beds of powdered materials.
The design and operation of fixed-bed adsorber systems can be complicated by the
variability in the composition of water and the presence of different contaminants which makes
the design of a fixed-bed adsorption system site-specific. Hence, integrating process-modeling
principles into the design and operation of a treatment system allows the accurate determination
of the process mechanisms and variables that are significant for its operation and performance.
Once verified, those models can allow savings in time and expense that is usually associated with
pilot studies and can be used to examine the effects of changing process variables other than
those directly measured.
In this study, the removal of chloroform and methyl tertiary butyl ether (MTBE) as two
examples of, VOCs and, POCs, respectively, from water using various granular zeolites was
investigated. Additionally, a model that describes the physics of the adsorption process in fixed-
bed adsorbers that is derived from fundamental mass continuity relationships was developed.
This dissertation is arranged into five chapters; the first and last chapters are the
introduction and conclusions chapters, respectively, and the other three chapters corresponded to
the body of the study. The second chapter focused on studying the adsorption of MTBE onto
granular zeolites. In particular, equilibrium and kinetic adsorption of MTBE onto several types
of granular zeolites, a coconut shell granular activated carbon (CS-1240), and a commercial
carbon adsorbent (CCA) sample was evaluated. In addition, the effect of granular zeolite grain
size and the effect of natural organic matter (NOM) on MTBE adsorption were evaluated.
3
Finally, fixed bed adsorption experiments were performed and the breakthrough results
were analyzed with the bed depth service time model (BDST). In the third chapter, the
adsorption of chloroform by granular zeolites was evaluated and compared to the adsorption
efficiency of a commercial carbon adsorbent and a coconut shell granular activated carbon in
batch and kinetic adsorption studies. In addition, the effects of adsorbent grain size and humic
acid on chloroform adsorption capacity were also evaluated. Lastly, fixed-bed adsorption
experiments of chloroform onto granular zeolite ZSM-5 were performed and fitted to the bed
depth service time (BDST) model. In the forth chapter, the single component adsorption of
chloroform onto granular zeolite ZSM-5 was evaluated using both batch and fixed-bed
adsorption studies. In addition, a model which takes into account the film transfer resistance,
intraparticle diffusion resistance, axial dispersion, and linear adsorption was developed and its
resulting set of equations were solved numerically and used to fit the experimental breakthrough
curves of chloroform adsorption onto granular zeolite ZSM-5.
1.1 Research Objectives
The overall goal of this research was to evaluate the effectiveness of alternative adsorbents
for the removal of specific organic contaminants from water. Specific objectives of this study
were to:
Evaluate the effectiveness of several types of granular zeolites to determine the most
suitable ones for the adsorption of chloroform and MTBE from water
Compare chloroform and MTBE adsorption capacities of zeolites to those of two types of
granular activated carbons (GAC)

4
Study the effect of preloaded natural organic matter (NOM) on the removal capacities of
granular zeolites and GAC for chloroform and MTBE from water
Predict and analyze the adsorption rate using mathematical models which incorporates
the equilibrium and kinetics of a given adsorbent-solute system
1.2 Background
1.2.1 Adsorption
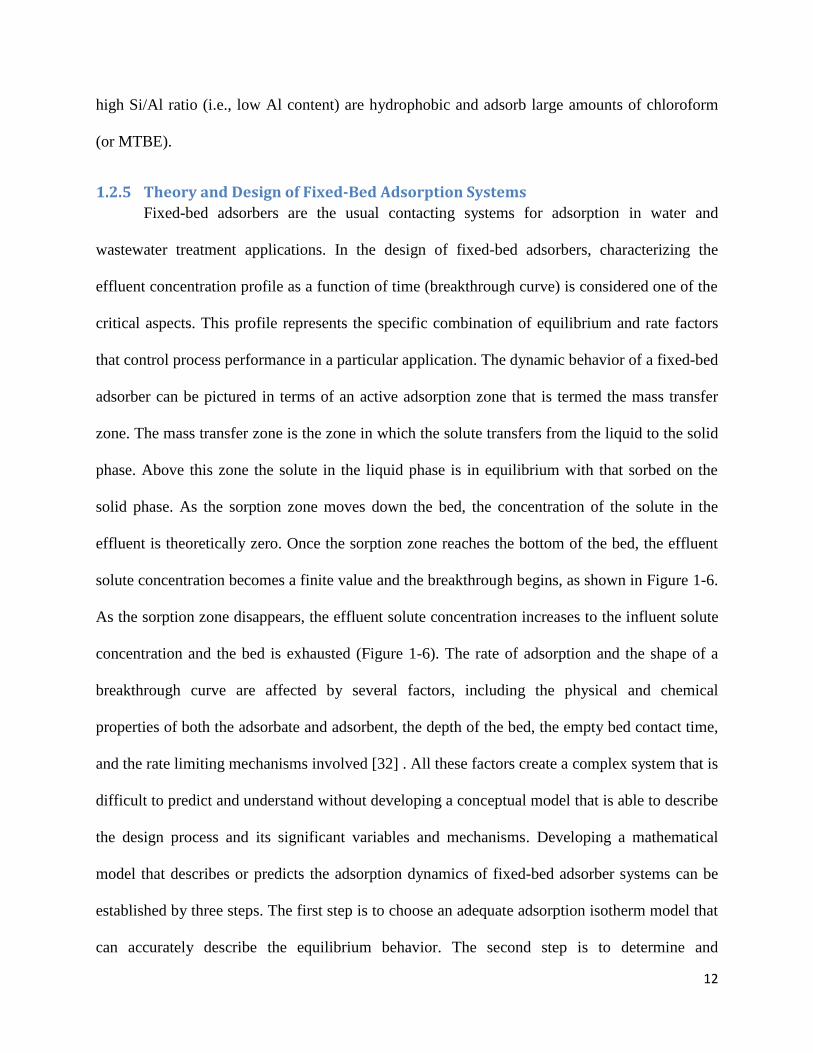
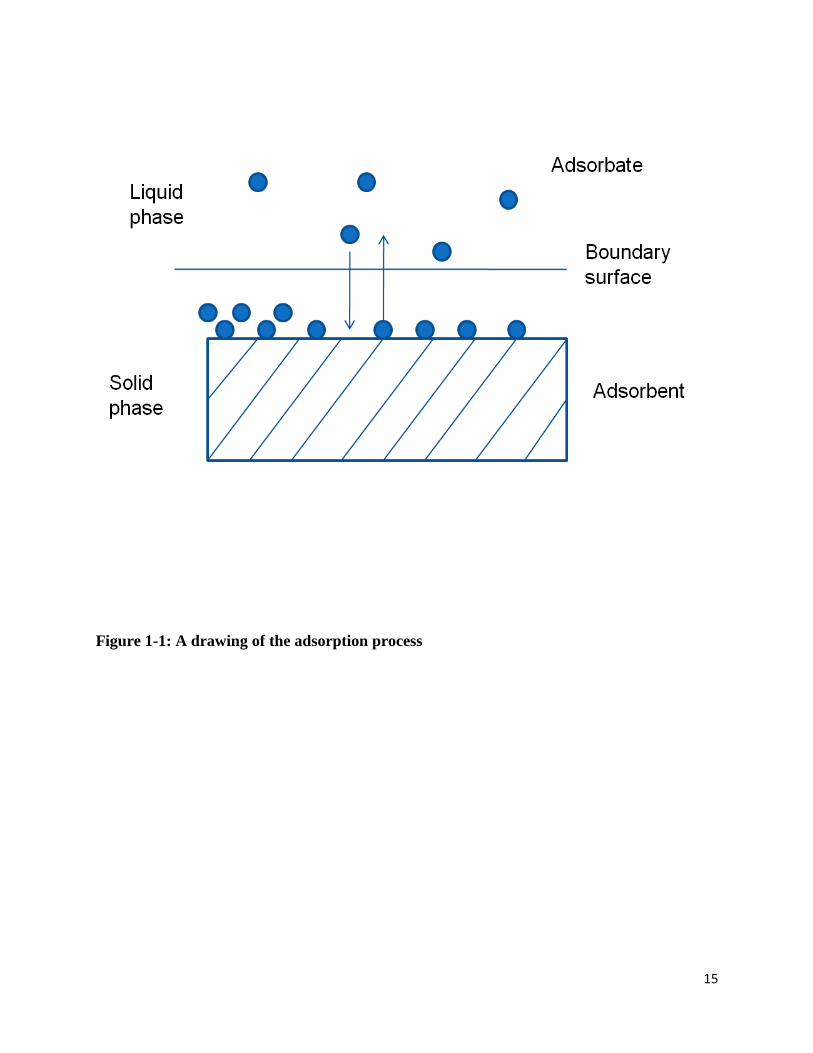
Adsorption is the accumulation of a constituent in one phase at the interface between that
phase and another (Figure 1-1). Many factors affect the degree of adsorption; adsorbent
properties, chemical properties of the adsorbate, and aqueous phase characteristics such as pH
and temperature. An adsorption isotherm describes the relation between the mass of adsorbate
that accumulates on the adsorbent per unit mass of the adsorbent and the equilibrium aqueous
phase concentration of the adsorbate. The most common method for gathering isotherm data is
by equilibrating known quantities of the adsorbent material with solutions of the adsorbate.
These equilibrium data are then matched into an adsorption isotherm model. A variety of models
have been developed to characterize the equilibrium isotherm data. Examples of such models
include; the linear model, the Langmuir model, the Freundlich model, and the BET model [11] .
The Freundlich model is one of the most frequently used models in the design of adsorber
systems because it usually fits single-solute experimental data and acknowledges the surface
heterogeneity of the adsorbent [11] . The Freundlich isotherm model has the following form
nefe CKq /1 where qe (mg/g) is the mass of solute adsorbed per unit mass of adsorbent at
equilibrium, Ce (mg/L) is the aqueous-phase concentration, and Kf and (1/n) are characteristic
constants [11] .
5
1.2.2 Adsorbents
Two types of adsorbents were used in this study; activated carbon and zeolites. A
description of their structure, properties and applications is given below.
1.2.2.1 Activated Carbons
Activated carbons can be prepared from almost any carbonaceous material by heating it
in the absence of air to liberate carbon from its associated atoms. This step is called
carbonization and it is followed by activation. Activation occurs by passing a mildly oxidative
gaseous steam or carbon dioxide through the carbon at elevated temperatures (315-925ºC) [12] .
This process causes the formation of tiny fissures or pores. The typical range of GAC pore
volume is around 0.85-0.95 ml/g and its apparent dry density ranges from 22-50 g/100 ml [12] .
The surface areas of commercial GACs range from 600-1600 m2/g. Activated carbons adsorption
has been used in the water treatment industry for a wide range of applications from taste and
odor control to removal of specific organic contaminants such as aliphatic and aromatic
hydrocarbons [12] .
1.2.2.2 Zeolites
Zeolites are microporous inorganic crystalline materials with uniform pore dimensions.
The zeolite framework consists of TO4 tetrahedra units, where T is predominantly either a Si4+
or
Al3+
atom located at the center of the tetrahedron. Other T-atoms such as (Fe, Ti, Ge, Ga, and Se)
can be incorporated usually in small amounts, or as impurities, and for special purposes.
Tetrahedra units are joined together in various regular arrangements through shared oxygen
atoms, to form an open crystal lattice containing pores of molecular dimensions into which guest
molecules can penetrate. Since the microstructure is determined by the crystal lattice it is
precisely uniform with no distribution of pore size. This pore size regularity makes zeolites
6
different from other molecular sieves such as the microporous charcoal and amorphous carbon.
Zeolite pore openings range from 3 to > 7 Å depending on the framework structure [13] .
The crystalline zeolite framework carries a negative charge, and its magnitude depends
on the amount of isomorphically substituted Al3+
. This charge is balanced by cations localized in
non-framework positions (incavities or channels) to obtain a neutral net charge of the structure.
Typical cations include the alkaline (Li+, Na
+, K
+, Rb
+, Cs
+) and the alkaline earth (Mg
2+, Ca
2+,
Ba2+
) cations, as well as NH4+, H3O
+, TMA
+ (tetramethylammonium) and other nitrogen-
containing organic cations [13] . The framework charge and cations are important as they
determine the ion exchange properties of zeolites. Zeolites with low Al3+
content or constituted
exclusively of Si4+
in the tetrahedral sites have low negative or neutral framework charge and
therefore exhibit a high degree of hydrophobicity and poor ion exchange capacity [13] . The
zeolite‘s degree of hydrophobicity, which increases with increasing Si4+
/Al3+
ratio of the
structure and their pore size and geometry relative to the size of the organic in consideration play
a role in determining the suitability of zeolites for the removal of organic contaminants from
aqueous solutions [6, 8, 14, 15] .
By appropriate choice of framework structure, Si4+
/Al3+
ratio and cationic form,
adsorbents with widely different adsorptive properties may be prepared. It is therefore possible,
in certain cases, to tailor the adsorptive properties to achieve the selectivity required for a
particular application.
Among the zeolite structures presently known, this work focused on four: ZSM-
5/silicalite (MFI), Beta (*BEA), Mordenite (MOR), and Y (FAU) zeolites.
1.2.2.2.1 ZSM-5/Silicalite (MFI)
The most important member of the MFI family is the ZSM-5 zeolite because it possess
unusual catalytic properties and have high thermal stability [16] . The pure silica form of ZSM-5

7
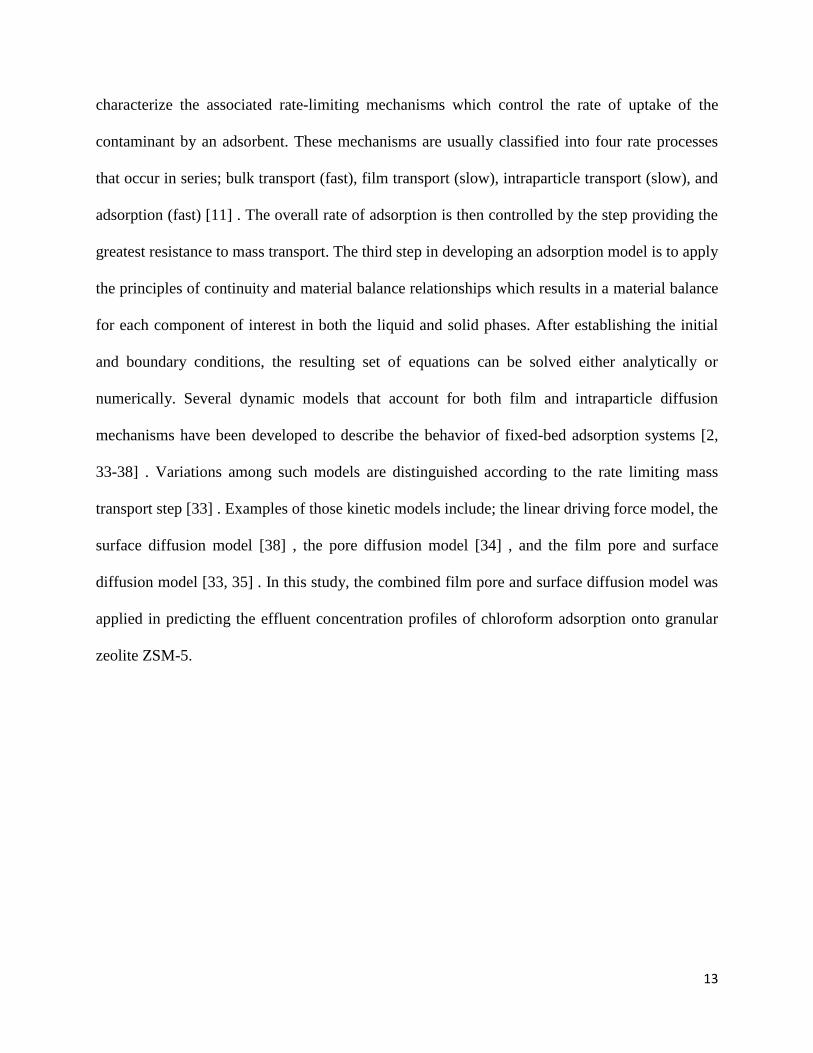
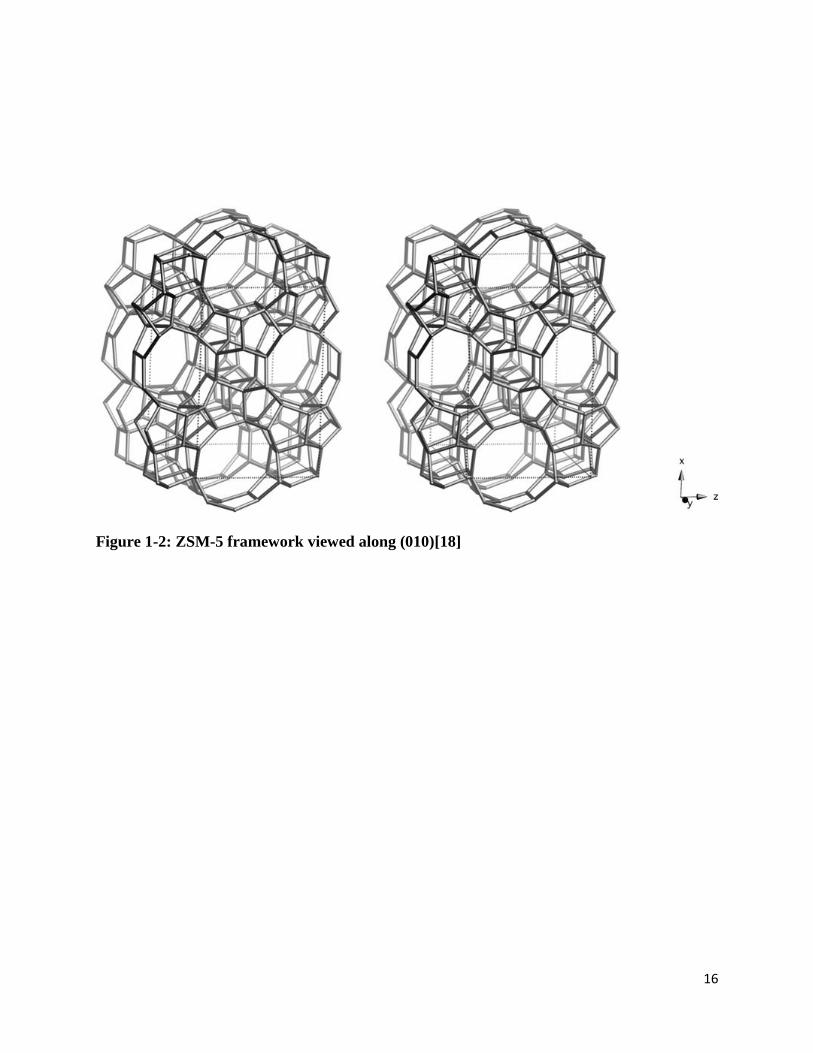
zeolite is known as silicalite. The MFI framework is presented in Figure 1-2. Zeolite ZSM-5 is
constructed from pentasil units that are linked together in pentasil chains (Figure 1-2). Mirror
images of these chains are connected by oxygen bridges to form corrugated sheets with ten-ring
channel openings. Figure 1-2 highlights such a corrugated sheet in the y-x plane. Oxygen bridges
link each sheet to the next to form a three-dimensional structure with straight ten-ring channels
parallel to the corrugations along y intersected by sinusoidal ten-ring channels perpendicular to
the sheets along z (Figure 1-2) [17] . The minor and major axis dimensions are 5.1 x 5.5 Å for
the sinusoidal channels and 5.3 x 5.6 Å for the straight channels [18] .
1.2.2.2.2 Beta (*BEA) Zeolite
Beta zeolites have well-defined layers comprised of four 5-ring subunits (Figure 1-3)
joined by 4-ring subunits that are stacked in a disordered way along the z direction. Despite this
disorder, a three-dimensional twelve-ring channel system is formed [17] . The pore dimensions
of the channel system are 5.6 x 5.6 Å and 6.6 x 6.7 Å [18] .
1.2.2.2.3 Mordenite (MOR) Zeolite
The Mordenite framework type is formed with four 5-ring subunits as shown in Figure
1.4. These units are linked to one another by common edges to form chains as illustrated in
Figure 1-4 and mirror images of these chains are connected by oxygen bridges to form
corrugated sheets. The corrugated sheets are connected together to form oval twelve- and eight-
ring channels along the z direction (Figure 1-4). These channels are connected by eight-ring
channels that are displaced with respect to one another (Figure 1-4). The twelve- and eight-ring
channels have dimensions of 6.5 x 7.0 Å and 2.6 x 5.7 Å, respectively [18] . Given the small size
of the eight-ring channels, the MOR channel system is effectively one-dimensional instead of
two-dimensional [17] .
8
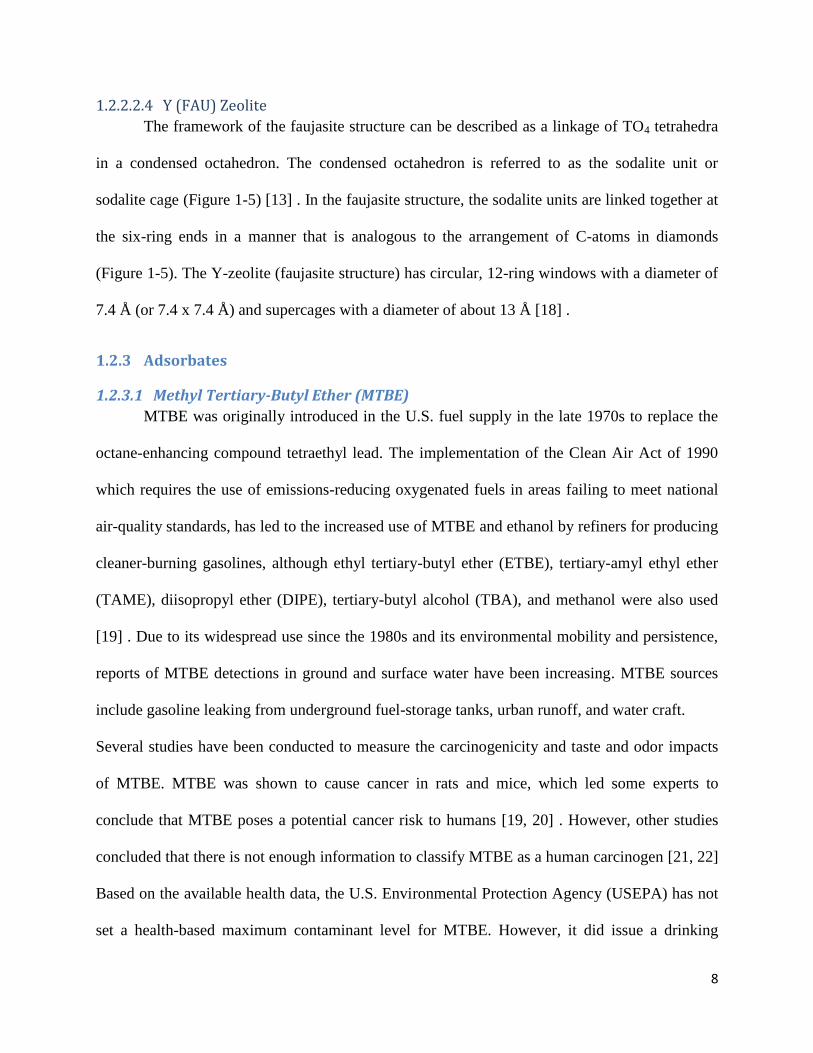
1.2.2.2.4 Y (FAU) Zeolite
The framework of the faujasite structure can be described as a linkage of TO4 tetrahedra
in a condensed octahedron. The condensed octahedron is referred to as the sodalite unit or
sodalite cage (Figure 1-5) [13] . In the faujasite structure, the sodalite units are linked together at
the six-ring ends in a manner that is analogous to the arrangement of C-atoms in diamonds
(Figure 1-5). The Y-zeolite (faujasite structure) has circular, 12-ring windows with a diameter of
7.4 Å (or 7.4 x 7.4 Å) and supercages with a diameter of about 13 Å [18] .
1.2.3 Adsorbates
1.2.3.1 Methyl Tertiary-Butyl Ether (MTBE)
MTBE was originally introduced in the U.S. fuel supply in the late 1970s to replace the
octane-enhancing compound tetraethyl lead. The implementation of the Clean Air Act of 1990
which requires the use of emissions-reducing oxygenated fuels in areas failing to meet national
air-quality standards, has led to the increased use of MTBE and ethanol by refiners for producing
cleaner-burning gasolines, although ethyl tertiary-butyl ether (ETBE), tertiary-amyl ethyl ether
(TAME), diisopropyl ether (DIPE), tertiary-butyl alcohol (TBA), and methanol were also used
[19] . Due to its widespread use since the 1980s and its environmental mobility and persistence,
reports of MTBE detections in ground and surface water have been increasing. MTBE sources
include gasoline leaking from underground fuel-storage tanks, urban runoff, and water craft.
Several studies have been conducted to measure the carcinogenicity and taste and odor impacts
of MTBE. MTBE was shown to cause cancer in rats and mice, which led some experts to
conclude that MTBE poses a potential cancer risk to humans [19, 20] . However, other studies
concluded that there is not enough information to classify MTBE as a human carcinogen [21, 22]
Based on the available health data, the U.S. Environmental Protection Agency (USEPA) has not
set a health-based maximum contaminant level for MTBE. However, it did issue a drinking
9
water advisory for MTBE concentrations of 20-40 µg/L based on taste and odor data [19] The
California EPA set a primary health-based MTBE standard of 13 µg/L and a secondary MTBE
standard based on taste and odor of 5 µg/L [20] .
Given its high aqueous solubility and low volatility (Table 1-1), MTBE removal by
traditional treatment technologies, such as air stripping and activated carbon adsorption has been
expected to be less effective [23] . The byproducts of advanced oxidation process such as
tertiary-butyl alcohol (TBA) have prevented this technique from general application though it is
quite effective in removing MTBE [24] .
1.2.3.2 Chloroform
In the water industry, chlorine is most often the final disinfectant added to treated water
for disinfection purposes before it is conveyed into water distribution systems [25] . On the other
hand, reactions between chlorine and organic precursor compounds in water, such as humic and
fulvic acid substances results in formation of trihalomethanes (THMs), haloacedic acids (HAAs)
and other disinfection byproducts (DBPs). Among DBPs, trihalomethanes (chloroform,
bromodichloromethane, dibromochloromethane, and bromoform) are known or suspected
carcinogens and their presence is not desirable. Consequently, the maximum allowable limit set
by the USEPA for all trihalomethanes combined is 80 µg/L [26] . Chloroform as one of the most
frequently investigated trihalomethanes has been selected in this study for further investigation
(Table 1-1). Beside its production in surface water as a result of the chlorination process,
chloroform is also found in groundwater due to the presence of organic solvents containing
halogens, which are thought to be leaked from electronic device factories, dry cleaning facilities,
and similar sources.
10
1.2.4 Treatment Technologies for the Removal of Chloroform and MTBE from Water
Various technologies have been applied for the removal of chloroform and MTBE from
water such as advanced oxidation, air stripping, and adsorption. Removal of organic substances
from water by air stripping involves their transfer from the liquid (water) phase to the gas (air)
phase. Air stripping can be an effective process for MTBE removal; however, low mass transfer
coefficients are observed for these systems due to the low volatility and high water solubility of
MTBE. Consequently, relatively tall packed towers are required to achieve high MTBE removal
percentages [27] . Although air stripping can be used for chloroform removal, it has a drawback
of transferring chloroform into air creating air pollution concerns.
Advanced oxidation processes, such as UV/H2O2, Fe0/H2O2 and O3/H2O2 have been
evaluated for MTBE and chloroform removal. de Arruda et al. [28] evaluated the remediation of
groundwater containing chloroform using a reductive system with zero-valent iron, and the
reductive process coupled with Fenton's reagent. Although, their results showed marked
reductions in some chlorinated compounds, destruction of chloroform demanded additional
treatment. Sutherland et al [27] showed that the O3/H2O2 advanced oxidation process was
effective in removing MTBE from groundwater only under conditions of low flow rates, low
alkalinity, and at pH 7.0. Additionally, the study found that if the treatment objectives included
removal of oxidation byproducts such as TBA, treatment costs were higher than those indicated
in their analysis due to the need for a higher oxidant dosage. Beregendahl et al. [29] evaluated
the effectiveness of Fenton‘s oxidation with Fe0 for the removal of MTBE from contaminated
water. Their results showed that oxidation reactions were able to degrade over 99% of the MTBE
within 10 min.
Adsorption processes have been evaluated for MTBE and chloroform removal from
aqueous solutions. Removal of chloroform and MTBE by adsorption on activated carbon has
11
been widely used as an effective means for water purification [2-5, 30] . For example, Urano et
al. [30] investigated the adsorption capacities and rates for adsorption of chloroform and six
other chlorinated organic compounds for six commercial GACs. Their results showed that GAC
was able to remove these compounds from water; however, the amounts adsorbed were
decreased by 10-20% when humic substances coexisted. Similarly, studies have shown that GAC
performance in removing MTBE was reduced when other synthetic organic compounds
coexisted with MTBE or in the presence of natural organic matter (NOM). For example, Shih et
al. [3] studied the impact of NOM on GAC performance for the removal of MTBE from two
groundwater sources and one surface water. Their results showed that the higher NOM content
of the surface water over the groundwater sources caused a greater competitive-adsorption effect
that caused more sites on the GAC to be unavailable to MTBE, thus decreasing the GAC
adsorption capacity for MTBE. Additionally, Shih et al. found that a higher TOC content in the
water adversely affected MTBE removal because of GAC fouling associated with TOC
adsorption [3] .
Recently, porous solids other than activated carbons such as zeolites, were found to be
interesting alternatives for organic compounds adsorption, they may be in some cases, more
efficient because they offer a large range of surface properties [7, 8, 10, 14, 31] . In particular,
studies using the adsorptive features of zeolites for the removal of chloroform and MTBE from
water were reported and generally suggested that the Si/Al ratio of zeolites played an important
role regarding their behavior in adsorbing chloroform or MTBE from water [6, 10, 14] . Zeolites
with low Si/Al ratio (i.e., high Al content) are highly hydrophilic and therefore selectively adsorb
water rather than chloroform (or MTBE) from aqueous solution. On the other hand, zeolites with
12
high Si/Al ratio (i.e., low Al content) are hydrophobic and adsorb large amounts of chloroform
(or MTBE).
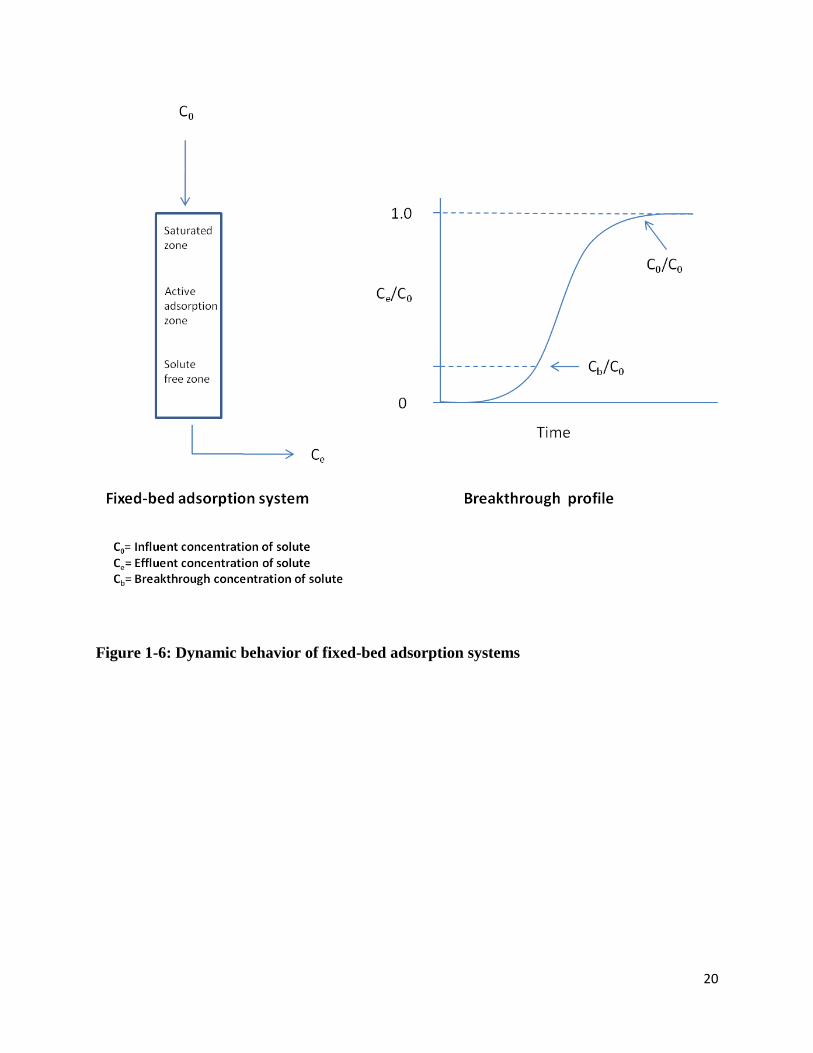
1.2.5 Theory and Design of Fixed-Bed Adsorption Systems
Fixed-bed adsorbers are the usual contacting systems for adsorption in water and
wastewater treatment applications. In the design of fixed-bed adsorbers, characterizing the
effluent concentration profile as a function of time (breakthrough curve) is considered one of the
critical aspects. This profile represents the specific combination of equilibrium and rate factors
that control process performance in a particular application. The dynamic behavior of a fixed-bed
adsorber can be pictured in terms of an active adsorption zone that is termed the mass transfer
zone. The mass transfer zone is the zone in which the solute transfers from the liquid to the solid
phase. Above this zone the solute in the liquid phase is in equilibrium with that sorbed on the
solid phase. As the sorption zone moves down the bed, the concentration of the solute in the
effluent is theoretically zero. Once the sorption zone reaches the bottom of the bed, the effluent
solute concentration becomes a finite value and the breakthrough begins, as shown in Figure 1-6.
As the sorption zone disappears, the effluent solute concentration increases to the influent solute
concentration and the bed is exhausted (Figure 1-6). The rate of adsorption and the shape of a
breakthrough curve are affected by several factors, including the physical and chemical
properties of both the adsorbate and adsorbent, the depth of the bed, the empty bed contact time,
and the rate limiting mechanisms involved [32] . All these factors create a complex system that is
difficult to predict and understand without developing a conceptual model that is able to describe
the design process and its significant variables and mechanisms. Developing a mathematical
model that describes or predicts the adsorption dynamics of fixed-bed adsorber systems can be
established by three steps. The first step is to choose an adequate adsorption isotherm model that
can accurately describe the equilibrium behavior. The second step is to determine and
13
characterize the associated rate-limiting mechanisms which control the rate of uptake of the
contaminant by an adsorbent. These mechanisms are usually classified into four rate processes
that occur in series; bulk transport (fast), film transport (slow), intraparticle transport (slow), and
adsorption (fast) [11] . The overall rate of adsorption is then controlled by the step providing the
greatest resistance to mass transport. The third step in developing an adsorption model is to apply
the principles of continuity and material balance relationships which results in a material balance
for each component of interest in both the liquid and solid phases. After establishing the initial
and boundary conditions, the resulting set of equations can be solved either analytically or
numerically. Several dynamic models that account for both film and intraparticle diffusion
mechanisms have been developed to describe the behavior of fixed-bed adsorption systems [2,
33-38] . Variations among such models are distinguished according to the rate limiting mass
transport step [33] . Examples of those kinetic models include; the linear driving force model, the
surface diffusion model [38] , the pore diffusion model [34] , and the film pore and surface
diffusion model [33, 35] . In this study, the combined film pore and surface diffusion model was
applied in predicting the effluent concentration profiles of chloroform adsorption onto granular
zeolite ZSM-5.

14
Table 1-1: Physicochemical properties and molecular structures of MTBE and chloroform
MTBE [19] Chloroform [6, 26]
Molecular weight
(g/mol)
88.15 119.39
Aqueous solubility at
25 ºC (g/L)
51.26 7.2
Density at 25 ºC
(g/cm3)
0.74 1.489
Log Kow 1.24 1.97
Henry‘s low constant
at 25 ºC (atm·m3/mol)
5.5 x 10⁻⁴
4.06 x 10⁻³
Chemical formula C5H12O CHCl3
Chemical structure
15
Figure 1-1: A drawing of the adsorption process
16
Figure 1-2: ZSM-5 framework viewed along (010)[18]
17
Figure 1-3: Beta framework viewed along (010) [18]

18
Figure 1-4: Mordenite framework viewed along (001) [18]
19
Figure 1-5: FAU framework viewed along (111) (upper right: projection down (110)) [18]
20
Figure 1-6: Dynamic behavior of fixed-bed adsorption systems

21
2 Adsorption of Methyl Tertiary Butyl Ether on Granular Zeolites: Batch
and Column Studies
2.1 Abstract
Methyl tertiary butyl ether (MTBE) has been shown to be readily removed from water
with powdered zeolites, but the passage of water through fixed beds of very small powdered
zeolites produces high friction losses not encountered in flow through larger sized granular
materials. In this study, equilibrium and kinetic adsorption of MTBE onto granular zeolites, a
coconut shell granular activated carbon (CS-1240), and a commercial carbon adsorbent (CCA)
sample was evaluated. In addition, the effect of natural organic matter (NOM) on MTBE
adsorption was evaluated. Batch adsorption experiments determined that ZSM-5 was the most
effective granular zeolite for MTBE adsorption. Further equilibrium and kinetic experiments
verified that granular ZSM-5 is superior to CS-1240 and CCA in removing MTBE from water.
No competitive-adsorption effects between NOM and MTBE were observed for adsorption to
granular ZSM-5 or CS-1240, however there was competition between NOM and MTBE for
adsorption onto the CCA granules. Fixed-bed adsorption experiments for longer run times were
performed using granular ZSM-5. The bed depth service time model (BDST) was used to
analyze the breakthrough data.
Keywords: adsorption, activated carbon, MTBE, zeolite
22
2.2 Introduction
Since the 1970‘s, methyl tertiary butyl ether (MTBE) has been widely used as a gasoline
additive in the United States, initially as an octane-enhancing replacement for lead. As a result
of the Clean Air Act (CAA) requirements in 1990, MTBE use as a fuel oxygenate increased to
higher concentrations (up to 15% by volume) [19] . More specifically, in 1995 the CAA required
that Reformulated Gasoline (RFG) meet a 2.0% (by mass) oxygen content requirement and
MTBE was the primary oxygenate used by refiners to meet this requirement [19] .
While the use of MTBE as a gasoline additive has significantly helped to reduce air
emissions of smog-forming pollutants, it has also caused widespread and serious contamination
of the nation‘s drinking water supplies. MTBE is highly soluble in water, and thus can partition
out of gasoline into water. Consequently, contamination of drinking water sources can occur in a
number of ways: leakage from gasoline storage tanks and distribution systems, spills, emissions
from marine engines into lakes and reservoirs, and to a lesser extent from air deposition. MTBE
presence in drinking water sources is of concern to the public due to its offensive taste and odor,
and because of the uncertainty regarding the level of risk to public health from the exposure to
low levels of MTBE in drinking water. Because of the above concerns, the U.S. Environmental
Protection Agency (EPA) issued a non-regulatory advisory for MTBE in drinking water.
According to the advisory, MTBE concentrations above 20–40 µg/L may cause adverse health
effects [19] .
Adsorption is a proven technology for treating water contaminated with anthropogenic
organic compounds. Granular activated carbon (GAC) is the most commonly-used adsorbent in
water treatment, and has been successfully used to remove MTBE from water. However, GAC
23
performance in removing MTBE was observed to be reduced when other synthetic organic
compounds coexist with MTBE or in the presence of natural organic matter (NOM) [3, 39-41] .
Recent studies have demonstrated the ability of powdered zeolites as successful
adsorbents for the removal of MTBE from water [9, 42-47] . However, the high friction loss
associated with passing water through powder beds precludes use of powdered adsorbents in
treatment systems. Few studies have directly evaluated granular zeolites in batch adsorption
experiments and fixed bed contactors [9] . In this work, the effectiveness of several granular
zeolites for the removal of MTBE from water was evaluated and compared with removal by CS-
1240 and a CCA. In addition, the effect of NOM on MTBE uptake was studied, and equilibrium
and kinetic parameters that describe the adsorption of MTBE onto granular zeolites were
determined.
2.3 Materials and Methods
2.3.1 Materials
The granular zeolites evaluated were Engelhard Beta (Engelhard, Iselin, NJ), Engelhard
Mordenite (Engelhard), HISIV 1000 (UOP, Des Plaines, IL), HISIV 3000 (UOP), Zeolite Y1
(Engelhard), Zeolite Y2 (Engelhard), ZSM-5 (Zeolyst, Valley Forge, PA), Zeolyst Beta
(Zeolyst), and Zeolyst Mordenite (Zeolyst). Table 2.1 lists the supplier, size, SiO2/Al2O3 ratio,
zeolite %, surface area, micropore area, external area, and pore dimensions for each zeolite. For
comparison purposes, a coconut shell GAC sample (CS-1240) obtained from Res-Kem Corp
(Media, PA) and a commercial carbon adsorbent (CCA) sample (extracted from a commercially-
available drinking water filter for residential use) were used as received. Prior to experiments,
zeolite samples were dried in an atmospheric oven at 120 oC for 10-14 hours and then samples
were kept clean and dry in a desiccator. MTBE standard solutions were prepared using purified
water from a Barnstead ROpure ST/E-pure water purification system (Barnstead/Thermolyne,
24
Dubuque, IA) and MTBE (HPLC grade; Fisher Scientific, Pittsburgh, PA). Natural organic
matter (NOM) was used as received (humic acid, Sigma-Aldrich, Saint Louis, MO).
2.3.2 Batch Adsorption Experiments
To obtain adsorption equilibrium isotherm data with the granular sorbents, aqueous phase
adsorption experiments were performed in 42 ml glass vials using a fixed sorbent/liquid ratio
(0.2 g sorbent/42 ml aqueous solution) and varied concentrations of MTBE initial solutions. In
all experiments, the vials were agitated on a fixed speed rotator at room temperature (22 ± 2 ºC)
for a minimum of 24 hours at 15 rpm, for adsorption equilibrium to be achieved. A 24 hour
equilibration time is based on kinetics testing conducted as part of this work. In addition,
previous work on powdered zeolites had shown that 24 hours is sufficient time for MTBE to
reach equilibrium [44] . Beside the adsorption experiments, control experiments with MTBE
using blanks with no adsorbent material were performed periodically and ensured that no MTBE
losses occurred during the experiments. Following adsorption, solid-liquid separation was done
by centrifugation for 10 minutes at 3000 rpm and MTBE in the aqueous supernatant samples was
quantified using gas chromatography (GC) with solid phase micro extraction (SPME). When
necessary, dilution was made in order to keep the measurements within the linear range of the
standard curves.
2.3.3 Large Diameter Fixed-Bed Adsorption Experiments
A glass column with a length of 10 cm and an internal diameter of 2.5 cm was used in the
fixed bed adsorption experiments. A digital peristaltic pump (Cole-Parmer, Vernon Hills, IL)
supplied the feed. The adsorbent material was placed in the glass column and held in place using
glass beads and glass wool. For approximately one hour, water was passed through the column at
a flow rate of 32.5 mL/min to remove air bubbles and to flush the adsorbent granules. Finally,
25
MTBE solution passed through the column at a flow rate of 32.5 ml/min and a feed
concentration of 50 µg/L.
2.3.4 Small Diameter Fixed-Bed Adsorption Experiments
Adsorption column experiments with granular ZSM-5 were performed using a glass
column (Bio-Rad Laboratories, Hercules, CA) of 1 cm internal diameter and 20 cm long with a
adjustable flow adapter to hold the packed bed in place. Experiments were performed with a
fixed solution flow rate of 5.2 ml/min, an influent MTBE concentration of 50 µg/L, and bed
heights of 6, 9, and 12 cm. Water was passed through the column at a flow rate of 5.2 mL/min
for an hour to remove air bubbles and to rinse the adsorbent particles. After flushing, MTBE
solution flowed from a Tedlar bag (SKC Inc., Eighty Four, PA) into the fixed-bed at a flow rate
of 5.2 ml/min with the use of a peristaltic pump (Cole-Parmer, Vernon Hills, IL). The use of a
Tedlar bag to contain the MTBE feed solution minimized the head space above the solution and
any potential losses due to volatilization.
Samples from both the small diameter fixed-bed adsorption experiments and the large
diameter fixed-bed adsorption experiments were collected in 42 ml glass vials at the outlet of
each column at predetermined intervals of time. Sample sizes of 18 ml were transferred from
each 42 ml vial to GC autosampler vials, isopropyl alcohol as an internal standard was added
(99.5 %, A.C.S. grade; Aldrich, Saint Louis, MO), and then the samples were analyzed using the
GC.
2.3.5 Gas Chromatography Methodology
A Combi-PAL autosampler (CTC Analytics, Zwingen, Switzerland) combined with a
solid phase microextraction (SPME) system was used to extract and concentrate MTBE prior to
GC analysis. SPME was used to extract MTBE from the aqueous phase of each sample using
26
carboxen/polydimethylsiloxane (CAR/PDMS) 85 μm film thickness fibers (Supelco, Bellefonte,
PA). The method detection limit was 1 μg/L and the average service life of the fibers was around
65 injections.
At the beginning of each analysis, the SPME fiber was conditioned in the Combi-PAL
conditioning unit for one and a half hours at 300°C. Before immersing the fiber into the aqueous
sample (for 30 minutes at 250 rpm), the sample was agitated in the Combi-PAL agitator unit for
10 minutes at 250 rpm. A GC (Series 6890N Agilent Technologies, Santa Clara, CA), equipped
with a flame ionization detector (FID) and a DB-624 capillary column 30 m in length and 317
μm in nominal diameter (J&W Scientific, Folsom, CA), was used to analyze the MTBE in
aqueous solution. The inlet and detector temperatures were 220 ºC and 250 ºC, respectively.
Nitrogen was used as the carrier gas at a constant flow of 45 ml/min. Hydrogen and air were
used to maintain the detector flame at flows of 40 and 450 ml/min, respectively. The GC oven
program was as follows: 35 ºC for 1 min, ramped to 50 ºC at 7.5 ºC/min, held for 2 min, ramped
to 90 ºC at 20 ºC/min, held for 2 min, finally ramped to 200 ºC at 40 ºC/min and held for 10 min.
The MTBE on the SPME fiber was thermally desorbed in the GC inlet using the splitless mode
at 220 ºC for 5 min followed by another 5 min of conditioning in a separate conditioning unit at
300 °C. The total desorption time of 10 min between successive injections was used to prevent
carry-over contamination problems.
2.4 Results & Discussion
2.4.1 MTBE Sorption Isotherms
Batch adsorption experiments were carried out using select granular zeolite samples
(Table 2-1), coconut shell GAC (CS-1240) sample, and CCA sample. Figure 2-1 shows MTBE
sorption isotherms at room temperature for the granular zeolites listed in Table 2-1. The MTBE

27
aqueous phase concentrations spanned over a wide range (up to 100 mg/L), which might be
encountered in a significant MTBE spill and in impacted drinking water sources.
MTBE sorption isotherms were fitted to the Langmuir and Freundlich equilibrium
models and the parameters for both models are summarized in Table 2-2. The Langmuir
adsorption isotherm model is frequently used to describe adsorption data and is written as
e
ee
bC
bCq
1
Q a, where qe (mg/g) is the mass of solute adsorbed per unit mass of adsorbent at
equilibrium, Ce (mg/L) is the aqueous-phase concentration, and Qa (mg/g) and b (L/mg) are
coefficients related to the properties of the adsorbent [48] . The Freundlich isotherm model has
the following form n
efe CKq /1 where Kf and (1/n) are characteristic constants [48] .
Table 2-2 clearly shows that both the Langmuir and Freundlich isotherm models were
appropriate in describing the equilibrium as reflected by the high values for the correlation
coefficients, R2. In comparison with other studies, the Freundlich isotherm parameters found in
this work for mordenite (Engelhard) (Kf = 0.0011 (mg/g)/(µg/L)1/n
, 1/n = 0.7) were different than
those reported by Hung et al. [39] (Kf = 0.14 (mg/g)/(µg/L)1/n
, 1/n = 0.65). Specifically, the value
for Kf, a measure of the adsorbent capacity, in this work was found to be over two orders of
magnitude lower than found by Hung et al. [39] (0.0011 vs. 0.14) for MTBE adsorption to
mordenite. In addition, the Freundlich isotherm parameters for HISIV 3000 (Kf = 0.03
(mg/g)/(µg/L)1/n
, 1/n = 0.57) were different from those found by Rossner and Knappe [9] (Kf =
0.212 (mg/g)/(µg/L)1/n
, 1/n = 0.87) in that the value for Kf was found to be about one magnitude
low than that reported by them. The difference in results could be due to the broader
concentration range employed in this study (1,000-100,000 µg/L) which was much greater than
that used by Hung et al. and Rossner & Knappe (0.1-1,000 µg/L). The data in the high

28
concentration range (1-100 mg/L) showed that ZSM-5, a silicalite zeolite, had the highest
adsorption capacity for MTBE among the other zeolites tested. HISIV 3000 which is also a
silicalite zeolite was the second most effective adsorbent for MTBE in this range. The high
sorption capacity of ZSM-5 and HISIV 3000 for MTBE could be attributed to their high silica
content which creates hydrophobic surfaces within the pores of the adsorbent making it a
favorable environment for adsorption of organic molecules. Figure 2-1 also shows that in this
high concentration range, zeolite beta (with pore dimensions in the range of 6.6-7.7 Å [49] ) was
better able to remove MTBE from water than mordenite (with pore dimensions of 6.5 x 7.0 Å
[49] ). The Freundlich isotherm parameter, Kf, which is primarily related to the specific capacity
of the adsorbent for the adsorbate, correlated very well with the above results in that it would be
expected that a greater capacity would be associated with a larger Kf value (Table 2-2). The other
three materials (HISIV 1000, zeolite Y1, and zeolite Y2) had minimal capacities for MTBE. The
low affinity of organics for zeolite Y has been previously noticed. For example, Anderson [43]
found that zeolite Y removed only 5% of MTBE in solution. Anderson attributed his findings to
both the large pore size and the high Al content of zeolite Y compared to other zeolites looked at
[43] . Erdem-Senatalar et al. [44] observed that dealuminated zeolite Y (DAY) was ineffective
in removing MTBE from water at low concentrations. Knappe et al. [50] reported negligible
adsorption capacities of zeolite Y. And Giaya et al. [51] observed the same phenomenon for
TCE sorption on DAY. Giaya and Thompson [52, 53] and Fleys et al. [54] suggested from
simulations that the poor efficiency of zeolite Y for removing TCE from aqueous solution was
likely due to the presence of liquid water in the large pores of zeolite Y.
MTBE adsorption isotherms at room temperature and at low range of MTBE aqueous
phase concentrations (0-1 mg/L in Figure 2-1), were obtained using the following granular
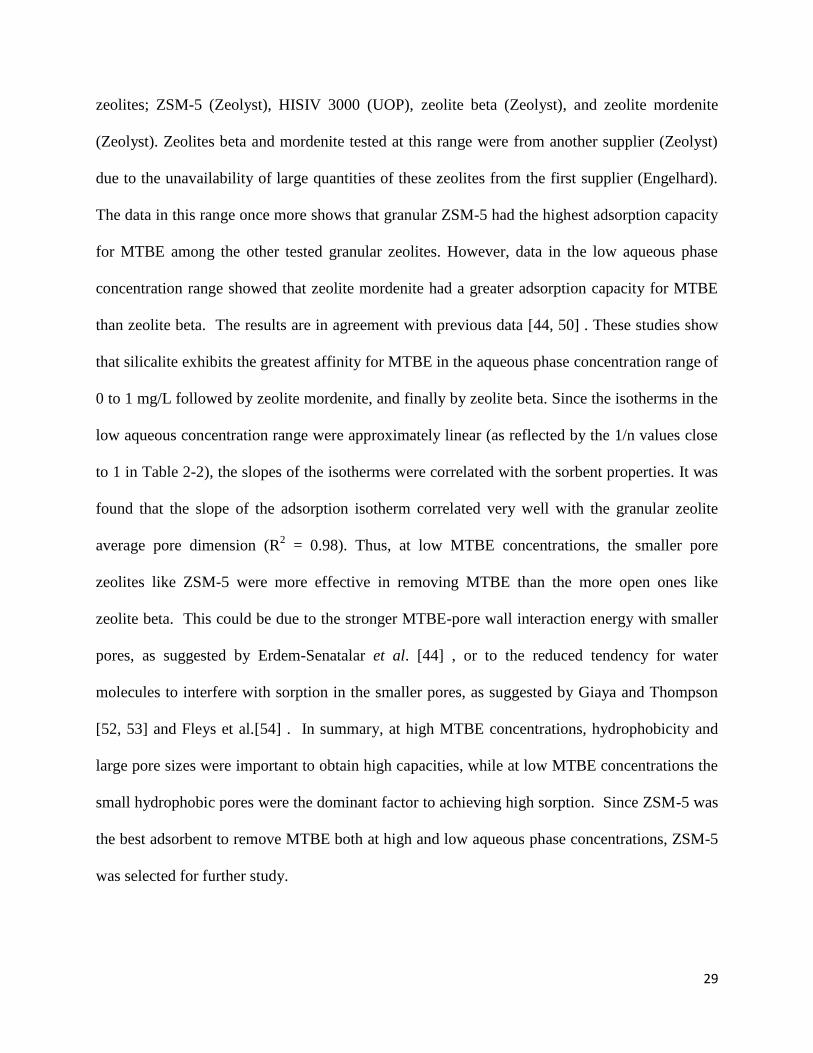
29
zeolites; ZSM-5 (Zeolyst), HISIV 3000 (UOP), zeolite beta (Zeolyst), and zeolite mordenite
(Zeolyst). Zeolites beta and mordenite tested at this range were from another supplier (Zeolyst)
due to the unavailability of large quantities of these zeolites from the first supplier (Engelhard).
The data in this range once more shows that granular ZSM-5 had the highest adsorption capacity
for MTBE among the other tested granular zeolites. However, data in the low aqueous phase
concentration range showed that zeolite mordenite had a greater adsorption capacity for MTBE
than zeolite beta. The results are in agreement with previous data [44, 50] . These studies show
that silicalite exhibits the greatest affinity for MTBE in the aqueous phase concentration range of
0 to 1 mg/L followed by zeolite mordenite, and finally by zeolite beta. Since the isotherms in the
low aqueous concentration range were approximately linear (as reflected by the 1/n values close
to 1 in Table 2-2), the slopes of the isotherms were correlated with the sorbent properties. It was
found that the slope of the adsorption isotherm correlated very well with the granular zeolite
average pore dimension (R2 = 0.98). Thus, at low MTBE concentrations, the smaller pore
zeolites like ZSM-5 were more effective in removing MTBE than the more open ones like
zeolite beta. This could be due to the stronger MTBE-pore wall interaction energy with smaller
pores, as suggested by Erdem-Senatalar et al. [44] , or to the reduced tendency for water
molecules to interfere with sorption in the smaller pores, as suggested by Giaya and Thompson
[52, 53] and Fleys et al.[54] . In summary, at high MTBE concentrations, hydrophobicity and
large pore sizes were important to obtain high capacities, while at low MTBE concentrations the
small hydrophobic pores were the dominant factor to achieving high sorption. Since ZSM-5 was
the best adsorbent to remove MTBE both at high and low aqueous phase concentrations, ZSM-5
was selected for further study.
30
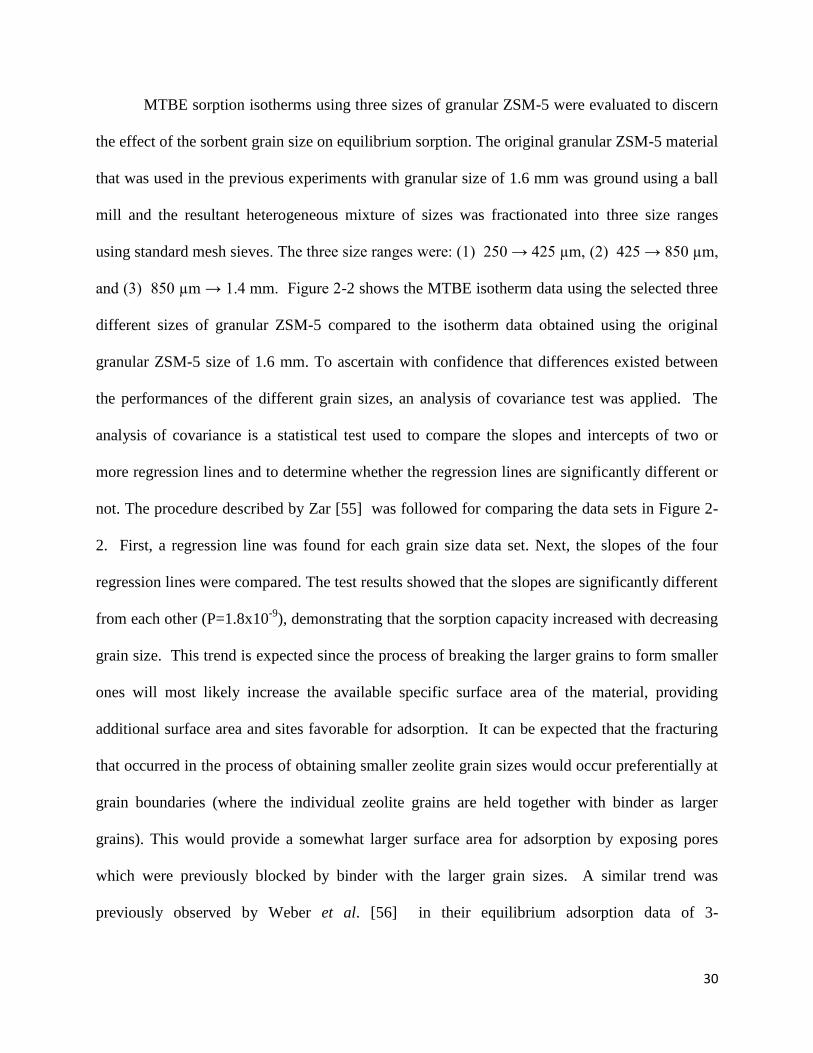
MTBE sorption isotherms using three sizes of granular ZSM-5 were evaluated to discern
the effect of the sorbent grain size on equilibrium sorption. The original granular ZSM-5 material
that was used in the previous experiments with granular size of 1.6 mm was ground using a ball
mill and the resultant heterogeneous mixture of sizes was fractionated into three size ranges
using standard mesh sieves. The three size ranges were: (1) 250 → 425 µm, (2) 425 → 850 µm,
and (3) 850 µm → 1.4 mm. Figure 2-2 shows the MTBE isotherm data using the selected three
different sizes of granular ZSM-5 compared to the isotherm data obtained using the original
granular ZSM-5 size of 1.6 mm. To ascertain with confidence that differences existed between
the performances of the different grain sizes, an analysis of covariance test was applied. The
analysis of covariance is a statistical test used to compare the slopes and intercepts of two or
more regression lines and to determine whether the regression lines are significantly different or
not. The procedure described by Zar [55] was followed for comparing the data sets in Figure 2-
2. First, a regression line was found for each grain size data set. Next, the slopes of the four
regression lines were compared. The test results showed that the slopes are significantly different
from each other (P=1.8x10⁻⁹
), demonstrating that the sorption capacity increased with decreasing
grain size. This trend is expected since the process of breaking the larger grains to form smaller
ones will most likely increase the available specific surface area of the material, providing
additional surface area and sites favorable for adsorption. It can be expected that the fracturing
that occurred in the process of obtaining smaller zeolite grain sizes would occur preferentially at
grain boundaries (where the individual zeolite grains are held together with binder as larger
grains). This would provide a somewhat larger surface area for adsorption by exposing pores
which were previously blocked by binder with the larger grain sizes. A similar trend was
previously observed by Weber et al. [56] in their equilibrium adsorption data of 3-
31
dodecylbenzenesulfonate on three different sizes of Columbia carbon at 30°C. Due to the
superior performance, granular ZSM-5 with the smallest particle grain size (250 → 425 µm) was
used in the remaining tests.
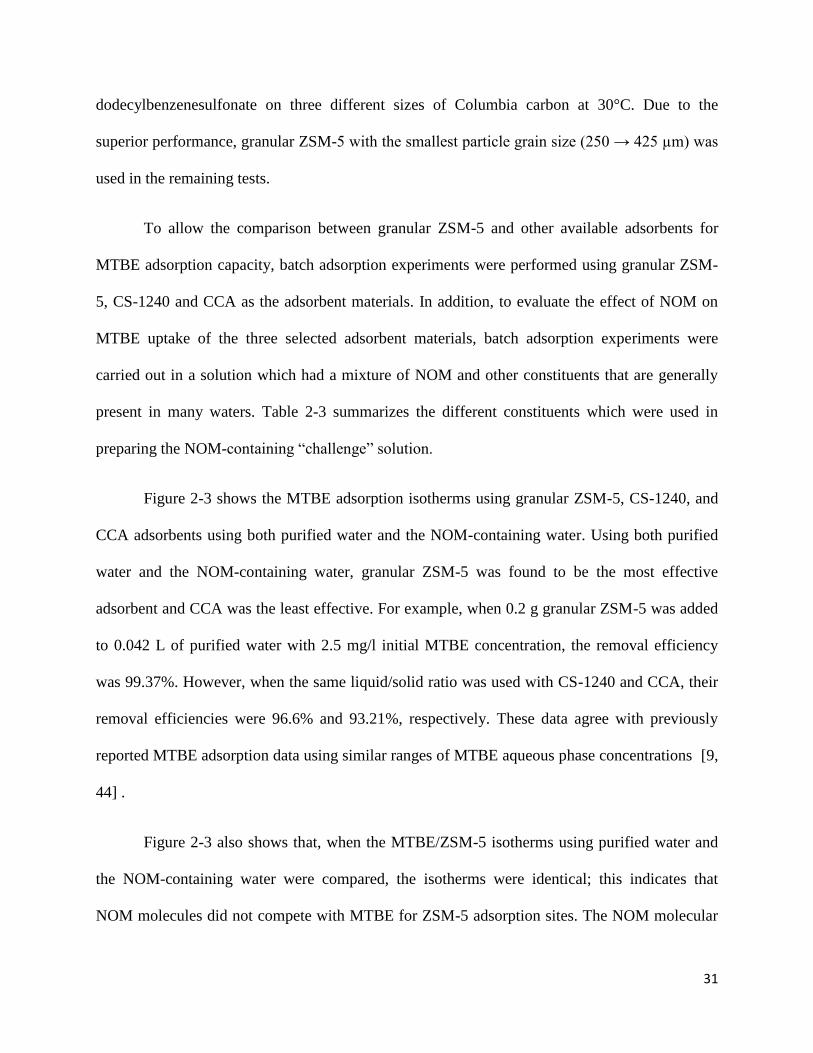
To allow the comparison between granular ZSM-5 and other available adsorbents for
MTBE adsorption capacity, batch adsorption experiments were performed using granular ZSM-
5, CS-1240 and CCA as the adsorbent materials. In addition, to evaluate the effect of NOM on
MTBE uptake of the three selected adsorbent materials, batch adsorption experiments were
carried out in a solution which had a mixture of NOM and other constituents that are generally
present in many waters. Table 2-3 summarizes the different constituents which were used in
preparing the NOM-containing ―challenge‖ solution.
Figure 2-3 shows the MTBE adsorption isotherms using granular ZSM-5, CS-1240, and
CCA adsorbents using both purified water and the NOM-containing water. Using both purified
water and the NOM-containing water, granular ZSM-5 was found to be the most effective
adsorbent and CCA was the least effective. For example, when 0.2 g granular ZSM-5 was added
to 0.042 L of purified water with 2.5 mg/l initial MTBE concentration, the removal efficiency
was 99.37%. However, when the same liquid/solid ratio was used with CS-1240 and CCA, their
removal efficiencies were 96.6% and 93.21%, respectively. These data agree with previously
reported MTBE adsorption data using similar ranges of MTBE aqueous phase concentrations [9,
44] .
Figure 2-3 also shows that, when the MTBE/ZSM-5 isotherms using purified water and
the NOM-containing water were compared, the isotherms were identical; this indicates that
NOM molecules did not compete with MTBE for ZSM-5 adsorption sites. The NOM molecular
32
size is expected to be much larger than the pore size of ZSM-5 and hence, the NOM molecules
are excluded from the ZSM-5 pores [57] . Gonzalez-Olmos et al. came to the same conclusion in
their work on the degradation of MTBE with hydrogen peroxide, catalyzed by the iron-
containing zeolite (Fe-ZSM-5) in the presence of humic acid [58] . They found that 100 mg/L
humic acid did not significantly affect the performance of Fe-ZSM-5 as a catalyst [58] .In
addition, the MTBE/CS-1240 isotherm data using purified water and NOM-containing water
were identical, suggesting that MTBE adsorbs much stronger to the sites of CS-1240 than NOM
in the MTBE concentration range investigated in this work. This finding is in contrast to several
previous studies with GAC which showed that NOM decreased the rate of adsorption of MTBE
to GAC and its capacity for MTBE [9, 39-41] . The reason for these discrepancies among
MTBE/GAC systems could be due to differences in the types and concentrations of NOM used,
the specific type of GAC and its pore size distribution, and the MTBE concentrations considered
[39] . On the other hand, the adsorption of MTBE onto CCA was lowered in the presence of
NOM, especially at the higher MTBE aqueous phase concentrations. This result is in agreement
with previous studies which showed that GAC performance for MTBE removal from water was
adversely affected by the presence of NOM in water [39-41] . For example, Shih et al. [3]
suggested that NOM can reduce GACs adsorption capacity for trace organics by pore blockage
or by the competition between NOM and the target organics for adsorption sites, thus reducing
the total available adsorption sites.
2.4.2 MTBE Fixed-Bed Adsorption
Adsorption of MTBE onto granular ZSM-5, coconut shell GAC (CS-1240), and CCA
material was evaluated using a fixed bed contactor with a length of 10 cm and an internal
diameter of 2.5 cm. The adsorption experiments were carried out in the up-flow direction using a
flow rate of 32.5 ml/min, and a feed MTBE concentration of 50 µg/L. Breakthrough curves
33
generated from MTBE adsorption experiments using the three adsorbent materials are shown in
Figure 2-4. The results show that the CCA material was the first adsorbent to allow
breakthrough, retaining almost no MTBE, followed by CS-1240, and lastly by granular ZSM-5.
The results were used to determine the adsorbent utilization rate (AUR), which is defined as the
mass of adsorbent used per volume of liquid treated at breakthrough for granular ZSM-5, CS-
1240, and CCA using a 10% MTBE breakthrough criterion which corresponds to an effluent
MTBE concentration of 5 µg/L. It was found that the utilization rate for CS-1240 is 10 times
that of granular ZSM-5 and the utilization rate for CCA is 12 times that of granular ZSM-5.
These results are in agreement with the AURs obtained by Rossner and Knappe [9] , for
which they found that silicalite had the smallest AUR and GAC had the greatest AUR among the
adsorbents that they tested. In this work, trends in removal efficiency found from equilibrium
and kinetic studies on the three tested adsorbents were in agreement, and they verify that
granular ZSM-5 is more efficient in removing MTBE from water than CS-1240 and CCA
materials tested.
To further understand and predict the fixed bed adsorber dynamics of MTBE adsorption
onto granular ZSM-5, and to facilitate the design of a full-scale fixed-bed adsorber system using
granular ZSM-5, fixed bed adsorption experiments providing for longer times before
breakthrough were performed using smaller diameter adsorption columns with variable lengths.
These columns had an internal diameter of 1 cm and length of 20 cm. In order to keep the
superficial velocity identical to the previous experiments (6.62 cm/min), the smaller diameter
columns were operated at a lower flow rate (5.2 ml/min). Granular ZSM-5 with particle diameter
250 → 425 µm was evaluated with a fixed MTBE influent concentration of 50 µg/L, and 6, 9,
and 12 cm bed depths.
34
The breakthrough curves are shown in Figure 2-5. Considering the same breakthrough
criterion as for previous experiments, it can be seen from Figure 2-5 that the granular ZSM-5 bed
with 6 cm depth reached the breakthrough point in less than 10 days. However, it took the ZSM-
5 bed with 12 cm depth more than 40 days to reach the breakthrough point. It was expected that
the bed with the shortest length would breakthrough first, since it had a smaller amount of
adsorbent mass compared to the longer beds and hence, this bed will have the least available
adsorption sites. To evaluate the effect of bed depth on the breakthrough time, the breakthrough
data were interpreted using the Bed Depth Service Time (BDST) model.
The BDST model was originally proposed by Bohart and Adams [59] and later
linearized by Hutchins [60] . The model assumes that the adsorption zone is moving at a constant
speed along the column. Thus, the bed adsorption capacity, N0, will be constant throughout the
bed and a linear relationship between the bed depth and service time should be obtained. With
this assumption the linearized model by Hutchins works well, and offers a simple approach for
analyzing fixed-bed adsorption data and determining adsorption column design parameters for
changes in the system parameters such as flow rate and initial concentrations [61, 62] .
However, some researchers found that the linear BDST model with constant N0 was
unable to explain their experimental data and they extended the BDST model to account for
changes in the bed capacity as a result of changes in the service time [62, 63] . The proposed
relation between bed capacity and service time shows a root-time dependence characteristic of
diffusional mass transfer-limited adsorption [62] . The BDST technique requires three column
tests with three different bed depths to collect the necessary data. The BDST model has been
widely applied in the literature to predict the performance of fixed-bed adsorbers for the removal
of heavy metals [62, 64, 65] such as arsenic, lead, nickel, manganese, iron, cadmium, and

35
copper, and for the removal of acid & base dyes from water [63, 66] . However, some studies
have applied the BDST model for organics removal from water [4, 60, 61, 67, 68] .
The simplified equation of Bohart and Adams model is as follows [60] :
1
C
Cln
C
1Z
uC
Nt
b
0
00
0
k (1)
Where C0 is the influent solute concentration (g/L), Cb is the effluent solute concentration
at breakthrough (g/L), N0 is the dynamic adsorption capacity (g/L), k is the adsorption rate
constant (L/g·min), Z is the bed depth (cm), u is the linear flow rate (cm/min), and t is the
service time at breakthrough (min). Equation 1 can be used to determine the service time, t, of a
column of bed depth Z, given the values of N0, C0, and k.
Equation 1, plotted as t vs. Z, has the form of a straight line where the slope is uC
N
0
0
and the intercept is
1
C
Cln
C
1
b
0
0k
Figure 2-6 shows the BDST curves evaluated at three different MTBE breakthrough
concentrations; 2.5, 5, and 7 g/L. The three breakthrough points correspond to 95%, 90%, and
86% removal percentages, respectively. The results indicated a decline in the slopes of the BDST
curves with increasing removal percentages of MTBE, and consequently lower values of N0.
With the increase in removal percentage, the effluent requirements become more stringent and
result in lower adsorbed MTBE mass per unit volume of adsorbent values. Additionally, Table 2-
4 shows that for the same flow rate, the dynamic adsorption capacity (N0), the adsorbent service

36
time, and treated water volumes were all reduced with increased removal percentages. The
results indicate that for the same bed, greater removal percentages are associated with higher
operating costs as a result of the reduced treated water volumes and more frequent bed
regeneration. On the other hand, critical bed depths (Z0), which represent the minimum depths of
adsorbent required to achieve the effluent criterion (Cb) and which can be calculated from the
lines best fitting equations by letting t = 0 and solving for Z, were found to increase with
increasing MTBE removal percentages, as shown in Table 2-4.
2.5 Conclusions
Several granular zeolites were evaluated for the removal of MTBE from water using
batch adsorption experiments from low (µg/L) to high (mg/L) solution concentrations. ZSM-5
granular zeolite had the highest adsorption capacity at the low and high range of concentrations
compared with the other granular zeolites tested. At high MTBE concentrations, hydrophobicity
and large pore sizes were found to be the important factors to obtain high capacities, while at low
MTBE concentrations, the small pore sizes were the dominant factor to achieving high sorption.
MTBE adsorption isotherms on granular ZSM-5 were compared to the MTBE adsorption
isotherms on coconut shell GAC (CS-1240) and CCA materials in the presence and absence of
NOM. Using both purified water (without NOM) and a ―challenge‖ water (amended with NOM),
granular ZSM-5 was the most effective adsorbent and CCA was the least effective. Furthermore,
in the presence of NOM, the ZSM-5 capacity for MTBE was not adversely affected, while the
adsorption capacity of CCA for MTBE was lowered. This is an indication that NOM did not
compete with MTBE for the ZSM-5 adsorption sites within the zeolite pores because of the large
37
size of the NOM molecules. However, NOM did not compete with MTBE for the CCA
adsorption sites.
Column adsorption experiments of MTBE removal from water using granular ZSM-5,
coconut shell GAC (CS-1240), and CCA material in packed beds were carried out. For the three
adsorbent materials using a flow rate of 32.5 ml/min, a feed MTBE concentration of 50 µg/L and
a 10% MTBE breakthrough criterion, CCA material was the first adsorbent to allow
breakthrough, followed by CS-1240, and lastly by granular ZSM-5. Correspondingly, the AURs
evaluated for the three adsorbents showed that the utilization rate for CS-1240 was 10 times that
of granular ZSM-5 and the exhaustion rate for CCA was 12 times that of granular ZSM-5.
To further understand and predict the fixed bed adsorber dynamics of MTBE adsorption
onto granular ZSM-5 and to evaluate the effect of bed depth on the breakthrough time, granular
ZSM-5 with particle diameters between 250 → 425 µm was evaluated with a fixed flow rate of
5.2 ml/min, a fixed influent MTBE concentration of 50 µg/L, and 6, 9, and 12 cm bed depths.
The breakthrough data were fitted to the linear BDST model which can be used to aid in full-
scale design for fixed-bed adsorbers. Overall, this research evaluated the performance of
granular ZSM-5 in batch and column experiments and showed it to be an efficient adsorbent for
the removal of MTBE from water.
2.6 Acknowledgments
The authors acknowledge the financial support from Triton Systems, Inc. of Chelmsford,
MA, and the support by the National Institutes of Health through grant 2R44 ES012784-02 (to
Triton Systems, Inc.). We appreciate the guidance provided by Arjan Giaya of Triton Systems,
Inc. We also thank Donald Pellegrino, WPI, for assistance with the lab experiments.
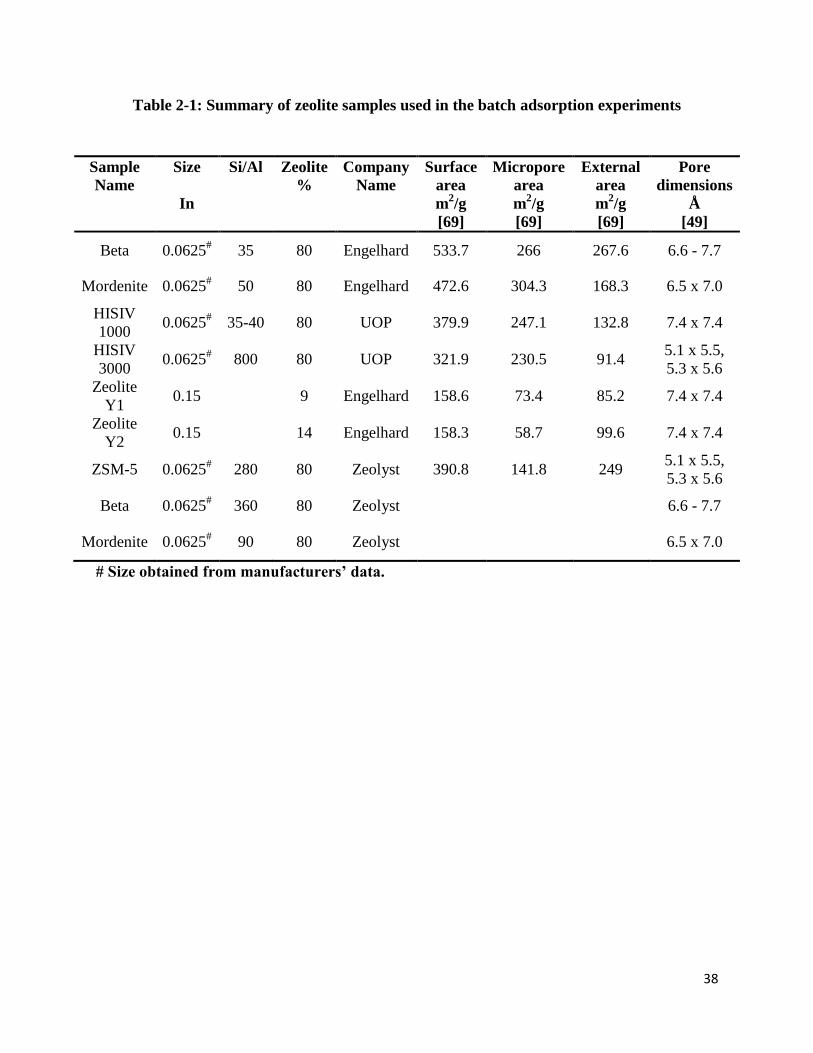
38
Table 2-1: Summary of zeolite samples used in the batch adsorption experiments
# Size obtained from manufacturers’ data.
Sample
Name
Size
In
Si/Al
Zeolite
%
Company
Name
Surface
area
m2/g
[69]
Micropore
area
m2/g
[69]
External
area
m2/g
[69]
Pore
dimensions
Å
[49]
Beta 0.0625# 35 80 Engelhard 533.7 266 267.6 6.6 - 7.7
Mordenite 0.0625# 50 80 Engelhard 472.6 304.3 168.3 6.5 x 7.0
HISIV
1000 0.0625
# 35-40 80 UOP 379.9 247.1 132.8 7.4 x 7.4
HISIV
3000 0.0625
# 800 80 UOP 321.9 230.5 91.4
5.1 x 5.5,
5.3 x 5.6
Zeolite
Y1 0.15 9 Engelhard 158.6 73.4 85.2 7.4 x 7.4
Zeolite
Y2 0.15 14 Engelhard 158.3 58.7 99.6 7.4 x 7.4
ZSM-5 0.0625# 280 80 Zeolyst 390.8 141.8 249
5.1 x 5.5,
5.3 x 5.6
Beta 0.0625# 360 80 Zeolyst 6.6 - 7.7
Mordenite 0.0625# 90 80 Zeolyst 6.5 x 7.0
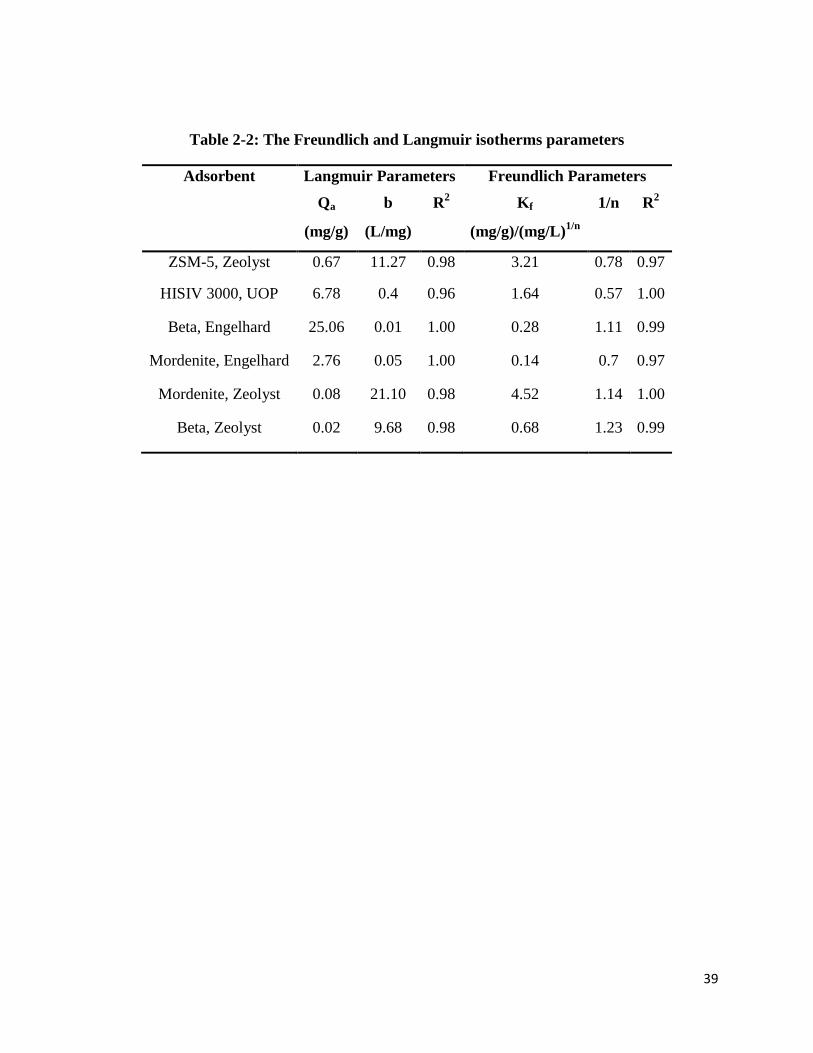
39
Table 2-2: The Freundlich and Langmuir isotherms parameters
Adsorbent Langmuir Parameters Freundlich Parameters
Qa b R2 Kf 1/n R
2
(mg/g) (L/mg) (mg/g)/(mg/L)1/n
ZSM-5, Zeolyst 0.67
11.27
0.98 3.21
0.78
0.97
HISIV 3000, UOP 6.78
0.4
0.96 1.64
0.57
1.00
Beta, Engelhard 25.06
0.01
1.00 0.28 1.11
0.99
Mordenite, Engelhard 2.76
0.05
1.00 0.14
0.7
0.97
Mordenite, Zeolyst 0.08
21.10
0.98 4.52
1.14
1.00
Beta, Zeolyst 0.02
9.68
0.98 0.68 1.23
0.99
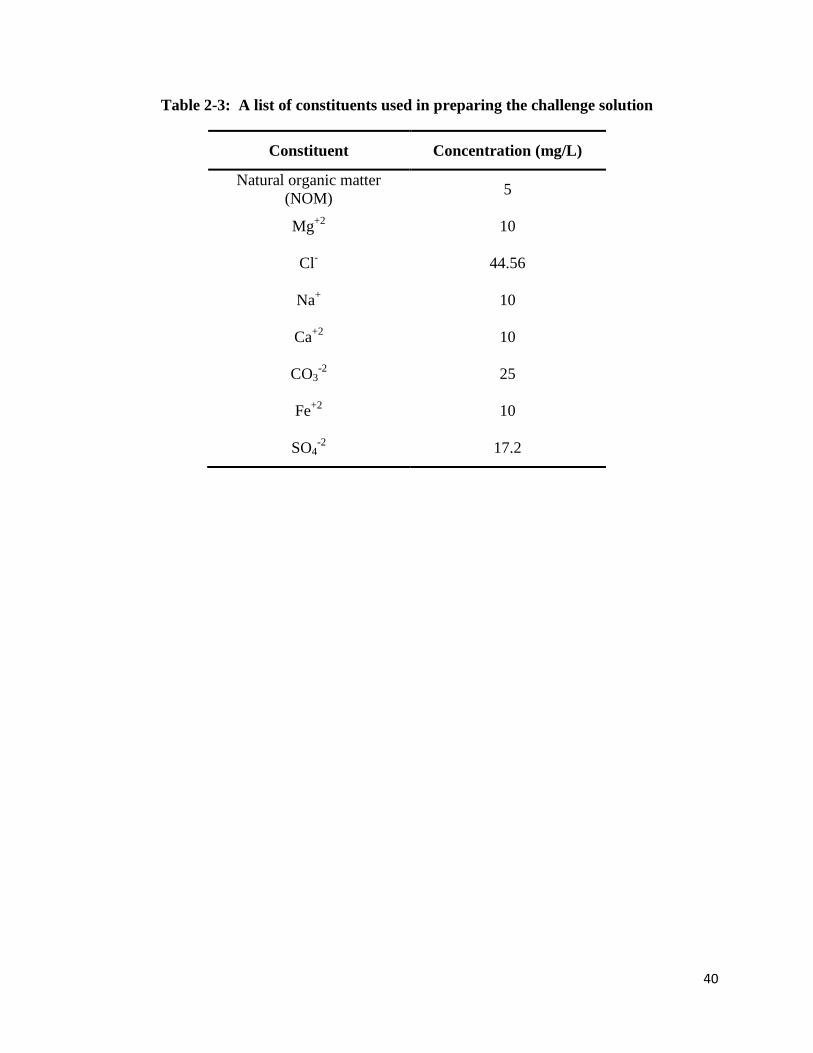
40
Table 2-3: A list of constituents used in preparing the challenge solution
Constituent Concentration (mg/L)
Natural organic matter
(NOM) 5
Mg+2
10
Cl- 44.56
Na+ 10
Ca+2
10
CO3-2
25
Fe+2
10
SO4-2
17.2
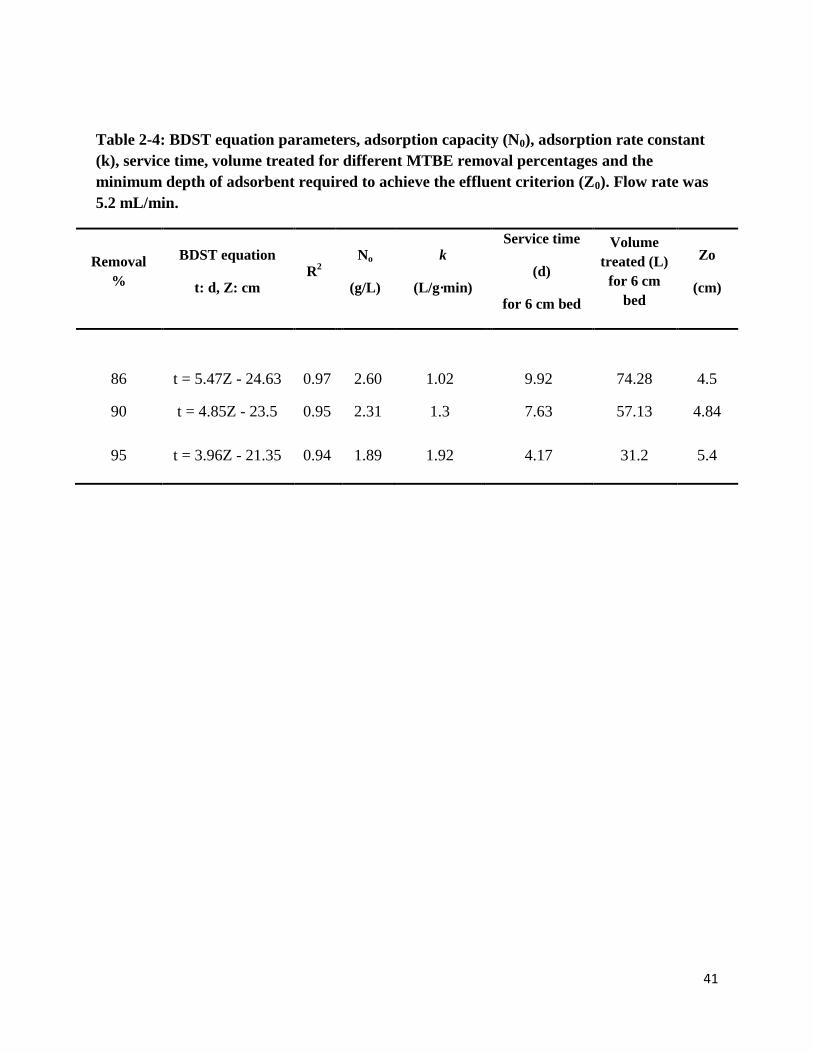
41
Table 2-4: BDST equation parameters, adsorption capacity (N0), adsorption rate constant
(k), service time, volume treated for different MTBE removal percentages and the
minimum depth of adsorbent required to achieve the effluent criterion (Z0). Flow rate was
5.2 mL/min.
Removal
%
BDST equation
t: d, Z: cm R
2
No
(g/L)
k
(L/g·min)
Service time
(d)
for 6 cm bed
Volume
treated (L)
for 6 cm
bed
Zo
(cm)
86 t = 5.47Z - 24.63 0.97 2.60 1.02 9.92 74.28 4.5
90 t = 4.85Z - 23.5 0.95 2.31 1.3 7.63 57.13 4.84
95 t = 3.96Z - 21.35 0.94 1.89 1.92 4.17 31.2 5.4
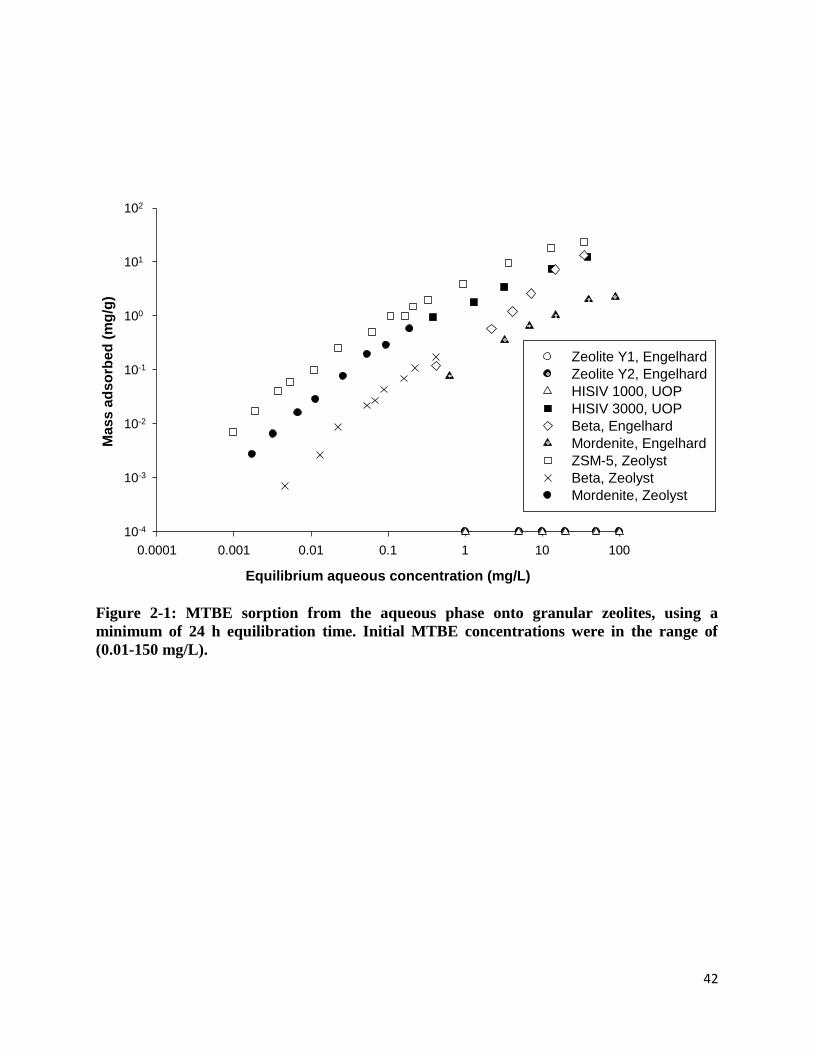
42
Equilibrium aqueous concentration (mg/L)
0.0001 0.001 0.01 0.1 1 10 100
Ma
ss
ad
so
rbe
d (
mg
/g)
10-4
10-3
10-2
10-1
100
101
102
Zeolite Y1, Engelhard
Zeolite Y2, Engelhard
HISIV 1000, UOP
HISIV 3000, UOP
Beta, Engelhard
Mordenite, Engelhard
ZSM-5, Zeolyst
Beta, Zeolyst
Mordenite, Zeolyst
Figure 2-1: MTBE sorption from the aqueous phase onto granular zeolites, using a
minimum of 24 h equilibration time. Initial MTBE concentrations were in the range of
(0.01-150 mg/L).
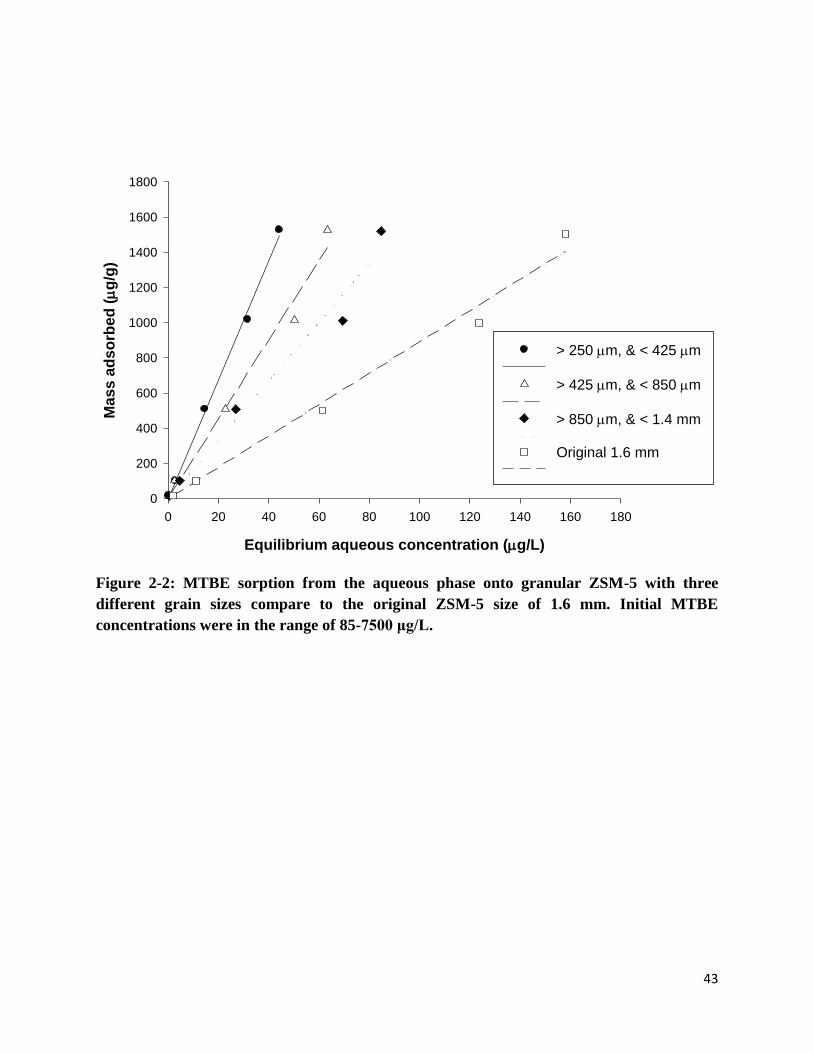
43
Equilibrium aqueous concentration (g/L)
0 20 40 60 80 100 120 140 160 180
Mass
ad
so
rbed
(
g/g
)
0
200
400
600
800
1000
1200
1400
1600
1800
> 250 m, & < 425 m
> 425 m, & < 850 m
> 850 m, & < 1.4 mm
Original 1.6 mm
Figure 2-2: MTBE sorption from the aqueous phase onto granular ZSM-5 with three
different grain sizes compare to the original ZSM-5 size of 1.6 mm. Initial MTBE
concentrations were in the range of 85-7500 μg/L.
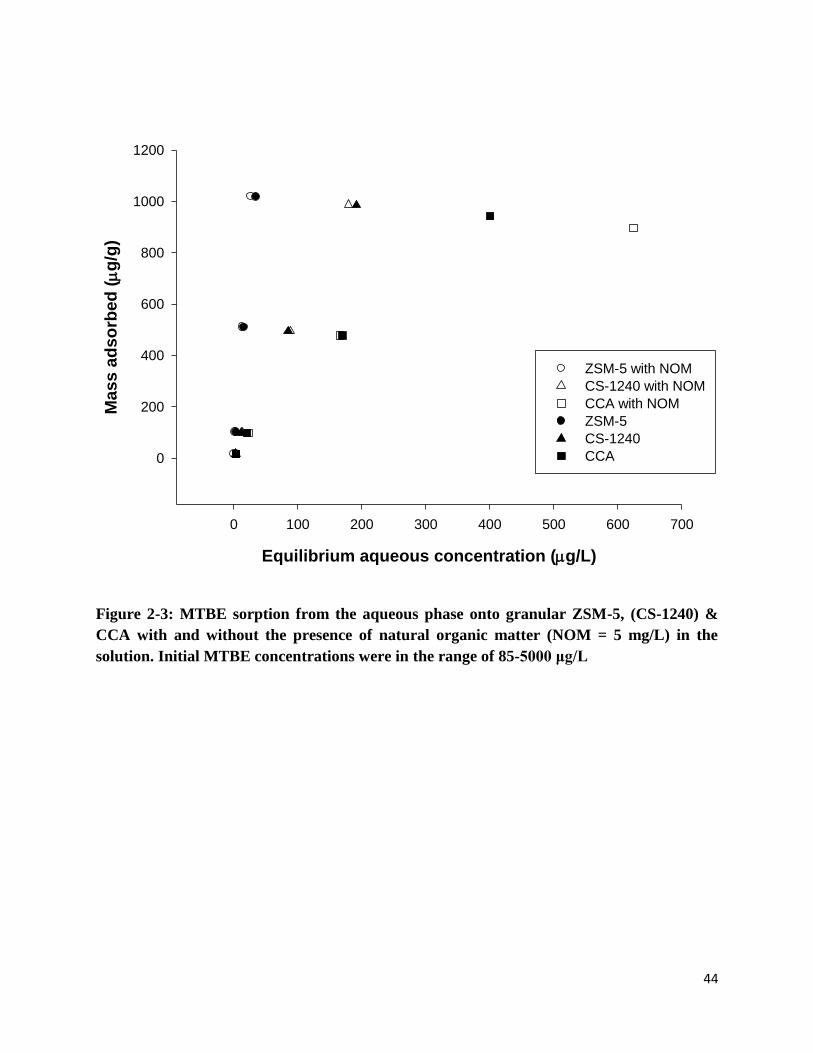
44
Equilibrium aqueous concentration (g/L)
0 100 200 300 400 500 600 700
Mass a
dso
rbed
(
g/g
)
0
200
400
600
800
1000
1200
ZSM-5 with NOM
CS-1240 with NOM
CCA with NOM
ZSM-5
CS-1240
CCA
Figure 2-3: MTBE sorption from the aqueous phase onto granular ZSM-5, (CS-1240) &
CCA with and without the presence of natural organic matter (NOM = 5 mg/L) in the
solution. Initial MTBE concentrations were in the range of 85-5000 μg/L
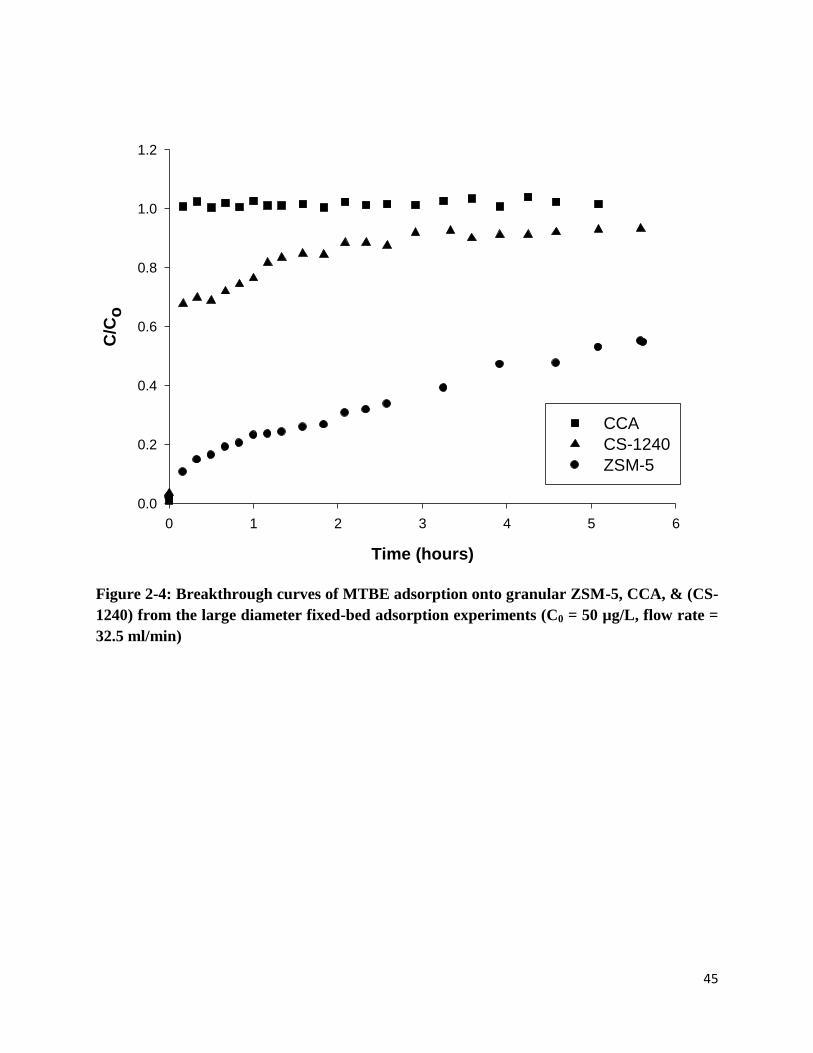
45
Time (hours)
0 1 2 3 4 5 6
C/C
o
0.0
0.2
0.4
0.6
0.8
1.0
1.2
CCA
CS-1240
ZSM-5
Figure 2-4: Breakthrough curves of MTBE adsorption onto granular ZSM-5, CCA, & (CS-
1240) from the large diameter fixed-bed adsorption experiments (C0 = 50 µg/L, flow rate =
32.5 ml/min)
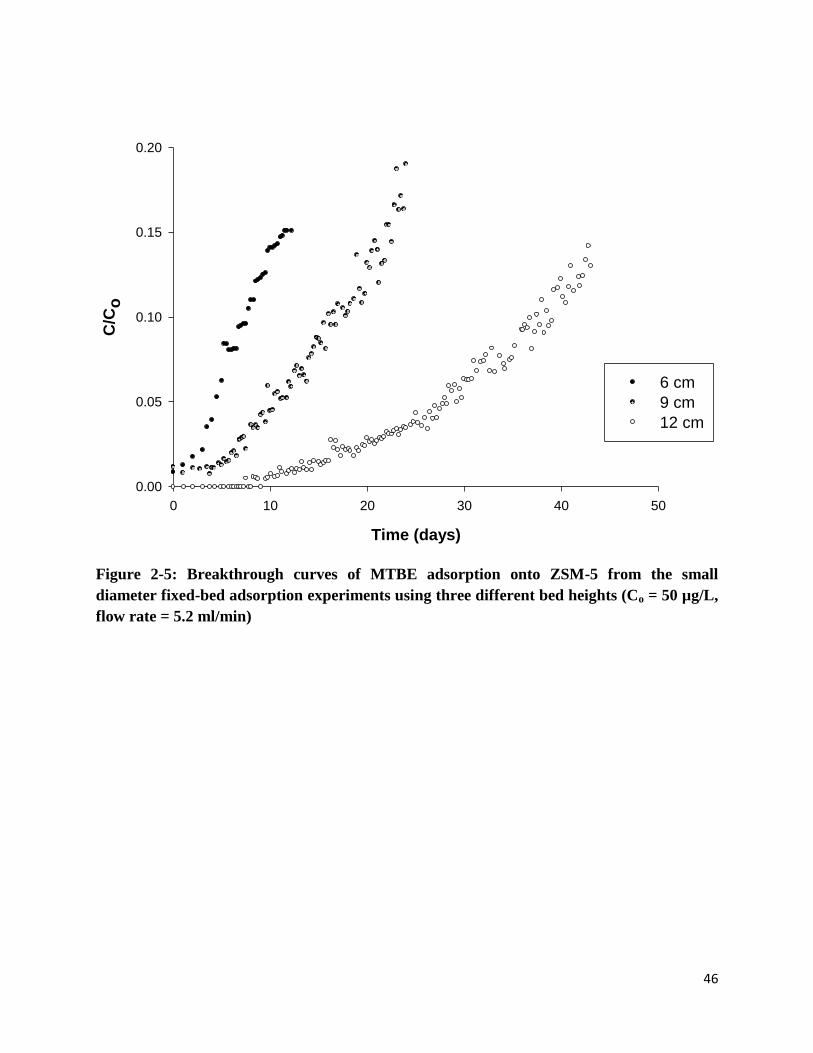
46
Time (days)
0 10 20 30 40 50
C/C
o
0.00
0.05
0.10
0.15
0.20
6 cm
9 cm
12 cm
Figure 2-5: Breakthrough curves of MTBE adsorption onto ZSM-5 from the small
diameter fixed-bed adsorption experiments using three different bed heights (Co = 50 µg/L,
flow rate = 5.2 ml/min)
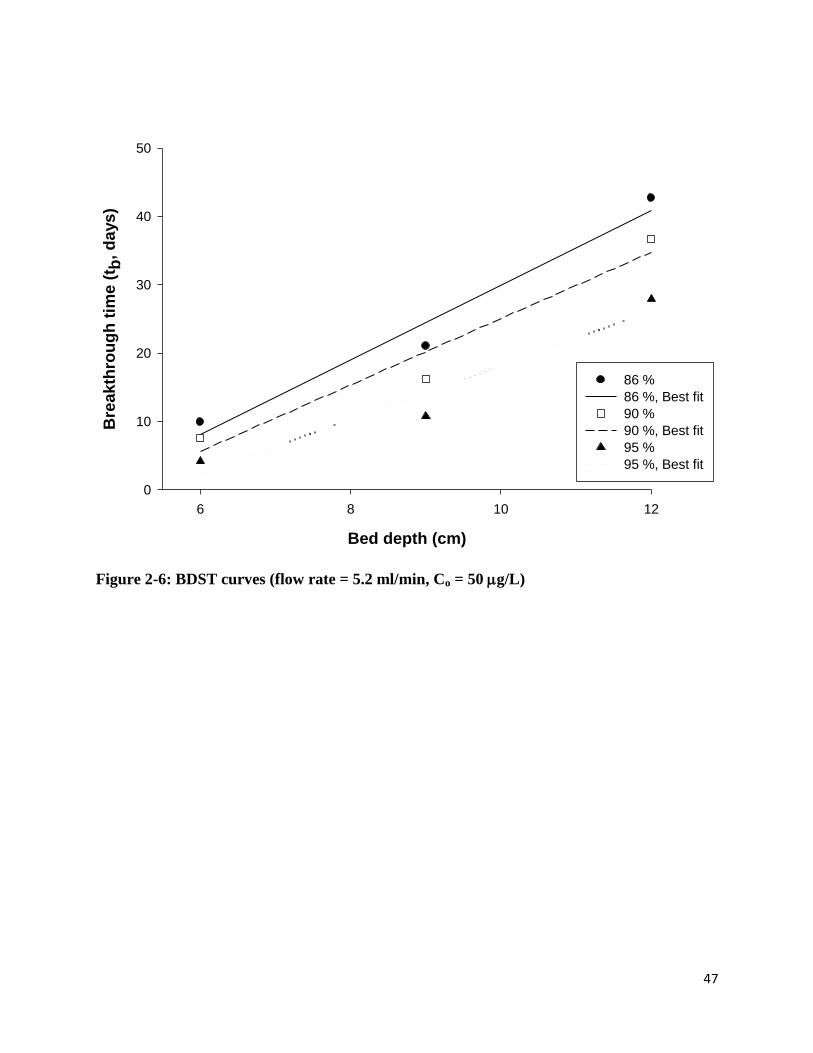
47
Bed depth (cm)
6 8 10 12
Bre
ak
thro
ug
h t
ime
(t b
, d
ays
)
0
10
20
30
40
50
86 %
86 %, Best fit
90 %
90 %, Best fit
95 %
95 %, Best fit
Figure 2-6: BDST curves (flow rate = 5.2 ml/min, Co = 50 g/L)
48
3 Removal of Chloroform from Drinking Water by Adsorption onto
Granular Zeolites
3.1 Abstract
The effectiveness of granular hydrophobic molecular zeolites for adsorption of
chloroform from water was evaluated and compared to the adsorption efficiency of a commercial
carbon adsorbent and a coconut shell granular activated carbon in batch and kinetic adsorption
studies. In addition, the effects of adsorbent grain size and humic acid on chloroform adsorption
capacity were also evaluated. It was found from the batch equilibrium experiments that granular
zeolite ZSM-5 had the greatest chloroform removal capacity among the zeolites that were
evaluated. Both batch and kinetic adsorption experiments showed that granular ZSM-5 had a
greater capacity for chloroform than the CCA and GAC. The presence of humic acid in water
did not significantly affect the ZSM-5 adsorption capacity for chloroform. Results obtained from
these fixed-bed experiments were fitted to the bed depth service time (BDST) model and kinetic
parameters obtained.
Keywords: adsorption, activated carbon, chloroform, zeolite
49
3.2 Introduction
Chlorination is the most widely used process for disinfection in drinking water treatment
plants [26] . However, chlorination can lead to the formation of organo-halides by reaction of
chlorine with natural organic matter (NOM) present in water. These organo-halides compounds
are called disinfection byproducts (DBPs) and include trihalomethanes (THMs), haloacetic acids
(HAAs), haloacetonitriles (HANs), and others [70] . Trihalomethanes (THMs) and haloacetic
acids (HAAs) are the two most commonly identified classes of DBPs in chlorinated drinking
water [71] and are regulated by the US Environmental Protection Agency [26] due to their
potential health risks.
The US EPA has set the maximum allowable annual average level of the sum of four
THMs ( i.e., chloroform (CHCl3), dichlorobromoform (CHCl2Br), dibromochloroform
(CHBr2Cl) and bromoform (CHBr3)) to 80 μg/L and has set the maximum allowable annual
average level of the sum of five HAAs (i.e., monochloro-, monobromo-, dichloro- [DCAA],
dibromo-, and trichloroacetic acid [TCAA]) to 60 μg/L [26] . In addition, the US EPA requires
the maximum residual chlorine concentration in drinking water to be below 4 mg/L [26] . These
standards are based on the importance of controlling microbial contamination and growth in
drinking water through presence of residual disinfectant while limiting the exposure to harmful
DBPs like chloroform.
In order to control or limit the formation of DBPs, several alternatives have been utilized:
(1) using alternative disinfectants that create fewer DBPs in water, (2) removing or treating
precursors to lower their concentrations prior to disinfection, and (3) subsequent treatment to
remove DBPs after their formation. Many alternative disinfectants such as ozone, ultraviolet
radiation, and chlorine dioxide have been used [72-74] , but these disinfectants are usually more
50
expensive than chlorine. Many studies have focused on the removal of natural organic matter
(NOM) to control DBP formation by enhanced coagulation [75, 76] , adsorption onto granular
activated carbon (GAC) [76-78] , or use of membrane filtration [74, 76] prior to disinfection.
Other work has focused on the removal of the DBPs [74, 77, 79, 80] . Removal of chloroform
has been achieved by adsorption onto activated carbon [74, 81, 82] , however, regeneration of
activated carbon is energy intensive [83] . Other processes such as air stripping [74] , advanced
oxidation [84] and nanofiltration [82, 85] also have been applied for the removal of chloroform
from drinking water. These processes present some disadvantages such as transferring
chloroform into air, the formation of byproducts, and the desorption of chloroform from organic
membranes [85] .
Hydrophobic zeolites with high silica content (i.e. a high Si/Al ratio) were recently
demonstrated to be successful adsorbents for the removal of a wide variety of organic
compounds from water [86-92] . Studies have focused on using powdered zeolites for the
removal of chloroform from vapor and aqueous phases [87, 93-95] . However, no research has
directly evaluated chloroform adsorption from aqueous solutions onto granular zeolites using
batch adsorption experiments and fixed bed contactors. Granular zeolites can be employed in
fixed-bed adsorbers, and due to the relatively large grain size of granular zeolites, the high
friction losses associated with passing water through beds of powdered material can be avoided.
The main objective of this work was to evaluate the effectiveness of several granular zeolites for
the removal of chloroform from water, and to compare the effectiveness of these zeolites with a
commercial carbon adsorbent material (CCA) extracted from a consumer water filtration unit and
a coconut shell granular activated carbon (GAC) material. In addition, the effect of adsorbent
51
grain size and the effect of NOM on chloroform uptake were studied. Finally, kinetic parameters
that describe granular zeolite fixed-bed adsorber performance were determined.
3.3 Materials and Methods
3.3.1 Materials
Nine types of granular zeolites were evaluated in this study: Engelhard Beta (Engelhard,
Islin, NJ), Engelhard Mordenite (Engelhard), HISIV 1000 (UOP, Des Plaines, IL), HISIV 3000
(UOP), Zeolite Y1 (Engelhard), Zeolite Y2 (Engelhard), ZSM-5 (Zeolyst, Valley Forge, PA),
Zeolyst Beta (Zeolyst), and Zeolyst Mordenite (Zeolyst). The sources and physical properties of
these are listed in Table 3-1. For comparison, a coconut shell GAC (CS-1240)( Res-Kem Corp,
Media, PA) sample and a commercial carbon adsorbent (CCA) sample extracted from a
commercially available point of use drinking water filter were also evaluated. All granular
zeolites were dried in an atmospheric oven at 120 oC for 10-14 hours and then stored in
desiccators until use. Chloroform standard solutions were prepared by adding a specified
amount of neat chloroform (ACS grade) (HACH Company, Loveland, CO) to purified water
from a Barnstead ROpure ST/E-pure water purification system (Barnstead/Thermolyne,
Dubuque, IA). Standard solutions of 1,1,2-trichloroethane as an internal standard were prepared
using a 98 % pure 1,1,2-trichloroethane (Fisher Scientific, Pittsburgh, PA). Humic acid (Sigma-
Aldrich, Saint Louis, MO) was used as the source for NOM in this study.
3.3.2 Batch Adsorption Experiments
Adsorption isotherm experiments for a wide concentration range were obtained at room
temperature (22 ± 2 ºC) using a fixed sorbent/liquid ratio (0.2 g sorbent/42 ml aqueous solution)
and varied initial chloroform concentrations. In all adsorption experiments, the vials were
52
agitated on a fixed speed rotator for a minimum of 24 hours at 15 rpm for equilibrium to be
established, following the procedure in previous work with adsorption to powdered zeolites [90]
In addition, to assure equilibrium was achieved, kinetics experiments were performed
which showed that 24 hours was a sufficient time for equilibrium to be reached with these
conditions. Following adsorption, the samples were centrifuged for 10 minutes at 3000 rpm to
ensure complete separation of the solid and aqueous phases. Then the chloroform in the aqueous
supernatant was quantified using gas chromatography as described below.
3.3.3 Fixed-Bed Adsorption Experiments
3.3.3.1 Large Diameter Fixed-Beds
The adsorption kinetics of the sorbent materials was evaluated with fixed bed column
tests using a 10 cm long glass column with an internal diameter of 2.5 cm. Each adsorbent
material was placed in the column between two layers of glass beads and glass wool. Using a
digital peristaltic pump (Cole-Parmer, Vernon Hills, IL), water was passed through the column at
a flow rate of 32.5 mL/min for at least an hour to remove air bubbles and to flush any residual
fines from the adsorbent granules. Aqueous solution spiked with 450 µg/L chloroform was then
passed through the column at a flow rate of 32.5 mL/min (empty bed flow velocity of 6.62
cm/min). Samples at the outlet of each column were collected in 42 ml glass vials at
predetermined time intervals.
3.3.3.2 Small Diameter Fixed-Beds
Additional adsorption kinetics experiments with granular ZSM-5 were performed using a
20 cm long glass column (Bio-Rad Laboratories, Hercules, CA) with an internal diameter of 1
cm and an adjustable flow adapter to hold the packed bed in place. Water was passed through the
column at a flow rate of 5.2 mL/min for an hour to remove air bubbles and to flush the adsorbent
53
particles. Adsorption experiments were performed with a flow rate of 5.2 mL/min (empty bed
flow velocity of 6.62 cm/min), an influent chloroform concentration of 450 µg/L, and bed
heights of 6, 9, and 12 cm. The influent chloroform solution was contained in a Tedlar bag
(SKC Inc., Eighty Four, PA) which minimized the head space above the solution and any
potential losses due to volatilization. Samples at the outlet of each column were collected in 42
ml glass vials at predetermined intervals of time, and analyzed with gas chromatography as
described below.
3.3.4 Gas Chromatography Methodology
Solid phase microextraction (SPME) using a Combi-PAL autosampler (CTC Analytics,
Zwingen, Switzerland) was used to extract and concentrate chloroform prior to GC analysis. The
SPME fibers were 85 μm film thickness carboxen/polydimethylsiloxane (CAR/PDMS) (Supelco,
Bellefonte, PA). Prior to each analysis, the SPME fibers were conditioned in a conditioning unit
for one and a half hours at 300°C to prevent any possible carry-over contamination. Fibers
typically were used 60 times before they were replaced. The method detection limit was 1 μg/L.
For the GC analysis, 20 ml GC vials were used and contained 18 ml of solution which
had been transferred from the 42 ml collection vials. In addition, 0.18 ml of the internal standard
solution was added. At the beginning of each analysis, each sample was agitated in the Combi-
PAL agitator unit for 10 minutes at 250 rpm, and then the SPME fiber was immersed into the
aqueous phase of the sample for 30 minutes with continued agitation. Thermal desorption of the
extracted chloroform from the SPME fiber in the GC was effected by inserting it into the GC
injector port using the splitless mode at 250 ºC for 5 min followed by another 5 min of
conditioning in the conditioning unit at 300 °C. Total desorption time of 10 min between
successive injections was used to prevent carry-over contamination problems.
54
The concentration of chloroform was measured by a GC Series 6890N (Agilent
Technologies, Santa Clara, CA) equipped with an electron capture detector (ECD) and a RTX-
5SILMS capillary column (Restek, Bellefonte, PA) 30 m in length and 320 μm in nominal
diameter. The inlet and detector temperatures were both 250 ºC. Nitrogen served as the carrier
gas and makeup gas at a constant flow of 20 ml/min. The GC oven program was as follows:
initial temperature was 35 ºC for 4 min, increased to 90 ºC at 20 ºC/min, held for 3 min, ramped
to 200 ºC at 40 ºC/min, and then held for 10 min.
3.4 Results and Discussion
3.4.1 Chloroform Adsorption Isotherms
Equilibrium sorption experiments were conducted using nine different granular zeolites
listed in Table 3-1, a coconut shell GAC (CS-1240) sample, and a CCA sample.
3.4.1.1 Chloroform Sorption onto Granular Zeolites
Chloroform adsorption isotherms onto the nine granular zeolites were obtained at room
temperature at aqueous phase concentrations up to 100 mg/L. The results are shown in Figure 3-
1. The high silica granular zeolites, ZSM-5 and silicalite HISIV 3000, had greater removal
capacities for chloroform than the other zeolites tested. ZSM-5 outperformed HISIV 3000 with
an average chloroform removal of 97% compared to 93.44 % for HISIV 3000. On the other
hand, granular zeolite Y in the three forms tested (HISIV 1000, zeolite Y1, and zeolite Y2) had
minimal capacity for chloroform, removing on average 12.4 % chloroform from solution.
The data in Figure 3-1 are in agreement with the trends observed previously by others
[87, 90, 92, 94, 96] , where the organics were found to adsorb to the greatest extent onto smaller
pore high silica zeolites, and adsorb to the least extent onto zeolite Y. For example, Koryabkina
et al. [87] found that chloroform adsorbed to a greater extent to powdered silicalite-1 than to

55
powdered dealuminated zeolite Y (DAY). Also Anderson [92] reported that zeolite Y removed
< 1% of chloroform in solution while ZSM-5 was able to remove 78 %. Erdem-Senatalar et al.
[90] noted that methyl tert butyl ether (MTBE) adsorbed the greatest to powdered silicalite-1,
while DAY was ineffective in removing MTBE from water at low concentrations. And Giaya et
al. [94] observed similar trends in the adsorption capacity of silicalite and DAY for
trichloroethylene. Finally, Tsutsumi et al. [96] found that the amount of chloroform adsorbed
from aqueous solution increased with an increase in the Si/Al ratio of the sorbents; i.e. ZSM-5
and mordenite performed better than the low Si/Al zeolites.
The poor efficiency of zeolite Y for removing organic molecules from aqueous solution
can be attributed to the presence of liquid water in the large pores of zeolite Y as was
corroborated by the computational prediction made by Giaya and Thompson [97] and Fleys et
al. [98] . It is believed that the high silica zeolites (such as HISIV 3000 and silicalite-1) provide
a favorable environment in the pores for the adsorption of organic molecules. The high silica
content (high Si/Al ratio) creates hydrophobic surfaces within the pores.
Figure 3-1 also shows that zeolite beta and mordenite had intermediate capacities for
chloroform. However, it can be seen from Figure 3-1 that granular mordenite (Zeolyst) provided
for greater removal of chloroform (67%) than granular zeolite beta (Zeolyst) (52%) in the 0-1
mg/L aqueous concentration range. In the 1-100 mg/L concentration range, zeolite beta
(Englehard) was superior to zeolite mordenite (Engelhard) in removing chloroform from solution
with average removal of 59.9 % and 36.8 %, respectively.
The higher efficiency of zeolite beta in removing chloroform from solution in the 1 –
100 mg/L range compared to zeolite mordenite could be attributed to the larger pore dimensions
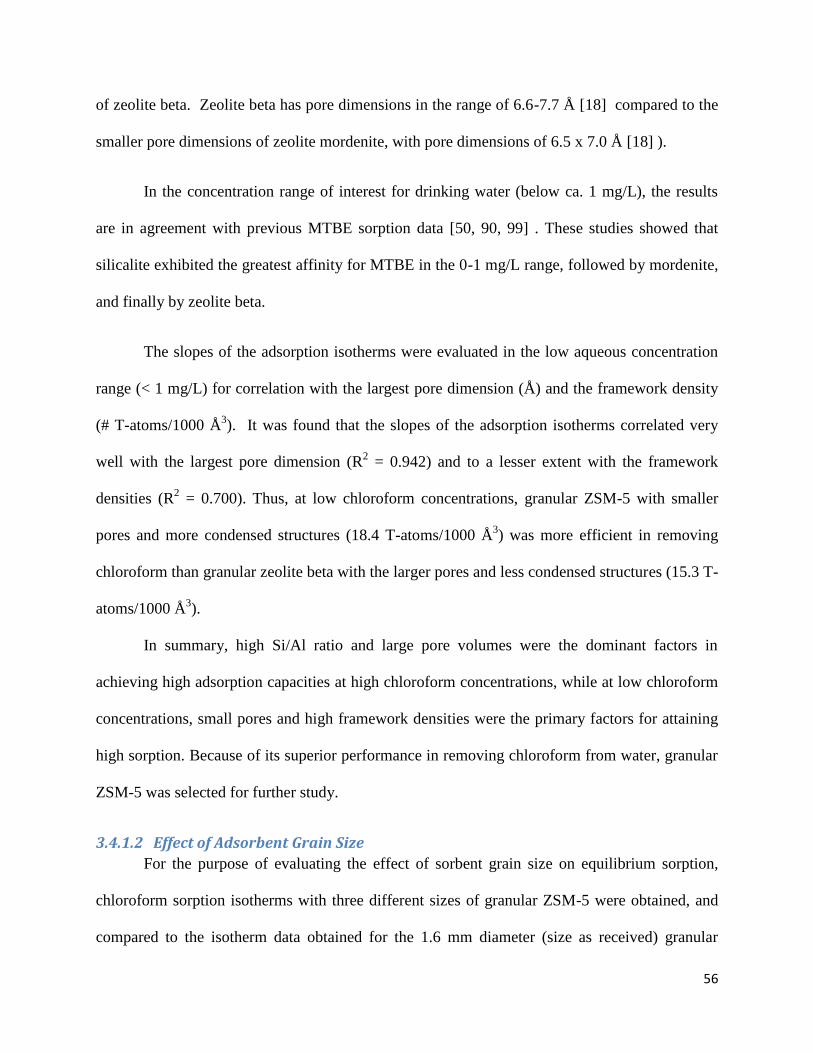
56
of zeolite beta. Zeolite beta has pore dimensions in the range of 6.6-7.7 Å [18] compared to the
smaller pore dimensions of zeolite mordenite, with pore dimensions of 6.5 x 7.0 Å [18] ).
In the concentration range of interest for drinking water (below ca. 1 mg/L), the results
are in agreement with previous MTBE sorption data [50, 90, 99] . These studies showed that
silicalite exhibited the greatest affinity for MTBE in the 0-1 mg/L range, followed by mordenite,
and finally by zeolite beta.
The slopes of the adsorption isotherms were evaluated in the low aqueous concentration
range (< 1 mg/L) for correlation with the largest pore dimension (Å) and the framework density
(# T-atoms/1000 Å3). It was found that the slopes of the adsorption isotherms correlated very
well with the largest pore dimension (R2 = 0.942) and to a lesser extent with the framework
densities (R2 = 0.700). Thus, at low chloroform concentrations, granular ZSM-5 with smaller
pores and more condensed structures (18.4 T-atoms/1000 Å3) was more efficient in removing
chloroform than granular zeolite beta with the larger pores and less condensed structures (15.3 T-
atoms/1000 Å3).
In summary, high Si/Al ratio and large pore volumes were the dominant factors in
achieving high adsorption capacities at high chloroform concentrations, while at low chloroform
concentrations, small pores and high framework densities were the primary factors for attaining
high sorption. Because of its superior performance in removing chloroform from water, granular
ZSM-5 was selected for further study.
3.4.1.2 Effect of Adsorbent Grain Size
For the purpose of evaluating the effect of sorbent grain size on equilibrium sorption,
chloroform sorption isotherms with three different sizes of granular ZSM-5 were obtained, and
compared to the isotherm data obtained for the 1.6 mm diameter (size as received) granular
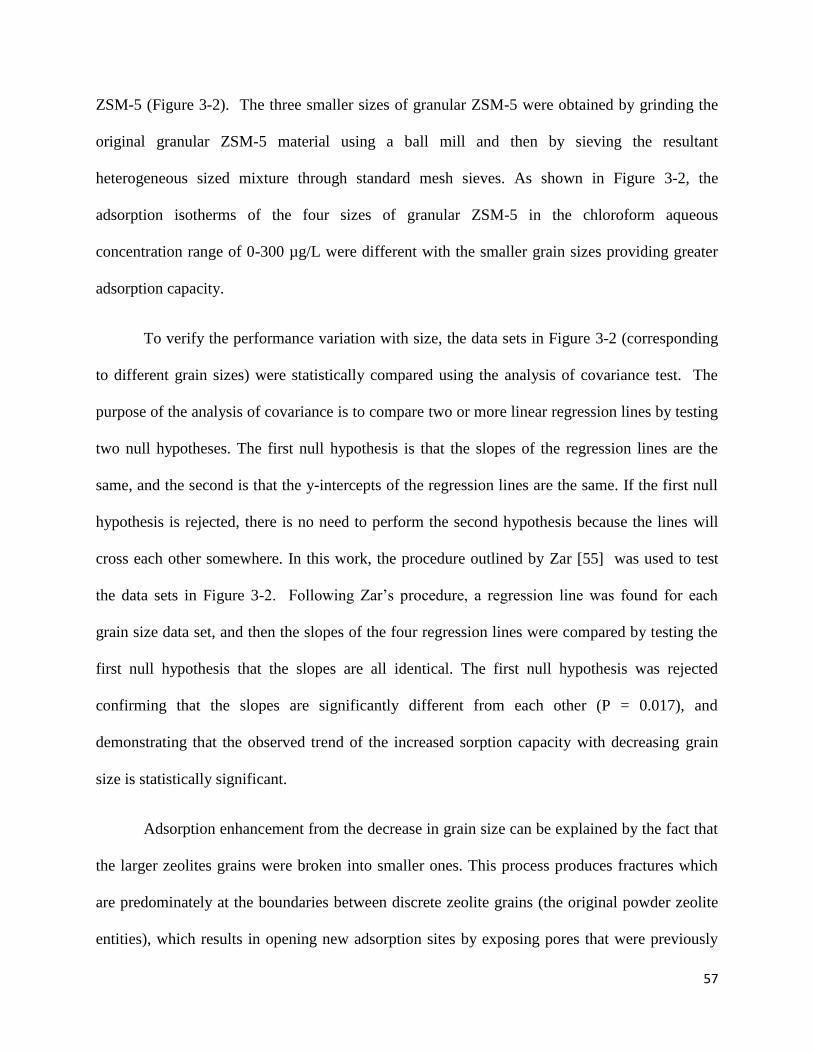
57
ZSM-5 (Figure 3-2). The three smaller sizes of granular ZSM-5 were obtained by grinding the
original granular ZSM-5 material using a ball mill and then by sieving the resultant
heterogeneous sized mixture through standard mesh sieves. As shown in Figure 3-2, the
adsorption isotherms of the four sizes of granular ZSM-5 in the chloroform aqueous
concentration range of 0-300 µg/L were different with the smaller grain sizes providing greater
adsorption capacity.
To verify the performance variation with size, the data sets in Figure 3-2 (corresponding
to different grain sizes) were statistically compared using the analysis of covariance test. The
purpose of the analysis of covariance is to compare two or more linear regression lines by testing
two null hypotheses. The first null hypothesis is that the slopes of the regression lines are the
same, and the second is that the y-intercepts of the regression lines are the same. If the first null
hypothesis is rejected, there is no need to perform the second hypothesis because the lines will
cross each other somewhere. In this work, the procedure outlined by Zar [55] was used to test
the data sets in Figure 3-2. Following Zar‘s procedure, a regression line was found for each
grain size data set, and then the slopes of the four regression lines were compared by testing the
first null hypothesis that the slopes are all identical. The first null hypothesis was rejected
confirming that the slopes are significantly different from each other (P = 0.017), and
demonstrating that the observed trend of the increased sorption capacity with decreasing grain
size is statistically significant.
Adsorption enhancement from the decrease in grain size can be explained by the fact that
the larger zeolites grains were broken into smaller ones. This process produces fractures which
are predominately at the boundaries between discrete zeolite grains (the original powder zeolite
entities), which results in opening new adsorption sites by exposing pores that were previously
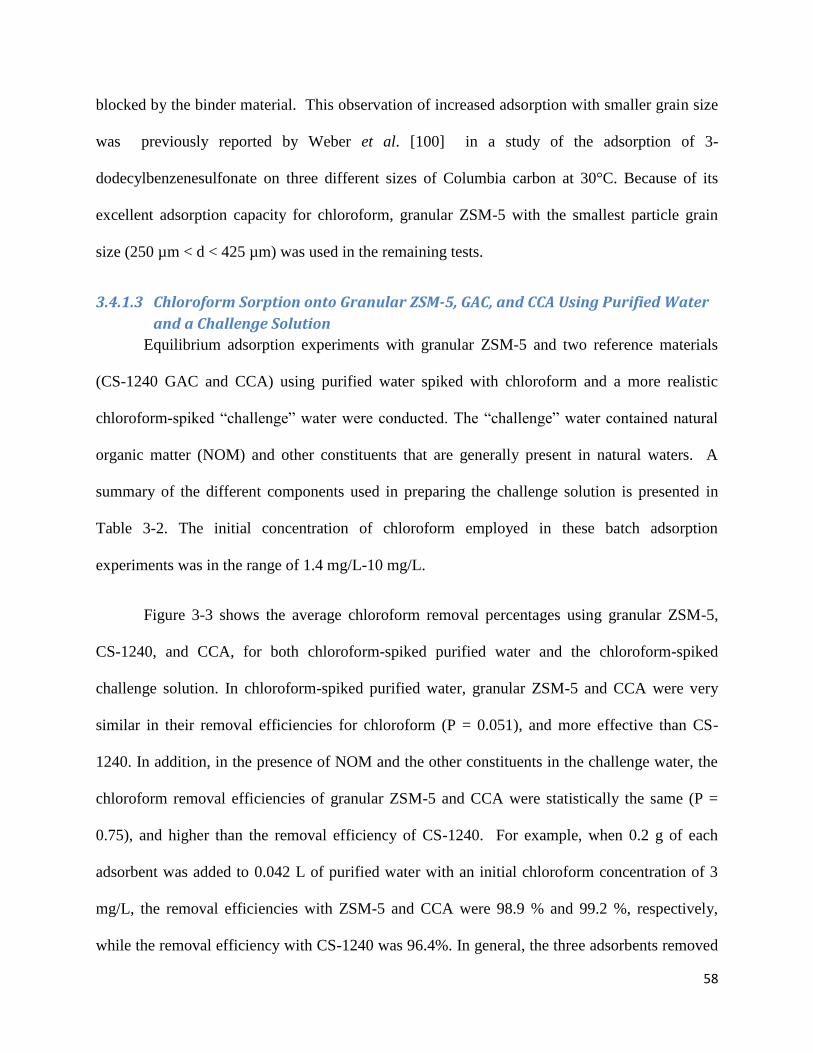
58
blocked by the binder material. This observation of increased adsorption with smaller grain size
was previously reported by Weber et al. [100] in a study of the adsorption of 3-
dodecylbenzenesulfonate on three different sizes of Columbia carbon at 30°C. Because of its
excellent adsorption capacity for chloroform, granular ZSM-5 with the smallest particle grain
size (250 µm < d < 425 µm) was used in the remaining tests.
3.4.1.3 Chloroform Sorption onto Granular ZSM-5, GAC, and CCA Using Purified Water
and a Challenge Solution
Equilibrium adsorption experiments with granular ZSM-5 and two reference materials
(CS-1240 GAC and CCA) using purified water spiked with chloroform and a more realistic
chloroform-spiked ―challenge‖ water were conducted. The ―challenge‖ water contained natural
organic matter (NOM) and other constituents that are generally present in natural waters. A
summary of the different components used in preparing the challenge solution is presented in
Table 3-2. The initial concentration of chloroform employed in these batch adsorption
experiments was in the range of 1.4 mg/L-10 mg/L.
Figure 3-3 shows the average chloroform removal percentages using granular ZSM-5,
CS-1240, and CCA, for both chloroform-spiked purified water and the chloroform-spiked
challenge solution. In chloroform-spiked purified water, granular ZSM-5 and CCA were very
similar in their removal efficiencies for chloroform (P = 0.051), and more effective than CS-
1240. In addition, in the presence of NOM and the other constituents in the challenge water, the
chloroform removal efficiencies of granular ZSM-5 and CCA were statistically the same (P =
0.75), and higher than the removal efficiency of CS-1240. For example, when 0.2 g of each
adsorbent was added to 0.042 L of purified water with an initial chloroform concentration of 3
mg/L, the removal efficiencies with ZSM-5 and CCA were 98.9 % and 99.2 %, respectively,
while the removal efficiency with CS-1240 was 96.4%. In general, the three adsorbents removed
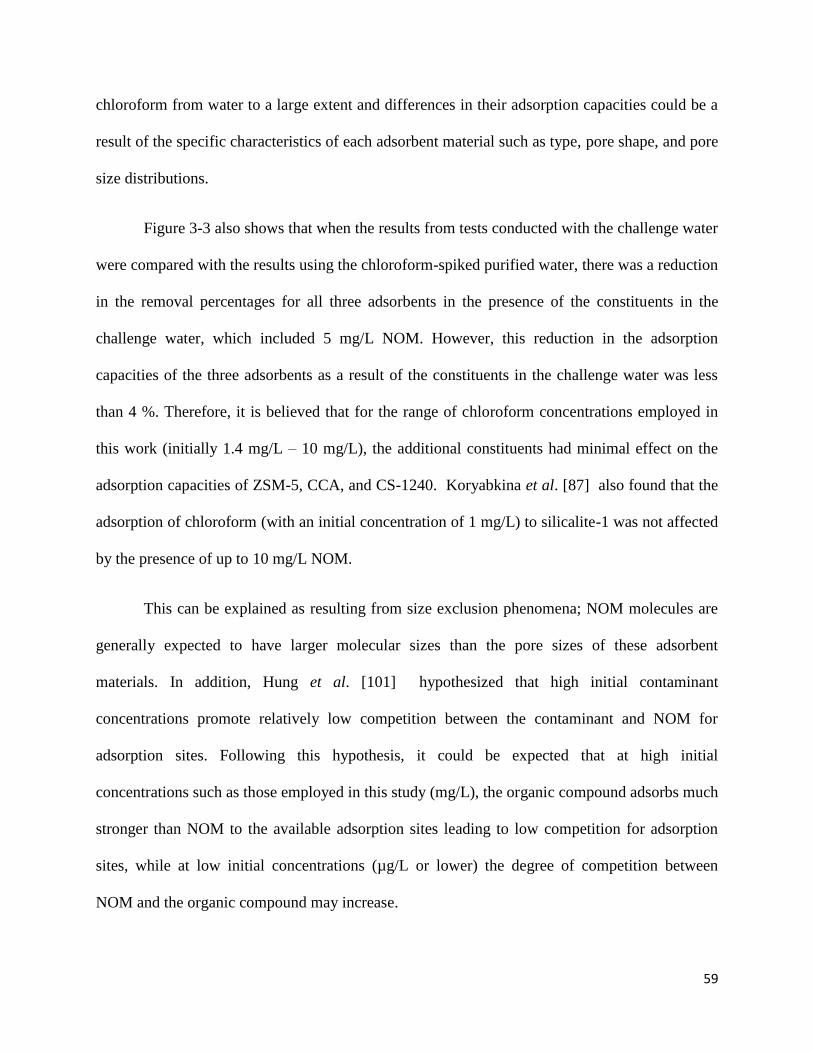
59
chloroform from water to a large extent and differences in their adsorption capacities could be a
result of the specific characteristics of each adsorbent material such as type, pore shape, and pore
size distributions.
Figure 3-3 also shows that when the results from tests conducted with the challenge water
were compared with the results using the chloroform-spiked purified water, there was a reduction
in the removal percentages for all three adsorbents in the presence of the constituents in the
challenge water, which included 5 mg/L NOM. However, this reduction in the adsorption
capacities of the three adsorbents as a result of the constituents in the challenge water was less
than 4 %. Therefore, it is believed that for the range of chloroform concentrations employed in
this work (initially 1.4 mg/L – 10 mg/L), the additional constituents had minimal effect on the
adsorption capacities of ZSM-5, CCA, and CS-1240. Koryabkina et al. [87] also found that the
adsorption of chloroform (with an initial concentration of 1 mg/L) to silicalite-1 was not affected
by the presence of up to 10 mg/L NOM.
This can be explained as resulting from size exclusion phenomena; NOM molecules are
generally expected to have larger molecular sizes than the pore sizes of these adsorbent
materials. In addition, Hung et al. [101] hypothesized that high initial contaminant
concentrations promote relatively low competition between the contaminant and NOM for
adsorption sites. Following this hypothesis, it could be expected that at high initial
concentrations such as those employed in this study (mg/L), the organic compound adsorbs much
stronger than NOM to the available adsorption sites leading to low competition for adsorption
sites, while at low initial concentrations (µg/L or lower) the degree of competition between
NOM and the organic compound may increase.
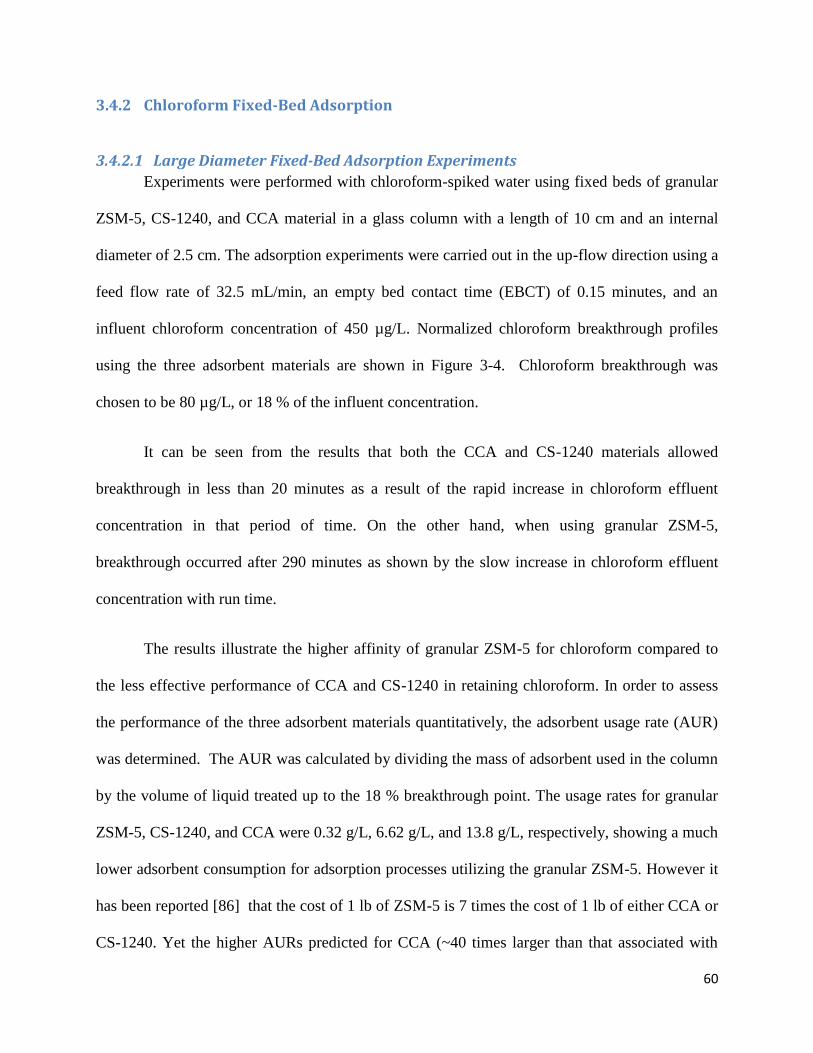
60
3.4.2 Chloroform Fixed-Bed Adsorption
3.4.2.1 Large Diameter Fixed-Bed Adsorption Experiments
Experiments were performed with chloroform-spiked water using fixed beds of granular
ZSM-5, CS-1240, and CCA material in a glass column with a length of 10 cm and an internal
diameter of 2.5 cm. The adsorption experiments were carried out in the up-flow direction using a
feed flow rate of 32.5 mL/min, an empty bed contact time (EBCT) of 0.15 minutes, and an
influent chloroform concentration of 450 µg/L. Normalized chloroform breakthrough profiles
using the three adsorbent materials are shown in Figure 3-4. Chloroform breakthrough was
chosen to be 80 µg/L, or 18 % of the influent concentration.
It can be seen from the results that both the CCA and CS-1240 materials allowed
breakthrough in less than 20 minutes as a result of the rapid increase in chloroform effluent
concentration in that period of time. On the other hand, when using granular ZSM-5,
breakthrough occurred after 290 minutes as shown by the slow increase in chloroform effluent
concentration with run time.
The results illustrate the higher affinity of granular ZSM-5 for chloroform compared to
the less effective performance of CCA and CS-1240 in retaining chloroform. In order to assess
the performance of the three adsorbent materials quantitatively, the adsorbent usage rate (AUR)
was determined. The AUR was calculated by dividing the mass of adsorbent used in the column
by the volume of liquid treated up to the 18 % breakthrough point. The usage rates for granular
ZSM-5, CS-1240, and CCA were 0.32 g/L, 6.62 g/L, and 13.8 g/L, respectively, showing a much
lower adsorbent consumption for adsorption processes utilizing the granular ZSM-5. However it
has been reported [86] that the cost of 1 lb of ZSM-5 is 7 times the cost of 1 lb of either CCA or
CS-1240. Yet the higher AURs predicted for CCA (~40 times larger than that associated with
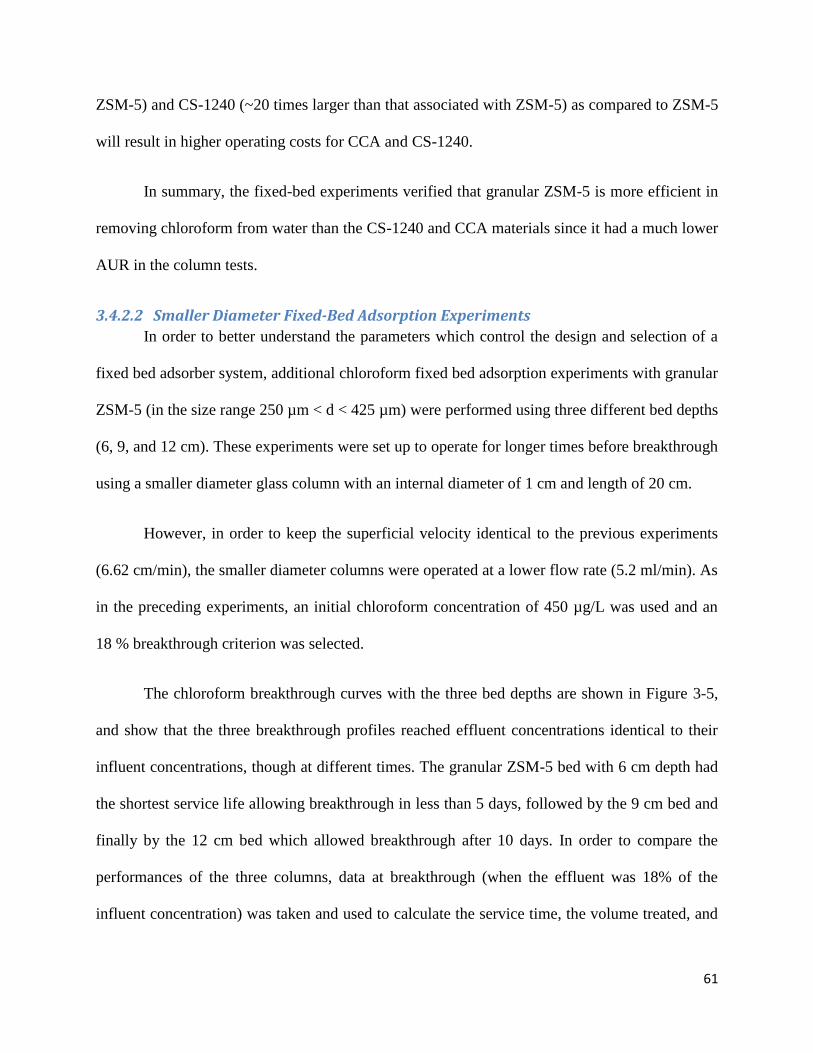
61
ZSM-5) and CS-1240 (~20 times larger than that associated with ZSM-5) as compared to ZSM-5
will result in higher operating costs for CCA and CS-1240.
In summary, the fixed-bed experiments verified that granular ZSM-5 is more efficient in
removing chloroform from water than the CS-1240 and CCA materials since it had a much lower
AUR in the column tests.
3.4.2.2 Smaller Diameter Fixed-Bed Adsorption Experiments
In order to better understand the parameters which control the design and selection of a
fixed bed adsorber system, additional chloroform fixed bed adsorption experiments with granular
ZSM-5 (in the size range 250 µm < d < 425 µm) were performed using three different bed depths
(6, 9, and 12 cm). These experiments were set up to operate for longer times before breakthrough
using a smaller diameter glass column with an internal diameter of 1 cm and length of 20 cm.
However, in order to keep the superficial velocity identical to the previous experiments
(6.62 cm/min), the smaller diameter columns were operated at a lower flow rate (5.2 ml/min). As
in the preceding experiments, an initial chloroform concentration of 450 µg/L was used and an
18 % breakthrough criterion was selected.
The chloroform breakthrough curves with the three bed depths are shown in Figure 3-5,
and show that the three breakthrough profiles reached effluent concentrations identical to their
influent concentrations, though at different times. The granular ZSM-5 bed with 6 cm depth had
the shortest service life allowing breakthrough in less than 5 days, followed by the 9 cm bed and
finally by the 12 cm bed which allowed breakthrough after 10 days. In order to compare the
performances of the three columns, data at breakthrough (when the effluent was 18% of the
influent concentration) was taken and used to calculate the service time, the volume treated, and
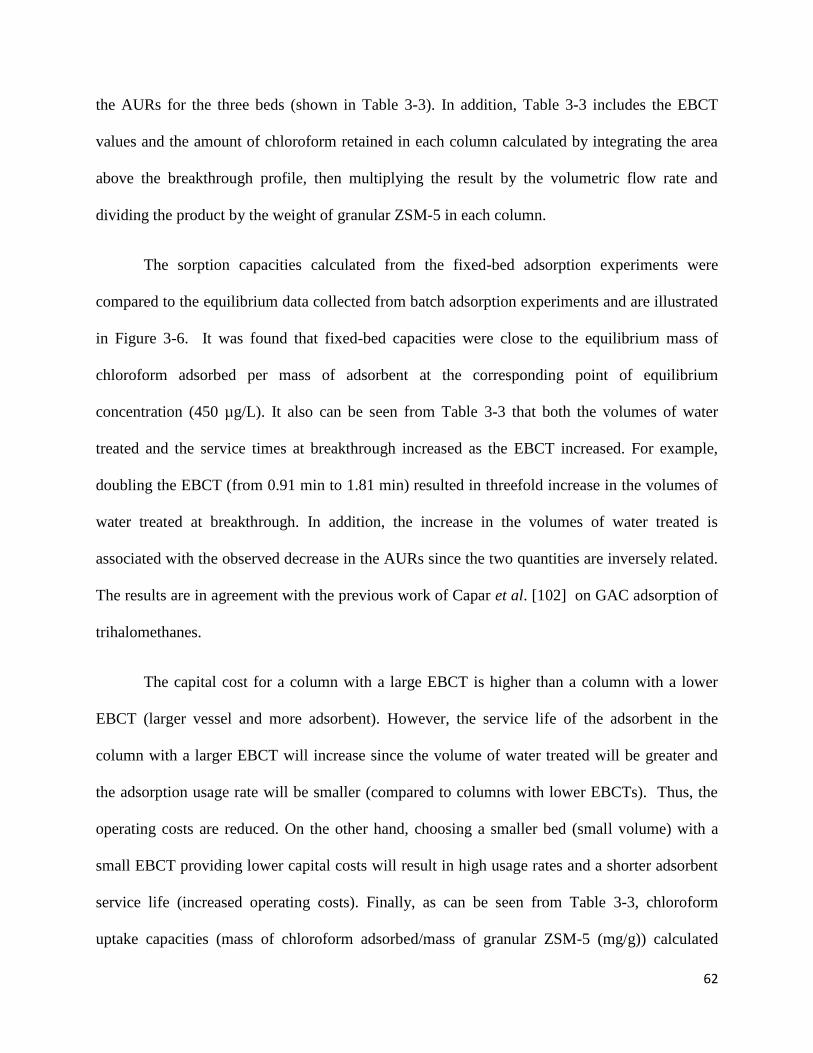
62
the AURs for the three beds (shown in Table 3-3). In addition, Table 3-3 includes the EBCT
values and the amount of chloroform retained in each column calculated by integrating the area
above the breakthrough profile, then multiplying the result by the volumetric flow rate and
dividing the product by the weight of granular ZSM-5 in each column.
The sorption capacities calculated from the fixed-bed adsorption experiments were
compared to the equilibrium data collected from batch adsorption experiments and are illustrated
in Figure 3-6. It was found that fixed-bed capacities were close to the equilibrium mass of
chloroform adsorbed per mass of adsorbent at the corresponding point of equilibrium
concentration (450 µg/L). It also can be seen from Table 3-3 that both the volumes of water
treated and the service times at breakthrough increased as the EBCT increased. For example,
doubling the EBCT (from 0.91 min to 1.81 min) resulted in threefold increase in the volumes of
water treated at breakthrough. In addition, the increase in the volumes of water treated is
associated with the observed decrease in the AURs since the two quantities are inversely related.
The results are in agreement with the previous work of Capar et al. [102] on GAC adsorption of
trihalomethanes.
The capital cost for a column with a large EBCT is higher than a column with a lower
EBCT (larger vessel and more adsorbent). However, the service life of the adsorbent in the
column with a larger EBCT will increase since the volume of water treated will be greater and
the adsorption usage rate will be smaller (compared to columns with lower EBCTs). Thus, the
operating costs are reduced. On the other hand, choosing a smaller bed (small volume) with a
small EBCT providing lower capital costs will result in high usage rates and a shorter adsorbent
service life (increased operating costs). Finally, as can be seen from Table 3-3, chloroform
uptake capacities (mass of chloroform adsorbed/mass of granular ZSM-5 (mg/g)) calculated
63
from the breakthrough profiles were essentially constant for the three runs, as expected. This is
an indication that when each column reached its saturation capacity, the amount of chloroform
adsorbed in each column per unit mass of granular ZSM-5 added to the column did not vary with
the size of the adsorption bed. This result suggests that mass transfer zone formed near the bed
entrance, and moved through the column without changing shape, as seen in Figure 3-5. This
phenomenon is known as a self-sharpening mass transfer zone, and is generally associated with a
favorable isotherm and finite pore resistance to mass transfer. Consequently, choosing an
optimum design will depend on the desired effluent water quality, and on the relative importance
of capital and operating costs at the particular facility.
3.4.3 BDST model
To predict the effect of bed depth and different breakthrough percentages on granular
ZSM-5 service time, the breakthrough data were fitted to the Bed Depth Service Time (BDST)
model. The BDST model is based on the irreversible isotherm model by Bohart et al. [103] .
Later, Hutchins [104] linearized the model proposed by Bohart et al. assuming that the
adsorption zone is moving at a constant speed along the bed and hence, the adsorption capacity
(N0) is constant throughout the bed. The BDST model (as modified by Hutchins) provides useful
equations for the prediction of adsorption column design and is physically based on measuring
the bed capacity of three column tests with three different bed depths. The BDST procedure has
been widely applied in the literature to predict the effects of different bed depths, different feed
concentrations, flow rates, and different initial concentrations on the performance of fixed-bed
adsorber systems [105-109] . For example, Adak et al. [107] used the BDST model to determine
design parameters that describe the adsorption of phenol by surfactant-modified alumina. Also,
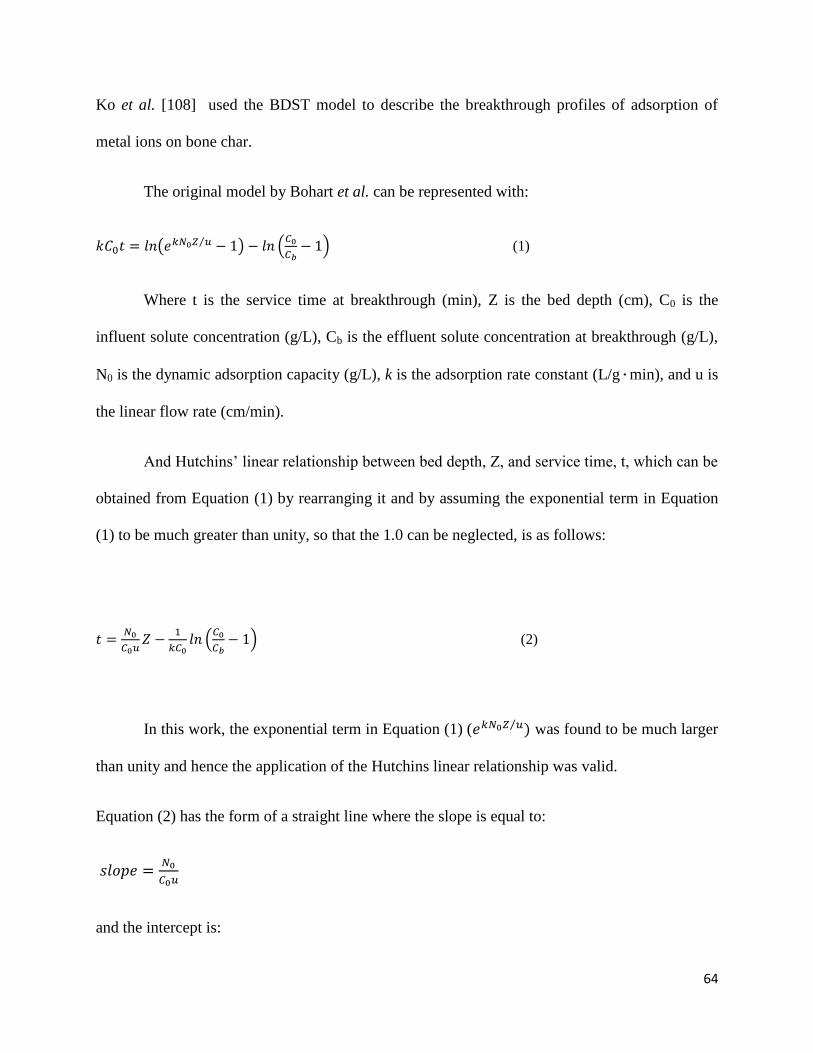
64
Ko et al. [108] used the BDST model to describe the breakthrough profiles of adsorption of
metal ions on bone char.
The original model by Bohart et al. can be represented with:
(1)
Where t is the service time at breakthrough (min), Z is the bed depth (cm), C0 is the
influent solute concentration (g/L), Cb is the effluent solute concentration at breakthrough (g/L),
N0 is the dynamic adsorption capacity (g/L), k is the adsorption rate constant (L/g·min), and u is
the linear flow rate (cm/min).
And Hutchins‘ linear relationship between bed depth, Z, and service time, t, which can be
obtained from Equation (1) by rearranging it and by assuming the exponential term in Equation
(1) to be much greater than unity, so that the 1.0 can be neglected, is as follows:
(2)
In this work, the exponential term in Equation (1) ( was found to be much larger
than unity and hence the application of the Hutchins linear relationship was valid.
Equation (2) has the form of a straight line where the slope is equal to:
and the intercept is:

65
In addition, setting and solving Equation (2) for Z yields Z0, which represents the
minimum theoretical depth of adsorbent sufficient to achieve the effluent criterion (Cb).
Some researchers have found that the linear BDST plots with constant bed capacity (N0)
were unable to explain their experimental data points and thus, they developed the extended
BDST model which account for changes in the bed capacity as a result of changes in the service
time [108, 110] . The extended BDST model suggests that the relation between bed capacity and
service time has a root-time dependence characteristic of diffusional mass transfer-limited
adsorption [108] . In this work, the authors found the linear BDST model well represented the
behavior of the system. This form of the BDST model can be used to determine the service time,
t, of a column of bed depth Z, given the values of N0, C0, and k.
From the breakthrough times (corresponding to Cb/C0 = 0.1) and the exhaust times
(corresponding to Cb/C0 = 0.9) for bed depths 6, 9, and 12 cm, the BDST curves were plotted, as
shown in Figure 3-7, which showed the bed depth versus service times for 10% and 90%
saturation of the columns. The best fitting equations of these two lines are listed in Table 3-4.
It can be seen from Figure 3-7 that the service times for the two BDST curves linearly
increased with the increase in bed depths. This linearity as can also be seen from the high values
of R2 in Table 3-4 is a good indication of the suitability of the BDST model to represent the
adsorption of chloroform in a fixed bed of ZSM-5 zeolite. It can also be observed from Figure 3-
7 that the two BDST lines were parallel (with equal slopes) and consequently they should both
have same values for bed adsorption capacities (N0). Since the N0 values were constant and did

66
not vary with changes in the breakthrough values, this is another indication of the validity of the
linear BDST model which assumes constant N0.
Additionally, it can be seen from Figure 3-7 that for the same bed, the adsorbent service
times increase with increasing the breakthrough percentage. This is expected because with
greater breakthrough percentage allowed, more volumes of water can be treated before the bed
service limit is reached.
Finally, from the slope and intercept of the 10% saturation line, the design parameters k
and N0 were found. The minimum column height (Z0) necessary to produce an effluent
concentration of Cb was calculated by setting and solving Equation (2) for Z. The values of
k, N0, and Z0 were found to be 0.81 L/g.min, 5.02 g/L, and 3.60 cm, respectively.
3.5 Conclusions
Batch adsorption experiments using granular zeolites were performed at two ranges of
chloroform aqueous concentration. It was found that at low chloroform concentrations (<1 mg/L)
the small pores and the high framework densities of granular zeolites were the primary factors to
attaining high sorption. While at higher chloroform concentrations, (1-100 mg/L) high Si/Al
ratios and large pore sizes were the dominant factors in achieving high adsorption capacities. In
addition, using batch adsorption experiments, the effect of ZSM-5 grain size on its adsorption
capacity for chloroform and the effect of NOM on the adsorption capacities of ZSM-5, CCA, and
CS-1240 for chloroform were evaluated. It was found that ZSM-5 with the smallest grain size
(between 250 and 425 µm) was the most effective in removing chloroform from water. The
presence of up to 5 mg/L of NOM and other constituents in the solution had minimal effect on
67
the adsorption capacities of ZSM-5, CCA, and CS-1240. Although batch equilibrium studies
using ZSM-5, CCA, and CS-1240 showed that the three adsorbents had similar adsorption
capacities for chloroform using purified water, kinetic studies obtained with the three adsorbents
in fixed-bed experiments indicated that granular ZSM-5 had a higher adsorption rate. The
adsorption capacity of ZSM-5 for chloroform compared well to CCA and CS-1240, as reflected
in the values of the AURs of the three adsorbents. This finding suggests that equilibrium
adsorption data alone are not sufficient to describe the behavior of chloroform in fixed-bed
adsorbers.
Furthermore, chloroform fixed bed adsorption experiments with granular ZSM-5
(diameters between 250 µm and 425 µm) using three different bed depths (6, 9, and 12 cm) were
completed. Breakthrough data obtained from the fixed-bed adsorption tests were fitted to the
BDST model. The BDST model described the breakthrough data well. The kinetic parameters
obtained from the breakthrough curves and the BDST model can be used to optimize the design
and operation of fixed-bed adsorbers and to develop preliminary cost information.
3.6 Acknowledgments
The authors acknowledge the financial support from Triton Systems, Inc. of Chelmsford,
MA, and the support by the National Institutes of Health through grant 2R44 ES012784-02. The
authors also appreciate the guidance provided by Arjan Giaya of Triton Systems, Inc. and the
assistance provided by Donald Pellegrino with lab experiments.

68
Table 3-1: Properties of granular zeolites tested in the batch adsorption experiments.
Sample
Name
Supplier
Size
(in)
Si/Al
Framework
density
(number of
T
atoms/1000
Å) [18]
Zeolite
%
Micropore
area (m2/g)
[69]
External
area (m2/g)
[69]
Surface
area (m2/g)
[69]
Pore
dimensions
(Å) [18]
Beta Engelhard
0.0625# 35 15.3 80 266
267.6
533.7
6.6-7.7
Mordenite Engelhard
0.0625# 50 17 80 304.3
168.3
472.6
6.5 x 7.0
HISIV 1000 UOP 0.0625# 35-40 13.3 80 247.1
132.8
379.9
7.4 x 7.4
HISIV 3000 UOP 0.0625# 800 18.4 80 230.5
91.4
321.9
5.1 x 5.5,
5.3 x 5.6
Zeolite Y1 Engelhard
0.15 13.3 9 73.4
85.2
158.6
7.4 x 7.4
Zeolite Y2 Engelhard
0.15 13.3 14 58.7
99.6
158.3
7.4 x 7.4
ZSM-5 Zeolyst
0.0625# 280 18.4 80 141.8
249
390.8
5.1 x 5.5,
5.3 x 5.6
Beta Zeolyst
0.0625# 360 15.3 80 6.6-7.7
Mordenite Zeolyst
0.0625# 90 17 80 6.5 x 7.0
# Size obtained from manufacturers’ data.

69
Table 3-2: A list of all constituents used in preparing the challenge solution.
Constituent Concentration (mg/L)
NOM 5
Mg+2
10
Cl- 44.56
Na+ 10
Ca+2
10
CO3-2
25
Fe+2
10
SO4-2
17.2
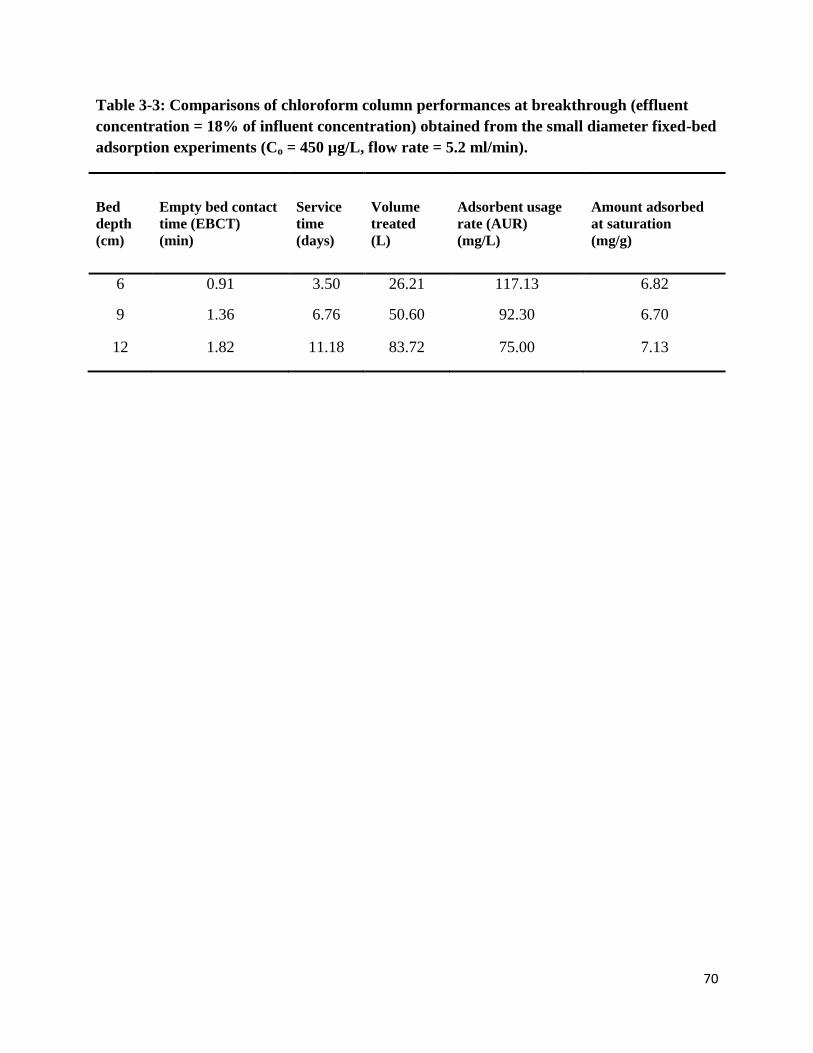
70
Table 3-3: Comparisons of chloroform column performances at breakthrough (effluent
concentration = 18% of influent concentration) obtained from the small diameter fixed-bed
adsorption experiments (Co = 450 µg/L, flow rate = 5.2 ml/min).
Bed
depth
(cm)
Empty bed contact
time (EBCT)
(min)
Service
time
(days)
Volume
treated
(L)
Adsorbent usage
rate (AUR)
(mg/L)
Amount adsorbed
at saturation
(mg/g)
6 0.91 3.50 26.21 117.13 6.82
9 1.36 6.76 50.60 92.30 6.70
12 1.82 11.18 83.72 75.00 7.13
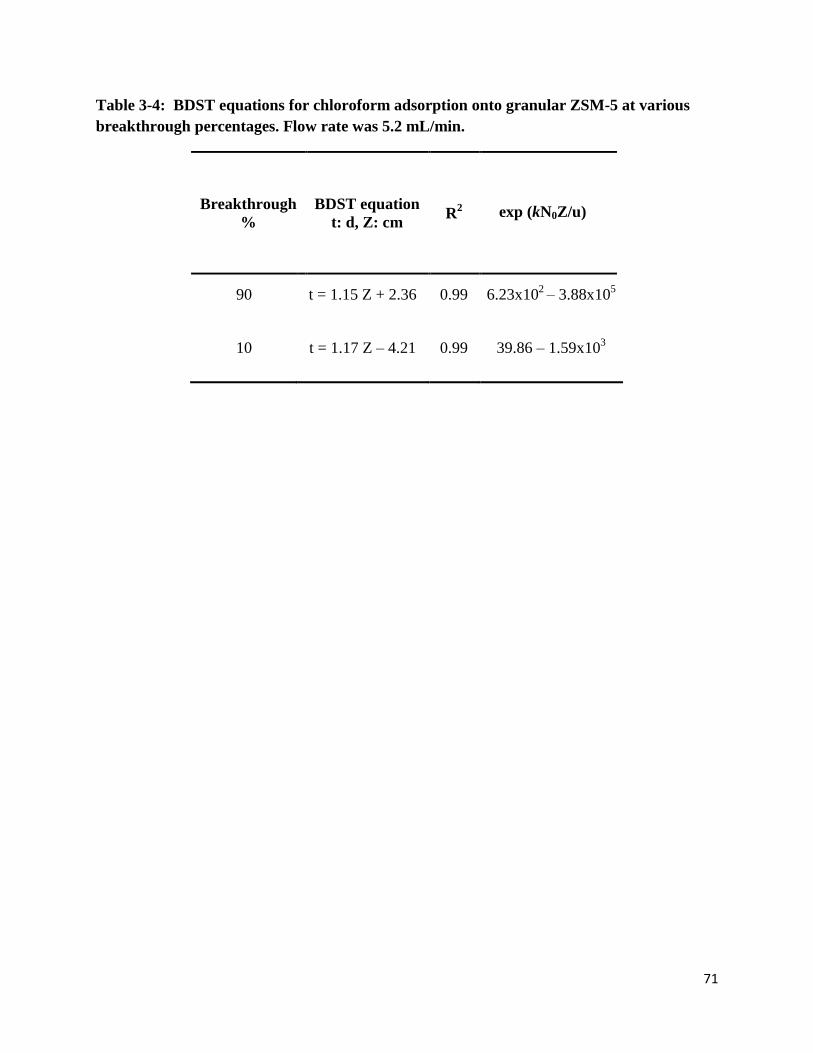
71
Table 3-4: BDST equations for chloroform adsorption onto granular ZSM-5 at various
breakthrough percentages. Flow rate was 5.2 mL/min.
Breakthrough
%
BDST equation
t: d, Z: cm R
2 exp (kN0Z/u)
90 t = 1.15 Z + 2.36 0.99 6.23x10²
– 3.88x10⁵
10 t = 1.17 Z – 4.21 0.99 39.86 – 1.59x10³
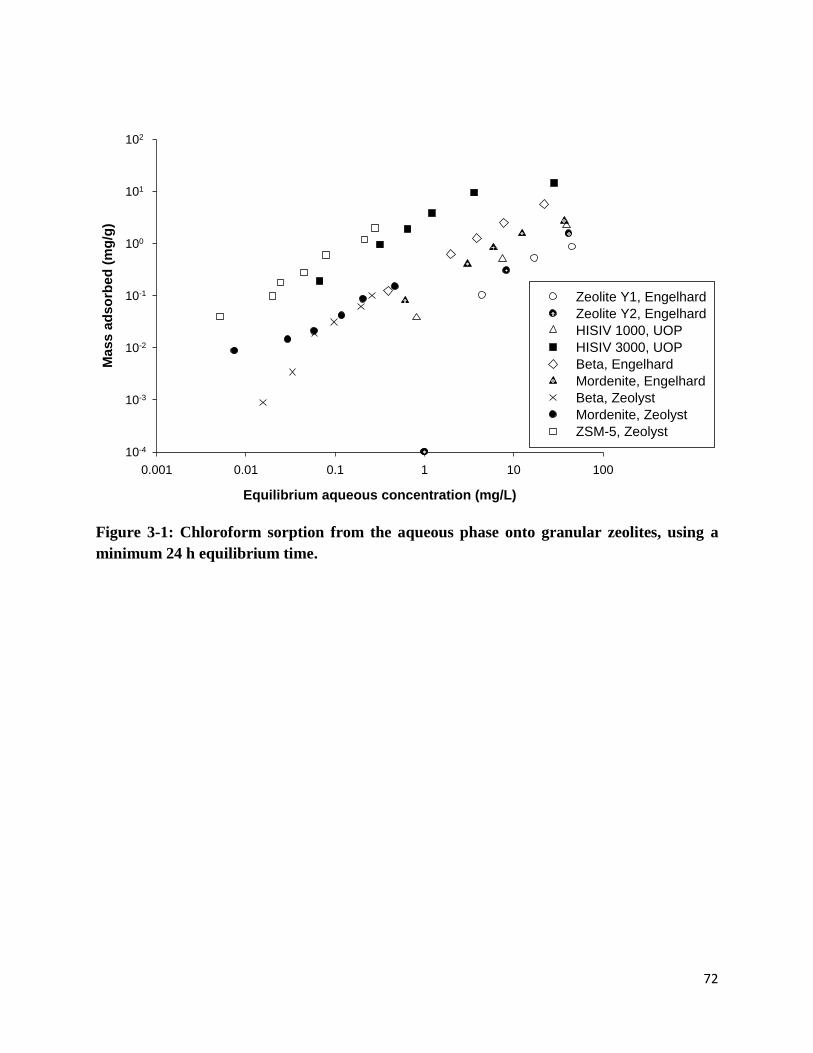
72
Equilibrium aqueous concentration (mg/L)
0.001 0.01 0.1 1 10 100
Ma
ss
ad
so
rbe
d (
mg
/g)
10-4
10-3
10-2
10-1
100
101
102
Zeolite Y1, Engelhard
Zeolite Y2, Engelhard
HISIV 1000, UOP
HISIV 3000, UOP
Beta, Engelhard
Mordenite, Engelhard
Beta, Zeolyst
Mordenite, Zeolyst
ZSM-5, Zeolyst
Figure 3-1: Chloroform sorption from the aqueous phase onto granular zeolites, using a
minimum 24 h equilibrium time.

73
Equilibrium aqueous concentration (g/L)
0 50 100 150 200 250 300
Mass a
dso
rbed
(
g/g
)
0
500
1000
1500
2000
2500
250 m < d < 425 m
425 m < d < 850 m
850 m > d > 1400 m
Original 1.6 mm
Figure 3-2: Chloroform sorption from the aqueous phase onto ZSM-5 with three different
grain sizes compared to the original ZSM-5 size of 1.6 mm. Lines are best linear fits.

74
CCA-Purif
ied water
CCA-"Challe
nge" water
ZSM-5-Purif
ied water
ZSM-5-"Challe
nge" water
CS-1240-Purif
ied water
CS-1240-"Challe
nge" water
Avera
ge r
em
oval
%
92
94
96
98
100
Figure 3-3: Average removal percentages of chloroform from the aqueous phase by
adsorption to granular ZSM-5, CS-1240 & CCA using chloroform-spiked purified water
and “challenge” water. The error bars signify 95% confidence. Initial chloroform
concentrations were in the range of 1400-10000 µg/L.

75
Time (min)
0 50 100 150 200 250 300 350
C/C
o
0.0
0.2
0.4
0.6
0.8
1.0CCA
CS-1240
ZSM-5
Breakthrough line (18 %)
Figure 3-4: Normalized breakthrough curves of chloroform adsorption onto ZSM-5, CCA,
& CS-1240 in the large diameter fixed-bed adsorption experiments (C0 = 450 µg/L, flow
rate = 32.5 ml/min, & EBCT = 0.15 min).
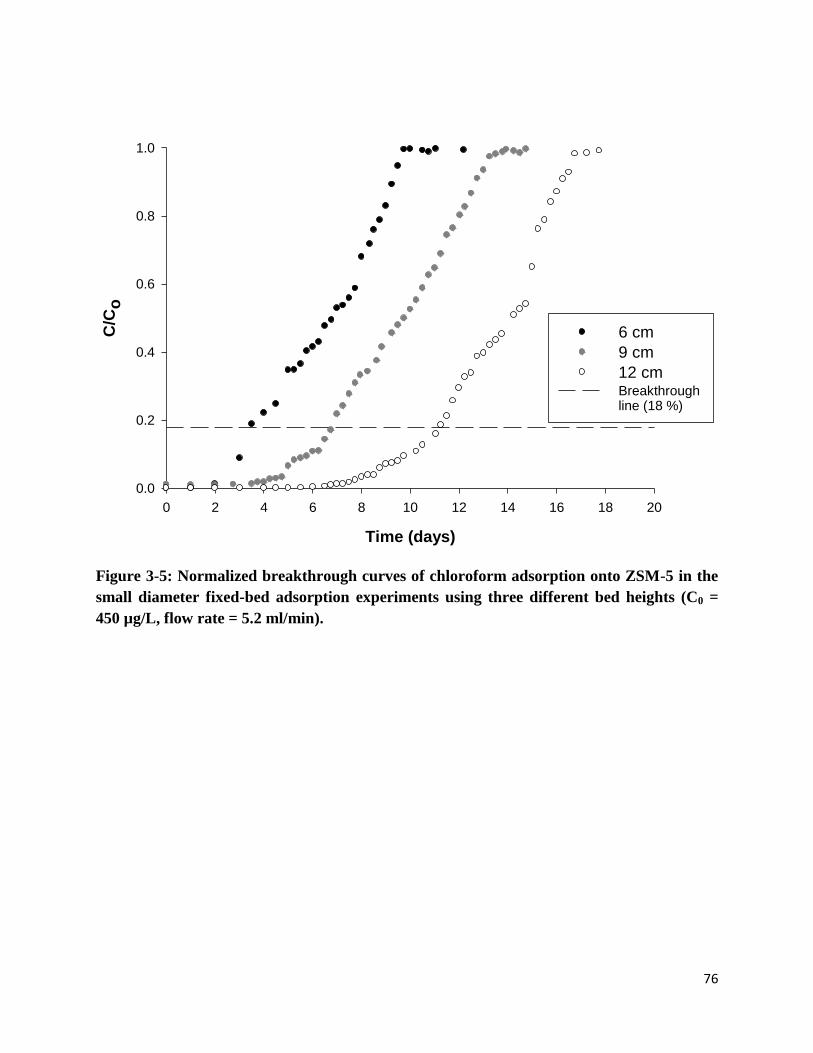
76
Time (days)
0 2 4 6 8 10 12 14 16 18 20
C/C
o
0.0
0.2
0.4
0.6
0.8
1.0
6 cm
9 cm
12 cmBreakthrough line (18 %)
Figure 3-5: Normalized breakthrough curves of chloroform adsorption onto ZSM-5 in the
small diameter fixed-bed adsorption experiments using three different bed heights (C0 =
450 µg/L, flow rate = 5.2 ml/min).
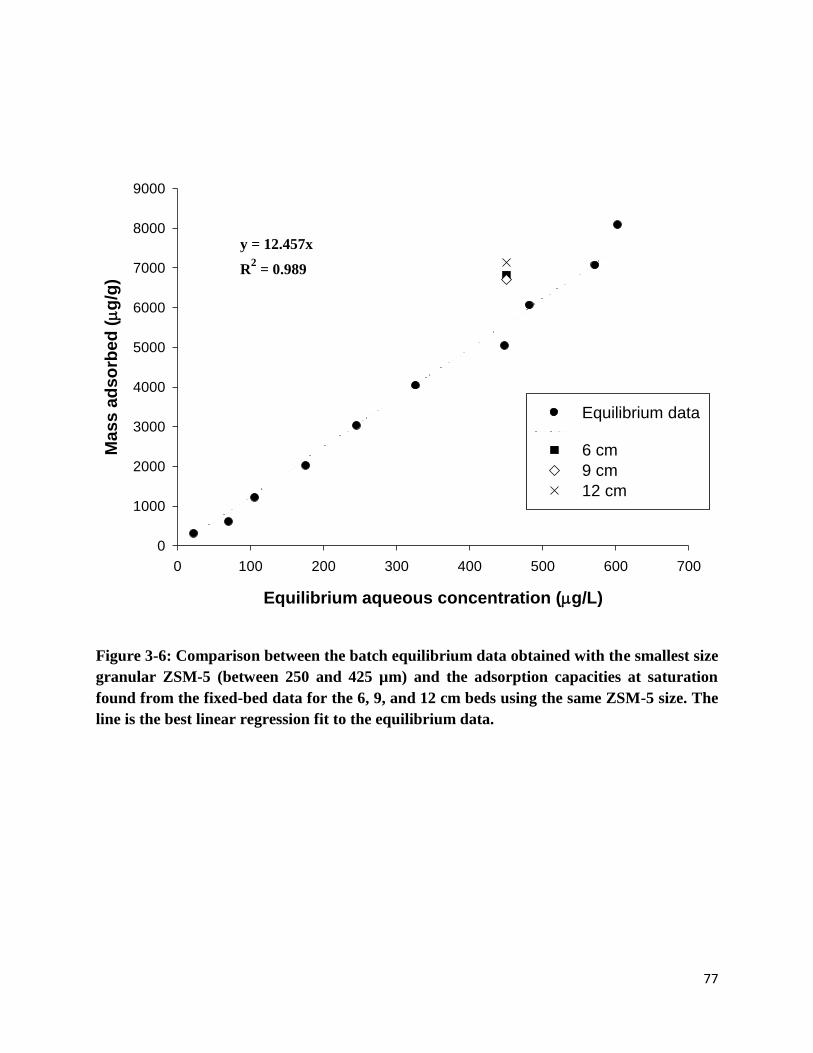
77
Equilibrium aqueous concentration (g/L)
0 100 200 300 400 500 600 700
Ma
ss
ad
so
rbe
d (
g/g
)
0
1000
2000
3000
4000
5000
6000
7000
8000
9000
Equilibrium data
6 cm
9 cm
12 cm
y = 12.457x
R2
= 0.989
Figure 3-6: Comparison between the batch equilibrium data obtained with the smallest size
granular ZSM-5 (between 250 and 425 µm) and the adsorption capacities at saturation
found from the fixed-bed data for the 6, 9, and 12 cm beds using the same ZSM-5 size. The
line is the best linear regression fit to the equilibrium data.
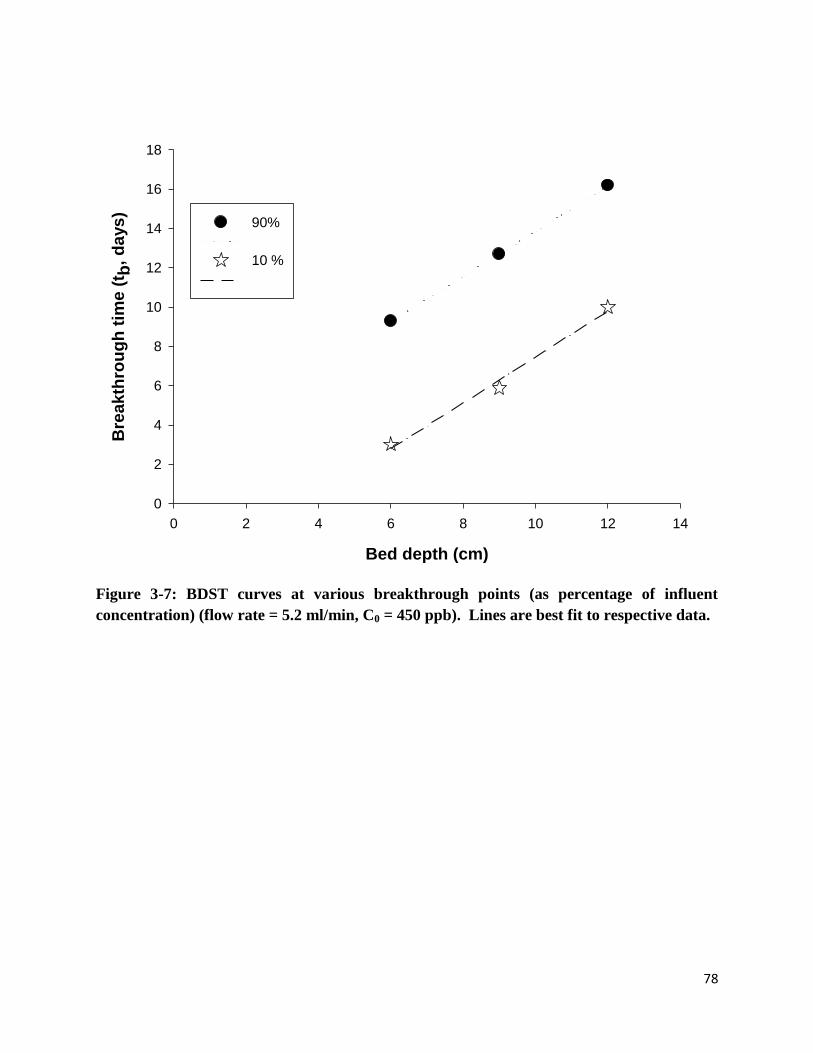
78
Bed depth (cm)
0 2 4 6 8 10 12 14
Bre
ak
thro
ug
h t
ime
(t b
, d
ays
)
0
2
4
6
8
10
12
14
16
18
90%
10 %
Figure 3-7: BDST curves at various breakthrough points (as percentage of influent
concentration) (flow rate = 5.2 ml/min, C0 = 450 ppb). Lines are best fit to respective data.

79
4 Mathematical Modeling of Chloroform Adsorption onto Fixed Bed
Columns of Highly Siliceous Zeolites
4.1 Abstract
The breakthrough curves for adsorption of chloroform onto granular zeolite ZSM-5 in
fixed-bed adsorbers was predicted with a film pore and surface diffusion model. Parameters were
estimated from published correlations and from data taken from batch adsorption rate studies. It
was found that the adsorption rate was enhanced with the decrease in particle size, however, the
total adsorption capacity using granular ZSM-5 with different particle sizes remained constant.
The film-pore and surface diffusion model (FPSDM) accounted for the effects of axial
dispersion, external film transfer resistance, and intraparticle mass-transfer resistances.
Generally, good agreement between the simulated results and the experimental data was
obtained. Furthermore, a sensitivity analysis was carried out to investigate the relative impact of
kinetic parameters on the FPSDM predicted breakthrough profiles and showed that the model
calculations were insensitive to either the effective pore diffusivity coefficient (Dp,e) or the axial
dispersion coefficient (Ez), but were sensitive to the external mass transfer coefficient (kf). The
large impact of kf on the results and the relatively low Biot numbers determined by the FPSDM
indicate that under the experimental conditions employed in the study, film diffusion is the
primary controlling mass transfer mechanism. Additionally, a constant value of the effective pore
diffusivity coefficient as determined from the batch adsorption rate studies is sufficient to
correlate the breakthrough curves accurately.
80
4.2 Introduction
Chlorination of naturally occurring organic materials found in raw water supplies can
lead to the formation of disinfection byproducts (DBPs) which are potentially harmful to
humans. Two commonly identified classes of DBPs in chlorinated drinking water are the
trihalomethanes (THMs) and haloacetic acids (HAAs). Both exhibit potentially high
carcinogenic activity. Commonly found THMs are: chloroform (CHCl3), dichlorobromoform
(CHCl2Br), dibromochloroform (CHBr2Cl) and bromoform (CHBr3). In this work, the removal
of chloroform from water in fixed bed contactors was mathematically modeled to predict
breakthrough in the effluent from these contactors. Chloroform was chosen for this work because
of the acute and chronic adverse health effects of chloroform on humans, and it has been
classified by the USEPA as a probable human carcinogen [26] .
Various treatment methods to remove chloroform have been studied including; air
stripping [74] , advanced oxidation [84] , and adsorption. Of these treatment technologies,
adsorption using adsorbents such as activated carbon, activated carbon fiber, have been widely
used [2, 4] . It has been recently demonstrated that hydrophobic zeolites with high silica content
(i.e. a high Si/Al ratio) may be effective adsorbents for the removal of a wide variety of organic
compounds from water [86-92] .
Fixed-beds are the most common adsorber configuration used in water and wastewater
treatment applications. One critical aspect of the design of a fixed-bed adsorber is the
characterization of the breakthrough profile. The shape and rate of appearance of the
breakthrough profile, represents the specific combination of equilibrium and rate factors that
control the performance and dynamic behavior of a fixed bed adsorber. There are many factors
81
that affect the behavior of a fixed bed adsorber including; the physical and chemical properties of
the adsorbate and the adsorbent, the particular rate limiting mechanism, the velocity of the flow,
and the depth of the bed. The design of a particular adsorption process is highly specific and
depends on the relative importance of the above factors. Hence, the adsorption dynamics of such
processes and the characteristics of a fixed-bed adsorber breakthrough profile can be explained
and predicted through mathematical modeling. A number of mathematical models that account
for both film and intraparticle diffusion mechanisms have been developed to predict the one-
dimensional transport and adsorption of target contaminants in fixed-bed adsorbers [33-36, 38,
111-115] .
Variations among such models are distinguished based on the means for describing the
intraparticle mass transport step. The simplest formulation of the above models is the linear local
equilibrium model that assumes linear adsorption and neglects mass transfer resistances [33] . A
more descriptive analysis of the intraparticle diffusion was then given by the pore transport
model [34, 116] and the surface diffusion model with or without external film resistance [38,
117] . Finally, a more realistic diffusion model was developed which takes into account both
pore and surface diffusivities [33, 35, 114] .
For the development of a mathematical model that describes and predicts the adsorption
dynamics, both batch adsorption and fixed-bed adsorption studies are required. Batch adsorption
studies are required to obtain key parameters such as the isotherm constants and the effective
pore diffusivity coefficient. Fixed-bed studies are then used in determining experimental
breakthrough curves to validate the model.
82
In the present study, batch equilibrium and kinetic experiments and fixed-bed adsorption
experiments were performed to quantify the single component adsorption of chloroform onto
granular zeolite ZSM-5. In addition, the film pore and surface diffusion model which takes into
account the film transfer resistance, intraparticle diffusion resistance, axial dispersion, and linear
adsorption was applied. A numerical solution to the film-pore and surface diffusion model
(FPSDM) equations was developed and results compared to the experimental breakthrough.
4.3 Mathematical Model
The film-pore and surface diffusion model (FPSDM) [33] was used to predict fixed-bed
adsorber breakthrough curves for chloroform adsorption onto granular zeolites. The FPSDM is a
comprehensive model that takes into account: the external mass transfer resistance (external film
diffusion), the internal mass transfer resistance (pore and surface diffusion), and axial dispersion
[33] .
The FPSDM equations were derived from continuity principles and mass balance
expressions for a finite volume in the fixed-bed reactor (Appendix A) as described by Crittenden
et al. [33] , Hand et al. [38] , and Weber and DiGiano [11] resulting in two partial differential
equations (PDEs); one describing the liquid-phase mass balance and the other one describing the
intraparticle phase. Solving the resulting system of PDEs was performed numerically with the
implicit finite difference method using Matlab (Appendix B). The following mechanisms and
assumptions were used to formulate the FPSDM: (1) the system operates under isothermal
conditions; (2) the adsorbent particles are spherical, uniform in size and density; (3) a local
equilibrium exists between the solute adsorbed onto the adsorbent surface and the solute in the
intraaggreagate stagnant fluid; (4) the adsorption equilibrium can be described by the linear
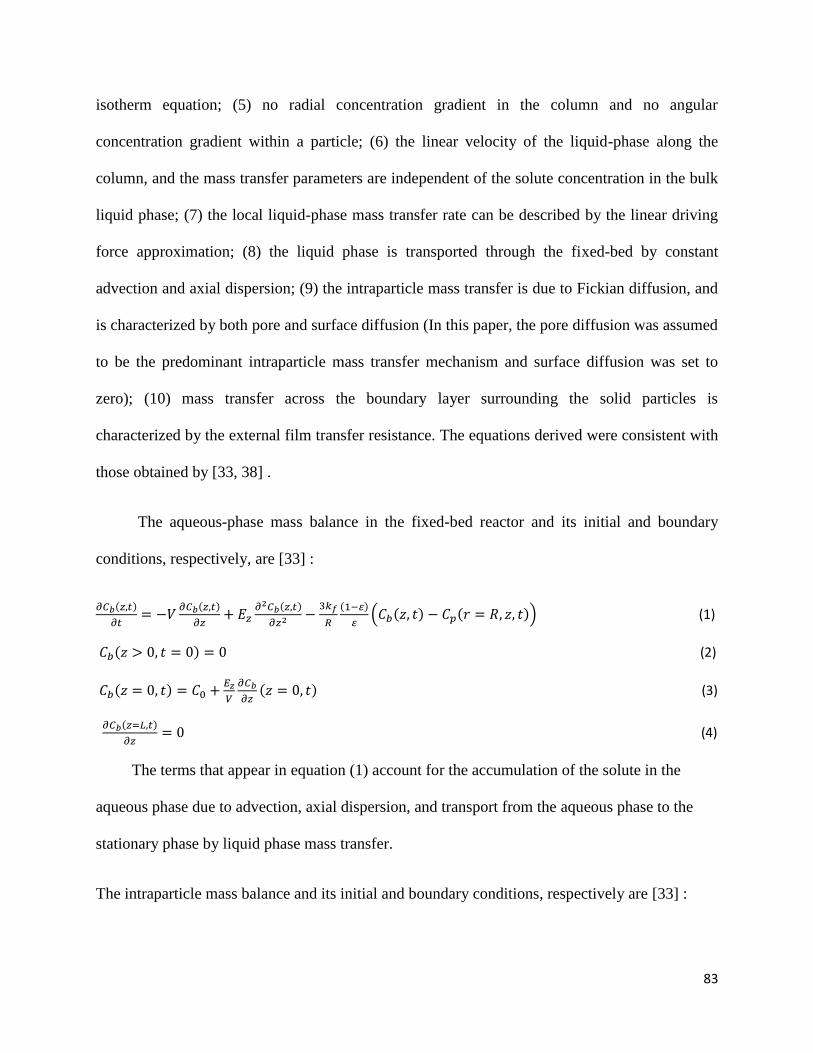
83
isotherm equation; (5) no radial concentration gradient in the column and no angular
concentration gradient within a particle; (6) the linear velocity of the liquid-phase along the
column, and the mass transfer parameters are independent of the solute concentration in the bulk
liquid phase; (7) the local liquid-phase mass transfer rate can be described by the linear driving
force approximation; (8) the liquid phase is transported through the fixed-bed by constant
advection and axial dispersion; (9) the intraparticle mass transfer is due to Fickian diffusion, and
is characterized by both pore and surface diffusion (In this paper, the pore diffusion was assumed
to be the predominant intraparticle mass transfer mechanism and surface diffusion was set to
zero); (10) mass transfer across the boundary layer surrounding the solid particles is
characterized by the external film transfer resistance. The equations derived were consistent with
those obtained by [33, 38] .
The aqueous-phase mass balance in the fixed-bed reactor and its initial and boundary
conditions, respectively, are [33] :
(1)
(2)
(3)
(4)
The terms that appear in equation (1) account for the accumulation of the solute in the
aqueous phase due to advection, axial dispersion, and transport from the aqueous phase to the
stationary phase by liquid phase mass transfer.
The intraparticle mass balance and its initial and boundary conditions, respectively are [33] :
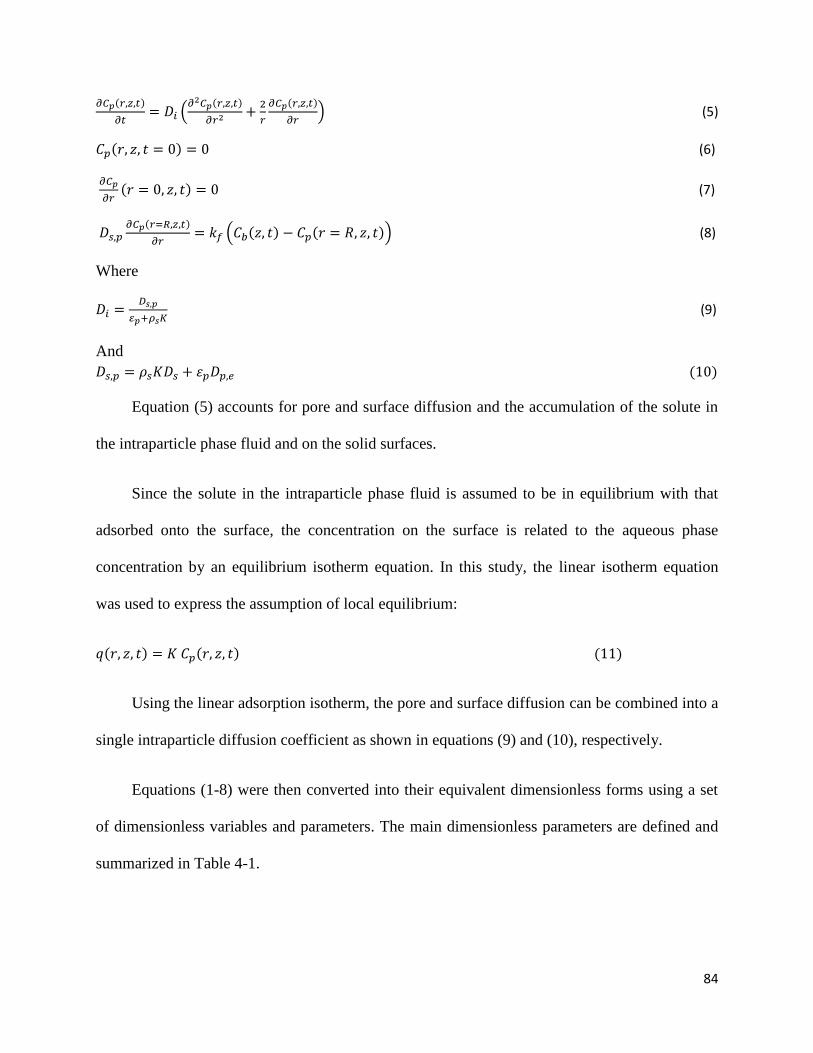
84
(5)
(6)
(7)
(8)
Where
(9)
And
(10)
Equation (5) accounts for pore and surface diffusion and the accumulation of the solute in
the intraparticle phase fluid and on the solid surfaces.
Since the solute in the intraparticle phase fluid is assumed to be in equilibrium with that
adsorbed onto the surface, the concentration on the surface is related to the aqueous phase
concentration by an equilibrium isotherm equation. In this study, the linear isotherm equation
was used to express the assumption of local equilibrium:
(11)
Using the linear adsorption isotherm, the pore and surface diffusion can be combined into a
single intraparticle diffusion coefficient as shown in equations (9) and (10), respectively.
Equations (1-8) were then converted into their equivalent dimensionless forms using a set
of dimensionless variables and parameters. The main dimensionless parameters are defined and
summarized in Table 4-1.
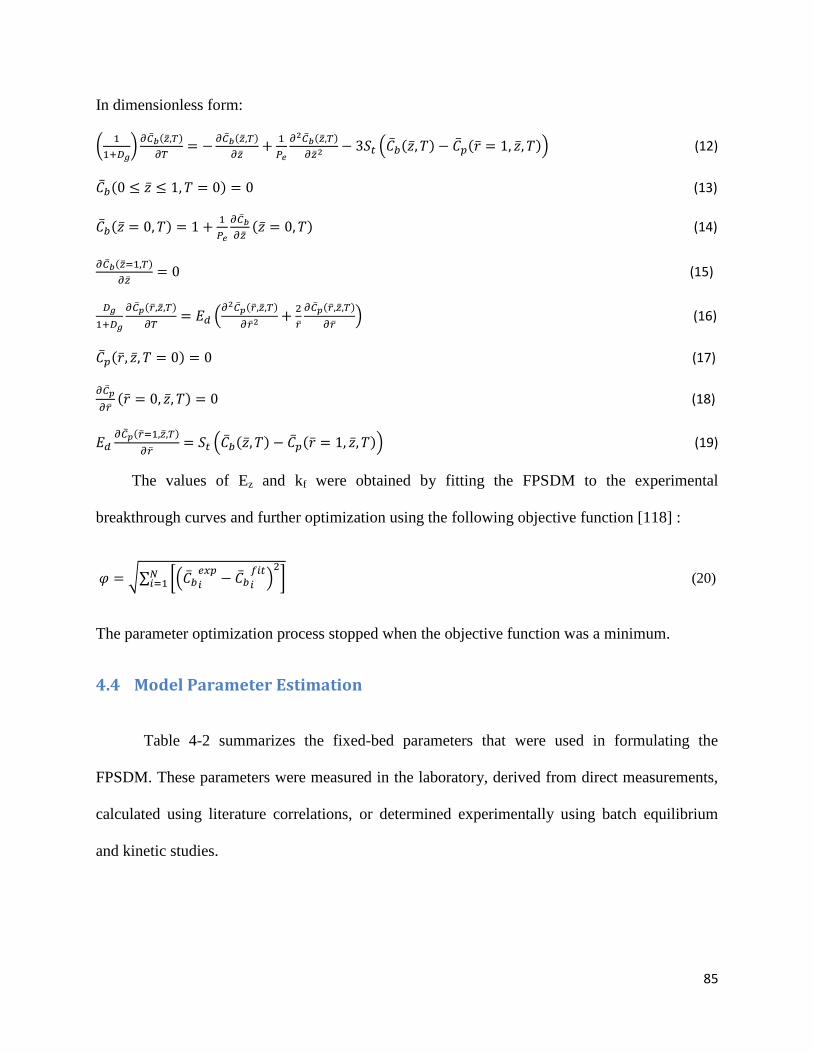
85
In dimensionless form:
(12)
(13)
(14)
(15)
(16)
(17)
(18)
(19)
The values of Ez and kf were obtained by fitting the FPSDM to the experimental
breakthrough curves and further optimization using the following objective function [118] :
(20)
The parameter optimization process stopped when the objective function was a minimum.
4.4 Model Parameter Estimation
Table 4-2 summarizes the fixed-bed parameters that were used in formulating the
FPSDM. These parameters were measured in the laboratory, derived from direct measurements,
calculated using literature correlations, or determined experimentally using batch equilibrium
and kinetic studies.
86
4.4.1 Determining Linear Isotherm Constant (K) and Effective Pore Diffusivity
Coefficient (Dp,e) in Batch Tests
Batch adsorption equilibrium and kinetic studies of chloroform onto granular zeolite
ZSM-5 were performed to determine the linear isotherm constant (K) and the effective pore
diffusivity coefficient (Dp,e). The linear isotherm constant (K) was found using a least square
regression of the isotherm data from the batch equilibrium experiment of chloroform adsorption
onto granular zeolite ZSM-5. Batch kinetics experiments of chloroform adsorption onto granular
zeolite ZSM-5 were performed using four different granular zeolite ZSM-5 particle sizes. In
those experiments, the granular zeolite particles were suspended in a limited volume of
chloroform aqueous solution and were well stirred to suppress the effect of external mass transfer
resistance. Hence, it is assumed that because of the vigorous agitation, the concentration of
solute in the solution is uniform, and that the transport of chloroform is dominated by pore
diffusion mechanism only. In order to determine the effective pore diffusivity coefficient (Dp,e),
the results of batch kinetic studies were interpreted using a pore diffusion with sorption model,
assuming that instantaneous local equilibrium exists between the solute adsorbed onto the
adsorbent surface and the solute in the intraparticle stagnant fluid, and that the equilibrium
sorption can be described by linear isotherm [11] .
4.4.1.1 Pore Diffusion-Sorption Model Applied to the Batch Tests
Based on the foregoing assumptions and mechanism, the pore diffusion-sorption model
given by Weber and DiGiano [11] can be described for batch adsorption to a spherical particle
as:
(21)
Where Da is the apparent diffusivity, defined as:
87
(22)
And the initial and boundary conditions are:
(23)
(24)
(25)
Making the distance and time dimensionless, the pore diffusion-sorption model equation
and its initial and boundary conditions can be written as:
(26)
(27)
(28)
(29)
In which
and
The analytical solution of equation (26), for an adsorption that follows linear isotherm from
a limited volume of solution is given by Crank [119] as:
(30)
Where the fractional uptake is the total amount of solute (Mt) in the adsorbent
particle after time (t) as a fraction of the corresponding quantity after infinite time, and can be
given as:
(31)
88
where s are the non-zero roots of
(32)
And
is the ratio between the volumes of solution and the adsorbent particle.
The value of Dp,e was then determined by fitting the analytical solution of the pore
diffusion-sorption model equation to the experimental batch kinetic results and further
optimization using the non-linear regression process. This process minimizes the value of the
squared sum of the difference between the data and the fit [120] .
4.4.2 Correlations for Estimating the External Film Transfer Coefficient (kf), the
Axial Dispersion coefficient (Ez), and the Free Liquid Diffusivity (Dl)
There are several correlations that were used to estimate the external film transfer
coefficient in fixed-bed contactors. Common mass transfer correlations for flow of liquids in
packed beds are summarized in Table 3. In this study, a range of external film transfer coefficient
values obtained from the correlations summarized in Table 4-3 was used in obtaining an initial
approximate range for kf. Three correlations from the literature were used in estimating a range
of values for the axial dispersion coefficient (Ez). These correlations are summarized in Table 4-
3 and were used in obtaining an initial approximate range for Ez. Both the external film transfer
coefficient and the axial dispersion coefficient depend on the free liquid diffusivity of the solute
in water. Table 4-3 summarizes the Wilke-Chang equation which was used to estimate the free
liquid diffusivity of chloroform in water.
89
4.5 Experimental Materials and Procedures
4.5.1 Adsorbent
Granular zeolite ZSM-5 was used as the adsorbent material in the batch and fixed-bed
experiments. The physical properties of this material are listed in Table 4-4. Granular zeolite
ZSM-5 was dried in an atmospheric oven at 120 oC for 10-14 hours and then it was kept clean
and dry in a desiccator until use.
4.5.2 Adsorbate
Neat chloroform (ACS grade) was obtained from (HACH Company Loveland, CO).
Stock solutions of chloroform were prepared by adding a specified amount of neat chloroform to
purified water from a Barnstead ROpure ST/E-pure water purification system
(Barnstead/Thermolyne, Dubuque, IA). 1,1,2-trichloroethane was used in batch adsorption
experiments as an internal standard. Stock solutions of 1,1,2-trichloroethane were prepared using
98 % pure 1,1,2-trichloroethane (Fisher Scientific, Pittsburgh, PA).
4.5.3 Procedures
4.5.3.1 Batch Adsorption Experiments
For the determination of adsorption isotherm parameters, batch adsorption experiments
were performed at room temperature (22 ± 2 ºC) using glass vials with 42 ml of aqueous solution
and varied initial chloroform concentrations containing a known mass (0.2 g) of granular zeolite
ZSM-5 (250 µm < dp < 425 µm). The vials were agitated on a fixed speed rotator for a minimum
of 24 hours at 15 rpm for equilibrium to be established. Following adsorption, granular ZSM-5
was separated by centrifugation at 3000 rpm for 10 minutes and then chloroform in the aqueous
supernatant was analyzed by gas chromatography.
90
4.5.3.2 Batch Kinetic Experiments
Batch kinetic experiments were performed using four sizes of granular ZSM-5. The four
sizes were; (original size with dp = 1.6 mm), (850 µm < dp < 1400 µm), (425 µm < dp < 850 µm),
and (250 µm < dp < 425 µm). Granular ZSM-5 with dp = 1.6 mm is the original material and the
other three sizes of granular ZSM-5 were obtained by grinding the original granular ZSM-5
material using a ball mill followed by passing the resultant heterogeneous sized mixture through
standard mesh sieves. The experiments were performed at room temperature (22 ± 2 ºC) using
glass vials with fixed sorbent/liquid ratio (0.2 g sorbent/42 ml aqueous solution) and containing a
constant chloroform concentration of 10,000 µg/L. Agitation of the vials started at time zero
using a fixed speed rotator at 15 rpm and the first samples were taken at time zero and at
predetermined time intervals thereafter until equilibrium was reached. Following adsorption, the
samples were centrifuged for 10 minutes at 3000 rpm to ensure complete separation of the solid
and aqueous phases. Then the chloroform in the aqueous supernatant was quantified using gas
chromatography.
4.5.3.3 Fixed-Bed Experiments
Fixed-bed experiments using granular zeolite ZSM-5 (250 µm < dp < 425 µm) were
carried out in a 20 cm long glass column with an internal diameter of 1 cm and an adjustable
flow adapter to hold the packed bed in place. Water was passed through the column at a flow rate
of 5.2 mL/min for an hour to remove air bubbles and to flush the adsorbent particles. Adsorption
experiments were performed with a flow rate of 5.2 mL/min (empty bed flow velocity of 6.62
cm/min), an influent chloroform concentration of 450 µg/L, and bed heights of 6, 9, and 12 cm.
Chloroform feed solution was contained in a Tedlar bag (SKC Inc., Eighty Four, PA) which
minimized the head space above the solution and any potential losses due to volatilization and
was introduced to the column using a digital peristaltic pump (Cole-Parmer, Vernon Hills, IL).
91
Samples at the outlet of each column were collected in 42 ml glass vials at predetermined
intervals of time, and analyzed with gas chromatography. Details on the gas chromatography
methodology are given in [121] .
4.6 Results and Discussion
4.6.1 Batch Adsorption Equilibrium Isotherm
Single-solute adsorption isotherm curves of chloroform onto granular zeolite ZSM-5
were obtained over a wide range of chloroform aqueous phase concentrations by plotting the
mass of the solute adsorbed per unit mass of adsorbent (qe) against the equilibrium aqueous
phase concentration of the solute (Ce). Chloroform adsorption isotherm data onto granular zeolite
ZSM-5 were correlated with the linear isotherm model (R2 = 0.97) and typical equilibrium data
are shown in Figure 4-1. From the best fit line (Figure 4-1), the value of the adsorption capacity
constant K was found to be 10.5 L/g.
4.6.2 Batch Adsorption Rate Studies
4.6.2.1 Effect of Particle Sizes and the Pore Diffusion-Sorption Model
The effect of ZSM-5 granular size on chloroform adsorption is shown in Figure 4-2. It can
be seen from Figure 4-2 that equilibrium was reached faster with smaller ZSM-5 particles than
with the larger particle sizes, and that chloroform adsorption rate increased with the decrease in
ZSM-5 particle sizes. Smaller particles have a shorter diffusion path and hence they allow the
adsorbate to penetrate deeper into the adsorbent particle more quickly, which results in a higher
rate of adsorption. This behavior has been previously noticed by other researchers [122, 123] .
Although the rate of adsorption is different for different particle sizes, the total adsorption
capacity for the different particle sizes is the same because their total internal pore area is
expected to be constant. It can be observed also from Figure 4-2 that the experimental data
92
correlated well with the pore diffusion-sorption model curves expressed by the solid lines in
Figure 4-2. In fitting the analytical solution of the pore diffusion-sorption model equation
(equation 30) to the experimental batch kinetic results, the value for the apparent diffusivity (Da)
was optimized using a non-linear regression technique which minimizes the value of the squared
sum of the difference between the data and the predicted value [120] . The value of the effective
pore diffusivity coefficient (Dp,e) was then calculated from (Da) using equation 22. For the four
different particle sizes, the value of the effective pore diffusivity coefficient (Dp,e) was constant
and equal to 5.83 x 10⁻⁴
cm2/sec. The finding of constant effective pore diffusivity with particle
size is expected since highly porous adsorbents such as granular zeolites ZSM-5 have most of
their surface area in the internal pore structure, which is approximately constant for the different
particle sizes. This result supports our assumption that pore diffusion is the dominant
intraparticle mass transfer mechanism.
Although the effective pore diffusivity coefficient (Dp,e) was used to represent the
controlling intraparticle mass transfer mechanism, an equivalent surface diffusivity coefficient
(Ds) was calculated to determine whether using a surface diffusivity coefficient instead of the
pore diffusivity coefficient would alter the FPSDM results. Estimation of the surface diffusivity
coefficient (Ds) was completed using the following equation by Crittenden et al. [33] :
(33)
The value of (Ds) calculated based on equation (33) was found to be (1.17 x 10⁻⁸
cm2/sec)
which is four orders of magnitude lower than the Dp,e value listed in Table 4-3. This finding
indicates that surface diffusion can be neglected in comparison with pore diffusion and justifies
the single use of Dp,e in the FPSDM calculations.
93
4.6.3 Fixed-Bed Adsorption Results
4.6.3.1 Effect of Bed Height
The effect of bed height on the breakthrough profiles for the adsorption of chloroform
onto granular zeolite ZSM-5 was studied. The experimental and predicted breakthrough profiles
obtained at different bed heights (6, 9, and 12 cm), a constant flow rate (5.2 cm3/min), and a
constant initial chloroform concentration (450 µg/L) are shown in Figure 4-3. The resulting
plots showed the typical ‗S‘ shape of a packed-bed adsorption system with an initial period of
negligible solute, followed by gradual breakthrough that slowly approached the solute influent
concentration. The ―S‘ shape profile in fixed-bed adsorption is generally associated with solutes
of smaller molecular weight and simple structure, and is not observed in adsorbates with larger
molecular weights such as dyes [66, 124] . It is obvious from Figure 4-3 that an increase in bed
height increases the breakthrough time, resulting in longer service time. This is because of the
increase in the amount of adsorbent mass, which results in greater adsorption sites with
increasing bed height. For example, an extension of the service time from 3.5 days to 11.18 days
was obtained at 18% breakthrough upon increasing the bed height from 6 cm to 12 cm at a flow
rate of 5.2 ml/min.
4.6.3.2 FPSDM Results
In solving the FPSDM equations, the mass transport parameters Ez and kf are required as
system inputs. These parameters were estimated initially from correlations listed in Table 4-3.
Then, using the correlations in Table 4-3, a range of values for both kf and Ez parameters was
obtained (1.74 x 10⁻³
cm/sec < kf < 6.12 x 10⁻³
cm/sec) and (7.67 x 10⁻³
cm2/sec < Ez < 1.11 x 10
-
1 cm
2/sec) and used in obtaining the FPSDM predicted breakthrough curves. Both Ez and kf mass
transport correlations depend on the free liquid diffusivity of chloroform in water (Dl). The value
94
of (Dl) was estimated using the Wilke-Chang correlation (Table 4-3) and found to be 6.86 x 10⁻⁶
cm2/sec.
Further optimization using the simplex method (equation 20) was performed on the
experimental and predicted breakthrough curves for the three beds with different heights until a
minimum sum of the objective function for the three beds with different heights was fulfilled.
The best fit values of Ez and kf for the three beds with different heights obtained by fitting the
mathematical model to the experimental breakthrough curves and further optimization using the
above criterion were Ez = 4.95 x 10⁻²
cm2/sec and kf = 5.2 x 10
-3 cm/sec. The values of Ez and kf
were used in creating the predicted breakthrough profiles shown in Figure 4-3. The equivalent
values of Ez, kf, and Dp,e in dimensionless form, Pe, St, and Ed, for the three beds with different
heights are summarized in Table 4-5. In general, good agreement was obtained between the
experimental and theoretical breakthrough profiles. This implied that the FPSDM could be used
to predict the breakthrough kinetics of chloroform adsorption onto granular zeolites. However, in
the case of the 12 cm bed, the theoretical prediction underestimated the experimental profile at
high C/C0 values. This deviation between experimental and predicted breakthrough profiles
could possibly be attributed to the dissimilarities between bed adsorption capacities determined
by batch and column studies as previously reported by other researchers [115, 125] . Bed
capacities as calculated from batch isotherm studies could be different from those calculated by
column experiments due to the incomplete achievement of equilibrium in the case of batch
adsorption. The solid phase equilibrium adsorption capacity for the chloroform-ZSM-5 system
calculated by the linear isotherm equation was found to be 5.60 mg/g, while the bed capacities
calculated from the breakthrough profiles were essentially constant for the three runs with
different heights and equal to 6.88 mg/g.
95
Under the conditions investigated in this work, both the external mass transfer coefficient
(kf) and the axial dispersion coefficient (Ez) remained constant with varying bed heights. Since
the hydraulic loading remained constant in the beds with different heights, it is expected that
both the film resistance to mass transfer and axial dispersion effects will remain unchanged. By
looking at the values of the dimensionless mass transport parameters listed in Table 4-5, it can be
seen that increasing the bed height at constant flow rate and constant initial solute concentration
increased the values of Peclet number (Pe), Stanton number (St), and the intraparticle diffusion
modulus (Ed). However, Biot number (Bi) which is defined as the ratio of the external mass
transfer to the intraparticle mass transfer remained constant for the three beds with different
heights. As Bi increases, the liquid-phase mass transfer becomes faster than the intraparticle mass
transfer indicating a decrease in the mass transfer resistance compared to the intraparticle mass
transfer resistance. Hence, for large Bi values (larger than 30 [38] ), the intraparticle mass
transfer controls the adsorption rate. On the other hand, at low Bi values, less than 0.5 [38] , the
liquid mass transfer controls the adsorption rate. The low Biot number (Bi = 0.65) values for the
system under investigation indicates that film diffusion rather than intraparticle diffusion is the
controlling mechanism. These results are in agreement with those obtained by [126] .
4.6.4 Sensitivity Analysis
A sensitivity analysis to assess the relative impact of changes in kinetic parameters on the
concentration profiles calculated by the FPSDM was performed (Figure 4-4, 4-5, and 4-6). The
model parameters that were examined include: film transfer coefficient (kf), effective pore
diffusivity coefficient (Dp,e), and axial dispersion coefficient (Ez). The baseline utilized the initial
parameters reported in Table 4-2. The model parameters kf, Dp,e, and Ez were varied by ±25%
and the percent sensitivity was determined by dividing the change in the concentration profile for
96
±25% variation in kf or Dp,e or Ez by the total change in the concentration profile for ±25%
variation in the three parameters [38] . The predicted profiles were most sensitive to kf (%
sensitivity = 100%), followed by Ez (% sensitivity = 25%), and least sensitive to Dp,e (%
sensitivity = 2%). This indicates that (kf) has a greater impact on the model calculations than
both Ez and Dp,e and suggests that mass transfer for chloroform onto granular zeolite ZSM-5
would be limited by film diffusion which is consistent with the estimated Bi values. Therefore,
accurate estimation of the film diffusion coefficient is important for accurate breakthrough
prediction. While the correlations used to estimate Ez and the batch adsorption experiments used
to estimate Dp,e were satisfactory in determining these parameters.
The greater influence of film diffusion on chloroform breakthrough could be explained by
the relatively low concentrations of chloroform used in this study. For low solute concentrations,
it is expected that as soon as the solute reaches the outer surface of the adsorbent it penetrates
through its pores and that undergoes a low intraparticle mass transfer resistance [127] . Hence,
the major mass transport resistance is between the liquid-solid interface and the bulk solution.
4.7 Conclusions
The film pore and surface diffusion model (FPSDM) describing single solute adsorption in
a fixed-bed using linear isotherm was applied to adsorption of chloroform onto granular zeolite
ZSM-5 in fixed bed columns. The model, which consists of a system of partial differential
equations (PDEs), accounts for the effects of axial dispersion, film diffusion, and internal
diffusional mass-transfer resistances. Solution of the resulting PDEs was achieved with Matlab
using the implicit finite difference method. The numerical simulation was satisfactory in
predicting the experimental fixed-bed adsorption data. However, some deviations were found
97
between the experimental and predicted breakthrough curves, which could be due to differences
between batch and column adsorption capacities.
A sensitivity analysis to determine the relative importance of different kinetic parameters
on the FPSDM calculations was performed and showed that a ±25% change in kf had a greater
impact on the breakthrough results than that caused by a ±25% variation in either Ez or Dp,e. This
result is in agreement with the values for Biot number calculated from the FPSDM which were
smaller than 1 (Bi = 0.65), indicating high film resistance. Therefore, in this study, film diffusion
is demonstrated to be the primary controlling mass transfer mechanism, and must be accurately
determined for good breakthrough predictions. Accurate estimation of the film diffusion
coefficient can be attained experimentally by running short fixed-bed adsorbers under
hydrodynamic conditions similar to those expected in practice.
Finally, a single value of the effective diffusivity coefficient was obtained by fitting batch
adsorption kinetics to the theoretical curves of a pore diffusion with sorption model and found to
be sufficient in predicting the model breakthrough profiles accurately.
4.8 Acknowledgements
The authors acknowledge the financial support from Triton Systems, Inc. of Chelmsford,
MA, and the support by the National Institutes of Health through grant 2R44 ES012784-02. The
authors also acknowledge the financial support from the Civil & Environmental Engineering
Department at WPI. The authors appreciate the assistance provided by Gerardo Hernandez and
Chase Johnson from the Department of Mathematical Sciences at WPI and the assistance
provided by Donald Pellegrino with lab experiments.
98
4.9 Nomenclature
C0 = initial liquid phase concentration (for the fixed-bed adsorber), µg/cm3
Cb= bulk liquid phase concentration in the column, µg/cm3
Ce = the equilibrium liquid phase concentration of solute in the batch reactor solution (for the
pore diffusion-sorption model), µg/cm3
Ci = the initial liquid phase concentration of solute in the batch reactor solution (for the pore
diffusion-sorption model), µg/cm3
Cp= liquid phase concentration inside the pores, µg/cm3
Ct = the liquid phase concentration of solute in the batch reactor solution at time t (for the pore
diffusion-sorption model), µg/cm3
Da = apparent pore diffusivity, cm2/sec (for the pore diffusion-sorption model)
Di = combined intraparticle diffusivity coefficient, cm2/sec
Dl = free liquid diffusivity coefficient, cm2/sec
Dp,e = effective pore diffusivity coefficient, cm2/sec
Ds = surface diffusivity coefficient, cm2/sec
Ds,p = apparent pore diffusivity that takes surface diffusivity into account, cm2/sec
dc = column diameter, cm
dp = mean particle diameter, cm
Ez = axial dispersion coefficient, cm2/sec
K = linear isotherm capacity constant, L/g
kf = external film transfer coefficient, cm/sec
L = length of the column, cm
Mt = the total amount of solute in the adsorbent particle after time t (for the pore diffusion-
sorption model)
M∞ = the total amount of solute in the adsorbent particle after infinite time (for the pore
diffusion-sorption model)

99
Q= flow rate, cm3/min
q= solid phase concentration, µg/g
qe = solid phase concentration in equilibrium with C0, equal to KC0, µg/g
R = particle radius, cm
r = radial position inside particles, cm
Ttem = Temperature in (K) (used in the Wilke-Chang equation)
t = time, sec
V = interstitial velocity, cm/sec
Vs = discharge velocity, cm/sec
Va = molal volume of solute, cm3/mol (used in the Wilke-Chang equation)
Vp = pore volume per mass of adsorbent cm3/g (used in estimating the solid density of the
adsorbent)
VR,P = the volume of solution in the batch reactor served by each spherical granular zeolite
particle, cm3 (for the pore diffusion-sorption model)
z = axial position in column, cm
Dimensionless Variables and parameters:
Bi = St/Ed = Biot number
= Cb/C0= dimensionless liquid phase concentration
= dimensionless liquid phase concentration at point (i) used in the estimation of φ
= the FPDSM value of the dimensionless liquid phase concentration at point (i) used in the
estimation of φ
= Cp/C0= dimensionless liquid phase concentration inside the pores
Dg = solute distribution ratio
Ed = intraparticle diffusion modulus
Mfit = the value of the solute fractional uptake calculated from (equation 30)
N = number of experimental values used in the estimation of Φ
100
Pe = Peclet number
Re = Vdp/ν = Reynolds number
= r/R = dimensionless radial position inside particles
Sc = ν/Dl = Schmidt number
St = Stanton number
T = t/τ(1+Dg) = dimensionless time (for the FPDSM)
= Dat/R2 = dimensionless time (for the pore diffusion-sorption model)
Un = the non-zero roots of
which is used in the calculation of Mfit (equation 30)
Wg,mo,s = molecular weight of solvent (used in the Wilke-Chang equation)
= z/L = dimensionless axial position in column
Greek Letters:
ε = fixed-bed void fraction
εp = particle void fraction
ρa = apperant particle density, g/cm3
ρb = bulk particle density, g/cm3
ρs = Solid particle density, g/cm3
ν = liquid kinematic viscosity, cm2/sec
µ = liquid dynamic viscosity, g/cm.sec
µv = liquid dynamic viscosity in (centipoises) (used in the Wilke-Chang equation)
τ = L/V = fixed-bed contact time
φ = objective function for optimization (equation 20)
φs = solvent association term which equals 2.6 for water (used in the Wilke-Chang equation)
φv = the ratio between the volumes of solution and the adsorbent particle (for the pore diffusion-
sorption model)
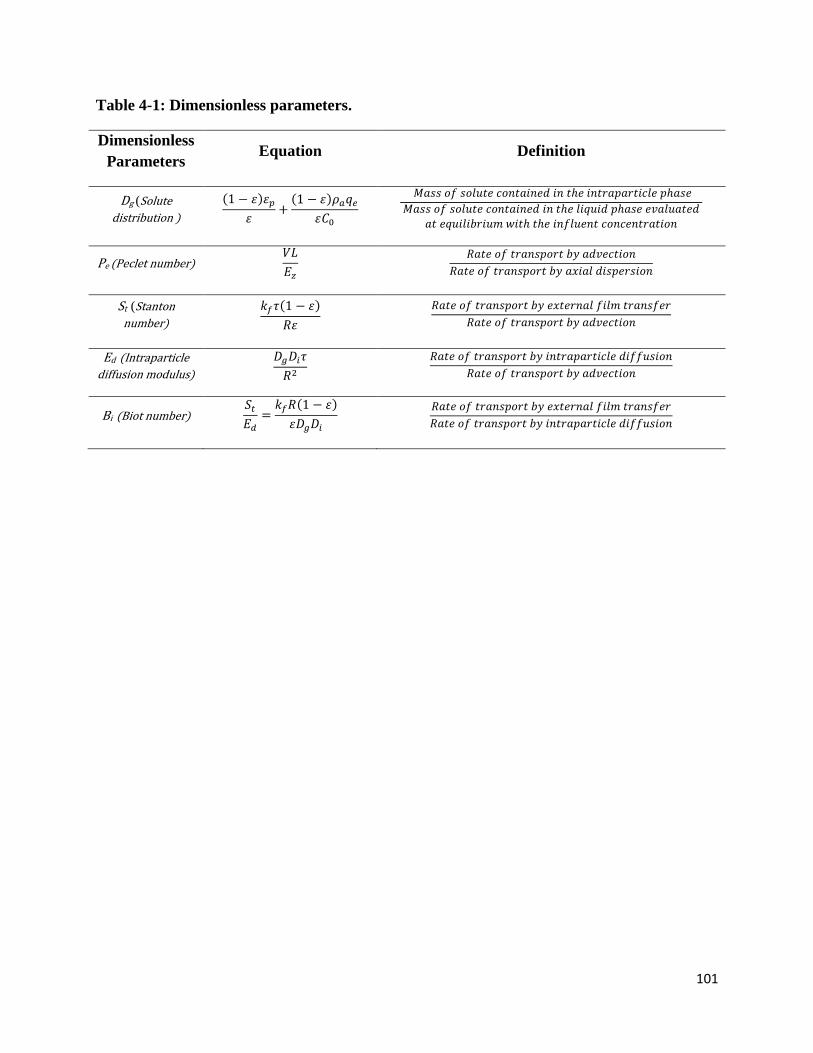
101
Table 4-1: Dimensionless parameters.
Dimensionless
Parameters Equation Definition
Dg (Solute
distribution )
Pe (Peclet number)
St (Stanton
number)
Ed (Intraparticle
diffusion modulus)
Bi (Biot number)
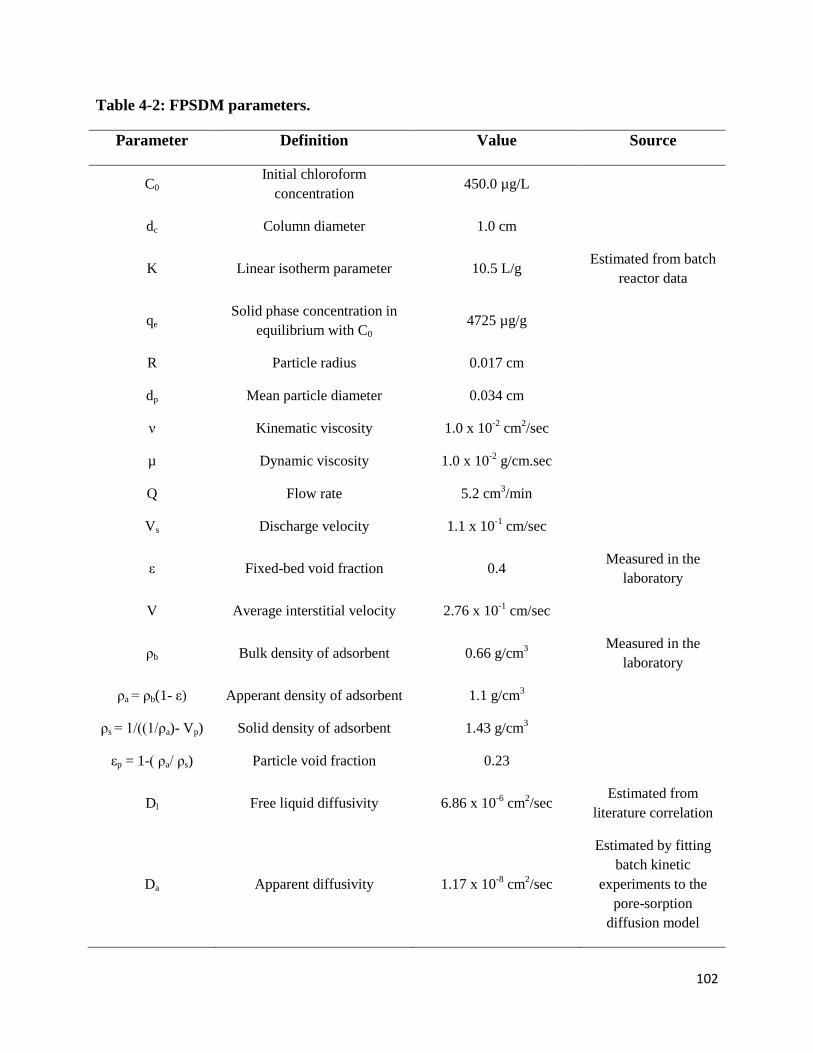
102
Table 4-2: FPSDM parameters.
Parameter Definition Value Source
C0 Initial chloroform
concentration 450.0 µg/L
dc Column diameter 1.0 cm
K Linear isotherm parameter 10.5 L/g Estimated from batch
reactor data
qe Solid phase concentration in
equilibrium with C0 4725 µg/g
R Particle radius 0.017 cm
dp Mean particle diameter 0.034 cm
ν Kinematic viscosity 1.0 x 10⁻²
cm2/sec
µ Dynamic viscosity 1.0 x 10⁻²
g/cm.sec
Q Flow rate 5.2 cm3/min
Vs Discharge velocity 1.1 x 10⁻¹
cm/sec
ε Fixed-bed void fraction 0.4 Measured in the
laboratory
V Average interstitial velocity 2.76 x 10⁻¹
cm/sec
ρb Bulk density of adsorbent 0.66 g/cm3
Measured in the
laboratory
ρa = ρb(1- ε) Apperant density of adsorbent 1.1 g/cm3
ρs = 1/((1/ρa)- Vp) Solid density of adsorbent 1.43 g/cm3
εp = 1-( ρa/ ρs) Particle void fraction 0.23
Dl Free liquid diffusivity 6.86 x 10⁻⁶
cm2/sec
Estimated from
literature correlation
Da Apparent diffusivity 1.17 x 10⁻⁸
cm2/sec
Estimated by fitting
batch kinetic
experiments to the
pore-sorption
diffusion model
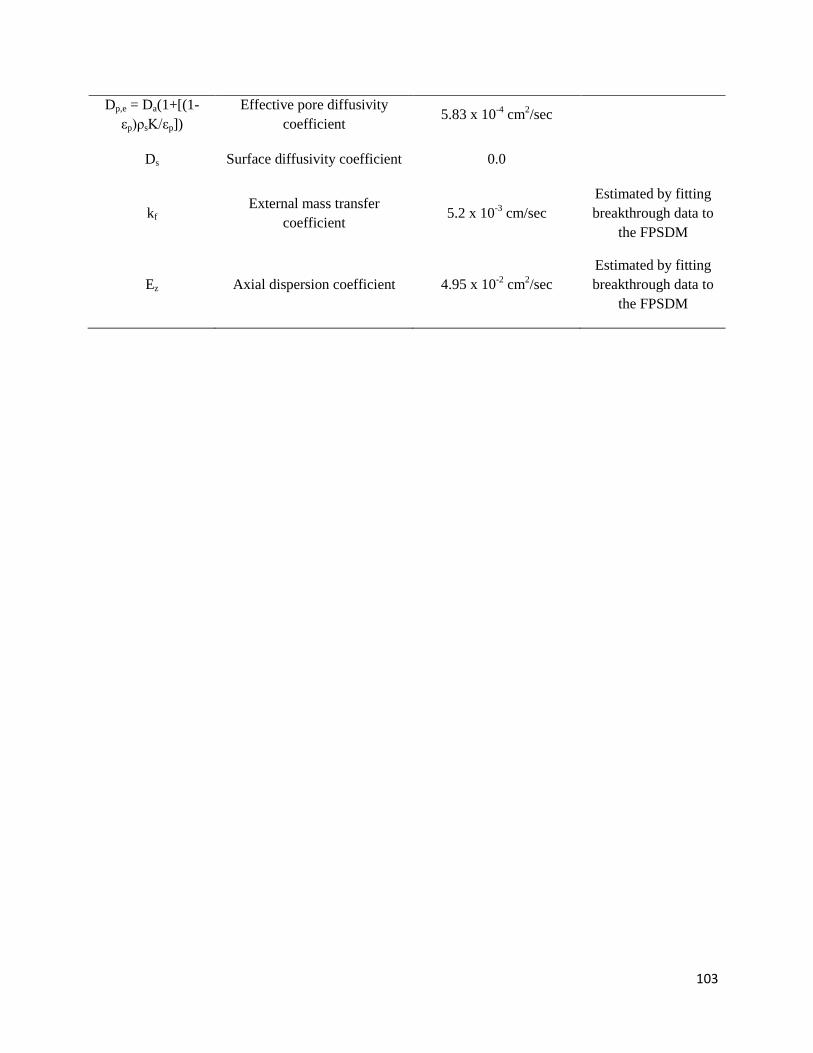
103
Dp,e = Da(1+[(1-
εp)ρsK/εp])
Effective pore diffusivity
coefficient 5.83 x 10
-4 cm
2/sec
Ds Surface diffusivity coefficient 0.0
kf External mass transfer
coefficient 5.2 x 10
-3 cm/sec
Estimated by fitting
breakthrough data to
the FPSDM
Ez Axial dispersion coefficient 4.95 x 10⁻²
cm2/sec
Estimated by fitting
breakthrough data to
the FPSDM

104
Table 4-3: Correlations for obtaining external mass transfer coefficient, axial dispersion
coefficient, and free liquid diffusivity.
Correlations
and references Equation limits Value
Frossling, 1938
[128]
1.74 x 10
-3
cm/sec
Wilson &
Geankoplis,
1966 [129]
0.0016 < Re < 55
950 < Sc < 70,000
6.12 x 10⁻³
cm/sec
Williamson,
1963 [130]
0.08 < Re < 125
150 < Sc < 1300
4.06 x 10⁻³
cm/sec
Gnielinski, 1978
[131]
Re < 100
3.49 x 10⁻³
cm/sec
Dwivedi &
Upadhyey, 1977
[111]
Re < 10
2.50 x 10⁻³
cm/sec
Tang & Fan,
1990 [132]
1.11 x 10
-1
cm2/sec
Chung &Wen,
1968 [133]
4.42 x 10
-2
cm2/sec
Fried, 1975
[134]
7.67 x 10⁻³
cm2/sec
Wilke-Chang,
1955 [135]
6.86 x 10⁻⁶
cm2/sec
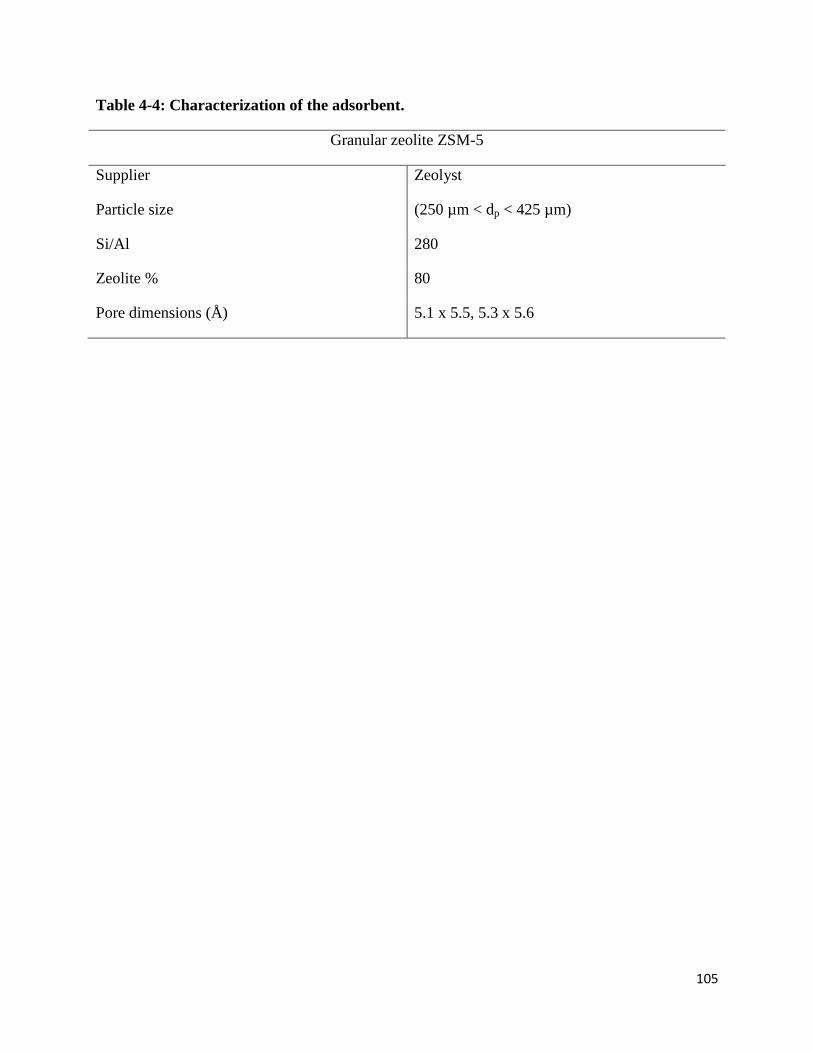
105
Table 4-4: Characterization of the adsorbent.
Granular zeolite ZSM-5
Supplier Zeolyst
Particle size (250 µm < dp < 425 µm)
Si/Al 280
Zeolite % 80
Pore dimensions (Å) 5.1 x 5.5, 5.3 x 5.6
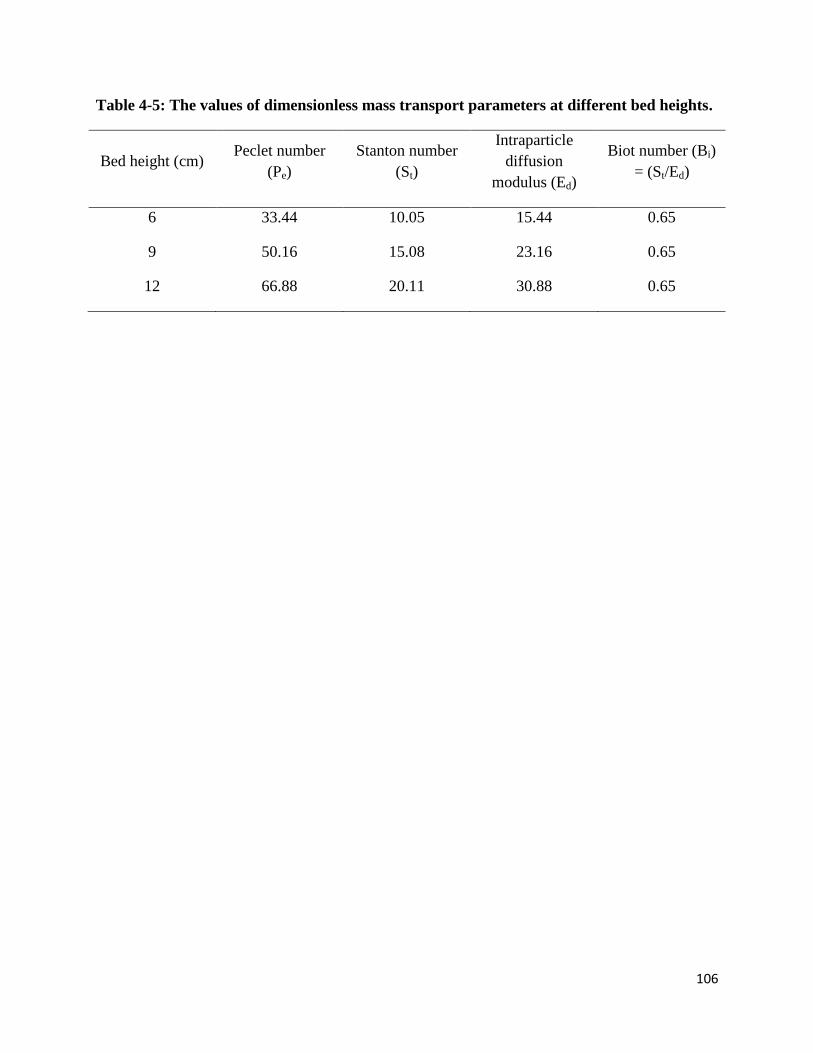
106
Table 4-5: The values of dimensionless mass transport parameters at different bed heights.
Bed height (cm) Peclet number
(Pe)
Stanton number
(St)
Intraparticle
diffusion
modulus (Ed)
Biot number (Bi)
= (St/Ed)
6 33.44 10.05 15.44 0.65
9 50.16 15.08 23.16 0.65
12 66.88 20.11 30.88 0.65
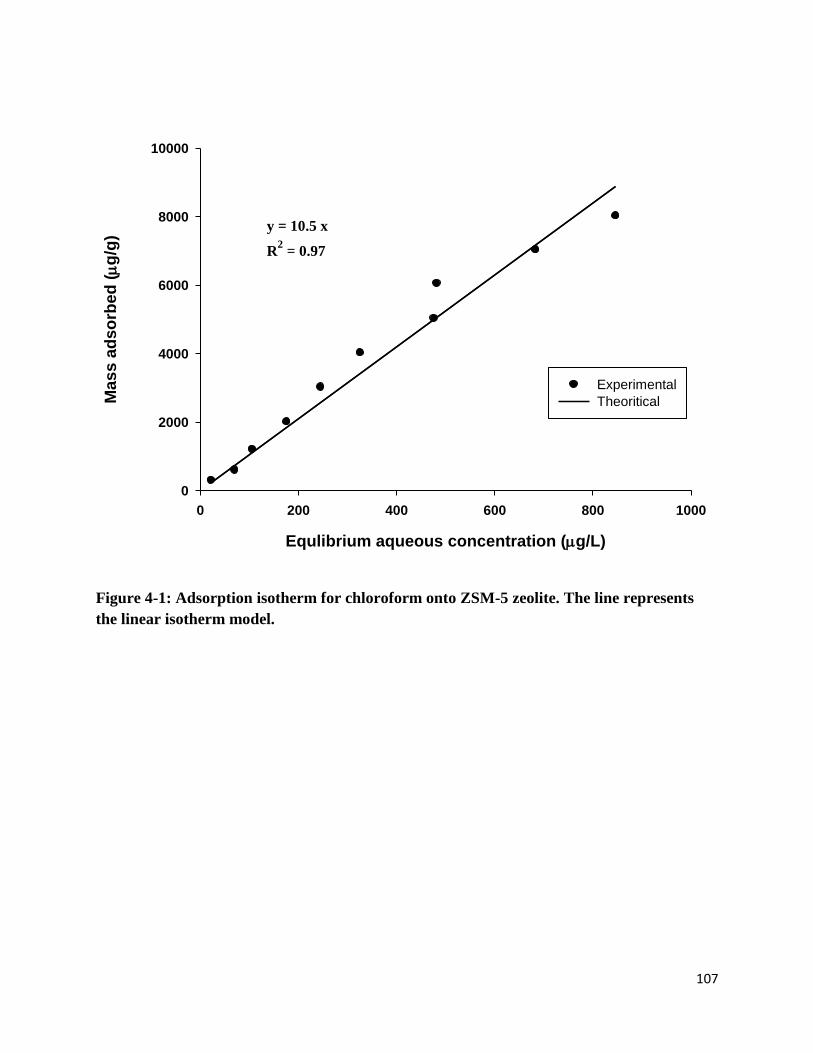
107
Equlibrium aqueous concentration (g/L)
0 200 400 600 800 1000
Ma
ss
ad
so
rbe
d (
g/g
)
0
2000
4000
6000
8000
10000
Experimental
Theoritical
y = 10.5 x
R2
= 0.97
Figure 4-1: Adsorption isotherm for chloroform onto ZSM-5 zeolite. The line represents
the linear isotherm model.

108
Time (min)
0 100 200 300 400
C\C
0
0.0
0.2
0.4
0.6
0.8
1.0
250 m < dp < 425 m
425 m < dp < 850 m
850 m < dp < 1400 m
Original 1.6 mm
Theoritical
Figure 4-2: Comparison of the measured concentration-time data with that predicted by
the pore-sorption diffusion model for the adsorption of chloroform onto four sizes of
granular zeolite ZSM-5 in batch adsorber.
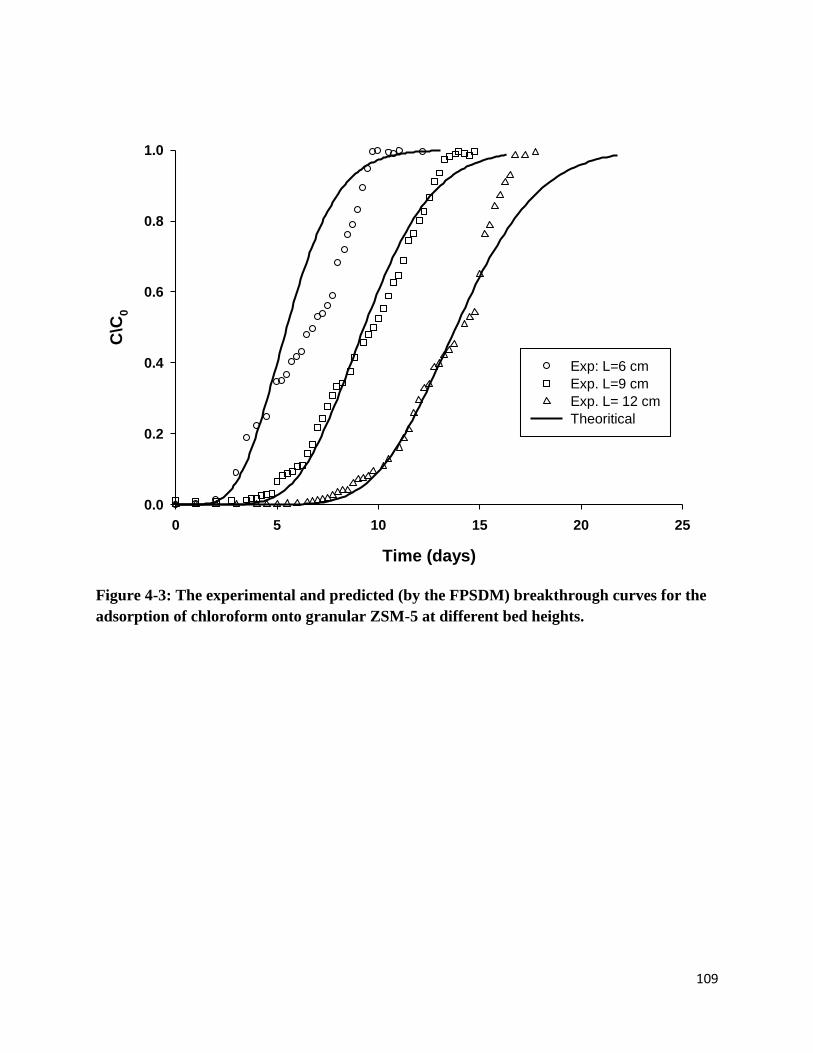
109
Time (days)
0 5 10 15 20 25
C\C
0
0.0
0.2
0.4
0.6
0.8
1.0
Exp: L=6 cm
Exp. L=9 cm
Exp. L= 12 cm
Theoritical
Figure 4-3: The experimental and predicted (by the FPSDM) breakthrough curves for the
adsorption of chloroform onto granular ZSM-5 at different bed heights.
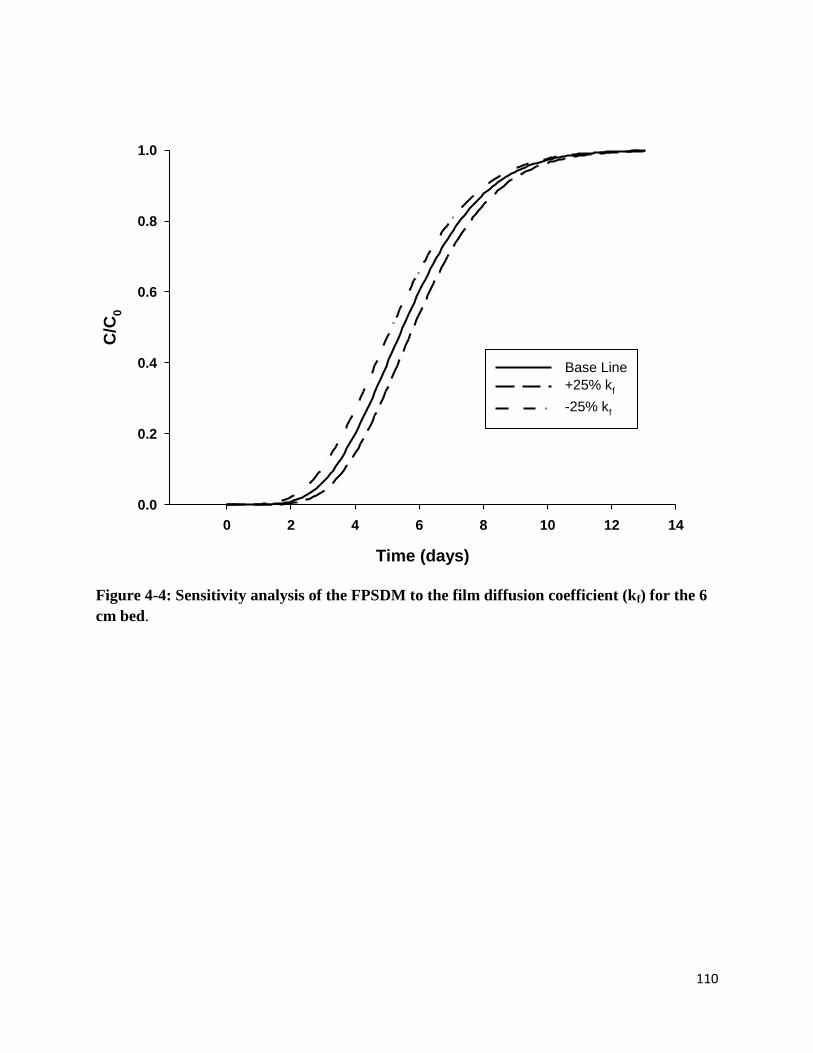
110
Time (days)
0 2 4 6 8 10 12 14
C/C
0
0.0
0.2
0.4
0.6
0.8
1.0
Base Line
+25% kf
-25% kf
Figure 4-4: Sensitivity analysis of the FPSDM to the film diffusion coefficient (kf) for the 6
cm bed.

111
Time (days)
0 2 4 6 8 10 12 14
C/C
0
0.0
0.2
0.4
0.6
0.8
1.0
Base Line
+25% Ez
-25% Ez
Figure 4-5: Sensitivity analysis of the FPSDM to the film diffusion coefficient (Ez) for the 6
cm bed.

112
Time (days)
0 2 4 6 8 10 12 14
C/C
0
0.0
0.2
0.4
0.6
0.8
1.0
Base Line
+25% Dp,e
-25% Dp,e
Figure 4-6: Sensitivity analysis of the FPSDM to the film diffusion coefficient (Dp,e) for the
6 cm bed.
113
5 Conclusions and Recommendations for Future Work
5.1 Conclusions
Clean drinking water is one of the implicit requisites for a healthy human population.
However, growing industrialization and extensive use of chemicals for various concerns, has
increased the burden of unwanted contaminants in drinking water. Synthetic and natural organic
chemicals are considered among the most undesirable contaminants found in drinking water.
These compounds include taste and odor causing synthetic organic chemicals, pesticides,
gasoline additives, disinfection by products, pharmaceuticals, and personal care products, some
of which may be carcinogenic or pose other health risks.
As a consequence of this ever-increasing number of emerging compounds that provide
potential environmental threats, methods for their identification, evaluation and removal are
progressively under research. In particular, this study was focused on evaluating the adsorption
process for removing specific organic contaminants, as adsorption is one of the most effective
methods to remove organic contaminants from water. More specifically, the removal of
chloroform and MTBE from water by adsorption onto granular zeolites was evaluated using
batch and fixed-bed adsorption studies. In addition, a computational model that describes the
dynamic behavior of the adsorption process in fixed-bed adsorbers was applied. This study was
performed in three parts; the first two parts were done experimentally (chapter 2 and chapter 3),
and the third part was done through computational modeling (chapter 4).
Chapter 2 focused on evaluating the equilibrium and kinetic adsorption of MTBE onto
granular zeolites, a coconut shell granular activated carbon (CS-1240), and a commercial carbon
adsorbent (CCA). In addition, the effect of natural organic matter (NOM) on MTBE adsorption
114
was evaluated. Equilibrium studies determined that MTBE can be effectively removed from
water using granular zeolite ZSM-5. The adsorption capacity of ZSM-5 granular zeolite for
MTBE was influenced by the adsorbent hydrophobicity and large pore sizes at high aqueous
phase MTBE concentrations and by the adsorbent‘s small pore sizes (at low MTBE
concentrations). Furthermore, it was observed that the MTBE rate of adsorption increased with
decreasing granular size of the zeolite. Further equilibrium and kinetic experiments verified that
granular ZSM-5 was superior to CS-1240 and CCA in removing MTBE from water. No
competitive-adsorption effects between NOM and MTBE were observed for adsorption to
granular ZSM-5 or CS-1240, however there was competition between NOM and MTBE for
adsorption onto the CCA granules. In order to further understand and predict the dynamic
behavior of MTBE adsorption onto granular ZSM-5, fixed-bed adsorption experiments were
performed and the effect of bed height on the breakthrough results was evaluated through the
application of the bed depth service time model (BDST). It was found that the MTBE
breakthrough profiles were well characterized by the BDST model.
Chapter 3 addresses the evaluation of the efficiency of granular zeolites, a coconut shell
granular activated carbon (CS-1240), and a commercial carbon adsorbent (CCA) for adsorption
of chloroform from water. In addition, the effects of adsorbent grain sizes and natural organic
matter (NOM) on chloroform adsorption capacity were evaluated. The primary factors affecting
the efficiency of adsorption of chloroform on granular zeolites were (at low chloroform
concentrations) the small pore size and the high framework densities of granular zeolites and (at
high chloroform concentrations) the high Si/Al ratios and large zeolite pore size. Among all the
granular zeolites that were tested, ZSM-5 with the smallest grain size (between 250 and 425 µm)
was the most effective in removing chloroform from water. The presence of up to 5 mg/L of
115
NOM and other constituents in water had minimal effect on the adsorption capacities of ZSM-5,
CCA, and CS-1240. Further kinetic studies obtained with ZSM-5, CCA, and CS-1240 in fixed-
bed adsorbers indicated that granular ZSM-5 had a higher adsorption rate of chloroform than
both CCA, and CS-1240. Finally, the effect of bed height on the adsorption of chloroform in
fixed-bed adsorption experiments with granular ZSM-5 (diameters between 250 µm and 425 µm)
was evaluated using three different bed heights (6, 9, and 12 cm). The BDST model was used to
analyze the breakthrough data obtained from the fixed-bed adsorption tests and found to provide
a good description of the breakthrough data.
Chapter 4 focused on developing a mathematical model for describing the dynamic
response for adsorption of chloroform in fixed-bed adsorption systems using linear adsorption
isotherms. The model equations which take into account the effects of axial dispersion, film
diffusion, and intraparticle diffusion mechanisms were derived using continuity principles and
mass balance relations. Because of their highly non-linear nature, the resulting set of partial
differential equations was solved numerically using the implicit finite difference method in
Matlab. In general, the simulated results obtained from this model agreed well with the
experimental chloroform breakthrough profiles. Furthermore, a sensitivity analysis was carried
out to investigate the relative impact of kinetic parameters on the predicted breakthrough profiles
and showed that the model calculations were insensitive to either the effective pore diffusivity
coefficient (Dp,e) or the axial dispersion coefficient (Ez) and were sensitive to the external mass
transfer coefficient (kf). In addition, Biot number which measures the ratio of external to internal
mass transfer resistances within the column was found to be low (Bi = 0.65) indicating a film
diffusion controlled process.
116
Lastly, the effective pore diffusivity coefficient (Dp,e) which was determined by fitting a
pore diffusion-sorption model to chloroform rate adsorption results, and the axial dispersion
coefficient which was estimated from literature correlations, were found to be sufficient in
predicting the model breakthrough profiles. However, the film diffusion coefficient (kf) needs to
be determined more accurately since it has a greater impact on the model breakthrough profiles
than both Ez and Dp,e.
Overall, this research has illustrated that granular zeolites have high potential for
removing chloroform and MTBE from water. However, the cost could inhibit their ultimate
implementation. To reduce overall system costs, studies are being done to evaluate the
possibility of regenerating the zeolites with minimal loss of their sorption ability. In addition, the
comprehensive model developed herein is useful in the design and analysis of fixed-bed
adsorbers treating single component solutes, where all mass-transfer resistances of intraparticle
and film diffusion and axial dispersion are taken into account.
5.2 Recommendations for Future Work
There several topics that can be addressed in continuation to this work. A brief discussion
of these issues is presented below.
5.2.1 Regeneration of Zeolite-Bound Contaminants by Advanced Oxidation
After the removal of chloroform and MTBE from water by adsorption onto zeolites, their
complete or partial destruction can be achieved by advanced oxidation. Following the work by
Koryabkina et al. [87] , regenerating the zeolite-bound contaminants with H2O2 based advanced
oxidation is possible. In advanced oxidation processes, the reactions lead to the formation of
hydroxyl radicals which have the ability to mineralize organic compounds.

117
5.2.2 Study the Effects of Solution Flow Rate, Initial Solute Concentration, and
Adsorbent Particle Size on Fixed-Bed Adsorption Systems
In the study, the effect of bed height on the adsorption of chloroform and MTBE in fixed-
bed adsorbers was studied. However, studying the effects of changing other operating conditions
such as the solution flow rate, initial solute concentration, and adsorbent particle size can be very
useful in the design of adsorption columns. Once fixed-bed adsorption experiments are
performed using different flow rates, adsorbent particle sizes, and initial concentrations, the
resulting breakthrough profiles can be compared with the FPSDM predicted breakthrough
profiles. These results will improve our understanding of adsorption phenomena with respect to
the limiting adsorption step (film diffusion or intraparticle diffusion) and will be very useful in
enhancing the reliability of the FPSDM in predicting complex systems encountered in real
applications.

118
6 References
[1] WHO, Guidelines for drinking water quality. World Health Organization, 2006.
[2] Jarvie, M. E., Hand, D. W., Bhuvendralingam, S., Crittenden, J. C., Hokanson, D. R.,
Simulating the performance of fixed-bed granular activated carbon adsorbers: Removal of
synthetic organic chemicals in the presence of background organic matter, Water Research 39
(2005) 2407-2421.
[3] Shih, T. C., Wangpaichitr, M., Suffet, M., Evaluation of granular activated carbon technology
for the removal of methyl tertiary butyl ether (MTBE) from drinking water, Water Res. 37
(2003) 375-385.
[4] Chen, P. H., Jenq, C. H., Chen, K. M., Evaluation of granular activated carbon for removal of
trace organic compounds in drinking water, Environ. Int. 22 (1996) 343-359.
[5] Chen, D. Z., Zhang, J. X., Chen, J. M., Adsorption of methyl tert-butyl ether using granular
activated carbon: Equilibrium and kinetic analysis, Int. J. Environ. Sci.Tech. 7 (2010) 235-242.
[6] Giaya, A., Thompson, R. W., Denkewicz Jr., R., Liquid and vapor phase adsorption of
chlorinated volatile organic compounds on hydrophobic molecular sieves, Micropor. Mesopor.
Mat. 40 (2000) 205-218.
[7] Abu-Lail, L., Bergendahl, J. A., Thompson, R. W., Adsorption of methyl tertiary butyl ether
on granular zeolites: Batch and column studies, J. Hazard. Mater. 178 (2010) 363-369.
[8] Erdem-Senatalar, A., Bergendahl, J. A., Giaya, A., Thompson, R. W., Adsorption of methyl
tertiary butyl ether on hydrophobic molecular sieves, Environ. Eng. Sci. 21 (2004) 722-729.
[9] Rossner, A., Knappe, D. R. U., MTBE adsorption on alternative adsorbents and packed bed
adsorber performence, Water Res. 42 (2008) 2287-2299.
[10] Anderson, M. A., Removal of MTBE and Other Organic Contaminants from Water by
Sorption to high silica Zeolites, Environ. Sci. Technol. 34 (2000) 725-727.
[11] Weber Jr., W. J., DiGiano, F. A., Process dynamics in environmental systems, John Wiley
& Sons, Inc., New York, 1996.
[12] Droste, R. L., Theory and practice of water and wastewater treatment, John Wiley & Sons,
Inc., New York, 1997.
119
[13] Szostak, R., Molecular sieves: principles of synthesis and identification, Blackie Academic
& Professional, an Imprint of Thomson Science, London, 1998.
[14] Kawai, T., Yanagihara, T., Tsutsumi, K., Adsorption Characteristics of Chloroform on
Modified Zeolites from Gaseous Phase as well as its Aqueous Solution, Colloid Polym. Sci. 272
(1994) 1620-1626.
[15] Li, S., Tuan, V. A., Noble, R. D., Falconer, J. L., MTBE adsorption on all-silica zeolite,
Environ. Sci. Technol. 37 (2003) 4007-4010.
[16] Kokotailo, G. T., Lawton, S. L., Olson, D. H., Meier, W. M., Structure of synthetic zeolite
ZSM-5, Nature 272 (1978) 437-438.
[17] McCusker, L. B., Baerlocher, C., "Zeolite structures'" in Introduction to zeolite science and
practice, Elsevier Sciences, 2001.
[18] IZA, International Zeolite Association, Delaware, Jan. 12, www.iza-online.org.
[19] USEPA, Drinking Water Advisory: Consumer acceptability advice and health effects
analysis on Methyl Tertiary-Butyl Ether (MTBE), 1997.
[20] USEPA(California), Public health goal for methyl tertiary butyl ether (MTBE) in drinking
water, 1999.
[21] WHO, Methyl tertiary-butyl ether. Environmental Health Criteria 206.World Health
Organization, 1998.
[22] USDHHS, National toxicology program.Tenth report on carcinogens. Public Health Service,
U.S. Department of Health and Human Services (USDHHS), 2002.
[23] Chang, P., Young, T., Kinetics of methyl tert-butyl ether degradation and by-product
formation during UV/hydrogen peroxide water treatment, Water Res. 34 (2000) 2233-2240.
[24] Acero, J., Haderlein, S., Schmidt, T., Suter, M., Von Gunten, U., MTBE oxidation by
conventional ozonation and the combination ozone/hydrogen peroxide: Efficiency of the
processes and bromate formation, Environ. Sci. Technol. 35 (2001) 4252-4259.
[25] Fiessinger, F., Rook, J., Duguet, J., Alternative methods for chlorination, Sci. Total. Environ
47 (1985) 299-315.
[26] USEPA, National Primary Drinking Water Regulations: Disinfectants and Disinfection
Byproducts, Final rule. 40 CFR Parts 9, 141, & 142, Fed. Reg. 63 (1998) 69389.

120
[27] Sutherland, J., Adams, C., Kekobad, J., Treatment of MTBE by air stripping, carbon
adsorption, and advanced oxidation: technical and economic comparison for five groundwaters,
Water Res. 38 (2004) 193-205.
[28] de Arruda, T., Jardim, W. F., Treatment of groundwater contaminated with chlorinated
compounds using elemental iron and Fenton's reagent, Quim. Nova. 30 (2007) 1628-1632.
[29] Bergendahl, J. A., Thies, T. P., Fenton's oxidation of MTBE with zero-valent iron, Water
Res. 38 (2004) 327-334.
[30] Urano, K., Yamamoto, E., Tonegawa, M., Fujie, K., Adsorption of chlorinated organic-
compounds on activated carbon from water, Water Res. 25 (1991) 1459-1464.
[31] Knappe, D. R. U., Rossner, A., Effectiveness of high-silica zeolites for the adsorption of
methyl tertiary-butyl ether from natural water, Water Sci. Technol. 5 (2005) 83.
[32] Weber, J., W. J., Smith, E. H., Simulation and design models for adsorption processes,
Environ. Sci. Technol. 21 (1987) 1040-1050.
[33] Crittenden, J. C., Hutzler, N. J., Geyer, D. G., Oravitz, J. L., Friedman, G., Transport of
organic-compounds with saturated groundwater-flow-model development and parameter
sensitivity, Water Resour. Res. 22 (1986) 271-284.
[34] Ko, D. C. K., Porter, J. F., MCKAY, G., Film-pore diffusion model for the fixed-bed
sorption of copper and cadmium ions onto bone char, water res. 35 (2001) 3876–3886.
[35] Ma, Z., Whitley, R. D., Wang, N.-H. L., Pore and surface diffusion in multicomponent
adsorption and liquid chromatography systems, AICHE J 42 (1996) 1244-1262.
[36] Bautista, L. F., Mart´ınez, M., Aracil, J., Adsorption of -Amylase in a fixed bed: operating
efficiency and kinetic modeling, AICHE J 49 (2003) 2631-2641.
[37] Yang, J., Peng, J., Jia, J., Fang, H., Adsorption of carbon disulfide (CS2) in water by
different types of activated carbon—equilibrium, dynamics, and mathematical modeling, J
Environ. Eng-ASCE (2007) 294-302.
[38] Hand, D., Crittenden, J., Thacker, W., Simplified models for design of fixed-bed adsorption
systems, J Environ. Eng-ASCE 110 (1984) 440-456.
[39] Hung, H.-W., Lin, T.-F., Baus, C., Sacher, F., Brauch, H.-J., Competitive and hindering
effects of natural organic matter on the adsorption of MTBE onto activated carbons and zeolites,
Environ. Technol. 26 (2005) 1371-1382.
121
[40] Matsui, Y., Fukuda, Y., Inoue, T., Matsushita, T., Effect of natural organic matter on
powdered activated carbon adsorption of trace contaminants: characteristics and mechanism of
competitive adsorption, Water Res. 37 (2003) 4413-4424.
[41] Ebie, K., Li, F., Azuma, Y., Yuasa, A., Hagishita, T., Pore distribution effect of activated
carbon in adsorbing organic micropollutants from natural water, Water Res. 35 (2001) 167-179.
[42] Koryabkina, N., Bergendahl, J. A., Thompson, R. W., Giaya, A., Adsorption of disinfection
byproducts on hydrophobic zeolites with regeneration by advanced oxidation, Microporous
Mesoporous Mater. 104 (2007) 77-82.
[43] Anderson, M. A., Removal of MTBE and other organic contaminants from water by
sorption to high silica zeolites, Environ. Sci. Technol. 34 (2000) 725-727.
[44] Erdem-Senatalar, A., Bergendahl, J. A., Giaya, A., Thompson, R. W., Adsorption of methyl
tertiary butyl ether on hydrophobic molecular sieves, Environ. Eng. Sci. 21 (2004) 722-729.
[45] Knappe, D. R. U., Rossner, A., Effectiveness of high-silica zeolites for the adsorption of
methyl tertiary-butyl ether from natural water, Water Science & Technology: Water supply 5
(2005) 83-91.
[46] Hung, H.-W., Lin, T.-F., Adsorption of MTBE from contaminated water by carbonaceous
resins and mordenite zeolite, J. Hazard. Mater. B 135 (2006) 210-217.
[47] Li, S., Tuan, V. A., Noble, R. D., Falconer, J. L., MTBE adsorption on all-silica zeolite,
Environ. Sci. Technol. 37 (2003) 4007-4010.
[48] Weber Jr., W. J., Physicochemical Processes, Wiley-Interscience, New York, 1972.
[49] IZA, International Zeolite Association, Delaware, January-12-2010, www.iza-online.org.
[50] Knappe, D. R. U., Rossner, A., Snyder, S. A., Strickland, C., Alternative adsorbents for the
removal of polar organic contaminants, American water works association (AWWA) research
foundation, Denver, 2007.
[51] Giaya, A., Thompson, R. W., Denkewicz Jr., R., Liquid and vapor phase adsorption of
chlorinated volatile organic compounds on hydrophobic molecular sieves, Microporous
Mesoporous Mater. 40 (2000) 205-218.
[52] Giaya, A., Thompson, R. W., Observations on an equation of state for water confined in
narrow slit-pores, J. Chem. Phys. 116 (2002a) 2565-2571.
122
[53] Giaya, A., Thompson, R. W., Water confined in cylindrical micropores, J. Chem. Phys. 117
(2002c) 3463-3475.
[54] Fleys, M., Thompson, R. W., MacDonald, J. C., Comparison of the behavior of water in
silicalite and dealuminated zeolite Y at different temperatures by molecular dynamic simulations,
J. Phys. Chem. B 108 (2004) 12197-12203.
[55] Zar, J. H., Biostatistical Analysis, Prentice-Hall, Inc., Upper Saddle River, 1999.
[56] Weber Jr., W. J., ASCE, A. M., Morris, J. C., Equilibria and capacities for adsorption on
carbon, Journal of the Sanitary Engineering Division 90 (1964) 79-107.
[57] Giaya, A. CVOCs adsorption on hydrophobic porous materials and thermodynamics of
confined water. Worcester Polytechnic Institute, Worcester, 2001.
[58] Gonzalez-Olmos, R., Roland, U., Toufar, H., Kopinke, F.-D., Georgi, A., Fe-zeolites as
catalysts for chemical oxidation of MTBE in water with H2O2, Appl. Catal. B 89 (2009) 356-
364.
[59] Bohart, C. S., Adams, E. Q., Some aspects of the behavior of charcoal with respect to
chlorine, J. Am. Chem. Soc. 42 (1920) 523-544.
[60] Hutchins, R. A., Designing activated carbon systems, Chem. Eng. 80 (1973) 133-138.
[61] Adak, A., Pal, A., Removal of phenol from aquatic environment by SDS-modified alumina:
Batch and fixed bed studies, Sep. Purif. Technol. 50 (2006) 256-262.
[62] Ko, D. C. K., Porter, J. F., McKay, G., Optimized correlations for the fixed-bed adsorption
of metal ions on bone char, Chem. Eng. Sci. 55 (2000) 5819-5829.
[63] Lee, V. K. C., Porter, J. F., McKay, G., Development of Fixed-Bed Adsorber Correlation
Models, Ind. Eng. Chem. Res. 39 (2000) 2427-2433.
[64] El-Kamash, A. M., Evaluation of zeolite A for the sorptive removal of Cs+ and Sr2
+ ions
from aqueous solutions using batch and fixed bed column operations, J. Hazard. Mater. 151
(2007) 432-445.
[65] Cortes-Martinez, R., Solache-Rios, M., Martinez-Miranda, V., Alfaro-Cuevas, R., Removal
of cadmium by natural and surfactant-modified mexican zeolitic rocks in fixed bed columns,
Water, Air, Soil Pollut. 196 (2009) 199-210.
123
[66] Walker, G. M., Weatherley, L. R., Adsorption of acid dyes onto granular activated carbon in
fixed beds, Water Res. 31 (1997) 2093-2101.
[67] Yadla, S., Dikshit, A. K., Development of fixed bed adsorber for abatement of endosulfan in
aqueous media, Environ. Technol. 23 (2002) 97-108.
[68] Walker, G. M., Weatherley, L. R., COD removal from textile industry effluent: pilot plant
studies, Chem. Eng. J. 84 (2001) 125-131.
[69] Wellum, G., Zeolite BET analysis data from Washington University, 2007.
[70] Cohn, P. D., Cox, M., Berger, P., Health and Aesthetic Aspects of Water Quality, in Water
Quality and Treatment, McGraw Hill, New York, 1999.
[71] Krasner, S. W., Weinberg, H. S., Richardson, S. D., Pastor, S. J., Chinn, R., Sclimenti, M.
J., Onstad, G. D., Thruston Jr., A. D., Occurrence of A New Generation of Disinfection
Byproducts., Environ. Sci. Technol. 40 (2006) 7175.
[72] Aranda-Rodriguez, R., Koudjonou, B., Jay, B., LeBel, G. L., Benoit, F. M., Disinfection
By-Products (DBPs) in Drinking Water from Eight Systems using Chlorine Dioxide, Water
Qual. Res. J. Can. 43 (2008) 11.
[73] Gordon, G., Bubnis, B., Environmentally Friendly Methods of Water Disinfection: The
chemistry of Alternative Disinfectants, Progress in Nuclear Energy 37 (2000) 37.
[74] Clark, R. M., Adams, J. Q., Lykins, B. W., DBP Control in drinking Water: Cost and
Performance, J. Environ. Eng. 120 (1994) 759.
[75] Uyak, V., Toroz, I., Modeling the Formation of Chlorination By-products during Enhanced
Coagulation, Environmental Monitoring and Assessment 121 (2006) 503.
[76] Jacangelo, J. G., DeMarco, J., Owen, D. M., Randtke, S. J., Selected Processes for
Removing NOM: An Overview, Jour. AWWA 87 (1995) 64.
[77] Kim, J., Kang, B., DBPs Removal in GAC Filter-Adsorber, Water res. 42 (2008) 145.
[78] Summers, R. S., Benz, M. A., Shukairy, H. M., Cummings, L., Effect of Separation
Processes on the Formation of Brominated THMs, Jour. AWWA 85 (1993) 88.
[79] Hernandez, M. A., Gonzalez, A. I., Adsorption of Chlorinated Compounds (Chlorobenzene,
Chloroform, and Carbon Tetrachloride) on Microporous SiO2, Ag-Doped SiO2 and Natural and
Dealuminated Clinoptilolites, Ind. Eng. Chem. Res. 46 (2007) 3373.
124
[80] Morawski, A. W., Kalenczuk, R., Inagaki, M., Adsorption of Trihalomethanes (THMs) onto
Carbon Spheres, Desalination 130 (2000) 107.
[81] Pelech, R., Milchert, E., Bartkowiak, M., Fised-Bed Adsorption of Chlorinated
Hydrocarbons from Multicomponent Aqueous Solution onto Activated Carbon: Equilibrium
Column Model, J. Colloid Interface Sci. 296 (2006) 458.
[82] Nasseri, S., Samadi, M. T., Alizadeh Fard, M. R., Mesdaghinia, A. R., Comparison of
Nanofiltration and GAC Adsorption Processes for Chloroform Removal from Drinking Water,
Iranian J. Publ. Health 33 (2004) 47.
[83] Tsai, W.-T., Hsu, H.-C., Su, T.-Y., Lin, K.-Y., Lin, C.-M., Adsorption Characteristics of
Bisphenol-A in Aqueous Solutions onto Hydrophobic Zeolite, J. Colloid Interface Sci. 299
(2006) 513.
[84] Shemer, H., Narkis, N., Trihalomethanes Aqueous Solutions Sono-Oxidation, Water Res.
39 (2005) 2704.
[85] Ducom, G., Cabassud, C., Interests and Limitations of Nanofiltration for the Removal of
Volatile Organic Compounds in Drinking water Production, Desalination 124 (1999) 115.
[86] Rossner, A., Knappe, D. R. U., MTBE adsorption on alternative adsorbents and packed bed
adsorber performence, Water Res. 42 (2008) 2287.
[87] Koryabkina, N., Bergendahl, J. A., Thompson, R. W., Giaya, A., Adsorption of Disinfection
Byproducts on Hydrophobic Zeolites with Regeneration by Advanced Oxidation, Microporous
Mesoporous Mater. 104 (2007) 77.
[88] Hung, H.-W., Lin, T.-F., Adsorption of MTBE from contaminated water by carbonaceous
resins and mordenite zeolite, J. Hazard. Mater. B 135 (2006) 210.
[89] Knappe, D. R. U., Rossner, A., Effectiveness of high-silica zeolites for the adsorption of
methyl tertiary-butyl ether from natural water, Water Science & Technology: Water supply 5
(2005) 83.
[90] Erdem-Senatalar, A., Bergendahl, J. A., Giaya, A., Thompson, R. W., Adsorption of methyl
tertiary butyl ether on hydrophobic molecular sieves, Environ. Eng. Sci. 21 (2004) 722.
[91] Li, S., Tuan, V. A., Noble, R. D., Falconer, J. L., MTBE adsorption on all-silica zeolite,
Environ. Sci. Technol. 37 (2003) 4007.
[92] Anderson, M. A., Removal of MTBE and Other Organic Contaminants from Water by
Sorption to high silica Zeolites, Environ. Sci. Technol. 34 (2000) 725.
125
[93] Kawai, T., Tsutsumi, K., Adsorption Behavior of Organic Halides on Zeolites, Colloid
Polym. Sci. 287 (2009) 569.
[94] Giaya, A., Thompson, R. W., Denkewicz Jr., R., Liquid and vapor phase adsorption of
chlorinated volatile organic compounds on hydrophobic molecular sieves, Microporous
Mesoporous Mater. 40 (2000) 205.
[95] Kawai, T., Yanagihara, T., Tsutsumi, K., Adsorption Characteristics of Chloroform on
Modified Zeolites from Gaseous Phase as well as its Aqueous Solution, Colloid Polym. Sci. 272
(1994) 1620.
[96] Tsutsumi, K., Kawai, T., Yanagihara, T., Adsorption Characteristics of Hydrophobic
Zeolites, Studies in Surface Science and Catalysis 83 (1994) 217.
[97] Giaya, A., Thompson, R. W., Water confined in cylindrical micropores, J. Chem. Phys. 117
(2002) 3463.
[98] Fleys, M., Thompson, R. W., MacDonald, J. C., Comparison of the behavior of water in
silicalite and dealuminated zeolite Y at different temperatures by molecular dynamic simulations,
J. Phys. Chem. B 108 (2004) 12197.
[99] Abu-Lail, L., Bergendahl, J. A., Thompson, R. W., Adsorption of Methyl Tertiary Butyl
Ether on Granular Zeolites: Batch and Column Studies, J. Hazard. Mater. 178 (2010) 363.
[100] Weber Jr., W. J., ASCE, A. M., Morris, J. C., Equilibria and capacities for adsorption on
carbon, Journal of the Sanitary Engineering Division 90 (1964) 79.
[101] Hung, H.-W., Lin, T.-F., Baus, C., Sacher, F., Brauch, H.-J., Competitive and hindering
effects of natural organic matter on the adsorption of MTBE onto activated carbons and zeolites,
Environ. Technol. 26 (2005) 1371.
[102] Capar, G., Ulku, Y., Removal of THM Precursors by GAC: Ankara Case Study, Water res.
36 (2002) 1379.
[103] Bohart, C. S., Adams, E. Q., Some aspects of the behavior of charcoal with respect to
chlorine, J. Am. Chem. Soc. 42 (1920) 523.
[104] Hutchins, R. A., Designing activated carbon systems, Chemical Engineering 80 (1973)
133.
[105] Cortes-Martinez, R., Solache-Rios, M., Martinez-Miranda, V., Alfaro-Cuevas, R.,
Removal of cadmium by natural and surfactant-modified mexican zeolitic rocks in fixed bed
columns, Water, Air, Soil Pollut. 196 (2009) 199.
126
[106] El-Kamash, A. M., Evaluation of zeolite A for the sorptive removal of Cs+ and Sr2
+ ions
from aqueous solutions using batch and fixed bed column operations, J. Hazard. Mater. 151
(2007) 432.
[107] Adak, A., Pal, A., Removal of phenol from aquatic environment by SDS-modified
alumina: Batch and fixed bed studies, Sep. Purif. Technol. 50 (2006) 256.
[108] Ko, D. C. K., Porter, J. F., McKay, G., Optimized correlations for the fixed-bed
adsorption of metal ions on bone char, Chem. Eng. Sci. 55 (2000) 5819.
[109] Chen, P. H., Jenq, C. H., Chen, K. M., Evaluation of granular activated carbon for removal
of trace organic compounds in drinking water, Environmental Enternational 22 (1996) 343.
[110] Lee, V. K. C., Porter, J. F., McKay, G., Development of Fixed-Bed Adsorber Correlation
Models, Ind. Eng. Chem. Res. 39 (2000) 2427.
[111] Dwivedi, P. N., Upadhyay, S. N., Particle-fluid mass transfer in fixed and fluidized beds,
Ind. Eng. Chem. Proc. Des. Dev. 16 (1977) 157-165.
[112] Crittenden, J., Weber, J., W. J., Predictive model for the design of fixed-bed adsorbers:
Parameter estimation and model development, J Environ. Eng. Div. 104 (1978) 433-443.
[113] Furusawa, T., Smith, J. M., Fluid-particle and intraparticle mass transport rates in slurries,
Ind. Eng. Chem. Fund. 12 (1973) 197-203.
[114] Weber, T. W., Chakravorti, R. K., Pore and solid diffusion models for fixed-bed adsorbers,
AICHE J 20 (1974) 228-238.
[115] Weber Jr., W. J., Wang, C. K., A microscale system for estimation of model parameters for
fixed-bed adsorbers, Environ. Sci. Technol. 21 (1987) 1050-1096.
[116] Mckay, G., Otterburn, M., Aga, J., Pore diffusion and external mass-transfer transport
during dye adsorption onto fuller earth and silica, J Chem. Technol. Biot. 37 (1987) 247-256.
[117] Weber, J., W. J., Smith, E. H., Removing dissolved organic contaminants from water. 2.,
Environ. Sci. Technol. 20 (1986) 970-979.
[118] MathWorks, R2010b Documentation-Optimization Toolbox, Natick, November 4th, 2010,
www.mathworks.com.
[119] Crank, J., Mathematics of diffusion, Pergamon Press Ltd., Oxford, 1975.
127
[120] Brown, A. M., nonlinear regression analysis of data using a spreadsheet. Application note,
(2001) 58-60.
[121] Abu-Lail, L., Bergendahl, J. A., Thompson, R. W., Removal of Chloroform from Drinking
Water by Adsorption onto Granular Zeolites, (In Prep.)
[122] Onyango, M., Kojima, Y., Kuchar, D., Osembo, S., Matsuda, H., Diffusion kinetic
modeling of fluoride removal from aqueous solution by charge-reversed zeolite particles, J.
Chem. Eng. Jpn. 38 (2005) 701-710.
[123] Faust, S. D., Aly, O. M., Adsorption processes for water treatment, Butterworth Scientific
Ltd., Boston U.S.A., 1987.
[124] McKay, G., Allen, S. J., McConvey, I. F., Walters, H. R., External mass transfer and
homogeneous solid-phase diffusion effects during the adsorption of dyestuffs, Ind. Eng. Chem.
Process Des. Dev. 23 (1984) 221-226.
[125] Yoshida H., M., Y., T., K., Parallel transport of BSA by surface and pore diffusion in
strongly basic chitosan, AICHE J 40 (1994) 2034-2044.
[126] Y u, Z., Peldszus, S., H uck, P. M., Adsorption of selected pharmaceuticals and an
endocrine disrupting compound by granular activated carbon. 1. Adsorption capacity and
kinetics, Environ. Sci. Technol. 43 (2009) 1467–1473.
[127] Wolborska, A., External film control of the fixed bed adsorption, Chem. Eng. J. 73 (1999)
85-92.
[128] Frossling, N., Evaporation of Falling Drops, Geophysics 52 (1938)
[129] Wilson, E. J., Geankoplis, C. J., Liquid mass transfer at very low Reynolds numbers, Ind.
Eng. Chem. Fund. 5 (1966) 9-12.
[130] Williamson, J. E., Bazaire, K. E., Geankoplis, C. J., Liquid-phase mass transfer at low
Reynolds numbers, Ind. Eng. Chem. Fund. 2 (1963) 126-129.
[131] Gnielinski, V. T., Gleichung zue Berechnung des warme-and stoffaustauches in
durchstromten ruhenden kugelschuttungen bei mittleren und grossen peclet zahlen, VT
Verfahrenstechnik 12 (1978) 363-366.
[132] Tang, W.-T., Fan, L.-S., Axial liquid mixing in liquid-solid and gas-liquid-solid fluidized
beds containing low density particles, Chem. Eng. Sci. 45 (1990) 543-551.
128
[133] Chung, S. F., Wen, C. Y., Longitudinal dispersion of liquid flowing through fixed and
fluidized beds, AICHE J 14 (1968) 857-866.
[134] Fried, J. J., Groundwater pollution, Elsevier Sciences, Amsterdam, 1975.
[135] Wilke, C. R., Chang, P. C., Correlation of diffusion coefficients in dilute solutions, AICHE
J 1 (1955) 264-270.
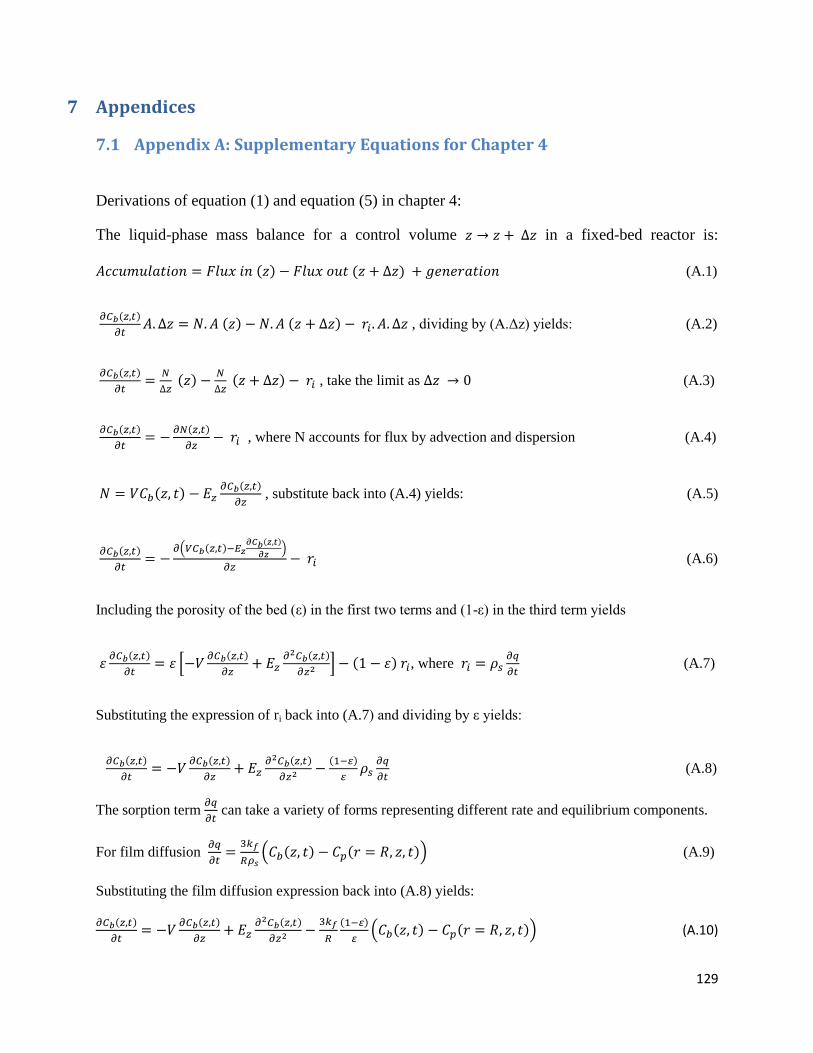
129
7 Appendices
7.1 Appendix A: Supplementary Equations for Chapter 4
Derivations of equation (1) and equation (5) in chapter 4:
The liquid-phase mass balance for a control volume in a fixed-bed reactor is:
(A.1)
, dividing by (A.Δz) yields: (A.2)
, take the limit as (A.3)
, where N accounts for flux by advection and dispersion (A.4)
, substitute back into (A.4) yields: (A.5)
(A.6)
Including the porosity of the bed (ε) in the first two terms and (1-ε) in the third term yields
, where
(A.7)
Substituting the expression of ri back into (A.7) and dividing by ε yields:
(A.8)
The sorption term
can take a variety of forms representing different rate and equilibrium components.
For film diffusion
(A.9)
Substituting the film diffusion expression back into (A.8) yields:
(A.10)
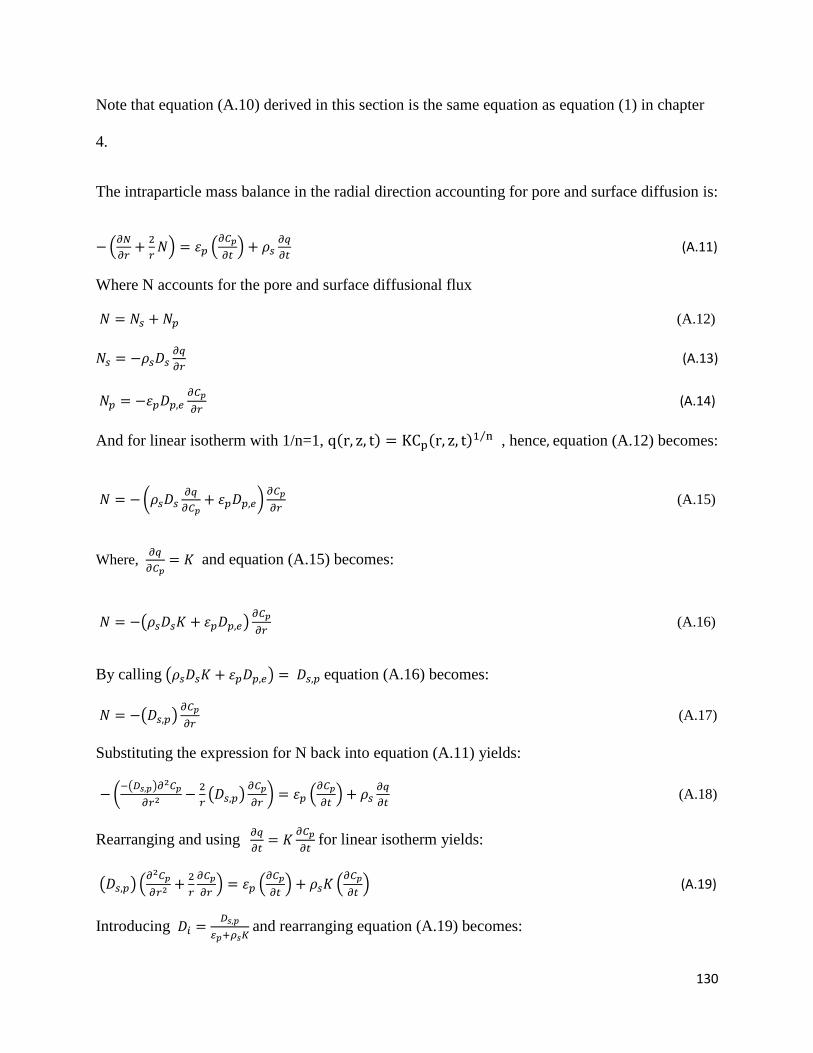
130
Note that equation (A.10) derived in this section is the same equation as equation (1) in chapter
4.
The intraparticle mass balance in the radial direction accounting for pore and surface diffusion is:
(A.11)
Where N accounts for the pore and surface diffusional flux
(A.12)
(A.13)
(A.14)
And for linear isotherm with 1/n=1, , hence, equation (A.12) becomes:
(A.15)
Where,
and equation (A.15) becomes:
(A.16)
By calling equation (A.16) becomes:
(A.17)
Substituting the expression for N back into equation (A.11) yields:
(A.18)
Rearranging and using
for linear isotherm yields:
(A.19)
Introducing
and rearranging equation (A.19) becomes:
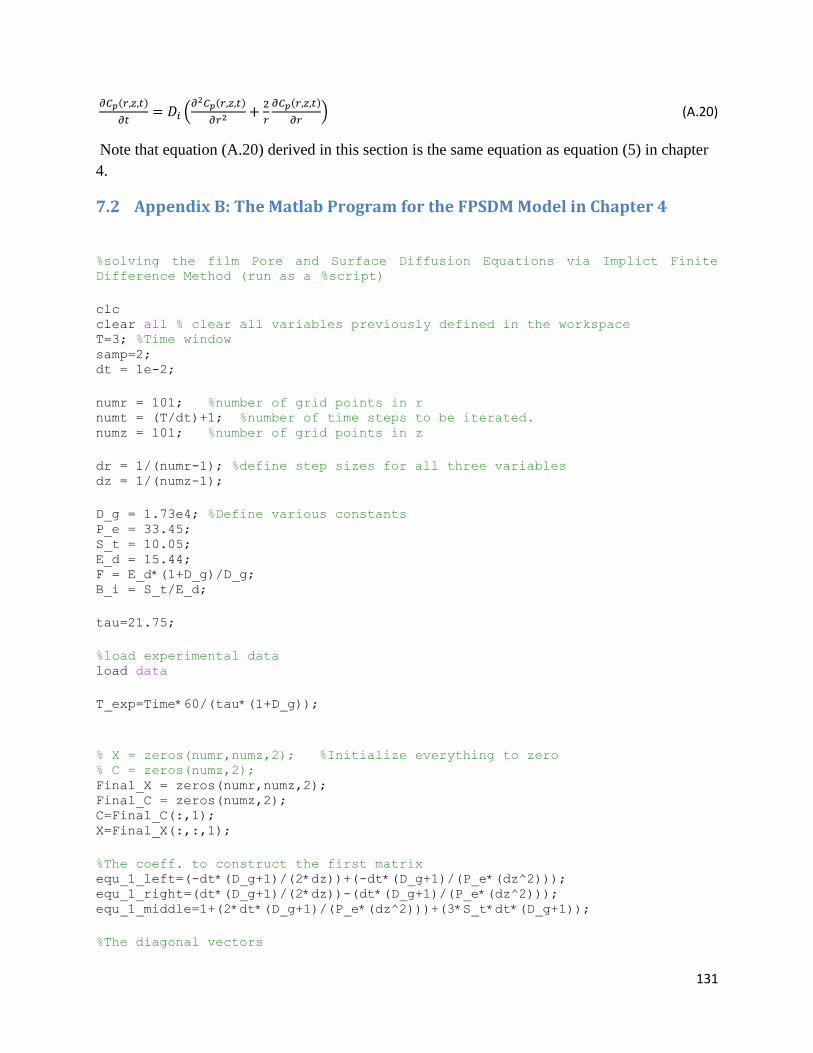
131
(A.20)
Note that equation (A.20) derived in this section is the same equation as equation (5) in chapter
4.
7.2 Appendix B: The Matlab Program for the FPSDM Model in Chapter 4
%solving the film Pore and Surface Diffusion Equations via Implict Finite
Difference Method (run as a %script)
clc clear all % clear all variables previously defined in the workspace T=3; %Time window samp=2; dt = 1e-2;
numr = 101; %number of grid points in r numt = (T/dt)+1; %number of time steps to be iterated. numz = 101; %number of grid points in z
dr = 1/(numr-1); %define step sizes for all three variables dz = 1/(numz-1);
D_g = 1.73e4; %Define various constants P_e = 33.45; S_t = 10.05; E_d = 15.44; F = E_d*(1+D_g)/D_g; B_i = S_t/E_d;
tau=21.75;
%load experimental data load data
T_exp=Time*60/(tau*(1+D_g));
% X = zeros(numr,numz,2); %Initialize everything to zero % C = zeros(numz,2); Final_X = zeros(numr,numz,2); Final_C = zeros(numz,2); C=Final_C(:,1); X=Final_X(:,:,1);
%The coeff. to construct the first matrix equ_1_left=(-dt*(D_g+1)/(2*dz))+(-dt*(D_g+1)/(P_e*(dz^2))); equ_1_right=(dt*(D_g+1)/(2*dz))-(dt*(D_g+1)/(P_e*(dz^2))); equ_1_middle=1+(2*dt*(D_g+1)/(P_e*(dz^2)))+(3*S_t*dt*(D_g+1));
%The diagonal vectors
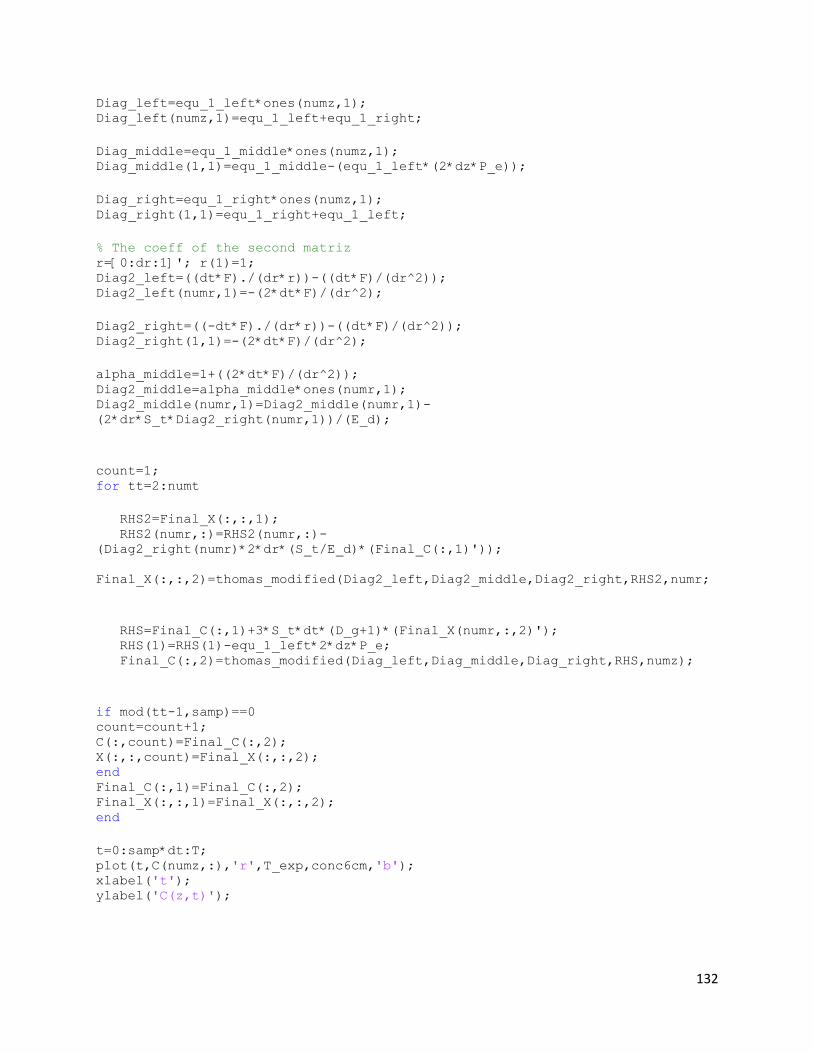
132
Diag_left=equ_1_left*ones(numz,1); Diag_left(numz,1)=equ_1_left+equ_1_right;
Diag_middle=equ_1_middle*ones(numz,1); Diag_middle(1,1)=equ_1_middle-(equ_1_left*(2*dz*P_e));
Diag_right=equ_1_right*ones(numz,1); Diag_right(1,1)=equ_1_right+equ_1_left;
% The coeff of the second matriz r=[0:dr:1]'; r(1)=1; Diag2_left=((dt*F)./(dr*r))-((dt*F)/(dr^2)); Diag2_left(numr,1)=-(2*dt*F)/(dr^2);
Diag2_right=((-dt*F)./(dr*r))-((dt*F)/(dr^2)); Diag2_right(1,1)=-(2*dt*F)/(dr^2);
alpha_middle=1+((2*dt*F)/(dr^2)); Diag2_middle=alpha_middle*ones(numr,1); Diag2_middle(numr,1)=Diag2_middle(numr,1)-
(2*dr*S_t*Diag2_right(numr,1))/(E_d);
count=1; for tt=2:numt
RHS2=Final_X(:,:,1); RHS2(numr,:)=RHS2(numr,:)-
(Diag2_right(numr)*2*dr*(S_t/E_d)*(Final_C(:,1)'));
Final_X(:,:,2)=thomas_modified(Diag2_left,Diag2_middle,Diag2_right,RHS2,numr;
RHS=Final_C(:,1)+3*S_t*dt*(D_g+1)*(Final_X(numr,:,2)'); RHS(1)=RHS(1)-equ_1_left*2*dz*P_e; Final_C(:,2)=thomas_modified(Diag_left,Diag_middle,Diag_right,RHS,numz);
if mod(tt-1,samp)==0 count=count+1; C(:,count)=Final_C(:,2); X(:,:,count)=Final_X(:,:,2); end Final_C(:,1)=Final_C(:,2); Final_X(:,:,1)=Final_X(:,:,2); end
t=0:samp*dt:T; plot(t,C(numz,:),'r',T_exp,conc6cm,'b'); xlabel('t'); ylabel('C(z,t)');