Embed Size (px)
Citation preview

Seediscussions,stats,andauthorprofilesforthispublicationat:https://www.researchgate.net/publication/268042441
RemoteSensingTechniquestoAssessWaterQuality
ARTICLEinPHOTOGRAMMETRICENGINEERINGANDREMOTESENSING·JUNE2003
ImpactFactor:1.61·DOI:10.14358/PERS.69.6.695
CITATIONS
54
READS
4,021
3AUTHORS,INCLUDING:
PaulVZimba
TexasA&MUniversity-CorpusChristi
91PUBLICATIONS1,415CITATIONS
SEEPROFILE
Allin-textreferencesunderlinedinbluearelinkedtopublicationsonResearchGate,
lettingyouaccessandreadthemimmediately.
Availablefrom:PaulVZimba
Retrievedon:03February2016
Remote Sensing Techniques to Assess Water QualityJerry C. Ritchie, Paul V. Zimba, and James H. Everitt
AbstractRemote sensing techniques can be used to monitor waterquality parameters (i.e., suspended sediments (turbidity),chlorophyll, and temperature). Optical and thermal sensorson boats, aircraft, and satellites provide both spatial andtemporal information needed to monitor changes in waterquality parameters for developing management practices toimprove water quality. Recent and planned launches ofsatellites with improved spectral and spatial resolution sen-sors should lead to greater use of remote sensing tech-niques to assess and monitor water quality parameters. In-tegration of remotely sensed data, GPS, and GIS technologiesprovides a valuable tool for monitoring and assessing wa-terways. Remotely sensed data can be used to create a per-manent geographically located database to provide a base-line for future comparisons. The integrated use of remotelysensed data, GPS, and GIS will enable consultants and nat-ural resource managers to develop management plans for avariety of natural resource management applications.
IntroductionWater quality is a general descriptor of water properties interms of physical, chemical, thermal, and/or biological char-acteristics. It is difficult to define a single water qualitystandard to meet all uses and user needs. For example,physical, chemical, and biological parameters of water thatare suitable for human consumption are different from thoseparameters of water suitable for irrigating a crop. Waterquality is affected by materials delivered to a water bodyfrom either point or nonpoint sources. Point sources can betraced to a single source, such as a pipe or a ditch. Non-point sources are diffuse and associated with the landscapeand its response to water movement, land use and manage-ment, and/or other human and natural activities on the wa-tershed. Agriculture, industrial, and urban areas are anthro-pogenic sources of point and nonpoint substances. Pollutingsubstances that lead to deterioration of water quality affectsmost freshwater and estuarine ecosystems in the world(Dekker et al., 1995). In the United States, off-site down-stream deterioration of water quality has been estimated tocost billions of dollars per year (Pimentel et al., 1995).
Monitoring and assessing the quality of surface watersare critical for managing and improving its quality. In situmeasurements and collection of water samples for subse-quent laboratory analyses are currently used to evaluatewater quality. While such measurements are accurate for a
point in time and space, they do not give either the spatialor temporal view of water quality needed for accurate as-sessment or management of water bodies. The purpose ofthis paper is to review the use of remote sensing tech-niques for monitoring and assessing water quality.
Basis for Using Remote SensingSubstances in surface water can significantly change thebackscattering characteristics of surface water (Jerlov, 1976;Kirk, 1983). Remote sensing techniques depend on the abil-ity to measure these changes in the spectral signaturebackscattered from water and relate these measured changesby empirical or analytical models to a water quality parame-ter. The optimal wavelength used to measure a water qual-ity parameter is dependent on the substance being mea-sured, its concentration, and the sensor characteristics.
Major factors affecting water quality in water bodiesacross the landscape are suspended sediments (turbidity),algae (i.e., chlorophylls, carotenoids), chemicals (i.e., nu-trients, pesticides, metals), dissolved organic matter (DOM),thermal releases, aquatic vascular plants, pathogens, andoils. Suspended sediments, algae, DOM, oils, aquatic vascu-lar plants, and thermal releases change the energy spectraof reflected solar and/or emitting thermal radiation fromsurface waters which can be measured using remote sens-ing techniques. Most chemicals and pathogens do not di-rectly affect or change the spectral or thermal properties ofsurface waters, so they can only be inferred indirectly frommeasurements of other water quality parameters affectedby these chemicals. Remote sensing tools provide spatialand temporal views of surface water quality parametersthat are not readily available from in situ measurements,thus making it possible to monitor the landscape effec-tively and efficiently, identifying and quantifying waterquality parameters and problems.
Development of remote sensing techniques for moni-toring water quality began in the early 1970s. These earlytechniques measured spectral and thermal differences inemitted energy from water surfaces. Generally, empiricalrelationships between spectral properties and water qualityparameters were established. Ritchie et al. (1974) devel-oped an empirical approach to estimate suspended sedi-ments. The general forms of these empirical equations are
Y � A � BX or Y � ABX (1)
where Y is the remote sensing measurement (i.e., radiance,reflectance, energy) and X is the water quality parameter ofinterest (i.e., suspended sediment, chlorophyll). A and Bare empirically derived factors. In empirical approaches
P H O T O G R A M M E T R I C E N G I N E E R I N G & R E M O T E S E N S I N G
Photogrammetric Engineering & Remote SensingVol. 69, No. 6, June 2003, pp. 695–704.
0099-1112/03/6906–695$3.00/0© 2003 American Society for Photogrammetry
and Remote Sensing
J.C. Ritchie is with the USDA, Agricultural Research Ser-vice, Hydrology and Remote Sensing Laboratory, Beltsville,MD 20705 ([email protected]).
P.V. Zimba is with the USDA, Agricultural Research Ser-vice, Catfish Genetics Research, Experiment Station Rd,Stoneville, MS 38776-0038.
J.H. Everitt is with the USDA, Agricultural Research Ser-vice, Integrated Farming & Natural Resources ResearchUnit, 2413 E Hwy 83, Weslaco, TX 78596.
IPC_Grams_03-907 4/12/03 5:57 AM Page 1
J u n e 2 0 0 3 695
statistical relationships are determined between measuredspectral/thermal properties and measured water qualityparameters. Often information about the spectral/opticalcharacteristic of the water quality parameter is used to aidin the selection of best wavelength(s) or best model in thisempirical approach. The empirical characteristics of theserelationships limit their applications to the condition forwhich the data were collected. Such empirical modelsshould only be used to estimate water quality parametersfor water bodies with similar conditions.
Schiebe et al. (1992) used an analytical approachbased on the optical properties of water and water qualityparameters to develop a physically based model of the re-lationship between the spectral and physical characteris-tics of the surface water studied. This physically based re-flectance model with statistically determined coefficients(Bi and Si) was successfully applied to estimating sus-pended sediment concentrations (Schiebe et al., 1992; Har-rington et al., 1992). Their model has the form
Ri � Bi[1 � e(c/Si)] (2)
where Ri is the reflectance (i.e., Landsat, SPOT digital data)in wave band i, c is suspended sediment concentration,Bi represents the reflectance saturation level at high sus-pended sediment concentrations in wave band i, and Si isthe concentration parameter equal to the concentration.when reflectance is 63 percent of saturation in wave band i.
This paper will be limited to the use of remote sensingtechnology to monitor suspended sediments, algae, aquaticvascular plants, and temperature. These are the key pollu-tants listed by the Environmental Protection Agency whichestimated that approximately 40 percent of U.S. waters donot meet minimum water quality standards (USEPA, 1998).A discussion of in situ sensors for remote monitoring isalso included because these are essential for measuringwater quality parameters that cannot be measured with re-mote sensing techniques and for data to calibrate remotesensing models for determining water quality.
Suspended SedimentSuspended sediments are the most common pollutant bothin weight and volume in surface waters of freshwater sys-
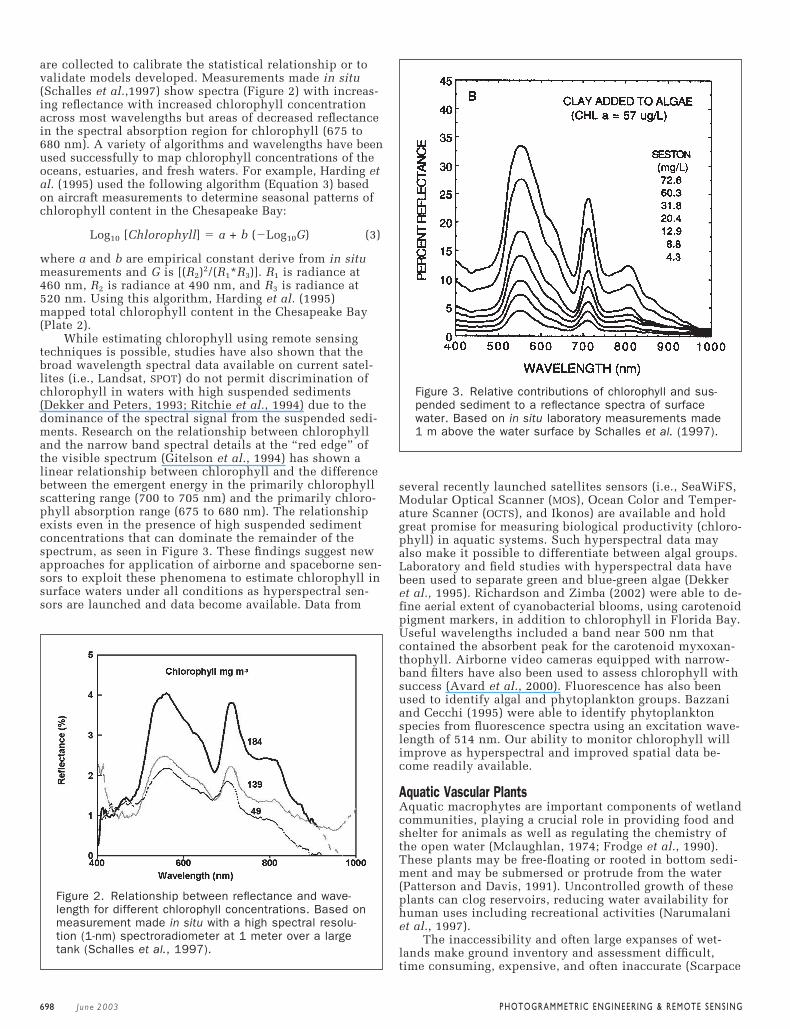
tems (Robinson, 1971; Lal, 1994). Suspended sediments in-crease the radiance emergent from surface waters (Figure 1)in the visible and near-infrared proportion of the electro-magnetic spectrum (Ritchie et al., 1976). In situ, controlledlaboratory, aircraft, and satellite measurements have shownthat surface water radiance is affected by sediment type,texture, and color (Novo et al., 1989), sensor view, sun an-gles (Ritchie et al., 1975), and water depth (Blanchard andLeamer, 1972). Spectral sensors on boat, aircraft, and satel-lite platforms have all been used to study suspended sedi-ment patterns.
Significant relationships between suspended sedimentsand radiance or reflectance from spectral wave bands orcombinations of wave bands on satellite and aircraft sensorshave been shown. Ritchie et al. (1976), using in situ studies,concluded that wavelengths between 700 and 800 nm weremost useful for determining suspended sediments in surface
P H O T O G R A M M E T R I C E N G I N E E R I N G & R E M O T E S E N S I N G
Figure 1. The relationship between reflectance and wave-length as affected by the concentration of suspendedsediments (Ritchie et al., 1976).
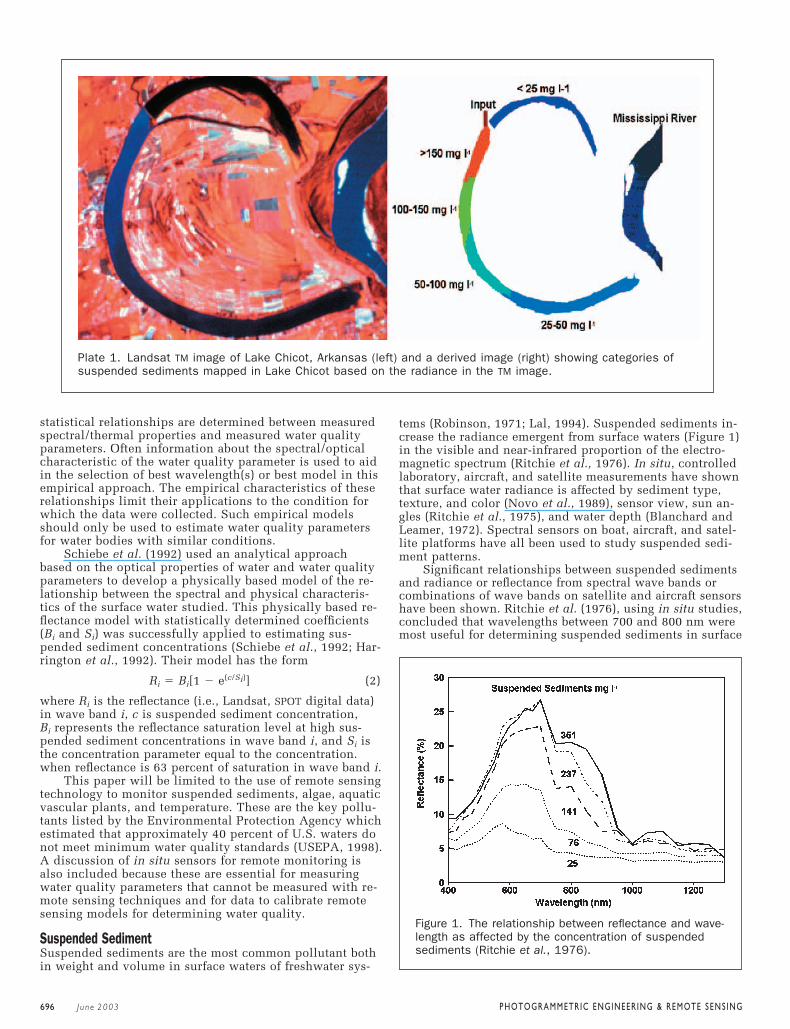
Plate 1. Landsat TM image of Lake Chicot, Arkansas (left) and a derived image (right) showing categories ofsuspended sediments mapped in Lake Chicot based on the radiance in the TM image.
IPC_Grams_03-907 4/12/03 5:57 AM Page 2
696 J u n e 2 0 0 3

waters. Curran and Novo (1988), in a review of remote sens-ing of suspended sediments, found that the optimum wave-length was related to suspended sediment concentration.Many studies have developed empirical relationships (algo-rithms) between the concentration of suspended sedimentsand radiance or reflectance for a specific date and site. Fewstudies have taken the next step and used these algorithmsto estimate suspended sediments for another time or place.Ritchie and Cooper (1988; 1991) showed that an algorithmdeveloped for one year was applicable for several years.Once developed, an algorithm should be applicable untilsome watershed event changes the quality (size, color, min-eralogy, etc.) of suspended sediments delivered to the lake.
A curvilinear relationship between suspended sedi-ments and radiance or reflectance (Ritchie et al., 1976;Ritchie et al., 1990) has been found, because the amount ofreflected radiance tends to saturate as suspended sedimentconcentrations increase. If the range of suspended sedi-ments is between 0 and 50 mg l�1, reflectance from almostany wavelength will be linearly related to suspended sedi-ment concentrations. As the range of suspended sedimentsincreases from 50 mg l�1 to 150 mg l�1 or higher, curvilin-ear relationships are necessary. Schiebe et al. (1992) devel-oped a physically based reflectance model (Equation 2)and used it to estimate suspended sediment concentrationsin Lake Chicot, Arkansas. Most researchers have concludedthat surface suspended sediments can be mapped andmonitored in large water bodies using sensors available oncurrent satellites. Plate 1 shows an example of mappingsuspended sediment in Lake Chicot using Landsat The-matic Mapper Data. The mapping was done in categoriesrelated to a management plan proposed for the lake.
While most researchers and managers agree that sus-pended sediments can be mapped with remotely sensed
data, the technique with the current spatial resolution ofsatellite data (Ritchie and Schiebe, 2000; Ritchie, 2000)does not allow the detail mapping of water bodies or mea-surements in or from streams needed for management deci-sions. As new satellites come on line with higher resolu-tion spatial and spectral data, greater application of satellitedata for monitoring and assessing suspended sedimentswill be possible.
Algae/ChlorophyllMonitoring the concentrations of chlorophyll (algal/phyto-plankton) is necessary for managing eutrophication inlakes (Carlson 1977). Remote sensing has been used to mea-sure chlorophyll concentrations spatially and temporally.As with suspended sediment measurements, most remotesensing studies of chlorophyll in water are based on empir-ical relationships between radiance/reflectance in narrowbands or band ratios and chlorophyll. Thus, field data
P H O T O G R A M M E T R I C E N G I N E E R I N G & R E M O T E S E N S I N G
Plate 2. Distribution of Chlorophyll (Chl) in the Chesa-peake Bay for 15 May 1990 determined from aircraftmultispectral data (Harding et al., 1995).
Plate 3. Color-infrared digital video image (A) of a por-tion of the Rio Grande River near Brownsville, Texas, in-fested with water hyacinth and hydrilla. Arrow 1 pointsto the conspicuous orange-red response of water hy-acinth, whereas arrow 2 points to the reddish-browntonal response of hydrilla. The image was obtained on03 September 1998. The GPS data are shown at thebottom of the image. Unsupervised computer classifica-tion of the Rio Grande and its adjacent perimeter isshown in B. Color codes for the various land-use typesare:red:hydrilla; green: water hyacinth; black: riparianvegetation; and blue:water.
IPC_Grams_03-907 4/12/03 5:57 AM Page 3
J u n e 2 0 0 3 697
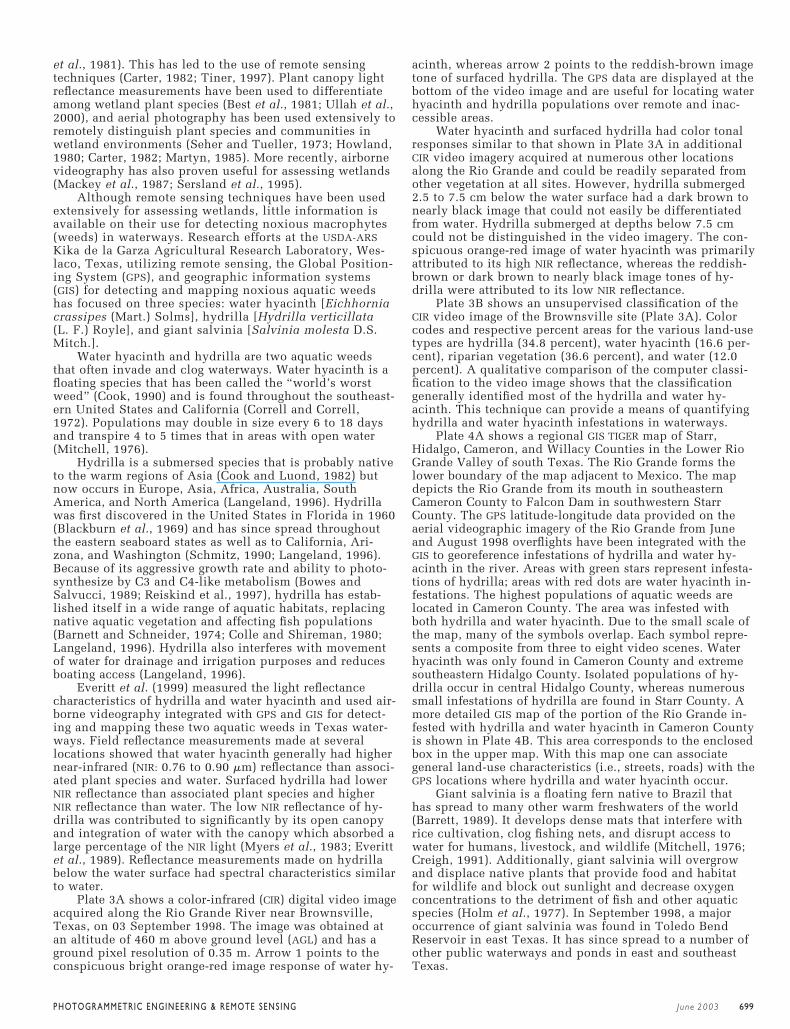
are collected to calibrate the statistical relationship or tovalidate models developed. Measurements made in situ(Schalles et al.,1997) show spectra (Figure 2) with increas-ing reflectance with increased chlorophyll concentrationacross most wavelengths but areas of decreased reflectancein the spectral absorption region for chlorophyll (675 to680 nm). A variety of algorithms and wavelengths have beenused successfully to map chlorophyll concentrations of theoceans, estuaries, and fresh waters. For example, Harding etal. (1995) used the following algorithm (Equation 3) basedon aircraft measurements to determine seasonal patterns ofchlorophyll content in the Chesapeake Bay:
Log10 [Chlorophyll] � a + b (�Log10G) (3)
where a and b are empirical constant derive from in situmeasurements and G is [(R2)2/(R1*R3)]. R1 is radiance at460 nm, R2 is radiance at 490 nm, and R3 is radiance at520 nm. Using this algorithm, Harding et al. (1995)mapped total chlorophyll content in the Chesapeake Bay(Plate 2).
While estimating chlorophyll using remote sensingtechniques is possible, studies have also shown that thebroad wavelength spectral data available on current satel-lites (i.e., Landsat, SPOT) do not permit discrimination ofchlorophyll in waters with high suspended sediments(Dekker and Peters, 1993; Ritchie et al., 1994) due to thedominance of the spectral signal from the suspended sedi-ments. Research on the relationship between chlorophylland the narrow band spectral details at the “red edge” ofthe visible spectrum (Gitelson et al., 1994) has shown alinear relationship between chlorophyll and the differencebetween the emergent energy in the primarily chlorophyllscattering range (700 to 705 nm) and the primarily chloro-phyll absorption range (675 to 680 nm). The relationshipexists even in the presence of high suspended sedimentconcentrations that can dominate the remainder of thespectrum, as seen in Figure 3. These findings suggest newapproaches for application of airborne and spaceborne sen-sors to exploit these phenomena to estimate chlorophyll insurface waters under all conditions as hyperspectral sen-sors are launched and data become available. Data from
several recently launched satellites sensors (i.e., SeaWiFS,Modular Optical Scanner (MOS), Ocean Color and Temper-ature Scanner (OCTS), and Ikonos) are available and holdgreat promise for measuring biological productivity (chloro-phyll) in aquatic systems. Such hyperspectral data mayalso make it possible to differentiate between algal groups.Laboratory and field studies with hyperspectral data havebeen used to separate green and blue-green algae (Dekkeret al., 1995). Richardson and Zimba (2002) were able to de-fine aerial extent of cyanobacterial blooms, using carotenoidpigment markers, in addition to chlorophyll in Florida Bay.Useful wavelengths included a band near 500 nm thatcontained the absorbent peak for the carotenoid myxoxan-thophyll. Airborne video cameras equipped with narrow-band filters have also been used to assess chlorophyll withsuccess (Avard et al., 2000). Fluorescence has also beenused to identify algal and phytoplankton groups. Bazzaniand Cecchi (1995) were able to identify phytoplanktonspecies from fluorescence spectra using an excitation wave-length of 514 nm. Our ability to monitor chlorophyll willimprove as hyperspectral and improved spatial data be-come readily available.
Aquatic Vascular PlantsAquatic macrophytes are important components of wetlandcommunities, playing a crucial role in providing food andshelter for animals as well as regulating the chemistry ofthe open water (Mclaughlan, 1974; Frodge et al., 1990).These plants may be free-floating or rooted in bottom sedi-ment and may be submersed or protrude from the water(Patterson and Davis, 1991). Uncontrolled growth of theseplants can clog reservoirs, reducing water availability forhuman uses including recreational activities (Narumalaniet al., 1997).
The inaccessibility and often large expanses of wet-lands make ground inventory and assessment difficult,time consuming, expensive, and often inaccurate (Scarpace
P H O T O G R A M M E T R I C E N G I N E E R I N G & R E M O T E S E N S I N G
Figure 3. Relative contributions of chlorophyll and sus-pended sediment to a reflectance spectra of surfacewater. Based on in situ laboratory measurements made1 m above the water surface by Schalles et al. (1997).
Figure 2. Relationship between reflectance and wave-length for different chlorophyll concentrations. Based onmeasurement made in situ with a high spectral resolu-tion (1-nm) spectroradiometer at 1 meter over a largetank (Schalles et al., 1997).
IPC_Grams_03-907 4/12/03 5:57 AM Page 4
698 J u n e 2 0 0 3
et al., 1981). This has led to the use of remote sensingtechniques (Carter, 1982; Tiner, 1997). Plant canopy lightreflectance measurements have been used to differentiateamong wetland plant species (Best et al., 1981; Ullah et al.,2000), and aerial photography has been used extensively toremotely distinguish plant species and communities inwetland environments (Seher and Tueller, 1973; Howland,1980; Carter, 1982; Martyn, 1985). More recently, airbornevideography has also proven useful for assessing wetlands(Mackey et al., 1987; Sersland et al., 1995).
Although remote sensing techniques have been usedextensively for assessing wetlands, little information isavailable on their use for detecting noxious macrophytes(weeds) in waterways. Research efforts at the USDA-ARSKika de la Garza Agricultural Research Laboratory, Wes-laco, Texas, utilizing remote sensing, the Global Position-ing System (GPS), and geographic information systems(GIS) for detecting and mapping noxious aquatic weedshas focused on three species: water hyacinth [Eichhorniacrassipes (Mart.) Solms], hydrilla [Hydrilla verticillata(L. F.) Royle], and giant salvinia [Salvinia molesta D.S.Mitch.].
Water hyacinth and hydrilla are two aquatic weedsthat often invade and clog waterways. Water hyacinth is afloating species that has been called the “world’s worstweed” (Cook, 1990) and is found throughout the southeast-ern United States and California (Correll and Correll,1972). Populations may double in size every 6 to 18 daysand transpire 4 to 5 times that in areas with open water(Mitchell, 1976).
Hydrilla is a submersed species that is probably nativeto the warm regions of Asia (Cook and Luond, 1982) butnow occurs in Europe, Asia, Africa, Australia, SouthAmerica, and North America (Langeland, 1996). Hydrillawas first discovered in the United States in Florida in 1960(Blackburn et al., 1969) and has since spread throughoutthe eastern seaboard states as well as to California, Ari-zona, and Washington (Schmitz, 1990; Langeland, 1996).Because of its aggressive growth rate and ability to photo-synthesize by C3 and C4-like metabolism (Bowes andSalvucci, 1989; Reiskind et al., 1997), hydrilla has estab-lished itself in a wide range of aquatic habitats, replacingnative aquatic vegetation and affecting fish populations(Barnett and Schneider, 1974; Colle and Shireman, 1980;Langeland, 1996). Hydrilla also interferes with movementof water for drainage and irrigation purposes and reducesboating access (Langeland, 1996).
Everitt et al. (1999) measured the light reflectancecharacteristics of hydrilla and water hyacinth and used air-borne videography integrated with GPS and GIS for detect-ing and mapping these two aquatic weeds in Texas water-ways. Field reflectance measurements made at severallocations showed that water hyacinth generally had highernear-infrared (NIR: 0.76 to 0.90 mm) reflectance than associ-ated plant species and water. Surfaced hydrilla had lowerNIR reflectance than associated plant species and higherNIR reflectance than water. The low NIR reflectance of hy-drilla was contributed to significantly by its open canopyand integration of water with the canopy which absorbed alarge percentage of the NIR light (Myers et al., 1983; Everittet al., 1989). Reflectance measurements made on hydrillabelow the water surface had spectral characteristics similarto water.
Plate 3A shows a color-infrared (CIR) digital video imageacquired along the Rio Grande River near Brownsville,Texas, on 03 September 1998. The image was obtained atan altitude of 460 m above ground level (AGL) and has aground pixel resolution of 0.35 m. Arrow 1 points to theconspicuous bright orange-red image response of water hy-
acinth, whereas arrow 2 points to the reddish-brown imagetone of surfaced hydrilla. The GPS data are displayed at thebottom of the video image and are useful for locating waterhyacinth and hydrilla populations over remote and inac-cessible areas.
Water hyacinth and surfaced hydrilla had color tonalresponses similar to that shown in Plate 3A in additionalCIR video imagery acquired at numerous other locationsalong the Rio Grande and could be readily separated fromother vegetation at all sites. However, hydrilla submerged2.5 to 7.5 cm below the water surface had a dark brown tonearly black image that could not easily be differentiatedfrom water. Hydrilla submerged at depths below 7.5 cmcould not be distinguished in the video imagery. The con-spicuous orange-red image of water hyacinth was primarilyattributed to its high NIR reflectance, whereas the reddish-brown or dark brown to nearly black image tones of hy-drilla were attributed to its low NIR reflectance.
Plate 3B shows an unsupervised classification of theCIR video image of the Brownsville site (Plate 3A). Colorcodes and respective percent areas for the various land-usetypes are hydrilla (34.8 percent), water hyacinth (16.6 per-cent), riparian vegetation (36.6 percent), and water (12.0percent). A qualitative comparison of the computer classi-fication to the video image shows that the classificationgenerally identified most of the hydrilla and water hy-acinth. This technique can provide a means of quantifyinghydrilla and water hyacinth infestations in waterways.
Plate 4A shows a regional GIS TIGER map of Starr,Hidalgo, Cameron, and Willacy Counties in the Lower RioGrande Valley of south Texas. The Rio Grande forms thelower boundary of the map adjacent to Mexico. The mapdepicts the Rio Grande from its mouth in southeasternCameron County to Falcon Dam in southwestern StarrCounty. The GPS latitude-longitude data provided on theaerial videographic imagery of the Rio Grande from Juneand August 1998 overflights have been integrated with theGIS to georeference infestations of hydrilla and water hy-acinth in the river. Areas with green stars represent infesta-tions of hydrilla; areas with red dots are water hyacinth in-festations. The highest populations of aquatic weeds arelocated in Cameron County. The area was infested withboth hydrilla and water hyacinth. Due to the small scale ofthe map, many of the symbols overlap. Each symbol repre-sents a composite from three to eight video scenes. Waterhyacinth was only found in Cameron County and extremesoutheastern Hidalgo County. Isolated populations of hy-drilla occur in central Hidalgo County, whereas numeroussmall infestations of hydrilla are found in Starr County. Amore detailed GIS map of the portion of the Rio Grande in-fested with hydrilla and water hyacinth in Cameron Countyis shown in Plate 4B. This area corresponds to the enclosedbox in the upper map. With this map one can associategeneral land-use characteristics (i.e., streets, roads) with theGPS locations where hydrilla and water hyacinth occur.
Giant salvinia is a floating fern native to Brazil thathas spread to many other warm freshwaters of the world(Barrett, 1989). It develops dense mats that interfere withrice cultivation, clog fishing nets, and disrupt access towater for humans, livestock, and wildlife (Mitchell, 1976;Creigh, 1991). Additionally, giant salvinia will overgrowand displace native plants that provide food and habitatfor wildlife and block out sunlight and decrease oxygenconcentrations to the detriment of fish and other aquaticspecies (Holm et al., 1977). In September 1998, a majoroccurrence of giant salvinia was found in Toledo BendReservoir in east Texas. It has since spread to a number ofother public waterways and ponds in east and southeastTexas.
P H O T O G R A M M E T R I C E N G I N E E R I N G & R E M O T E S E N S I N G
IPC_Grams_03-907 4/12/03 5:57 AM Page 5
J u n e 2 0 0 3 699

Research efforts are underway to evaluate remote sens-ing techniques in distinguishing giant salvinia infestationsin Texas waterways (Everitt et al., 2001). Giant salvinia oc-curs in two growth classes. Plants with green foliage and
senesced plants with mixtures of green and brown foliage.Senesced giant salvinia occurs in areas where the plantshave become extremely dense and available nutrients areprobably limited. These two classes often occur together in
P H O T O G R A M M E T R I C E N G I N E E R I N G & R E M O T E S E N S I N G
Plate 4. Regional GIS TIGER map (A) of Starr, Hidalgo, Cameron, and Willacy counties in the Lower RioGrande Valley of south Texas. The Rio Grande River forms the lower boundary of the map with Mexico.Areas with green stars along the Rio Grande represent infestations of hydrilla, whereas red dots repre-sent water hyacinth infestations. A detailed map (B) of Cameron County depicting infestations ofhydrilla and water hyacinth along the Rio Grande.
IPC_Grams_03-907 4/12/03 5:57 AM Page 6
700 J u n e 2 0 0 3
giant salvinia populations. Initial light reflectance studiesshowed that green giant salvinia could be best distinguishedfrom associated plant species in the green (0.52 to 0.60 mm)wavelength, whereas senesced giant salvinia could be bestseparated at the NIR wavelength.
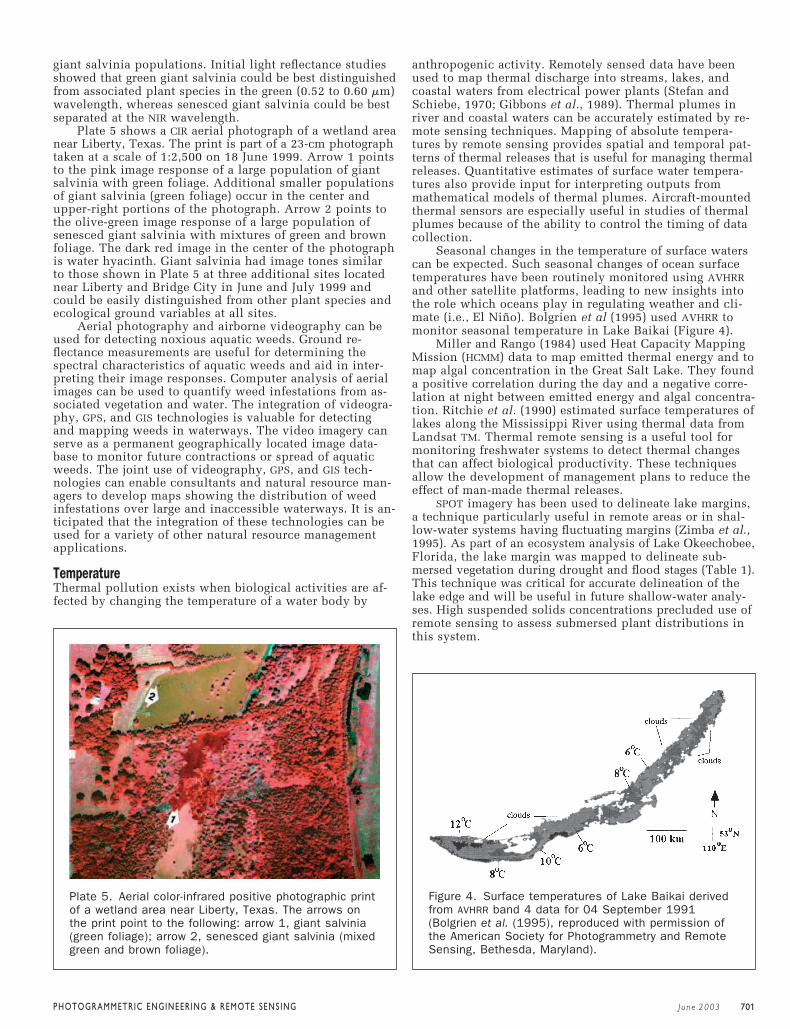
Plate 5 shows a CIR aerial photograph of a wetland areanear Liberty, Texas. The print is part of a 23-cm photographtaken at a scale of 1:2,500 on 18 June 1999. Arrow 1 pointsto the pink image response of a large population of giantsalvinia with green foliage. Additional smaller populationsof giant salvinia (green foliage) occur in the center andupper-right portions of the photograph. Arrow 2 points tothe olive-green image response of a large population ofsenesced giant salvinia with mixtures of green and brownfoliage. The dark red image in the center of the photographis water hyacinth. Giant salvinia had image tones similarto those shown in Plate 5 at three additional sites locatednear Liberty and Bridge City in June and July 1999 andcould be easily distinguished from other plant species andecological ground variables at all sites.
Aerial photography and airborne videography can beused for detecting noxious aquatic weeds. Ground re-flectance measurements are useful for determining thespectral characteristics of aquatic weeds and aid in inter-preting their image responses. Computer analysis of aerialimages can be used to quantify weed infestations from as-sociated vegetation and water. The integration of videogra-phy, GPS, and GIS technologies is valuable for detectingand mapping weeds in waterways. The video imagery canserve as a permanent geographically located image data-base to monitor future contractions or spread of aquaticweeds. The joint use of videography, GPS, and GIS tech-nologies can enable consultants and natural resource man-agers to develop maps showing the distribution of weedinfestations over large and inaccessible waterways. It is an-ticipated that the integration of these technologies can beused for a variety of other natural resource managementapplications.
TemperatureThermal pollution exists when biological activities are af-fected by changing the temperature of a water body by
anthropogenic activity. Remotely sensed data have beenused to map thermal discharge into streams, lakes, andcoastal waters from electrical power plants (Stefan andSchiebe, 1970; Gibbons et al., 1989). Thermal plumes inriver and coastal waters can be accurately estimated by re-mote sensing techniques. Mapping of absolute tempera-tures by remote sensing provides spatial and temporal pat-terns of thermal releases that is useful for managing thermalreleases. Quantitative estimates of surface water tempera-tures also provide input for interpreting outputs frommathematical models of thermal plumes. Aircraft-mountedthermal sensors are especially useful in studies of thermalplumes because of the ability to control the timing of datacollection.
Seasonal changes in the temperature of surface waterscan be expected. Such seasonal changes of ocean surfacetemperatures have been routinely monitored using AVHRRand other satellite platforms, leading to new insights intothe role which oceans play in regulating weather and cli-mate (i.e., El Niño). Bolgrien et al (1995) used AVHRR tomonitor seasonal temperature in Lake Baikai (Figure 4).
Miller and Rango (1984) used Heat Capacity MappingMission (HCMM) data to map emitted thermal energy and tomap algal concentration in the Great Salt Lake. They founda positive correlation during the day and a negative corre-lation at night between emitted energy and algal concentra-tion. Ritchie et al. (1990) estimated surface temperatures oflakes along the Mississippi River using thermal data fromLandsat TM. Thermal remote sensing is a useful tool formonitoring freshwater systems to detect thermal changesthat can affect biological productivity. These techniquesallow the development of management plans to reduce theeffect of man-made thermal releases.
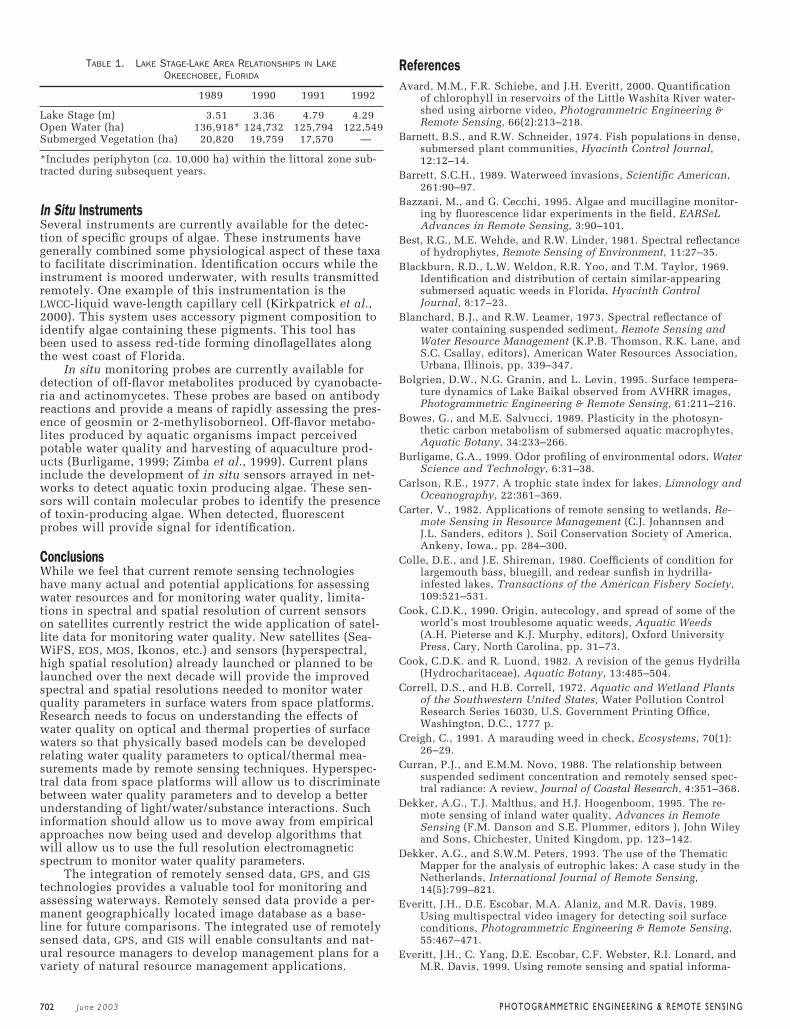
SPOT imagery has been used to delineate lake margins,a technique particularly useful in remote areas or in shal-low-water systems having fluctuating margins (Zimba et al.,1995). As part of an ecosystem analysis of Lake Okeechobee,Florida, the lake margin was mapped to delineate sub-mersed vegetation during drought and flood stages (Table 1).This technique was critical for accurate delineation of thelake edge and will be useful in future shallow-water analy-ses. High suspended solids concentrations precluded use ofremote sensing to assess submersed plant distributions inthis system.
P H O T O G R A M M E T R I C E N G I N E E R I N G & R E M O T E S E N S I N G
Plate 5. Aerial color-infrared positive photographic printof a wetland area near Liberty, Texas. The arrows onthe print point to the following: arrow 1, giant salvinia(green foliage); arrow 2, senesced giant salvinia (mixedgreen and brown foliage).
Figure 4. Surface temperatures of Lake Baikai derivedfrom AVHRR band 4 data for 04 September 1991(Bolgrien et al. (1995), reproduced with permission ofthe American Society for Photogrammetry and RemoteSensing, Bethesda, Maryland).
IPC_Grams_03-907 4/12/03 5:57 AM Page 7
J u n e 2 0 0 3 701
In Situ InstrumentsSeveral instruments are currently available for the detec-tion of specific groups of algae. These instruments havegenerally combined some physiological aspect of these taxato facilitate discrimination. Identification occurs while theinstrument is moored underwater, with results transmittedremotely. One example of this instrumentation is theLWCC-liquid wave-length capillary cell (Kirkpatrick et al.,2000). This system uses accessory pigment composition toidentify algae containing these pigments. This tool hasbeen used to assess red-tide forming dinoflagellates alongthe west coast of Florida.
In situ monitoring probes are currently available fordetection of off-flavor metabolites produced by cyanobacte-ria and actinomycetes. These probes are based on antibodyreactions and provide a means of rapidly assessing the pres-ence of geosmin or 2-methylisoborneol. Off-flavor metabo-lites produced by aquatic organisms impact perceivedpotable water quality and harvesting of aquaculture prod-ucts (Burligame, 1999; Zimba et al., 1999). Current plansinclude the development of in situ sensors arrayed in net-works to detect aquatic toxin producing algae. These sen-sors will contain molecular probes to identify the presenceof toxin-producing algae. When detected, fluorescentprobes will provide signal for identification.
ConclusionsWhile we feel that current remote sensing technologieshave many actual and potential applications for assessingwater resources and for monitoring water quality, limita-tions in spectral and spatial resolution of current sensorson satellites currently restrict the wide application of satel-lite data for monitoring water quality. New satellites (Sea-WiFS, EOS, MOS, Ikonos, etc.) and sensors (hyperspectral,high spatial resolution) already launched or planned to belaunched over the next decade will provide the improvedspectral and spatial resolutions needed to monitor waterquality parameters in surface waters from space platforms.Research needs to focus on understanding the effects ofwater quality on optical and thermal properties of surfacewaters so that physically based models can be developedrelating water quality parameters to optical/thermal mea-surements made by remote sensing techniques. Hyperspec-tral data from space platforms will allow us to discriminatebetween water quality parameters and to develop a betterunderstanding of light/water/substance interactions. Suchinformation should allow us to move away from empiricalapproaches now being used and develop algorithms thatwill allow us to use the full resolution electromagneticspectrum to monitor water quality parameters.
The integration of remotely sensed data, GPS, and GIStechnologies provides a valuable tool for monitoring andassessing waterways. Remotely sensed data provide a per-manent geographically located image database as a base-line for future comparisons. The integrated use of remotelysensed data, GPS, and GIS will enable consultants and nat-ural resource managers to develop management plans for avariety of natural resource management applications.
ReferencesAvard, M.M., F.R. Schiebe, and J.H. Everitt, 2000. Quantification
of chlorophyll in reservoirs of the Little Washita River water-shed using airborne video, Photogrammetric Engineering &Remote Sensing, 66(2):213–218.
Barnett, B.S., and R.W. Schneider, 1974. Fish populations in dense,submersed plant communities, Hyacinth Control Journal,12:12–14.
Barrett, S.C.H., 1989. Waterweed invasions, Scientific American,261:90–97.
Bazzani, M., and G. Cecchi, 1995. Algae and mucillagine monitor-ing by fluorescence lidar experiments in the field, EARSeLAdvances in Remote Sensing, 3:90–101.
Best, R.G., M.E. Wehde, and R.W. Linder, 1981. Spectral reflectanceof hydrophytes, Remote Sensing of Environment, 11:27–35.
Blackburn, R.D., L.W. Weldon, R.R. Yoo, and T.M. Taylor, 1969.Identification and distribution of certain similar-appearingsubmersed aquatic weeds in Florida, Hyacinth ControlJournal, 8:17–23.
Blanchard, B.J., and R.W. Leamer, 1973. Spectral reflectance ofwater containing suspended sediment, Remote Sensing andWater Resource Management (K.P.B. Thomson, R.K. Lane, andS.C. Csallay, editors), American Water Resources Association,Urbana, Illinois, pp. 339–347.
Bolgrien, D.W., N.G. Granin, and L. Levin, 1995. Surface tempera-ture dynamics of Lake Baikal observed from AVHRR images,Photogrammetric Engineering & Remote Sensing, 61:211–216.
Bowes, G., and M.E. Salvucci, 1989. Plasticity in the photosyn-thetic carbon metabolism of submersed aquatic macrophytes,Aquatic Botany, 34:233–266.
Burligame, G.A., 1999. Odor profiling of environmental odors, WaterScience and Technology, 6:31–38.
Carlson, R.E., 1977. A trophic state index for lakes, Limnology andOceanography, 22:361–369.
Carter, V., 1982. Applications of remote sensing to wetlands, Re-mote Sensing in Resource Management (C.J. Johannsen andJ.L. Sanders, editors ), Soil Conservation Society of America,Ankeny, Iowa., pp. 284–300.
Colle, D.E., and J.E. Shireman, 1980. Coefficients of condition forlargemouth bass, bluegill, and redear sunfish in hydrilla-infested lakes, Transactions of the American Fishery Society,109:521–531.
Cook, C.D.K., 1990. Origin, autecology, and spread of some of theworld’s most troublesome aquatic weeds, Aquatic Weeds(A.H. Pieterse and K.J. Murphy, editors), Oxford UniversityPress, Cary, North Carolina, pp. 31–73.
Cook, C.D.K. and R. Luond, 1982. A revision of the genus Hydrilla(Hydrocharitaceae), Aquatic Botany, 13:485–504.
Correll, D.S., and H.B. Correll, 1972. Aquatic and Wetland Plantsof the Southwestern United States, Water Pollution ControlResearch Series 16030, U.S. Government Printing Office,Washington, D.C., 1777 p.
Creigh, C., 1991. A marauding weed in check, Ecosystems, 70(1):26–29.
Curran, P.J., and E.M.M. Novo, 1988. The relationship betweensuspended sediment concentration and remotely sensed spec-tral radiance: A review, Journal of Coastal Research, 4:351–368.
Dekker, A.G., T.J. Malthus, and H.J. Hoogenboom, 1995. The re-mote sensing of inland water quality, Advances in RemoteSensing (F.M. Danson and S.E. Plummer, editors ), John Wileyand Sons, Chichester, United Kingdom, pp. 123–142.
Dekker, A.G., and S.W.M. Peters, 1993. The use of the ThematicMapper for the analysis of eutrophic lakes: A case study in theNetherlands, International Journal of Remote Sensing,14(5):799–821.
Everitt, J.H., D.E. Escobar, M.A. Alaniz, and M.R. Davis, 1989.Using multispectral video imagery for detecting soil surfaceconditions, Photogrammetric Engineering & Remote Sensing,55:467–471.
Everitt, J.H., C. Yang, D.E. Escobar, C.F. Webster, R.I. Lonard, andM.R. Davis, 1999. Using remote sensing and spatial informa-
P H O T O G R A M M E T R I C E N G I N E E R I N G & R E M O T E S E N S I N G
TABLE 1. LAKE STAGE-LAKE AREA RELATIONSHIPS IN LAKE
OKEECHOBEE, FLORIDA
1989 1990 1991 1992
Lake Stage (m) 3.51 3.36 4.79 4.29Open Water (ha) 136,918* 124,732 125,794 122,549Submerged Vegetation (ha) 20,820 19,759 17,570 —
*Includes periphyton (ca. 10,000 ha) within the littoral zone sub-tracted during subsequent years.
IPC_Grams_03-907 4/12/03 5:57 AM Page 8
702 J u n e 2 0 0 3
tion technologies to detect and map two aquatic macrophytes,Journal of Aquatic Plant Management, 37:71–80.
Everitt, J.H., C. Yang, D.E. Escobar, R.J. Helton, L.H. Hartmann,and M.R. Davis, 2001. Using spatial information technologiesfor detecting and mapping three aquatic weeds in Texas water-ways, Proceedings of the 8th Forest Service Remote SensingConference, 10–14 April 2000, Albuquerque, New Mexico(American Society for Photogrammetry and Remote Sensing,Bethesda, Maryland), on CD ROM.
Frodge, J.D., G.L. Thomas, and G.B. Pauley, 1990. Effects ofcanopy formation by floating and submergent aquatic macro-phytes on water quality of two shallow Pacific NorthwestLakes, Aquatic Botany, 38:231–248.
Gibbons, D.E., G.E. Wukelic, J.P. Leighton, and M.J. Doyle, 1989.Application of Landsat Thematic Mapper data for coastal ther-mal plume analysis at Diablo Canyon, Photogrammetric Engi-neering & Remote Sensing, 55:903–909.
Gitelson, A., M. Mayo, Y.Z. Yacobi, A. Paroarov, and T. Berman,1994. The use of high spectral resolution radiometer data fordetection of low chlorophyll concentrations in Lake Kinneret,Journal of Plankton Research, 16:993–1002.
Harding, L.W., E.C. Itsweire, and W.E. Esaias, 1995. Algorithm de-velopment for recovering chlorophyll concentrations in theChesapeake Bay using aircraft remote sensing, 1989–91, Pho-togrammetric Engineering & Remote Sensing, 61(2):177–185.
Harrington, J.A., Jr., F.R. Schiebe, and J.F. Nix, 1992. Remote sens-ing of Lake Chicot, Arkansas: Monitoring suspended sedi-ments, turbidity and secchi depth with Landsat MSS, RemoteSensing of Environment, 39(1):15–27.
Holm, L.G., D.L. Plucknett, J.V. Pancho, and J.P. Herberger, 1977.The World’s Worst Weeds, University of Hawaii Press, Hon-olulu, Hawaii, 609 p.
Howland, W.G., 1980. Multispectral aerial photography for wet-land vegetation mapping, Photogrammetric Engineering & Re-mote Sensing, 46:87–99.
Jerlov, N.G., 1976. Marine Optics, Elsevier, Amsterdam, TheNetherlands, 194 p.
Kirkpatrick, G.J., D.F. Millie, M.A. Moline, and O. Schofield, 2000.Optical discrimination of a phytoplankton species in naturalmixed populations, Limnology and Oceanography, 45(2):467–471.
Kirk, J.T.O., 1983. Light and Photosynthesis in Aquatic Ecosystems,Cambridge University Press, Cambridge, United Kingdom,509 p.
Lal, R., 1994. Soil Erosion, Soil and Water Conservation Society,Ankeny, Iowa, 340 p.
Langeland, K.A., 1996, Hydrilla verticillata (L. F.) Royle (Hydro-charitaceae), “The Perfect Aquatic Weed,” Castanea,61:293–304.
Mackey, H.E., Jr., J.R. Jensen, M.E. Hodgson, and K.W. O’Cuilinn,1987. Color-infrared video mapping of upland and wetlandcommunities, Proceedings of 11th Biennial Workshop onColor Aerial Photography and Videography in the Plant Sci-ences, 27 April–01 May, Weslaco, Texas (American Society forPhotogrammetry and Remote Sensing, Falls Church, Virginia),pp. 252–260.
Martyn, R.D., 1985. Color-infrared photography for determiningthe efficacy of grass carp in aquatic weed control, Proceedingsof the Southern Weed Science Society, 38:381–390.
Mclaughlan, A.J., 1974. Recovery of mud substrate and its associ-ated fauna following a dry phase in a tropical lake, Limnologyand Oceanography, 19:74–83.
Miller, W., and A. Rango, 1984. Using Heat Capacity MappingMission (HCMM) data to assess water quality, Water Re-sources Bulletin, 20:493–501.
Mitchell. D.S., 1976. The growth and management of Eichhorniacrassipes and Salvinia spp. in their native environment and inalien situations, Aquatic Weeds in Southeast Asia (C.K. Varsh-ncy and J. Rzoska, editors), Dr. W. Junk Publisher, The Hague,The Netherlands, pp. 167–175.
Myers, V.I., M.E. Bauer, H.W. Gausman, W.G. Hart, J.L. Heilman,R.B. McDonald, A.B. Park, R.A. Ryerson, T.J. Schmugge, andF.C. Westin, 1983. Remote sensing in agriculture, Manual of
Remote Sensing, Second Edition (R.N. Colwell, editor), Ameri-can Society of Photogrammetry, Falls Church, Virginia, 2:2111–2228.
Narumalani, S.J., R. Jensen, J.D. Althausen, S. Burkhalter, and H.E.Mackey, Jr., 1997. Aquatic macrophyte modelling using GISand logistic multiple regression, Photogrammetric Engineering& Remote Sensing, 63:41–49.
Novo, E.M.M., J.D. Hansom, and P.J. Curran, 1989. The effect ofsediment type on the relationship between reflectance andsuspended sediment concentration, International Journal ofRemote Sensing, 10(7):1283–1289.
Patterson, G.G., and B.A. Davis, 1991. Distribution of AquaticMacrophytes in 15 Lakes and Streams in South Carolina,Publication #89-4132, U.S. Geological Survey, Washington,D.C., 58 p.
Pimentel, D., C. Harvey, P. Resosudarmo, K. Sinclair, D. Kurz, M.McNair, S. Crist, L. Shpritz, L. Fitton, R. Saffouri, and R.Blair, 1995. Environmental and economic cost of soil erosionand conservation benefit, Science, 267:1117–1123.
Reiskind, J.B., T.B. Madsen, L.C. van Ginkel, and G. Bowes, 1997.Evidence that indicuble C4-type photosynthesis is a chloro-plastic CO2 concentrating mechanism in Hydrilla, a submersedmonocot, Plant, Cell, and Environment, 20:211–220.
Richardson, L.L., and P.V. Zimba, 2002. Spatial and temporal pat-terns of phytoplankton in Florida Bay: Utility of algal acces-sory pigments and remote sensing to assess bloom dynamics,Linkages between Ecosystems in the South Florida Hydroscape(J. Porters and K. Porter, editors), CRC Press, Boca Raton,Florida, pp. 461–478.
Ritchie, J.C., 2000. Soil Erosion, Remote Sensing in Hydrology andWater Management (G.A. Schultz and E.T. Engman, editors),Springer-Verlag, Berlin, Germany, pp. 271–286, 349–350.
Ritchie, J.C., J.R. McHenry, F.R. Schiebe and R.B. Wilson, 1974.The relationship of reflected solar radiation and the concen-tration of sediment in the surface water of reservoirs, RemoteSensing of Earth Resources Vol. III (F. Shahrokhi, editor), TheUniversity of Tennessee Space Institute, Tullahoma, Tennessee,pp. 57–72.
Ritchie, J.C., F.R. Schiebe, J.R. McHenry, R.B. Wilson, and J. May,1975. Sun angle, reflected solar radiation and suspended sed-iments in north Mississippi reservoirs, Remote Sensing ofEarth Resources Vol. IV (F. Shahrokhi, editor), University ofTennessee Space Institute, Tullahoma, Tennessee, pp. 555–564.
Ritchie, J.C., F.R. Schiebe, and J.R. McHenry, 1976. Remote sens-ing of suspended sediment in surface water, PhotogrammetricEngineering & Remote Sensing, 42:1539–1545.
Ritchie, J.C., and C.M. Cooper, 1988. Comparison on measuredsuspended sediment concentrations with suspended sedimentconcentrations estimated from Landsat MSS data, Interna-tional Journal of Remote Sensing, 9:379–387.
Ritchie, J.C., C.M. Cooper, and F.R. Schiebe, 1990. The relation-ship of MSS and TM digital data with suspended sediments,chlorophyll, and temperature in Moon lake, Mississippi, Re-mote Sensing of Environment, 33:137–148.
Ritchie, J.C., and C.M. Cooper, 1991. An algorithm for using Land-sat MSS for estimating surface suspended sediments, WaterResources Bulletin, 27:373–379.
Ritchie, J.C., F.R. Schiebe, C.M. Cooper, and J.A. Harrington, Jr.,1994. Chlorophyll measurements in the presence of sus-pended sediment using broad band spectral sensors aboardsatellites, Journal of Freshwater Ecology, 9(2):197–206.
Ritchie, J.C. and F.R. Schiebe, 2000. Water quality, Remote Sens-ing in Hydrology and Water Management (G.A. Schultz andE.T. Engman, editors), Springer-Verlag, Berlin, Germany, pp.287–303, 351–352.
Robinson, A.R., 1971. Sediment: Our greatest pollutant, Journal ofSoil and Water Conservation, 53(8):406–408.
Scarpace, F.L., B.K. Quirk, R.W. Kiefer, and S.L. Wynn, 1981.Wetland mapping from digitized aerial photography, Photo-grammetric Engineering & Remote Sensing, 47:829–838.
Schalles, J.F., F.R. Schiebe, P.J. Starks, and W.W. Troeger, 1997.Estimation of algal and suspended sediment loads (singly and
P H O T O G R A M M E T R I C E N G I N E E R I N G & R E M O T E S E N S I N G
IPC_Grams_03-907 4/12/03 5:57 AM Page 9
J u n e 2 0 0 3 703
combined) using hyperspectral sensors and integrated meso-cosm experiments, Fourth International Conference on Re-mote Sensing for Marine and Coastal Environments, 17–19March, Orlando, Florida (University of Michigan Press, AnnArbor, Michigan), pp. 111–120.
Schiebe, F.R., J.A. Harrington, Jr., and J.C. Ritchie, 1992. Remotesensing of suspended sediments: The Lake Chicot, Arkansasproject, International Journal of Remote Sensing, 13(8):1487–1509.
Schmitz, D.C., 1990. The invasion of exotic aquatic and wetlandplants into Florida: History and efforts to prevent new intro-ductions, Aquatics, 12(3):6–24.
Seher, J.S., and P.T. Tueller, 1973. Color aerial photos for marsh-land, Photogrammetric Engineering, 39:489–499.
Sersland, C.A., C.A. Johnston, and J. Bonde, 1995. Assessingwetland vegetation with GIS-linked color video image mo-saics, Proceedings of the 15th Biennial Workshop on Videog-raphy and Color Photography in Resource Assessment,01–03 May, Terre Haute, Indiana (American Society for Pho-togrammetry and Remote Sensing, Bethesda, Maryland), pp.53–62.
Stefan, H., and F.R. Schiebe, 1970. Heated discharges from flumesinto tanks, Journal of the Sanitary Engineering Division Amer-ican Society of Civil Engineers, 12:1415–1433.
Tiner, R.W., 1997. Wetlands, Manual of Photographic Interpretation(W.R. Philipson, editor), American Society for Photogrammetryand Remote Sensing, Bethesda, Maryland, pp. 475–494.
Ullah, A., D.C. Rundquist, and D.P. Derry, 2000. Characterizingspectral signatures for three selected emergent aquatic macro-phytes: A controlled experiment, Geocarto International,15(4):29–39.
USEPA, 1998. The Quality of Our Nation’s Waters: 1996, Execu-tive Summary, April 1998-EPA842-F-99-0003D, U.S. Environ-mental Protection Agency Office of Water.
Zimba, P.V., M.S. Hopson, J. Smith, J.V. Colle, and J.V. Shireman,1995. Chemical composition and distribution of submersedaquatic vegetation in Lake Okeechobee, FL (1989–1991),Archiv für Hydrobiologie, 45:241–246.
Zimba, P.V., C.P. Dionigi, and D.F. Millie, 1999. Evaluating the rela-tionship between photopigment synthesis and 2-methylisobor-neol accumulation in cyanobacteria, Journal of Phycology,35:1422–1429.
P H O T O G R A M M E T R I C E N G I N E E R I N G & R E M O T E S E N S I N G
IPC_Grams_03-907 4/12/03 5:57 AM Page 10
704 J u n e 2 0 0 3


![EE 529 Remote Sensing Techniques Remote Sensing... · [1] Introduction to the Physics and Techniques of Remote Sensing by C. Elachi and J. J. van Zyl (Chapters 1, 2 and 6). [2] Scattering,](https://img.dokumen.tips/doc/110x75/5f06dc947e708231d41a1a7e/ee-529-remote-sensing-remote-sensing-1-introduction-to-the-physics-and-techniques.jpg)