Embed Size (px)
Citation preview

HAL Id: hal-00808838https://hal.archives-ouvertes.fr/hal-00808838
Submitted on 20 Oct 2015
HAL is a multi-disciplinary open accessarchive for the deposit and dissemination of sci-entific research documents, whether they are pub-lished or not. The documents may come fromteaching and research institutions in France orabroad, or from public or private research centers.
L’archive ouverte pluridisciplinaire HAL, estdestinée au dépôt et à la diffusion de documentsscientifiques de niveau recherche, publiés ou non,émanant des établissements d’enseignement et derecherche français ou étrangers, des laboratoirespublics ou privés.
Remote sensing of volcanic ash plumes from thermalinfrared: a case study analysis from SEVIRI, MODIS
and IASI instrumentsPhilippe Dubuisson, Hervé Herbin, Fanny Minvielle, M. Compiègne, François
Thieuleux, Fédéric Parol, Jacques Pelon
To cite this version:Philippe Dubuisson, Hervé Herbin, Fanny Minvielle, M. Compiègne, François Thieuleux, et al.. Re-mote sensing of volcanic ash plumes from thermal infrared: a case study analysis from SEVIRI, MODISand IASI instruments. Atmospheric Measurement Techniques, European Geosciences Union, 2014, 7(2), pp.359-371. �10.5194/amt-7-359-2014�. �hal-00808838�

Atmos. Meas. Tech., 7, 359–371, 2014www.atmos-meas-tech.net/7/359/2014/doi:10.5194/amt-7-359-2014© Author(s) 2014. CC Attribution 3.0 License.
Atmospheric Measurement
TechniquesO
pen Access
Remote sensing of volcanic ash plumes from thermal infrared: acase study analysis from SEVIRI, MODIS and IASI instruments
P. Dubuisson1, H. Herbin1, F. Minvielle1, M. Compiègne1, F. Thieuleux1, F. Parol1, and J. Pelon2
1LOA, UMR8518, CNRS, Université Lille 1, Villeneuve d’Ascq, France2LATMOS, UMR8190, CNRS, Université Pierre et Marie Curie, Paris, France
Correspondence to:P. Dubuisson ([email protected])
Received: 14 February 2013 – Published in Atmos. Meas. Tech. Discuss.: 20 March 2013Revised: 11 December 2013 – Accepted: 20 December 2013 – Published: 3 February 2014
Abstract. The Eyjafjallajökull eruption, which occurred dur-ing May 2010, is used as a case study to evaluate the consis-tency of the detection and characterization of volcanic ashplumes from different thermal infrared instruments. In thisstudy, the well-known split window technique is used to re-trieve the optical thickness and the effective particle size,and to estimate the mass concentration of volcanic parti-cles from brightness temperatures measured in the infraredatmospheric window (8–12 µm). Retrievals are obtained forseveral mineral compositions whose optical properties arecomputed using Mie theory accounting for spectral varia-tions of the refractive index. The impacts of errors in at-mospheric parameters on the a posteriori uncertainties havebeen analysed. This analysis confirmed that major sourcesof errors are the layer altitude, the particle composition and,most of all, the size distribution for which uncertainties inretrievals can reach 50 % in mass loading estimates. This re-trieval algorithm is then applied to measurements acquirednear-simultaneously from MODIS, SEVIRI and IASI space-borne instruments, using two channels around 11 µm and12 µm. The retrievals are in close agreement when taking intoaccount the different spatial and spectral configurations, anddeviations between retrievals remain less than the uncertain-ties due to errors in atmospheric parameters. This analysisdemonstrates the robustness of the retrieval method and theconsistency of observations from these instruments for vol-canic ash plume monitoring.
1 Introduction
Volcanoes are important sources of aerosol particles and gasphase precursors of secondary air pollutants that can havesignificant effects on solar and infrared atmospheric radi-ation, with consequences for atmospheric radiative forcingand climate (Le Treut et al., 2007). In addition, large plumesof ash emitted into the atmosphere can have impacts on avia-tion security and air traffic (Prata and Tupper, 2009; Interna-tional Civil Aviation Organization (ICAO), 2001; Alexander,2013). In this context, satellite instruments provide efficienttools for spatio-temporal monitoring of ash plumes. To-gether, with in situ measurements and numerical simulations,this allows mitigation of aviation hazards. For instance, theexplosive eruption of the Eyjafjallajökull volcano in Icelandduring April–May 2010 has shown the importance of com-bining measurements and models to derive physical char-acteristics of volcanic aerosols and to study the plume spa-tial structure and dispersion (Zehner, 2010; Millington et al.,2012; Webley et al., 2012).
Many methodologies have been proposed for plume ob-servations and characterization from active remote sensingtechnology or using passive sensors from space (for a com-plete list, see for instance Thomas and Watson, 2010; Zehner,2010). From the latter, the analysis of spectral informationgives access to optical and physical properties of volcanicash plumes from which parameters relevant to flight safetycan be derived (e.g. the mass concentration of particles). Thesplit window technique has been used extensively to char-acterize atmospheric particles using channels in the infraredatmospheric window (8–13 µm) centred approximately at11 µm and 12 µm. It is based on the spectral variation of the
Published by Copernicus Publications on behalf of the European Geosciences Union.

360 P. Dubuisson et al.: Remote sensing of volcanic ash plumes from thermal infrared
extinction efficiency of ash particles in the infrared spectralrange. This method is currently employed for remote sens-ing of semitransparent clouds (Inoue, 1985, 1987; Parol etal., 1991; Dubuisson et al., 2008; Cooper and Garett, 2010),and is also used intensively for characterization of volcanicparticles (Prata, 1989a, b; Wen and Rose, 1994; Schneideret al., 1995). This approach has been applied to polar satel-lite sensors such as the Advanced Very High Resolution Ra-diometer (AVHRR) or the Along Track Scanning Radiome-ter (ATSR) (Prata, 1989a; Wen and Rose, 1994; Prata andGrant, 2001), the Moderate Resolution Imaging Spectrora-diometer (MODIS) (Hillger and Clark, 2002; Watson et al.,2004; Tupper at al., 2004; Corradini et al., 2011), as well asto sensors on-board geostationary platforms such as the Geo-stationary Operational Environmental Satellite (GOES) (Yuet al., 2002) or the Spin Enhanced Visible and Infrared Im-ager (SEVIRI) data (Prata and Kerkmann, 2007; Corradini etal., 2008; Francis et al., 2012; Prata and Prata, 2012). The ca-pabilities and limitations of the split window technique havebeen discussed in Wen and Rose (1994), Prata et al. (2001)and Pavolonis et al. (2006).
In this paper, an analysis of the results obtained by apply-ing the same retrieval algorithm to a volcanic plume is pre-sented using observations from MODIS, SEVIRI and IASIspace-borne instruments. We focus this study on the eruptionof the Eyjafjallajökull volcano on 6 May 2010 because it wasobserved near-simultaneously by these space infrared sen-sors. The retrieval method is based on the split window tech-nique and accurate radiative transfer calculations (Dubuissonet al., 2005, 2008). The goal of this study is not to present anew operational algorithm, but to study the consistency ofretrievals using the same algorithm from different infraredinstruments and to analyse the uncertainties and limitationsof these retrievals. As far as we know, there is no previoussimilar inter-comparison.
This paper is organized as follows: MODIS, SEVIRI andIASI instruments are briefly described in Sect. 2. The re-trieval algorithm is presented in Sect. 3. Retrievals of opti-cal thickness, particle effective radius, and mass loading es-timation of the plume from two infrared channels are pre-sented and analysed in Sect. 4, using SEVIRI observations.In Sect. 5, the retrieval algorithm is applied in the same wayfor the three considered infrared sensors to assess the consis-tency of measurements; spatial distributions as well as meanvalues of retrieved parameters are compared. The retrieval al-gorithm sensitivity to errors in atmospheric parameters, suchas the particle type, plume altitude or particle size distribu-tion, is also presented. Finally, the inter-comparison resultsare discussed in terms of the a posteriori retrieved parameteruncertainties.
2 Description of the instruments
Many space-borne broadband sensors (such as MODIS, SE-VIRI, IIR or AVHRR) with spectral channels in the infraredwindow are available to monitor volcanic plumes. These sen-sors are generally designed to collect aerosol properties ona global scale. More recently, hyperspectral sensors such asIASI (Schlüssel et al., 2005; Clerbaux et al., 2009) or GOSAT(Kuze et al., 2009), which are dedicated to gas species mea-surements, have been used to provide useful aerosol informa-tion (Clarisse et al., 2010a; Herbin et al., 2013). In our study,three instruments have been considered:
– SEVIRI on-board the geostationary Meteosat SecondGeneration (MSG) satellite (Schmetz et al., 2002).Among the available channels, three are centred in theinfrared window at 8.7, 10.8 and 12 µm. Data are col-lected every 15 min for the whole 70 degree disk, witha spatial resolution ranging from 3× 3 km2 at the sub-satellite to about 10× 10 km2 near the edges of thescan. Note that the area study considered in this pa-per is near the limit of coverage for SEVIRI. How-ever, Prata and Prata (2012) emphasise the advantageof viewing a volcanic plume from an acute angle us-ing SEVIRI data, in particular in the case of high lat-itudes. Indeed, even in the case of small ash concen-trations, retrievals are possible because of the longeroptical path in the ash cloud, leading to larger bright-ness temperature differences.
– MODIS (Moderate Resolution Imaging Spectrora-diometer) on-board the two polar orbiting satellitesAQUA and TERRA. This instrument acquires data in36 channels with three channels in the infrared window(8.6, 11 and 12 µm) at 1×1 km2 spatial resolution, witha viewing swath width of 2330 km and is designed toretrieve aerosol properties (Remer et al., 2005).
– IASI (Infrared Atmospheric Sounding Interferometer).IASI is a payload element of the polar-orbiting MetOpsatellites using a Fourier Transform Spectrometer op-erating in the 3.7–15.5 µm spectral range, with anapodized spectral resolution of 0.5 cm−1 and, conse-quently, includes the infrared window. This instrumentanalyses an atmospheric cell of about 50× 50 km2
and the effective field of view (EFOV) consists of a2× 2 matrix of so-called instantaneous fields of view(IFOV), with a circular IFOV of 3.33◦ which cor-responds to a ground resolution of 12 km at nadir(Clerbaux et al., 2009).
In this study, satellite data have been processed and madeavailable by the ICARE Data and Services Centre (MODISand SEVIRI) and by the Ether data centre (IASI). Compar-isons are also possible with the three-channel Imaging In-frared Radiometer (IIR) on-board CALIPSO (Garnier et al.,
Atmos. Meas. Tech., 7, 359–371, 2014 www.atmos-meas-tech.net/7/359/2014/
P. Dubuisson et al.: Remote sensing of volcanic ash plumes from thermal infrared 361
2012; Sourdeval et al., 2012). Indeed, IIR performs near-simultaneous measurements with MODIS/Aqua with thesame spatial resolution. However, because the IIR instrumenthas a very narrow measurement swath, spatio-temporal col-locations between IIR observations and volcanic plume arenot frequent. Consequently, only a very few pixels are avail-able for comparisons and the IIR instrument has not beenconsidered in this study.
3 Retrieval methodology
As mentioned in the introduction, the use of two channelsin the thermal infrared allows us to characterize volcanicplumes as well as discriminate cloud contamination andhas been applied extensively to satellite measurements. Fig-ure 1 shows the brightness temperature differences (BTD)observed for the Eyjafjallajökull eruption on 6 May 2010,using MODIS infrared channels at 11 µm and 12 µm, and il-lustrates the different spectral behaviour from cloud and vol-canic particles. A plume characterization is then available us-ing BTDs from the split window technique. A simple algo-rithm has then been developed to retrieve optical and physi-cal properties of volcanic plumes using BTDs from infraredsatellite measurements. This algorithm is based on accurateradiative transfer calculations using realistic spectral varia-tions of the refractive indices, for several volcanic particletypes. As specified previously, the aim of this study is not topresent a new operational retrieval algorithm, but to analysethe observations’ consistency from different infrared instru-ments (MODIS, SEVIRI and IASI) using the same retrievalalgorithm. The radiative transfer modelling and the retrievalmethods used are described briefly hereafter.
3.1 Radiative transfer modelling
Brightness temperatures (BT) are simulated using the FAS-DOM radiative transfer code (Dubuisson et al., 2005). Thiscode was originally developed for the IIR/CALIPSO (Gar-nier et al., 2012) radiometer and has been adapted to MODISand SEVIRI sensors (Doutriaux-Boucher and Dubuisson,2009; Borde et al., 2010). Infrared radiances are calculatedby solving the radiative transfer equation for a vertically in-homogeneous plane-parallel atmosphere using the DISORTradiative transfer code developed by Stamnes et al. (1988).Gaseous line absorption (mainly H2O, CO2, O3, CH4 andN2O) and absorption continua for H2O and CO2 are con-sidered on the basis of the correlatedk distribution method(Lacis and Oinas, 1991; Kratz, 1995). This approach allowsus to account for interactions between gaseous absorptionand multiple scattering processes in the presence of cloudand/or aerosol layers, considered as plane parallel and homo-geneous media. Conversion tables of brightness temperatureto radiance, as well as gaseous absorption, have been cal-culated using the spectral response functions of the sensors.
Fig. 1. Example of brightness temperature differences (BTD) ob-served for the Eyjafjallajökull volcanic plume using MODIS/Terradata. The RGB composite image is presented on 6 May 2010 (left)at 11:55 UTC. BTD (11–12 µm) are reported as a function of bright-ness temperature (BT) at 12 µm (right), in the volcanic plume (red)or a cloudy area (blue).
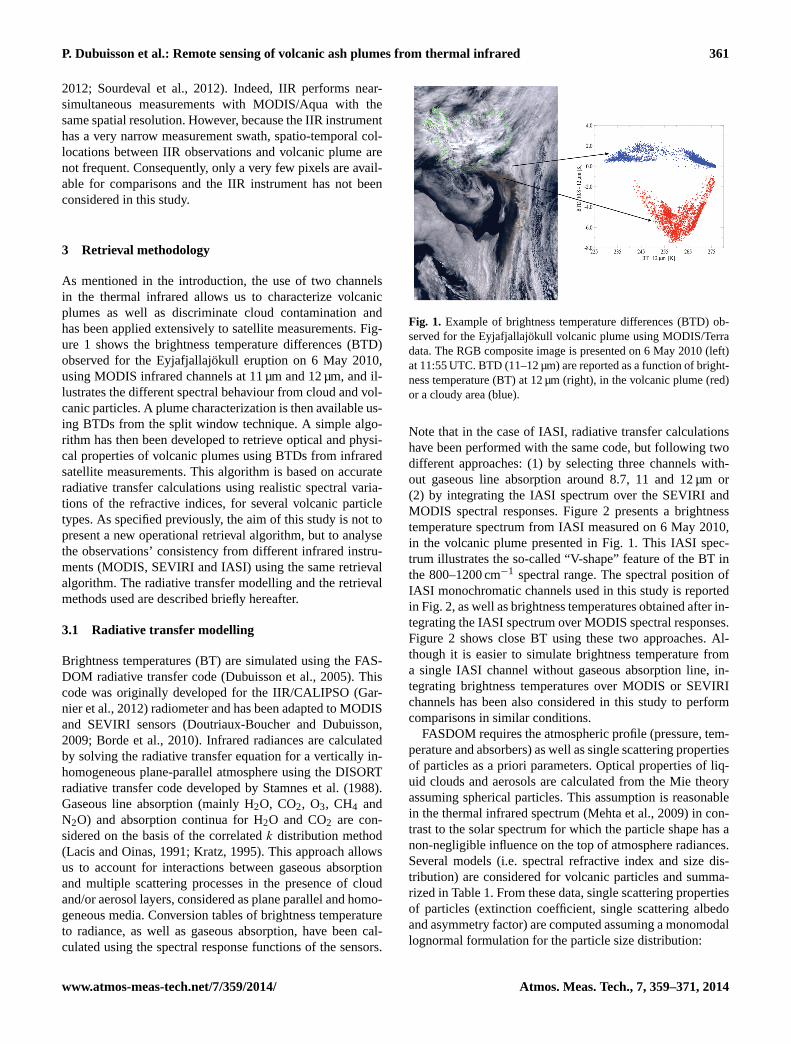
Note that in the case of IASI, radiative transfer calculationshave been performed with the same code, but following twodifferent approaches: (1) by selecting three channels with-out gaseous line absorption around 8.7, 11 and 12 µm or(2) by integrating the IASI spectrum over the SEVIRI andMODIS spectral responses. Figure 2 presents a brightnesstemperature spectrum from IASI measured on 6 May 2010,in the volcanic plume presented in Fig. 1. This IASI spec-trum illustrates the so-called “V-shape” feature of the BT inthe 800–1200 cm−1 spectral range. The spectral position ofIASI monochromatic channels used in this study is reportedin Fig. 2, as well as brightness temperatures obtained after in-tegrating the IASI spectrum over MODIS spectral responses.Figure 2 shows close BT using these two approaches. Al-though it is easier to simulate brightness temperature froma single IASI channel without gaseous absorption line, in-tegrating brightness temperatures over MODIS or SEVIRIchannels has been also considered in this study to performcomparisons in similar conditions.
FASDOM requires the atmospheric profile (pressure, tem-perature and absorbers) as well as single scattering propertiesof particles as a priori parameters. Optical properties of liq-uid clouds and aerosols are calculated from the Mie theoryassuming spherical particles. This assumption is reasonablein the thermal infrared spectrum (Mehta et al., 2009) in con-trast to the solar spectrum for which the particle shape has anon-negligible influence on the top of atmosphere radiances.Several models (i.e. spectral refractive index and size dis-tribution) are considered for volcanic particles and summa-rized in Table 1. From these data, single scattering propertiesof particles (extinction coefficient, single scattering albedoand asymmetry factor) are computed assuming a monomodallognormal formulation for the particle size distribution:
www.atmos-meas-tech.net/7/359/2014/ Atmos. Meas. Tech., 7, 359–371, 2014

362 P. Dubuisson et al.: Remote sensing of volcanic ash plumes from thermal infrared
Table 1.DensityD at 293 K of particle types and refractive indicesreferences used in this study.
Particle type D (g cm−3) Ref.
Andesite 2.65 Pollack et al. (1973)Volcanic Ash 2.8 Shettle and Fenn (1979)Basalt 2.9 Pollack et al. (1973)Hematite 5.1 Longtin et al. (1988)Obsidian 2.65 Pollack et al. (1973)Quartz 2.65 Longtin et al. (1988)
n(r) =N0
r lnσ√
2πexp
(−
1
2
[lnr − lnr0]2
[lnσ ]2
), (1)
whereN0 is the total number density,r is the particle radius(µm), r0 is the geometric mean radius (µm) andσ is the ge-ometric standard deviation of the particle size distribution.Note that the standard deviationσ = 2 is used by default inthis study, because this value is within the range of particlestypically measured (Hess et al., 1998; Dubovik et al., 2002).From this formulation, the effective radiusre (µm) can bedefined as:
re =
∞∫0
r3n(r)dr
∞∫0
r2n(r)dr
= r0√
lnσ . (2)
The ash optical thickness is then defined from the extinctionefficiencyQext(λ,r) as:
τa(λ) = πL
∞∫0
r2Qext(λ,r)n(r)dr,
whereL is the thickness of the ash layer.The split window technique is based on the spectral varia-
tion of the particle extinction that can be measured by com-paring two thermal infrared channels. To get good accuracy,the single scattering optical properties have been calculatedat a high spectral resolution (1 cm−1) and then convolutedwith the spectral response of each channel. Practically, look-up tables (LUTs) of these integrated properties have beenbuilt for each spectral channel and for each particle type,with geometric mean radius varying from 0.25 to 20 µm witha grid step of 0.25 µm.
3.2 Retrieval algorithm description
The retrieval algorithm has been developed following thescheme proposed by Dubuisson et al. (2008). This algo-rithm was originally developed for cirrus clouds and has beenadapted to retrieve properties of volcanic plumes. It can bedescribed in three main stages:
28
1
2
Figure 2. IASI brightness temperature spectrum measured on May 6, 2010, in the volcanic 3
plume during the eruption of Eyjafjallajökull (black solid line). Spectral position of IASI 4
channels at 902.50 cm-1 (11 µm – green colour) and 832.00 cm-1 (12 µm – red colour) used in 5
this study to retrieve plume properties are reported on the spectrum (big dots). This compares 6
with mean brightness temperatures obtained after integrating the IASI spectrum over MODIS 7
spectral responses (horizontal bars). The width of horizontal bars represents the spectral width 8
of MODIS channels. 9
10
11
Fig. 2. IASI brightness temperature spectrum measured on 6 May2010, in the volcanic plume during the eruption of Eyjafjalla-jökull (black solid line). Spectral position of IASI channels at902.50 cm−1 (11 µm – green colour) and 832.00 cm−1 (12 µm –red colour) used in this study to retrieve plume properties are re-ported on the spectrum (big dots). This compares with mean bright-ness temperatures obtained after integrating the IASI spectrum overMODIS spectral responses (horizontal bars). The width of horizon-tal bars represents the spectral width of MODIS channels.
– As illustrated in Fig. 1, a pixel can be classified asvolcanic aerosol using a detection threshold, basedon the brightness temperatures for the three chan-nels at 8.7 µm, 11 µm and 12 µm (see Francis et al.,2012). In this study, ash detection flags have been de-fined for each instrument from comparisons with theRGB images for the plume on 6 May. As an exam-ple, for MODIS data, a pixel is identified as volcanicash if (BT11µm− BT12µm<−0.4 K) and if (BT8.7µm−
BT12µm>−4 K and BT11µm− BT12µm<−1 K). Theseash detection flags depend on the spectral charac-teristics and on viewing geometries of sensors andshould be better defined for operational applications.This threshold allows us to discriminate efficiently vol-canic plumes from clouds; however, some pixels in theplumes with large particle radius or composed of amixture of aerosol and cloud particles can be rejected.
– A set of brightness temperatures is pre-calculated withthe FASDOM code, for channels at 11 µm and 12 µm,to cover a realistic range of effective particle radiusrefrom 0.5 to 20 µm and aerosol optical thicknessτa at12 µm from 0 to 10. This set is calculated using theLUTs of single scattering properties presented in theprevious section and the atmospheric profile obtainedfrom the RAMS model (see below for details) for theconsidered pixel. In addition, the altitude and the tem-perature of the ash cloud can be estimated from theRAMS model or CALIOP data, when available.
Atmos. Meas. Tech., 7, 359–371, 2014 www.atmos-meas-tech.net/7/359/2014/

P. Dubuisson et al.: Remote sensing of volcanic ash plumes from thermal infrared 363
– From a pair of brightness temperatures at 11 µm and12 µm (i.e. a couple of BTD, BT at 12 µm), observedby a sensor for the considered pixel, retrievals (τa, re)
are obtained through linear interpolations from the pre-vious set of pre-calculated brightness temperatures.For a given pixel, a solution is sought separately forevery particle type presented in Table 1.
Finally, for each selected pixel, the retrieved parameters arethe ash optical thickness at 12 µm,τa, and the effective ra-dius of particles,re. In addition, mass loading,M (g m−2),which is an important parameter for aviation security, can beeasily evaluated from the retrieved effective size and opticalthickness as:
M =4
3πρr3
eτ12mc
keL, (3)
with ρ (kg m−3) the density of ash particles andke (m) theextinction coefficient. Note that the presence of thin cloudscan have an important impact on retrievals and must be con-sidered in operational algorithms (Prata and Prata, 2012).However, clouds have not been considered in this study be-cause available measurements from CALIOP have not showncirrus above the ash layer on 6 May, and most cloudy pixelshave been rejected from the detection flag defined above.
Furthermore, we use results from simulations using theRAMS (Regional Atmospheric Modeling System, Pielke etal., 1992; Cotton et al., 2003) 3-D meso-scale model to obtainrequired data used as atmospheric parameters for the FAS-DOM code, such as the atmospheric profiles (pressure, tem-perature and water vapour profiles) and the state of the vol-canic plume (altitude, thickness). Based on meteorologicalequations and on a simple tracer emission law, RAMS pro-vides the spatial and temporal evolution of mass loading, itsvertical distribution and its transport altitude (Minvielle et al.,2004a, b). Meteorological parameters of this model are ini-tialized and nudged with ECMWF reanalysed (0.5· 0.5 deg.)data (Uppala et al., 2005). The configuration of simulationsconsists of one grid (10· 10 km as spatial resolution) for thestudied area, with a vertical discretization of the atmosphereon 50 levels, including 20 levels below 10 km. Note that thisvertical discretization is identical to that used for the radiativetransfer calculations. Simulations with RAMS are made dur-ing a period of several days to get the spin-up. The principalevent simulated corresponds to the interesting case holdingfor different satellite observations on 6 May, when the vol-cano source emitted ash over several levels reaching 5 km, asobserved by Arason et al. (2011). Figure 3 presents the spa-tial distribution of the mass loading (vertically integrated) ofash plume. Similarly to the one observed in Fig. 1, the sim-ulated plume resembles the shape of a comma due to the NEwind direction over Atlantic Ocean, not so far from the vol-canic source. Simulations of spatial distribution are in agree-ment with observations, although the simulated plume shapeappears broader than the observed one (see Sect. 5). Note
29
1
Figure 3. Temporal and spatial evolution of mass loading obtained by RAMS model on May 2
6, from 8 to 14 UTC. 3
4
Fig. 3. Temporal and spatial evolution of mass loading obtained bythe RAMS model on 6 May, from 08:00 to 14:00 UTC.
that the RAMS model is used here, only to provide atmo-spheric parameters for FASDOM. This spatial evolution andaccurate forecasts of ash plume would be improved using anapproach combining satellite observations and the regionaltransport model, as proposed by Boichu et al. (2013).
4 Volcanic plume observation
The algorithm presented in the previous section has been ap-plied to the volcanic plume during the Eyjafjallajökull erup-tion on 6 May 2010 at 19:00 UTC, using BTD of SEVIRIchannels at 11 µm and 12 µm. This case study allows us tocompare our retrievals with those obtained by Francis etal. (2012) in similar conditions. The optical thickness andmean effective radius retrievals are obtained assuming a log-normal formulation for a monomodal size distribution, andmass loading is then estimated from Eq. (3). Optical andphysical properties are derived assuming a plume altitudeof 6 km following the radar observations at 5.5–6.5 km (Ice-landic Meteorological Office, IMO), even though it reachedabove 9 km, according to Hjaltadóttir et al. (2010).
The retrievals of the optical thicknessτa at 12 µm, of theparticle effective radiusre (µm), and estimates of the massloadingM (g m−2) are presented in Fig. 4. As mentioned inSect. 3.2, the retrieval algorithm is applied to a given pixel foreach particle type reported in Table 1 and several solutionsare then possible forre andM. Results presented in Fig. 4are the mean values of these parameters and they are closeto those obtained by Francis et al. (2012) for the same scene,but using only Andesite refractive index data (Pollack et al.,1973). In our study, mass loading and effective radius of par-ticles are generally of the order of 1–4 g m−2 and 2–5 µm,respectively; higher values are observed near the source and
www.atmos-meas-tech.net/7/359/2014/ Atmos. Meas. Tech., 7, 359–371, 2014

364 P. Dubuisson et al.: Remote sensing of volcanic ash plumes from thermal infrared
can reach 10 g m−2 and 8 µm, respectively. The mean effec-tive particle radius in Fig. 4 isre = 4.5 µm± 0.8 µm. Thereuncertainty is defined as the average of mean deviations ob-tained for each pixel due to multiple solutions. This uncer-tainty shows a large dispersion in retrieved effective radius byapplying the algorithm with several particle types and con-firms that retrievals are strongly dependent on the choice ofash refractive index data (Wen and Rose, 1994; Francis etal., 2012). The maximum mass loading (10 g m−2) is slightlyhigher than those retrieved by Francis et al. (2012) of about8 g m−2. The methodology and particle types used in thisstudy can explain this difference. Indeed, the retrieval algo-rithm employed by Francis et al. (2012) is based on a one-dimensional variational analysis, using SEVIRI data and An-desite refractive indices, with retrievals of the layer altitude,the mass loading and the size distribution effective radius, as-suming that all other parameters of the ash plume are known.The altitude of the plume is then simultaneously retrievedwith other physical parameters and not fixed as in our algo-rithm. The altitude retrieved by Francis et al. (2012) rangesfrom 3 to 12 km, with most pixels between 5 and 10 km.These results allow us to have confidence in plume param-eters retrieved from our algorithm.
Additional simulations (not presented here) were then per-formed to test the potential of the channel at 8.7 µm to bet-ter constrain retrievals. Note that the spectral range around8.7 µm can be affected by theν1 absorption band of SO2,which may appear in high concentration during volcaniceruptions. However, low levels of SO2 were generally ob-served during the Eyjafjallajökull eruptions. These simula-tions have shown that retrievals are also possible using thechannel at 8.7 µm. Nevertheless, the use of a third channel(8.7 µm) does not allow us to constrain enough the parti-cle type among the solutions retrieved with our algorithm.It is mainly due to the spectral characteristics of usual widefield-of-view sensors, with too large spectral bands to dis-criminate the particle type. In addition, analysis has revealedthe complex composition of the volcanic plume. Indeed,in situ measurements for the Eyjafjallajökull eruption haveshown that ash is composed with aggregates of various ty-pologies (Bonadonna et al., 2011). Samples of volcanic ashcollected near the source have shown a silica concentrationof 58 % (Sigmarsson et al., 2010), suggesting very fine an-desite ash (Zehner et al., 2010). This composition can alsovary as a function of time and eruptions, and hyperspectralsounders are necessary to distinguish aerosol type (Clarisseet al., 2010a).
5 Comparisons of satellite retrievals using differentinfrared instruments
The algorithm presented in Sect. 3 was applied inthe same way to brightness temperatures measured byMODIS/Terra (at 11:55 UTC), SEVIRI (at 12:00 UTC) and
30
1
2
Figure 4. Optical thickness at 12 µm τa, effective radius re and mass loading M retrieved using 3
SEVIRI data on May 6, 2010 at 19:00 UTC. Retrievals are defined as mean values obtained 4
from several particle models (see section 4 for details), assuming a lognormal formulation for 5
the size distribution and using BTD from SEVIRI channels at 10.8 µm and 12 µm. 6
Fig. 4. Optical thickness at 12 µmτa, effective radiusre andmass loadingM retrieved using SEVIRI data on 6 May 2010 at19:00 UTC. Retrievals are defined as mean values obtained fromseveral particle models (see Sect. 4 for details), assuming a log-normal formulation for the size distribution and using BTD fromSEVIRI channels at 10.8 µm and 12 µm.
IASI (mid-morning data), following the approach outlined inSect. 4, but for the plume on 6 May presented in Fig. 1. In-deed, due to orbital characteristics of the satellites, this casestudy allows us to compare near-simultaneous retrievals fromMODIS/TERRA and SEVIRI. For the IASI sensor, physi-cal parameters were retrieved from orbits corresponding tothe morning. This inter-comparison allows us to analyse re-trievals from instruments with different spatial resolutionsand with slightly different spectral configurations but ob-tained with the same retrieval algorithm.
Figure 5 presents retrievals for the plume using channelsat 11 µm and 12 µm. The spatial distributions are similar forretrieved parameters from the three instruments and also ap-pear close to those obtained from the RAMS model (Fig. 3).In addition, Table 2 presents the mean retrieved values fromSEVIRI, IASI and MODIS, for the optical thicknessτa at12 µm, the effective radiusre and the mass loadingM. Thelatter allows a more quantitative analysis and shows a close
Atmos. Meas. Tech., 7, 359–371, 2014 www.atmos-meas-tech.net/7/359/2014/

P. Dubuisson et al.: Remote sensing of volcanic ash plumes from thermal infrared 365
Fig. 5. Retrievals of optical thicknessτa at 12 µm (top), effectiveradiusre (middle) and mass loadingM (bottom) on 6 May, usingMODIS/Terra (11:55 UTC), SEVIRI (12:00 UTC) and IASI (mid-morning data).
agreement between the effective radius retrievals. However,retrievals for the optical thickness and estimates of the massloading are higher for MODIS and IASI. Deviations withSEVIRI retrievals may be explained by differences in spec-tral characteristics and the viewing angle of instruments (seeSect. 2). In addition, the spectral response of SEVIRI chan-nels is slightly different from the one of MODIS, in particularfor the channel centred at 10.8 µm (926 cm−1) with a spectralwidth of about 2 µm (200 cm−1) and that can be comparedwith those of MODIS (see Fig. 2).
Consequently, it seems difficult to evaluate the consistencyof retrievals due to differences in spatial and spectral charac-teristics of instruments, and no quantitative conclusion canbe drawn at this stage. In order to get a quantitative analysisof satellite retrievals, a detailed inter-comparison study wasconducted in two stages: firstly, sensitivity of our retrieval al-gorithm to the model parameter uncertainties was evaluated;secondly, the influence of the spatial and spectral characteris-tics of the sensors on retrieved parameters was analysed andcompared with the retrieval errors estimated in the previoussensitivity analysis.
Table 2.Mean values retrieved for the ash optical thicknessτa andthe effective radiusre, and estimated for the mass loadingM andthe total mass loadingMT, for the plume on 6 May 2010, as afunction of the satellite configuration. Note that SEVIRI retrievalscorrespond to larger viewing angles, contrary to the other satelliteconfigurations.
Satellite configuration τa re (µm) M (g m−2) MT (kt)
SEVIRI 0.42 4.2 1.9 162IASI 0.54 4.4 2.3 200MODIS 0.53 4.7 2.6 221MODIS_as_IASI 0.52 4.4 2.5 213IASI_as_SEVIRI 0.56 4.5 2.4 204IASI_as_MODIS 0.55 4.9 2.7 230
5.1 Estimation of the uncertainties in retrievedparameters
Sensitivity of our retrieval algorithm to main atmosphericparameters was estimated using the plume on 6 May at12:00 UTC presented in Fig. 1 and Fig. 5, to quantify the re-trieved parameters’ uncertainties. Retrievals were calculatedfor the different instruments assuming errors in the followinginput parameters:
– Temperature surface and profile: a realistic error(1T = 1 K) has been considered on each layer of thetemperature profile as well as on surface tempera-ture, compatible with the typical values used for theECMWF assimilation.
– Water vapour profile: an error of1H2O = 10 % ateach atmospheric level was considered. The latter iscompatible with typical a posteriori uncertainties fromoperational Level 2 of dedicated instruments such asIASI (Clerbaux et al., 2007).
– Layer thickness and altitude: an error of1z = 1 kmwas supposed on the thickness or the altitude of thevolcanic plume, assuming a constant optical thickness.This error can be considered as a maximal value forthe plume thickness and seems reasonable for the alti-tude in comparison with the observed altitudes for theplume, generally between 2 and 8 km.
– Aerosol type: the uncertainty due to the particle typeused for retrievals was evaluated by calculating themean difference between plume parameters derivedfrom the Andesite refractive index and from the othertypes of particles presented in Table 1. Andesite hasbeen selected as a reference case because several au-thors have noticed that Andesite refractive index datacan be considered as a suitable approximation for vol-canic ash (e.g. Wen and Rose, 1994; Prata and Grant,2001; Francis et al., 2012).
www.atmos-meas-tech.net/7/359/2014/ Atmos. Meas. Tech., 7, 359–371, 2014

366 P. Dubuisson et al.: Remote sensing of volcanic ash plumes from thermal infrared
Table 3. Uncertainties (in %) in the ash optical thicknessτa, the effective radiusre and the mass loadingM, retrieved with the algorithmpresented in Sect. 3 for the plume on 6 May, as a function of the instrument and as a function of the errors (1) in the input atmosphericparameters.
Uncertaintiesτa re M
(%) Errors1 MODIS SEVIRI IASI MODIS SEVIRI IASI MODIS SEVIRI IASI
Surface temperature 1 K 8 4 7 8 2 6 12 4 8Temperature profile 1 K 4 8 3 8 5 3 8 10 3Water vapour profile 10 % 2 4 < 1 4 5 < 1 4 6 < 1Layer thickness 1 km 10 8 10 7 6 6 12 8 8Aerosol type See Sect. 5.1. 4 5 6 15 12 20 14 10 15Layer altitude 1 km 20 16 18 10 14 10 18 14 15Size distribution 0.5 6 7 6 18 20 25 48 52 55(standard deviationσ)
– Size distribution: a deviation on the geometric stan-dard deviationσ of the particle size distribution wasconsidered in the range 1.5–2.5 (Francis et al., 2012).The standard deviationσ = 2, considered as the refer-ence in calculations, is used by default in this study.
Uncertainties (in %) inτa, re andM, resulting from errorsin atmospheric model parameters of the retrieval algorithm,are presented in Table 3. These uncertainties were estimatedthrough retrievals performed with the algorithm presented inSect. 3, for the three instruments, as a function of errors inatmospheric parameters as defined above. Specifically, un-certainties were calculated as the mean difference, for theentire plume, between retrieved plume parameters using in-put atmospheric parameters from the RAMS model and theones retrieved considering errors in these input parameters.Table 3 shows that the uncertainties due to surface and profiletemperature, water vapour profile and layer thickness gen-erally remains under 10 % for retrieved parameters and areclose for the three instruments. Note that the uncertainty dueto water vapour is weak for IASI channels, which have beenselected without gaseous line absorption. On the other hand,uncertainties in retrievals are very important in the case oferrors due to ash particle type, ash layer altitude and parti-cle size distribution, which is consistent with the fact thatinfrared measurements are mainly sensitive to these parame-ters (Herbin et al., 2013). Especially, uncertainties are alwaysabove 10 % in the case of errors in the layer altitude or par-ticle types, and can reach 50 % in the case of errors in thesize distribution for effective radius and mass loading esti-mates. These last parameters appear to be the most importanta posteriori error sources. Table 3 also shows that retrievalsare sensitive to the refractive indices (Francis et al., 2012)and, above all, to the particle size distribution. These con-clusions agree with Wen and Rose (1994), who reported thatthe mass loading is more sensitive to the particle size dis-tribution (considering a uniform, a lognormal and a gammasize distribution) than it is to the plume composition. Finally,Table 3 shows that uncertainties are globally equivalent for
the three instruments, and errors in atmospheric parametersdo not explain deviations observed on retrievals between thethree instruments. Consistency between retrievals was anal-ysed in Sect. 5.2 using the same viewing configuration forIASI and MODIS.
5.2 Inter-comparison of retrieved parameters
To evaluate the consistency of the observations, comparisonsof retrieved and estimated parameters were performed usingMODIS, SEVIRI and IASI data in the same spatial or spec-tral configuration, for the plume on 6 May at 12:00 UTC. Thefollowing satellite configurations were defined as follows:
– MODIS_as_IASI: retrieved parameters obtained fromMODIS brightness temperatures were averaged overthe same IFOV as IASI.
– IASI_as_MODIS: retrievals are obtained using anIASI high-spectral resolution spectrum integrated overthe MODIS spectral response and treated in the algo-rithm as MODIS data.
– IASI_as_SEVIRI: retrievals are also obtained using anIASI high-spectral resolution spectrum integrated overthe SEVIRI spectral response and treated in the algo-rithm as SEVIRI data.
Table 2 summarizes the mean values obtained for the ash op-tical thickness,τa, and the effective radius,re, as well as es-timations of the mass loading,M, for the previous three con-figurations.
– Influence of the spatial resolution on the retrievals: acomparison of results obtained for the MODIS andMODIS_as_IASI configurations in Table 2 allows usto verify the consistency of retrievals. Indeed, in thiscase the retrievals differences are on the order of 5 %and are weaker than uncertainties due to atmosphericmodel parameter errors (see Sect. 5.1). Moreover, themean effective radius and the mass loading obtained
Atmos. Meas. Tech., 7, 359–371, 2014 www.atmos-meas-tech.net/7/359/2014/

P. Dubuisson et al.: Remote sensing of volcanic ash plumes from thermal infrared 367
32
1
2
Figure 6. Same as Fig. 5, but for MODIS_as_IASI configuration (i.e. retrieved parameters 3
obtained from MODIS brightness temperatures averaged over the same IFOV than IASI). 4
5
Fig. 6. Same as Fig. 5, but for MODIS_as_IASI configurations(i.e. retrieved parameters obtained from MODIS brightness temper-atures averaged over the same IFOV as IASI).
by averaging MODIS retrievals over the same IFOVas IASI (MODIS_as_IASI configuration) are closer tothose obtained with IASI (Table 2). This conclusionis also illustrated in Fig. 6 that presents the spatialdistribution of the retrieved optical thickness and ef-fective radius, as well as the mass loadingM estima-tion in the MODIS_as_IASI configuration. Figure 6has to be compared with retrievals of IASI presentedin Fig. 5 and shows a satisfactory level of agreement.Finally, residual deviations between retrievals can alsobe explained by the sampling or viewing differencesand, to a lesser extent, time differences. Indeed, IASImeasurements correspond to the orbits of the morningwhile MODIS products correspond to BT measured at11:55 UTC.
– Influence of the spectral resolution on the retrievals:the influence of the spectral response of sensors wasestimated using IASI spectra as a reference. Parame-ters were retrieved from brightness temperatures ob-tained by integrating IASI spectra over the SEVIRIor MODIS spectral response (IASI_as_SEVIRI andIASI_as_MODIS configurations). In this case, re-trievals are obtained in the same viewing geome-try and spatial resolution. Table 2 presents devia-tions on the order of 10 to 15 % between retrievalsobtained for IASI_as_SEVIRI and IASI_as_MODIS,
33
1
2
3
Figure 7. Same as Fig. 5, but for IASI_as_MODIS (left) and IASI_as_SEVIRI (right) 4
configurations, i.e. retrievals are obtained using IASI spectra convoluted with the MODIS (or 5
SEVIRI) spectral response and treated in the algorithm as MODIS (or SEVIRI) data. 6
Fig. 7. Same as Fig. 5, but for IASI_as_MODIS (left) andIASI_as_SEVIRI (right) configurations, i.e. retrievals are obtainedusing IASI spectra convoluted with the MODIS (or SEVIRI) spec-tral response and treated in the algorithm as MODIS (or SEVIRI)data.
for the effective radius and the mass loading respec-tively. These deviations are non-negligible but remainon the order of those due to atmospheric parameters(Table 3). These differences are due to the differentspectral response functions of SEVIRI and MODIS,as noticed previously (width and spectral position ofthe SEVIRI channel at 10.8 µm). In addition, thesedeviations are weaker than those between SEVIRIand MODIS and confirm the consistency of retrievalswhen compared in similar conditions. These resultsallow us to conclude that the larger deviations ob-tained in Table 2 are inherent to the different view-ing geometry of the sensors. Note also that the re-trievals obtained for IASI_as_MODIS are closer to
www.atmos-meas-tech.net/7/359/2014/ Atmos. Meas. Tech., 7, 359–371, 2014

368 P. Dubuisson et al.: Remote sensing of volcanic ash plumes from thermal infrared
the results from MODIS than those obtained for IASI.This spectral consistency is also illustrated in Fig. 7that presents close spatial distributions of retrieved pa-rameters in two configurations, despite their differentspectral characteristics.
Furthermore, an estimation of the total mass loadingMT of the plume considered in this section (e.g. 6 May,12:00 UTC) was done using previous satellite retrievals. Thearea covered by the volcanic plume was first calculated us-ing geo-coordinates of retrievals in Fig. 6 and estimated at85 000 km2. The total ash mass loading was then calculatedas the product of the estimated plume area and the mean re-trieved mass loadingM. Estimations of the total mass load-ing MT are presented in Table 2 for each satellite configu-ration andMT can be estimated at 205 kt± 22 kt. This to-tal mass loading can be compared with that calculated byLabazuy et al. (2012) for the same plume situation, froman equivalent methodology based on inversions of the SE-VIRI infrared data. Labazuy et al. (2012) calculated a totalash mass of 210 kt for 6 May and this estimate is consistentwith the range of retrievedMT from our retrievals.
6 Conclusions
An inter-comparison of ash plume parameters obtained withthe same retrieval algorithm from measurements of infraredinstruments, commonly used for the monitoring of volcanicash (MODIS, SEVIRI and IASI), has been presented. Re-trievals obtained from these instruments, as well as those ob-tained from IASI and MODIS in similar spatial and spectralconfigurations, have been compared. The results of this inter-comparison, as a whole, allow us to conclude that retrievalsare in close agreement, despite the different spectral and spa-tial characteristics of the sensors and compared to uncertain-ties due to errors in input atmospheric parameters. Our studyhas also confirmed that uncertainties in retrievals are mainlydue to errors in the plume height, the particle compositionand, most of all, the particle size distribution. This analysisdemonstrates the consistency of observations and the robust-ness of the method to retrieve the optical thickness and theeffective particle size, and to estimate the mass concentrationof volcanic particles. However, the limitations of broadbandsensors, to distinguish aerosol type with a limited number ofspectral bands, have been confirmed.
In this study, high-spectral resolution spectra of IASI havebeen convoluted with the MODIS or SEVIRI spectral re-sponse functions to compare the retrievals in the same con-ditions. Nevertheless, high-spectral resolution measurementscan be very useful for the characterisation of the plume com-position (Clarisse et al., 2010b). Indeed, in the case of multi-spectral information of the TANSO-FTS instrument, Herbinet al. (2013) have shown that this approach enables simul-taneous retrievals of gas profiles and up to seven aerosolparameters, including the aerosol optical thickness, mean
geometric radius and standard deviation for coarse and finemodes, mean altitude of the aerosol layer, and aerosol layerwidth. Theses studies highlight the capabilities of hyper-spectral data to improve the remote sensing of volcanic ashplumes.
Acknowledgements.This work was supported by the “Cen-tre National d’Etudes Spatiales” (CNES – TOSCA), and the“Programme National de Télédétection Spatiale” (PNTS/AO2010-533409). The authors thank the ICARE Data and Services Center(www.icare.univ-lille1.fr, for SEVIRI, MODIS and IIR data), EtherCNES/CNRS-INSU (Ether websitehttp://www.pole-ether.fr, forIASI data) for providing access to satellite data, and the CINES(Centre Informatique National de l’Enseignement Supérieur)French national computing centre for donation of computationaltime.
Edited by: O. Dubovik
The publication of this article isfinanced by CNRS-INSU.
References
Alexander, D.: Volcanic Ash in the Atmosphere and Risks for CivilAviation: A Study in European Crisis Management, Int. J. Disas-ter Risk Sci., 4, 9–19, doi:10.1007/s13753-013-0003-0, 2013.
Arason, P., Petersen, G. N., and Bjornsson, H.: Observations ofthe altitude of the volcanic plume during the eruption of Ey-jafjallajökull, April–May 2010, Earth Syst. Sci. Data, 3, 9–17,doi:10.5194/essd-3-9-2011, 2011.
Boichu, M., Menut, L., Khvorostyanov, D., Clarisse, L., Clerbaux,C., Turquety, S., and Coheur, P.-F.: Inverting for volcanic SO2flux at high temporal resolution using spaceborne plume im-agery and chemistry-transport modelling: the 2010 Eyjafjalla-jökull eruption case study, Atmos. Chem. Phys., 13, 8569–8584,doi:10.5194/acp-13-8569-2013, 2013.
Bonadonna, C., Genco, R., Gouhier, M., Pistolesi, M., Cioni, R., Al-fano, F., Hoskuldsson, A., and Ripepe, M.: Tephra sedimentationduring the 2010 Eyjafjallajökull eruption (Iceland) from deposit,radar, and satellite observations, J. Geophys. Res., 116, B12202,doi:10.1029/2011JB008462, 2011.
Borde, R. and Dubuisson, P.: Sensitivity of Atmospheric MotionVectors Height Assignment methods to semi-transparent cloudproperties using simulated Meteosat-8 radiances, J. Appl. Mete-orol. Clim., 49, 1191–1204, 2010.
Clarisse, L., Prata, F., Lacour, J.-L., Hurtmans, D., Clerbaux, C.,Coheur, P.-F.: A correlation method for volcanic ash detectionusing hyperspectral infrared measurements, Geophys. Res. Lett.,37, L19806, doi:10.1029/2010GL044828, 2010a.
Clarisse, L., Hurtmans, D., Prata, A. J., Karagulian, F., Clerbaux, C.,De Mazière, M., and Coheur, P.-F.: Retrieving radius, concentra-tion, optical depth, and mass of different types of aerosols from
Atmos. Meas. Tech., 7, 359–371, 2014 www.atmos-meas-tech.net/7/359/2014/

P. Dubuisson et al.: Remote sensing of volcanic ash plumes from thermal infrared 369
high-resolution infrared nadir spectra, Appl. Optics, 49, 3713–3722, 2010b.
Clerbaux, C., Hadji-Lazaro, J., Turquety, S., George, M., Co-heur, P.-F., Hurtmanns, D., Wespes, C., Herbin, H., Blumstein,D., Tournier, B., and Phulpin, T.: The IASI/MetOp I mission:First observations and highlights of its potential contribution toGMES, Space Res. Today, 168, 19–24, 2007.
Clerbaux, C., Boynard, A., Clarisse, L., George, M., Hadji-Lazaro,J., Herbin, H., Hurtmans, D., Pommier, M., Razavi, A., Turquety,S., Wespes, C., and Coheur, P.-F.: Monitoring of atmosphericcomposition using the thermal infrared IASI/MetOp sounder, At-mos. Chem. Phys., 9, 6041–6054, doi:10.5194/acp-9-6041-2009,2009.
Cooper, S. and Garrett, T.: Identification of small ice crystals usingpassive radiometric observations, J. Appl. Meteorol., 49, 2334–2347, doi:10.1175/2010JAMC2466.1, 2010.
Corradini, S., Merucci, L., Prata, F., Silvestri, M., Musacchio, M.,Spinetti, C., Piscini, A., and Buongiorno, M. F.: SO2 and ashplume retrievals using MSG-SEVIRI measurements. Test case:24 November 2006, Mt. Etna eruption, IEEE USEREST Work-shop, Naples 11–14 November, 2008.
Corradini, S., Merucci, L., and Arnau, F.: Volcanic ash cloudproperties: comparison between MODIS satellite retrievals andFALL3D transport model, IEEE Geosci. Remote S, 8, 248–252,2011.
Cotton, W. R., Pielke, R. A., Walko, R. L., Liston, G. E., Tremback,C. J., Hiang, H., McAnelly, R. L., Harrington, J. Y., Nicholls,M. E., Carrio, G. G., and McFadden, J. P.: RAMS 2001: Currentstatus and future directions, Meteorol. Atmos. Phys., 82, 5–29,2003.
Doutriaux-Boucher, M. and Dubuisson, P.: Detection of vol-canic SO2 by spaceborne infrared radiometers, Atmos. Res.,doi:10.1016/j.atmosres.2008.08.009, 92, 69–79, 2009.
Dubovik, O., Holben, B., Eck, T. F., Smirnov, A., Kaufman, Y. J.,King, M. D., Tanré, D., and Slutsker, I.: Variability of absorptionand optical properties of key aerosol types observed in world-wide locations, J. Atmos. Sci., 59, 590–608, 2002.
Dubuisson, P., Giraud, V., Chomette, O., Chepfer, H., and Pelon, J.:Fast radiative transfer modeling for infrared imaging radiometry,J. Quant. Spectrosc. Ra., 95, 201–220, 2005.
Dubuisson P., Giraud, V., Pelon, J., Cadet, B., and Yang, P.: Sensitiv-ity of thermal infrared radiation at the top of the atmosphere andthe surface to ice cloud microphysics, J. Appl. Meteorol. Clim.,2545-2560, doi:10.1175/2008JAMC1805.1, 2008.
Francis, P. N., Cooke, M. C., and Saunders, R.: Retrieval of physicalproperties of volcanic ash using Meteosat: A case study from the2010 Eyjafjallajökull eruption, J. Geophys. Res., 117, D00U09,doi:10.1029/2011JD016788, 2012.
Garnier, A., Pelon, J., Dubuisson, P., Faivre, M., Chomette, O., Pas-cal, N., and Kratz, D. P.: Retrieval of Cloud Properties UsingCALIPSO Imaging Infrared Radiometer. Part I: Effective Emis-sivity and Optical Depth, J. Appl. Meteorol. Clim., 51, 1407–1425, doi:10.1175/JAMC-D-11-0220.1, 2012.
Herbin, H., Labonnote, L. C., and Dubuisson, P.: Multispectral in-formation from TANSO-FTS instrument – Part 2: Application toaerosol effect on greenhouse gas retrievals, Atmos. Meas. Tech.,6, 3313–3323, doi:10.5194/amt-6-3313-2013, 2013.
Hess, M., Koepke, P., and Schult, I.: Optical Properties of Aerosolsand Clouds: The Software Package OPAC, B. Am. Meteoreol.Soc., 79, 831–844, 1998.
Hillger, D. W. and Clark, J. D.: Principal component image analysisof MODIS for volcanic ash. Part I: Most Important Bands andImplications for Future GOES Imagers, J. Appl. Meteorol., 41,985–1001, 2002.
Hjaltadóttir, S., Sigmundsson, F., Oddsson, B., Hreinsdóttir, S.,Roberts, M. J., and Sveinbjörnsson, H.: Eruption in Eyjafjalla-jökull Status report: 18:00 GMT, 6 May 2010, Icelandic Mete-orological Office and Institute of Earth Sciences, University ofIceland, 6 May, 2010.
International Civil Aviation Organization (ICAO): Manual on vol-canic ash, radioactive material and toxic chemical clouds, ICAODoc. 9766-AN/954, Montreal, Quebec, Canada, 2001.
Inoue, T.: On the temperature and effective emissivity determinationof semi-transparent cirrus clouds by bi-spectral measurements inthe window region, J. Meteorol. Soc. Jpn., 63, 88–98, 1985.
Inoue, T.: A cloud type classification with NOAA 7 split-windowmeasurements, J. Geophys. Res., 92, 3991–4000, 1987.
Kratz, D. P.: The correlated k-distribution technique as applied tothe AVHRR channels, J. Quant. Spectrosc. Ra., 53, 501–517,1995.
Kuze, A., Suto, H., Nakajima, M., and Hamazaki, T.: Thermal andnear infrared sensor for carbon observation Fourier-transformspectrometer on the Greenhouse Gases Observing Satellite forgreenhouse gases monitoring, Appl. Optics, 48, 6716–6733,2009.
Labazuy, P., Gouhier, M., Harris, A., Guéhenneux, Y., Hervo, M.,Bergès, J.-C., Cacault, P., and Rivet, S.: Near real-time monitor-ing of the April–May 2010 Eyjafjallajökull ash cloud: an exam-ple of a web-based, satellite data-driven, reporting system, Int.J. Environ. Poll., 48, 262–272, doi:10.1504/IJEP.2012.049673,2012.
Lacis, A. A. and Oinas, V.: A Description of the correlated k-distribution method, J. Geophys. Res., 96, 9027–9064, 1991.
Le Treut, H., Somerville, R., Cubasch, U., Ding, Y., Mauritzen, C.,Mokssit, A., Peterson, T., and Prather, M.: Historical Overviewof Climate Change, in: Climate Change 2007: The PhysicalScience Basis, Contribution of Working Group I to the FourthAssessment Report of the Intergovernmental Panel on ClimateChange, edited by: Solomon, S., Qin, D., Manning, M., Chen,Z., Marquis, M., Averyt, K. B., Tignor, M., and Miller, H. L.,Cambridge University Press, Cambridge, United Kingdom andNew York, NY, USA, 2007.
Longtin, D. R., Shettle, E. P., Hummel, J. R., and Pryce, J. D.: AWind Dependent Desert Aerosol Model: Radiative Properties,AFGL-TR-88-0112, Air Force Geophysics Laboratory, HanscomAFB, MA, 1988.
Mehta, P., Harries, J. E., and Turner, D. D.: Effect of size dis-tribution and particle shape on simulations of downwelling in-frared spectra during Saharan dust storms, Current problems inatmospheric radiation, Proceedings of the International Radia-tion Symposium (IRS), Foz do Iguacu, Brazil, 3–8 August 2008,AIP Conf. Proc. 1100, 177–180, doi:10.1063/1.3116943, 2009.
Millington, S. C., Saunders, R. W., Francis, P. N., and Webster,H. N.: Simulated volcanic ash imagery: a method to compareNAME ash concentration forecasts with SEVIRI imagery for
www.atmos-meas-tech.net/7/359/2014/ Atmos. Meas. Tech., 7, 359–371, 2014

370 P. Dubuisson et al.: Remote sensing of volcanic ash plumes from thermal infrared
the Eyjafjallajökull eruption in 2010, J. Geophys. Res., 117,D00U17, doi:10.1029/2011JD016770, 2012.
Minvielle, F., Cautenet, G., Lasserre, F., Forêt, G., Cautenet, S.,Léon, J.-F., Andreae, M. O., Mayol-Bracero, O. L., Gabriel, R.,Chazette, P., and Roca, R.: Modeling of the transport of aerosolsduring INDOEX 1999 and comparison with experimental data,Part 1: carbonaceous aerosol distribution, Atmos. Environ., 38,1811–1822, 2004a.
Minvielle, F., Cautenet, G., Lasserre, F., Forêt, G., Cautenet, S.,Léon, J.-F., Andreae, M. O., Mayol-Bracero, O. L., Gabriel, R.,Chazette, P., and Roca, R.: Modeling the transport of aerosolsduring INDOEX 1999 and comparison with experimental data.Part 2: continental aerosol and their optical depth, Atmos. Envi-ron., 38, 1823–1837, 2004b.
Parol, F., Buriez J. C., Brogniez G., and Fouquart, Y.: InformationContent of AVHRR Channels 4 and 5 with Respect to the Ef-fective Radius of Cirrus Cloud Particles, J. Appl. Meteorol., 30,973–984, doi:10.1175/1520-0450-30.7.973, 1991.
Pavolonis, M. J., Feltz, F. W., Heidinger, A. K., and Gallina, G. M.:A Daytime Complement to the Reverse Absorption Techniquefor Improved Automated Detection of Volcanic Ash, J. Atmos.Ocean. Technol., 23, 1422–1444, doi:10.1175/JTECH1926.1,2006.
Pielke, R. A., Cotton, W. R., Walko, R. L, Tremback, C. J., Lyons,W. A., Grasso, L. D., Nicholls, M. E., Moran, M. D., Wesley,D. A., Leel, T. J., and Copeland, J. H.: A comprehensive meteo-rological modeling system RAMS, Meteorol. Atmos. Phys., 49,69–91, 1992.
Pollack, J. B., Toon, O. B., and Khare, B. N.: Optical properties ofsome terrestrial rocks and glasses, Icarus, 19, 372–389, 1973.
Prata, A. J.: Infrared radiative transfer calculations for vol-canic ash clouds, Geophys. Res. Lett., 16, 1293–1296,doi:10.1029/GL016i011p01293, 1989a.
Prata, A. J.: Observation of volcanic ash clouds usingAVHRR-2 radiances, Int. J. Remote Sens., 10, 751–761,doi:10.1080/01431168908903916, 1989b.
Prata, A. J. and Grant, I. F.: Retrieval of microphysical and mor-phological properties of volcanic ash plumes from satellite data:Application to Mt. Ruapehu, New Zealand, Q. J. Roy. Meteorol.Soc., 127, 2153–2179, 2001.
Prata, A. J. and Kerkmann, J.: Simultaneous retrieval of volcanicash and SO2 using MSG-SEVIRI measurements, Geophys. Res.Lett., 34, L05813, doi:10.1029/2006GL028691, 2007.
Prata, A. J. and Tupper, A. T.: Aviation hazards from volca-noes: the state of the science, Nat. Hazards, 51, 239–244,doi:10.1007/s11069-009-9415-y, 2009.
Prata, A. J., Bluth, G., Rose, W., Schneider, D., and Tupper,A.: Comments on “Failures in detecting volcanic ash from asatellite-based technique”, Remote Sens. Environ., 78, 341–346,doi:10.1016/S0034-4257(01)00231-0, 2001.
Prata, F. J. and Prata, A. T.: Eyjafjallajokull volcanic ash concentra-tions determined using SEVIRI measurements, J. Geophys. Res.,117, D00U23, doi:10.1029/2011JD016800, 2012.
Remer, L. A., Kaufman, Y. J., Tanré, D., Mattoo, S., Chu, D. A.,Martins, J. V., Li, R.-R., Ichoku, C., Levy, R. C., Kleidman, R. G.,Eck, T. F., Vermote, E., and Holben, B. N.: The MODIS aerosolalgorithm, products and validation, J. Atmos. Sci., 62, 947–973,2005.
Schlüssel, P., Hultberg, T. H., Phillips, P. L., August, T., and Calbet,X.: The operational IASI Level 2 processor, Adv. Space Res., 36,982–988, 2005.
Schmetz, J., Pili, P., Tjemkes, S., Just, D., Kerkmann, J., Rota, S.,and Ratier, A.: In Introduction to Meteosat Second Generation(MSG), B. Am. Meteorol. Soc., 83, 977–992, doi:10.1175/1520-0477(2002)083<0977:AITMSG>2.3.CO;2, 2002.
Schneider, D. J., Rose, W. I., and Kelley, L.: Tracking of 1992eruption clouds from Crater Peak vent of Mount Spurr Volcano,Alaska, using AVHRR, in: The 1992 eruptions of Crater Peakvent, Mount Spurr Volcano, Alaska, US, edited by: Keith, T. E.C., Geological Survey Bulletin B 2139, 27–36, 1995.
Shettle, E. P. and Fenn, R. W.: Models for the aerosols of the loweratmosphere and the effects of humidity variations on their opticalproperties, AFGL-TR-79-0214, 1979.
Sigmarsson, O., Óskarsson, N., Þórðarson, P., Larsen, G., andHöskuldsson, A.: Preliminary interpretations of chemical anal-ysis of tephra from Eyjafjallajökull volcano, Institute of EarthSciences – Nordic Volcanological Institute, 2 pp., 2010.
Sourdeval, O., Brogniez, G., Pelon, J., Labonnote, C.-L., Dubuis-son, P., Parol, F., Josset, D., Garnier, A., Faivre, M., and Minikin,A.: Validation of IIR/CALIPSO Level 1 Measurements by Com-parison with Collocated Airborne Observations during CIRCLE-2 and Biscay ’08 Campaigns, J. Atmos. Ocean. Tech., 29, 653–667, doi:10.1175/JTECH-D-11-00143.1, 2012.
Stamnes, K., Tsay, S., Wiscombe, W., and Jayaweera, K.: Nu-merically stable algorithm for discrete-ordinate-method radiativetransfer in multiple scattering and emitting layered media, Appl.Optics, 27, 2502–2509, 1988.
Thomas, H. E. and Watson, I. M.: Observations of volcanic emis-sions from space: current and future perspectives, Natural Haz-ards, 54, 323–354, doi:10.1007/s11069-009-9471-3, 2010.
Tupper, A., Carn, S., Davey, J., Kamada, Y., Potts, R., and Prata,F.: An evaluation of volcanic cloud detection techniques duringrecent significant eruption in the western Ring of Fire, RemoteSens. Environ., 91, 27–46, 2004.
Uppala, S. M., Kallberg, P. W., Simmons, A. J., Andrae, U., CostaBechtold, V. da, Fiorino, M., Gibson, J. K., Haseler, J., Hernan-dez, A., Kelly, G. A., Li, X., Onogi, K., Saarinen, S., Sokka,N., Allan, R. P., Andersson, E., Arpe, K., Balmaseda, M. A.,Beljaars, A. C. M., Berg, L. van d., Bidlot, J., Bormann, N.,Caires, S., Chevallier, F., Dethof, A., Dragosavac, M., Fisher, M.,Fuentes, M., Hagemann, S., Holm, E., Hoskins, B. J., Isaksen, L.,Janssen, P. A. E. M., Jenne, R., McNally, A. P., Mahfouf, J.-F.,Morcrette, J.-J., Rayner, N. A., Saunders, R. W., Simon, P., Sterl,A., Trenberth, K. E., Untch, A., Vasiljevic, D., Viterbo, P., andWoollen, J.: The ERA-40 re-analysis, Q. J. Roy. Meteorol. Soc.,131, 2961–3012, 2005.
Watson, I. M., Realmuto, V. J., Rose, W. I., Prata, A. J., Bluth,G. J. S., Gu, Y., Bader, C. E., and Yu, T.: Thermal infrared re-mote sensing of volcanic emissions using the moderate resolu-tion imaging spectroradiometer, J. Volcanol. Geoth. Res., 135,75–89, 2004.
Webley, P. W., Steensen, T., Stuefer, M., Grell, G., Freitas, S.,and Pavolonis, M.: Analyzing the Eyjafjallajökull 2010 erup-tion using satellite remote sensing, lidar and WRF-Chem dis-persion and tracking model, J. Geophys. Res., 117, D00U26,doi:10.1029/2011JD016817, 2012.
Atmos. Meas. Tech., 7, 359–371, 2014 www.atmos-meas-tech.net/7/359/2014/

P. Dubuisson et al.: Remote sensing of volcanic ash plumes from thermal infrared 371
Wen, S. and Rose, W. I.: Retrieval of sizes and total masses of par-ticles in volcanic clouds using AVHRR channels 4 and 5, J. Geo-phys. Res., 99, 5421–5431, 1994.
Yu, T., Rose, W. I., and Prata, A. J.: Atmospheric correction forsatellite-based volcanic ash mapping and retrievals using splitwindow IR data from GOES and AVHRR, J. Geophys. Res., 107,4311, doi:10.1029/2001JD000706, 2002.
Zehner, C.: Monitoring Volcanic Ash from Space, Proceedingsof the ESA-EUMETSAT workshop on the 14 April to 23May 2010 eruption at the Eyjafjoll volcano, South Iceland,Frascati, Italy, 26–27 May 2010, ESA-Publication STM-280,doi:10.5270/atmch-10-01, 2010.
www.atmos-meas-tech.net/7/359/2014/ Atmos. Meas. Tech., 7, 359–371, 2014