Embed Size (px)
Citation preview

Remote Sensing of Environment 113 (2009) 1453–1461
Contents lists available at ScienceDirect
Remote Sensing of Environment
j ourna l homepage: www.e lsev ie r.com/ locate / rse
Remote sensing of land-cover change and landscape context of the National Parks:A case study of the Northeast Temperate Network
Yeqiao Wang a,⁎, Brian R. Mitchell b, Jarunee Nugranad-Marzilli a, Gregory Bonynge a,Yuyu Zhou a, Gregory Shriver b,1
a Department of Natural Resources Science, University of Rhode Island, Kingston, RI 02881, United Statesb National Park Service, Northeast Temperate Network, 54 Elm Street, Woodstock, VT 05091, United States
⁎ Corresponding author. Tel.: +1 401 874 4345; fax: +E-mail address: [email protected] (Y. Wang).
1 Current address: Department of Entomology & WDelaware, Newark , DE 19716-2160, United States.
0034-4257/$ – see front matter © 2009 Elsevier Inc. Adoi:10.1016/j.rse.2008.09.017
a b s t r a c t
a r t i c l e i n f oArticle history:Received 29 November 2007Received in revised form 22 September 2008Accepted 23 September 2008
Keywords:National ParksNortheast Temperate NetworkLandsatLand-cover changeLandscape context of protected land
National park units and protected areas face critical management challenges because of changing land-covertypes and variability of landscape contexts within and adjacent the park boundaries. In this study wedeveloped and implemented a multi-scale protocol for detecting and monitoring land-cover change in andadjacent to National Parks and ten segments of the Appalachian National Scenic Trail (AT) in thenortheastern United States. We used Landsat imagery from 1970 to 2002 and recent ground-basedphotography to evaluate changes within park boundaries and within 0.5, 1, and 5 km buffers. The studyconcluded that all of the studied park units, except one segment of AT in Maine, experienced increases ofurban land and declines of forest cover in the immediately adjacent areas and extended buffer zones. Over30 years and across all parks and trail segments, urban land increased 172% and 181% within 0.5 and 1 km,respectively, of the park boundary or trail centerline. Over the same time period, forested area decreased by5% and 6% within 0.5 and 1 km, respectively, of the park boundary or trail centerline, with more loss of forestnear the parks (18%) than the trail segments (2%). This study provided baseline data demonstrating land-cover alteration over the past three decades and a foundation for a land-cover change and landscape contextprotocol suitable for monitoring future changes of National Parks and protected areas.
© 2009 Elsevier Inc. All rights reserved.
1. Introduction
Suburban sprawl, timber harvests and increasingly fragmentednatural habitats are just a few of the factors that impact theecosystems within and around National Parks and natural reserves(Hansen & Rotella, 2002). Those types of human-induced land-coverchange transform natural habitats and pose the single most importantthreat to biodiversity (Wessels et al., 2004; Sala et al., 2000; Soule,1991). National park managers across the country are confronted withincreasingly complex and challenging issues that require a broad-based understanding of the status and trends of each park's naturalresources as a basis for making decisions, working with otheragencies, and communicating with the public to protect park naturalsystems and native species (Fancy et al., 2009; Gross et al., 2006).Land-use legacies can persist for a long time, influencing plant speciescomposition, nutrient cycling, water flows, and climate. Understand-ing how land use and land cover have affected regional landscapeconfiguration and composition can provide a historical framework formeasuring associated changes in ecosystem function and can be used
1 401 874 4561.
ildlife Ecology, University of
ll rights reserved.
to guide restoration where desirable and feasible (Wilkinson et al.,2008). Knowledge of historical trends of land-cover change, not onlyhow much has changed but also where and when changes haveoccurred, can help landmanagers identify key resource and ecosystemstressors, as well as prioritize management efforts (Shriver et al.,2005).
The National Park Service (NPS) Vital Signs Monitoring Program,which is primarily implemented by the NPS Inventory & Monitoring(I&M) networks, aims to monitor a subset of physical, chemical, andbiological elements and processes of park ecosystems that are selectedto represent the overall health or condition of park resources, knownor hypothesized effects of stressors, or elements that have importanthuman values (Fancy et al., 2009). The Northeast Temperate Network(NETN), together with most other NPS I&M networks, has identified“landscape dynamics” as a high-priority vital sign (Mitchell et al.,2006). This vital sign includes the change in area and distribution ofecological systems within and adjacent to parks, extent of majordisturbances, and integrity of the ecological systems. Urban develop-ment, for example, is one of the most important stressors that theparks and other protected areas are facing. The primary monitoringquestions for landscape dynamics include: 1) what is the spatialextent of land-cover types within and adjacent to the parks and theprotected AT corridor, and 2) how have they changed over time?Through this study we wanted to test the hypotheses of 1) National

Table 1Selected NETN parks and AT segments for the study.
Site name Abbreviation State Size
Acadia National Park ACAD Maine 19,222 haMarsh–Billings–Rockefeller NHP MABI Vermont 223 haSaint-Gaudens NHS SAGA NewHampshire 60 haMinute Man NHP MIMA Massachusetts 304 haMorristown NHP MORR New Jersey 682 haSaratoga NHP SARA New York 1036 haRoosevelt–Vanderbilt NHS ROVA New York 276 haWeir Farm NHS WEFA Connecticut 30 haSelected AT segments APPA1. Whitecap Mountain Maine 7 km2. Saddleback Mountain Maine 21 km3. Chateauguay–No-town Area Vermont 33 km4. Hanover NewHampshire 21 km5. Tyringham Valley and Sheffield Massachusetts 48 km6. Walkill Valley New Jersey 38 km7. Dunnfield Creek New Jersey 46 km8. Hawk Mountain Sanctuary Pennsylvania 64 km9. Rausch Gap/St. Anthony's wilderness Pennsylvania 57 km10. Cumberland Valley Pennsylvania 27 km
1454 Y. Wang et al. / Remote Sensing of Environment 113 (2009) 1453–1461
park units of the NETN that close to urban areas or within historicalsuburban settings experienced more development adjacent to thepark boundaries in the past three decades; and 2) Selected ATsegments in the northeastern U.S. experienced significant amount ofland-cover change along the central path of the trail.
Remote sensing is a proven technology that is effective formapping and characterizing cultural and natural resources (e.g.,Jensen, 1996; Campbell, 1997; Welch et al., 2002). Remote sensingallows observation and measurement of biophysical characteristics ofthe landscape, and tracking of changes in landscapes over time(Parmenter et al., 2003; Wang & Moskovits, 2001). Remote sensing
Fig. 1. Locations of selected NETN park units and AT segm
change detection can be used to discern and simulate areas that havebeen altered by natural or anthropogenic processes (Jantz et al., 2003;Hansen et al., 2002). Change detection has often been discussed in theliterature (Wilkinson et al., 2008; Rhemtulla et al., 2007; Woodcock &Ozdogan, 2004; Walker, 2003; Rogan et al., 2002; Hayes & Sader,2001; Mas, 1999; Roberts et al., 1998; Lambin & Strahler, 1993; Mouatet al., 1993). Coppin et al. (2004) conducted a thorough review onchange detection methods in ecosystem monitoring. Kennedy et al.(2009-this issue) has reviewed extensively the application issues ofchange detection in management of protected areas.
Understanding the magnitude and pattern of land-cover changehelps establish a landscape context for the parks and protected areas,and offers resource managers a better understanding of how parkecosystems fit into the broader landscape. The intent of this study wasto provide essential baseline data about the general land-cover typesand landscape context in the vicinity of the NETN park units in thepast three decades and to demonstrate an implementation of aprotocol for revealing the past changes and monitoring futurechanges. The study had three primary objectives:
▪ Document general land-cover types within and surroundingselected NETN National Parks for 3 time periods: the mid-1970's,late-1980's, and 2002.
▪ Quantify changes in land-cover types within and adjacent to NETNparks using selected buffer areas for the three time periods.
▪ Reveal and assess patterns of land-cover change on the NETN parksand neighboring protected lands.
This study focused on eight (8) NETN park units, includingNational Park, National Historical Park (NHP) and National HistoricalSite (NHS), and ten (10) segments along the AT from Maine toPennsylvania. The AT segments, totaling 362 km, were selected basedon observed changes and on the potential for future change as
ents displayed on top of a mosaic of Landsat images.

1455Y. Wang et al. / Remote Sensing of Environment 113 (2009) 1453–1461
perceived by resource managers (Table 1, Fig. 1). Most of the NETNparks were established to preserve and protect significant culturalresources. Acadia (ACAD) is the only National Park in the NETN andhosts a diverse array of cultural, natural, and geologic resources. TheAT extends along the entire Appalachian Mountain range in theeastern United States. The trail corridor is a minimum of 305 m wideand spans 3500 km from Maine to Georgia. The Trail repeatedlytraverses the major elevation, latitudinal, ecological and culturalgradients that characterize the eastern United States. The AT and itsprotected corridor is an ideal transect to gauge changes in theenvironment caused by urbanization, recreational use, acid precipita-tion, exotic species, and climate change. Although the roughly 300 m-wide AT central corridor is protected, the adjacent landscape has beenchanging in the past decades. A recent study analyzed the extent andspatial distribution of forest clearing along a 16 km-wide corridorcentered on the AT, and concluded that managed forest harvests innorthern New England accounted for 76.8% of forest clearing withinthe corridor (Potere et al., 2007). This result highlights the importanceof documenting baseline conditions and monitoring change of land-cover types along the AT corridor.
2. Methods
A variety of remote sensing change detection methodologies havebeen developed and evaluated over the past twenty years (Roganet al., 2002; Woodcock & Ozdogan, 2004; Healey et al., 2005). Thepurpose of this paper is to provide a case study using existing remotesensing change detection methods that benefits park resourcemanagement and monitoring.
We used Landsat remote sensing data as the primary data sourcefor derivation of generalized land-cover information. Landsat satellitesprovide multispectral data from the early 1970s to the present. Giventhat the purpose of this project was to provide a general landscapecharacterization and change analysis instead of detailed vegetationand resource mapping, the spatial resolution of Landsat data was
Fig. 2. Examples of subset Landsat images and the buffers for a. Acadia National Park, b. Saratolarger area than the 5-km buffer zone.
appropriate. Data availability and cost were also a consideration. Atthe time this project was initiated a significant amount of Landsat datawas available at no cost from on-line open resources such as theGlobal Land Cover Facility (GLCF) (http://glcf.umiacs.umd.edu/index.shtml) or at low cost from other data archives. As the intent of thisstudy was to reveal the general trends of land-cover change andlandscape context, the difference in spatial resolution between MSSand TM/ETM+ images was not a concern as long as we obtained areasof land-cover types. We searched for Landsat data that representedthe best match in time frame and, if possible, were close to theanniversary of image acquisition in order to reduce seasonal effects.We ultimately acquired and processed thirty-three (33) scenes ofLandsat images, eleven (11) scenes for each of the three time periods:the early and middle of 1970s (MSS data), late 1980s (TM data), and2002 (ETM+ data). We projected all images into Universal TransverseMercator (UTM) map coordinates and, when necessary, conductedgeometric rectification with orthorectified Landsat ETM+ images asthe base.
Instead of processing entire scenes of Landsat images we applied a5-km buffer on park boundaries and the AT central line to subsetLandsat images for land-cover classifications of the study sites. Theonly exception to this procedure was Acadia National Park. ACADcontains islands and separated units either completely or partiallysurrounded by ocean and bay waters. We therefore chose to subset alarger section from the Landsat images that covered all segments ofACAD for the purpose of land-cover classification (Fig. 2a).
We defined a generalized classification scheme that included nineland-cover categories: Urban, Herbaceous Vegetation, Deciduous Forest,Coniferous Forest, Mixed Forest, Water, Wetlands, Barren Lands, andBare Rocks. We added an additional category (Regrowth Forest) for theWhitecap Mountain and Saddleback Mountain segments of the AT toreflect significant logging in the past and subsequent regrowth offorest adjacent to these two segments of the AT.
We conducted ground observation and verification under theguidance of NPS and AT scientists, land managers and volunteers. Field
ga NHP, and c. the AT HawkMountain segment. The subset image for ACAD site covers a

1456 Y. Wang et al. / Remote Sensing of Environment 113 (2009) 1453–1461
observations provided an essential, independent reference for verifyingland-cover types within the Landsat scenes as well as enhanced fieldknowledge for image interpretation and accuracy assessment. Since theground referencing data were intended for supporting three timeperiods of Landsat images, we paid special attention to the locationswhere the landscape had been altered and land use had changed overthe past thirty years. With the guidance of land managers andvolunteers, we identified sites with changed land use and markedthem on the hard copy of Landsat images and airphotos. These locationswere later used as reference sites for examining the classification results.We used Trimble® ProXR and GeoXT Global Positioning System (GPS)units to record locations of field transects and points of interest. Werecorded the general characteristics of the landscape and associatedinformation, aswell as a set of georeferencedfield photographs at pointsof interest using a Kodak® DC265 Field Imaging System. We collectedabout 2800 georeferenced digital photographswhich, when augmentedwith GPS data, effectively identified locations and characteristics of thelandscape within each study site. We combined the field photographsand GPS point data to create a virtual field reference database (Lunettaet al., 2001) for each studied park unit and AT segment within ageographic information system (GIS). Fieldwork confirmed the corre-spondence between spectral features on Landsat images and land-covertypes and patterns on the ground, as well as the changes that hadoccurred in the past. The virtual field reference database andgeoreferenced field photos provide benchmark data for long termmonitoring of landscape context of the study areas.
We employed supervised, unsupervised, and stratified classifica-tions for obtaining the land-cover data. We selected multiplesignatures to represent the spectral variations for each of the land-cover types. We then cross checked with USGS National Land CoverDataset (NLCD) of 1992 and 2001 (Homer et al., 2000), NationalWetland Inventory (NWI) data, and NPS Vegetation Mapping Projectdata for major discrepancies between classification results and thosereference datasets. For example if unlikely urban land existed fromsupervised classifications that were clearly in contradictory withNLCD data on urban land areas, we reexamined those pixel areas andmodified the signatures accordingly to improve supervised classifica-tions. We checked the classifications of late 1980s and 2002 Landsatimages against the NLCD 1992 and NLCD 2001, respectively, to get acloser timematch. The same practice appliedwith the NWI data. Uponfinishing the supervised classification, we recoded the classes intoappropriate land-cover categories, which resulted in final land-covertypes defined by our classification scheme.
The NPS VegetationMapping Program is a cooperative effort by theUSGS and NPS to classify, describe, and map vegetation of more than270 national park units across the United States (http://biology.usgs.gov/npsveg/). The NPS vegetation mapping project utilizes thenational vegetation classification standard as the classificationscheme. The maps consisted of vector GIS data that definedboundaries of vegetation types based on plot information and manualdelineations from aerial photos. The standard minimummapping unitwas 0.5 ha and the thematic accuracy was N80% per class. ACAD,Roosevelt–Vanderbilt NHS (ROVA), and Saratoga NHP (SARA) werethe only park units in this study that had available NPS vegetationmapping project data at the time of image classifications. For thosethree sites we employed stratified classification technique in the land-covermapping so that the vegetationmapping data can be referenced.
Stratification involves segmentation of an image into focused areasand categories based on existing GIS land-cover data in order toimprove a classification (Wang et al., 2007). We used NPS vegetationmapping data as the base line to mask corresponding pixels for eachvegetation/land-cover category from the subset of Landsat images, sothat the follow up classifications were focused on each of thevegetation/land-cover types identified by the vegetation mappingprojects.We began by rasterizing the vectorGIS format vegetation datafrom ACAD, SARA and ROVA, matching the pixel size with the Landsat
data. We then ran image-to-image geometric rectification on therasterized vegetation map using the georeferenced Landsat-7 ETM+images as a base. Next, we separated Landsat data into segmentedimages for further classification by using vegetation types and otherland-cover categories in the rasterized NPS vegetationmap data as themask to extract pixels from Landsat images.We then ran unsupervisedclassifications on each of the segmented images into 20 spectralclusters and labeled the spectral clusters upon finishing the classifica-tion. The dominant category for the spectral clusters should be thevegetation or land-cover type defined by the masking type from theNPS vegetation map data. Pixels that had distinct spectral differencesfrom the masked type were labeled into corresponding types definedby the classification scheme. We repeated this process until all thesegmented images were classified and correctly labeled. We thenmosaicked all classified segmented images to create the final land-cover map and conducted visual comparisons to assess the agreementbetween the NPS vegetation mapping project data and the classifica-tion results. This allowed us to identify and reduce conflicts betweendata products as well as use the NPS vegetation mapping data tomonitor landscape context.
We employed equalized random sampling in our accuracyassessment by selecting 50 reference pixels for each land-covercategory for each study site and for each time period. We interpretedthe reference pixel samples directly from the Landsat imagery, usingour understanding of the spectral features of land-cover types withfield GPS photos as the guide, as well as referencing the available aerialphotographs and GIS data products. We use error matrices to reportthe agreement between classification results and reference samples.
We adopted the post-classification comparison method to obtainchanges in areas of land-cover type. Post-classification comparison,also known as delta classification, involves independently producedspectral classification data from each end of the time interval ofinterest, followed by comparison of data to detect changes in covertype (Coppin & Bauer, 1996; Mas, 1999; Coppin et al., 2004). Theprincipal advantage of post-classification comparison is that theimages are separately classified, thereby minimizing the problem ofradiometric calibration between dates (Song et al., 2001) andreducing the amount of data pre-processing. By choosing anappropriate classification scheme, post-classification comparison canalso be made insensitive to a variety of transient changes. Withappropriately developed land-cover maps in separate time periods,the class changes during the time interval and transition rate betweenclasses can be calculated (Hall et al., 1991). However, because post-classification change analyses depend on separately classified land-cover data for extracting the change analysis, error propagation is amajor concern. The final accuracy of a change analysis is very close tothe multiplied accuracy of each individual classification, and accu-mulated errors may mislead the interpretation of the change analysis.Given that post-classification change detection is an easy-to-executeand easy-to-communicate method to the land managers, we decidedto use this method for this study.
We applied spatial buffers to extract land cover and landscapecontext information in different buffer zones. Our 500-m and 1-kmbuffer sizes roughly corresponded to distances where ecological edgeeffects have been noted for birds (approximately 500 m) andmammals(up to 900m), and our 5-kmbuffer begins to approximate the land areaneeded to support large carnivores (up to 200,000 ha) (Kennedy et al.,2003). These buffer widths are similar to buffer sizes used by otherauthors (e.g., Brazner et al., 2007), and we chose these buffer sizesbecause they were likely to be ecologically relevant and because theyallowed us to explore how land-cover changes with increasing distancefrom parks. The appropriate buffer sizes for a given analysis should becarefully chosen tomatch thepurposeof theanalysis, andmayvary fromthe sizes that we chose. The buffering analysis provided four groups ofland cover and landscape context information including: 1) within thepark boundary (not applicable for AT segments); 2) the zone within
1457Y. Wang et al. / Remote Sensing of Environment 113 (2009) 1453–1461
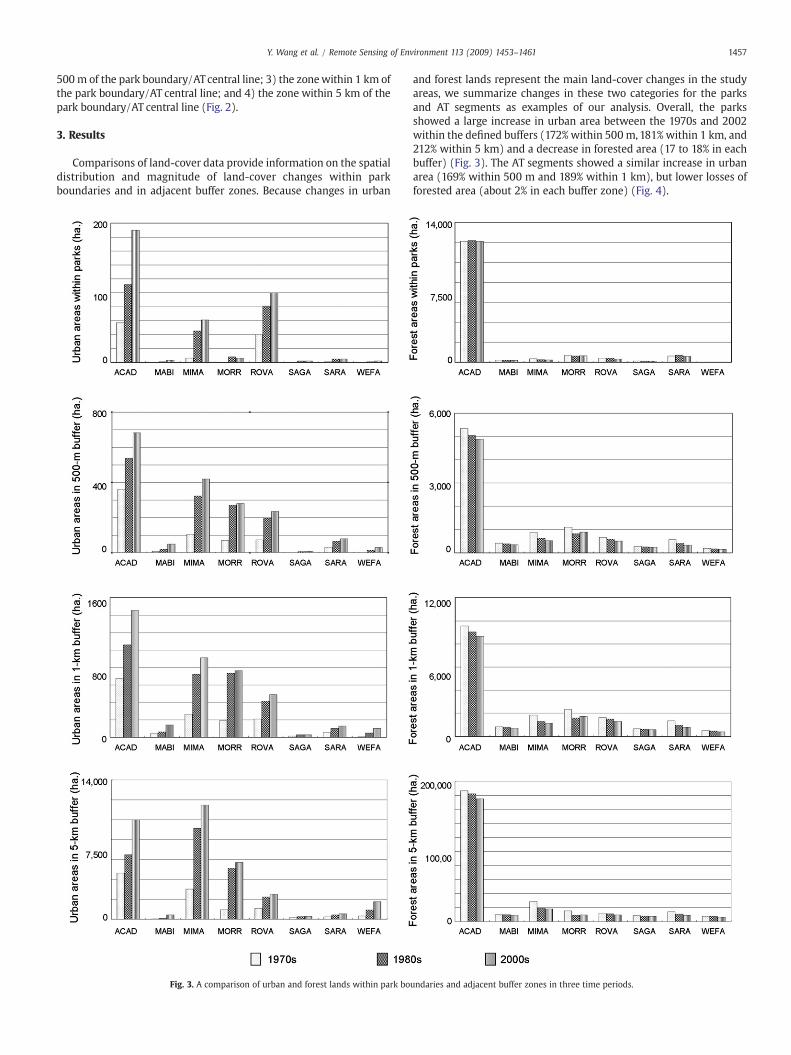
500 m of the park boundary/ATcentral line; 3) the zonewithin 1 km ofthe park boundary/AT central line; and 4) the zone within 5 km of thepark boundary/AT central line (Fig. 2).
3. Results
Comparisons of land-cover data provide information on the spatialdistribution and magnitude of land-cover changes within parkboundaries and in adjacent buffer zones. Because changes in urban
Fig. 3. A comparison of urban and forest lands within park bo
and forest lands represent the main land-cover changes in the studyareas, we summarize changes in these two categories for the parksand AT segments as examples of our analysis. Overall, the parksshowed a large increase in urban area between the 1970s and 2002within the defined buffers (172% within 500 m,181% within 1 km, and212% within 5 km) and a decrease in forested area (17 to 18% in eachbuffer) (Fig. 3). The AT segments showed a similar increase in urbanarea (169% within 500 m and 189% within 1 km), but lower losses offorested area (about 2% in each buffer zone) (Fig. 4).
undaries and adjacent buffer zones in three time periods.

Fig. 4. A comparison of urban and forest lands adjacent to the central line of selected ATsegments in three time periods.
1458 Y. Wang et al. / Remote Sensing of Environment 113 (2009) 1453–1461
Acadia, the only large national park in the NETN, protects thehighest rocky headlands on the Atlantic shore of the United States.Urban development is an important concern for resource manage-ment at the park. Within the ACAD boundary, urban land changedfrom 57 ha to 190 ha, a 233% increase, between 1976 and 2002. Urbanland approximately doubled in each of the buffer zones over the sameperiod. Development along the gateway to the park (e.g., Route 3) andurban centers (e.g., Bar Harbor, Northeast Harbor, and Southwest
Harbor) contribute to the changes of land cover and landscapecontext. The total areas of deciduous, coniferous and mixed forestswithin the ACAD boundary were stable between 1976 and 2002.However, within the 500-m buffer zone forest declined 5.6% between1976 and 1986, and 3.1% between 1986 and 2002. The same pattern offive to 10% decline in forest area was seen within the 1-km and 5-kmbuffer zones.
Comparing maps of the main section of ACAD based on the NPSvegetation mapping project data (Fig. 5a), the USGS NLCD 2001 data(Fig. 5b) and the 2002 land-cover data from this study (Fig. 5c)illustrates some important differences. The NPS vegetation maprepresents land-cover types in manually delineated polygons. TheNLCD data, as a national level dataset, may not reflect the variation oflocalized land covers within the specific park areawell. For example, thecovers of coniferous forest are overwhelmed in the NLCD map for theACAD as shown in Fig. 5b. The map from our stratified classificationsrepresents the variation of land-cover types of the park. Since our subsetareas are more focused and we had more field observations to supportour training signature selection, the final land-cover data, after crosschecking with NLCD and other reference datasets, should reflect land-cover variationmore closely than simply adopting land-cover categoriesfrom the NLCD or NPS vegetation mapping project.
The summarized overall classification accuracies for each study siteand time period provide information regarding the classificationresults (Table 2). The assessment of classification accuracy for AcadiaNational Park serves as an example of our evaluation (Table 3). Theuser's and producer's accuracies, as well as the overall accuracy, reportthe contribution of errors from the classification of each land-covertype. The barren land/bare rocks and herbaceous vegetation achievedlower accuracies than other categories. The category of bare rocks wasapplied to Acadia National Park and the Whitecap Mountain andSaddleback Mountain segments of the AT to reflect the stony coastalshoreline and granite summits such as the Cadillac Mountain.
4. Discussion and conclusion
Monitoring landscape dynamics is important because changeswithin and adjacent to parks and protected areas can alter waterquality and flow regimes, increase the likelihood of invasive plant andanimal range expansions, reduce contiguous forest, and influenceambient sounds and clear night skies, among other impacts (Mitchellet al., 2006; Theobald, 2001). Monitoring land-cover changes willguide decision-making for resource management of these protectedlands. This study produced land-cover maps across a large region, andprovides the NETN with approximately 30 years of baseline data forunderstanding land-cover changes and landscape context in andaround the parks and protected linear corridor of the AT. The baselinedata will be used for years to come, and will provide a foundation formonitoring future changes in land cover.
The recent National Resources Inventory (NRI: http://www.nrcs.usda.gov/) report singled out that the impact of development on ruralnonfederal land is a concern in the balancing of development needswith conservation of natural resources. Land conversions for devel-oped uses can result in fragmentation of landscape, leading todiminished values for wildlife, water management, open space, andaesthetic purposes, among others (NRI, 2003). The buffer and changeanalyses of this study concluded that all of the studied park units andalmost all of the selected AT segments experienced significantincreases of urban land cover in immediately adjacent areas andextended buffer zones. The NRI reports indicate that the increase ofdeveloped land for the states of Maine, New Hampshire, Vermont,Massachusetts, Connecticut, New York, New Jersey and Pennsylvania,are far less than the increasing rates of urban lands adjacent to thepark units and AT segments that are situated in the states.
In Maine, for example, statewide developed land increased from2% of the area of the state in 1982, to 3% in 1987, to 3% in 1992 and to

Fig. 5. A comparison of NPS vegetation mapping project data (a), NLCD 2001 data (b) and the 2002 land-cover data for selected portion of the Acadia National Park generated fromthe stratified classification (c).
1459Y. Wang et al. / Remote Sensing of Environment 113 (2009) 1453–1461
4% in 1997. The forested land changed from 85% of the area of the statein 1982, to 89% in 1987, to 90% in 1992 and to 89% in 1997. The changesof urban and forested land within and adjacent the Acadia NationalPark, however, represent a different development pattern. Along theAT, the Whitecap Mountain segment in Maine is the only segment inthe study sites that had no sign of urban development adjacent to thetrail. The changes of forested land in the Whitecap Mountain andSaddlebackMountain segments reflect the effect of managed forest onthe landscape that agreed with the pattern revealed by the NRI data.
In Vermont, the NRI data show that developed land increased from4% of the area of the state in 1982, to 5% in 1987, and remained to 5% in
Table 2Overall classification accuracy and kappa coefficient for each site, and year of dataacquisition and type of data.
Site name The year, overall accuracy and kappa coefficient
1970s (MSS) 1980s (TM) 2000s (ETM+)
ACAD 1976, 84.8%, 0.83 1986, 86.5%, 0.85 2002, 87.0%, 0.85MABI 1978, 89.0%, 0.87 1989, 85.7%, 0.83 2002, 88.6%, 0.87SAGA 1978, 90.3%, 0.87 1989, 88.3%, 0.86 2002, 85.5%, 0.83MIMA 1974, 85.1%, 0.83 1987, 91.4%, 0.90 2002, 87.0%, 0.85MORR 1976, 87.1%, 0.85 1988, 84.6%, 0.82 2002, 89.4%, 0.88SARA 1976, 84.8%, 0.83 1989, 88.29%, 0.86 2002, 85.7%, 0.83ROVA 1973, 91.4%, 0.90 1988, 92.0%, 0.91 2002, 90.1%, 0.89WEFA 1973, 87.1%, 0.85 1989, 85.1%, 0.83 2002, 86.2%, 0.84APPA segments
11. Whitecap 1976, 86.3%, 0.84 1987, 92.57%, 0.91 2002, 90.6%, 0.8912. Saddleback 1972, 81.7%, 0.78 1986, 89.5%, 0.88 2002, 88.8%, 0.8713. Chateauguay 1976, 68.3%, 0.64 1987, 70.3%, 0.66 2002, 78.3%, 0.7514. Hanover 1978, 82.0%, 0.79 1989, 83.3%, 0.81 2002, 80.0%, 0.7715. Tyringham 1973, 87.4%, 0.85 1989, 88.3%, 0.86 2002, 86.9%, 0.8516. Walkill Valley 1975, 70.0%, 0.65 1988, 83.1%, 0.80 2002, 80.0%, 0.7717. Dunnfield Creek 1975, 76.0%, 0.72 1988, 81.4%, 0.78 2002, 81.43%, 0.7818. Hawk Mountain 1973, 72.8%, 0.68 1989, 83.4%, 0.80 2002, 79.7%, 0.7619. Rausch Gap 1973, 79.0%, 0.79 1989, 86.7%, 0.84 2002, 90.3%, 0.8820. Cumberland 1973, 82.3%, 0.79 1989, 83.3%, 0.80 2002, 83.0%, 0.80
1992 and 1997, respectively. The forested land changed from 68% ofthe area of the state in 1982, to 71% in 1987, and remained as 71% in1992 and 1997. At Marsh–Billings–Rockefeller NHP in Vermont,reforestation has occurred in many areas from agricultural abandon-ment, resulting in naturally regenerated northern hardwood forests.Forest cover within the park boundary did not change much over theyears, but declined in the buffer areas. Urban land did not changewithin the MABI boundary, but it tripled between 1978 and 1989 andthen doubled between 1989 and 2002 within the 0.5 km buffer. Forthe Chateauguay segment of the AT situated in central Vermont, urbanland increased within defined buffer zones and forested land didn'tchange much, which showed the same pattern as NRI data indicated.The AT segments in New Hampshire and Massachusetts experiencedsignificant urban development within the immediately adjacentbuffer zone of the central path. Although the Walkill Valley andDunnfield Creek segments in New Jersey are protected by public landacquisition efforts, urban increases along the AT were evident.
The NRI data indicate that for the state of Pennsylvania, whiledeveloped land increased from 10% of the area of the state in 1982, to11% in 1987, to 12% in 1992 and to 14% in 1997, forested land accountedfor 54% in 1982, 1987 and 1997 and 53% in 1992. For the AT inPennsylvania, forested land in the Hawk Mountain segment hasremained stable while urban area has doubled within the bufferssurrounding this segment. The Rausch Gap/St. Anthony's Wildernesssegment is the largest undeveloped roadless section of the AT in themid-Atlantic region. Although not a federally designatedwilderness, itis a significant tract of unbroken public land in central Pennsylvania.Urban land doubled in each of the time periods between 1973–1989and 1989–2002, while forested land declined slightly in both the 0.5and 1 km buffers. The Cumberland Valley segment is a rapidlydeveloping residential and commercial area, in part due to majortransportation corridors that traverse the area. Historically the valleyhas been a significant agricultural area. The center of the valley now ishome to numerous trucking terminals served by the major east/west

Table 3An example of accuracy assessment for the land-cover data developed from classification of Landsat data for the Acadia National Park in 2002, 1986 and 1976.
ACAD Reference data
U DF CF MF W WL HV BR Totals User's accuracy
2002 land-cover data U 42 1 1 1 0 0 0 2 50 84.00%DF 0 45 1 2 0 0 1 1 50 90.00%CF 4 1 40 4 0 0 0 1 50 80.00%MF 3 2 0 43 0 1 1 0 50 86.00%W 0 0 0 0 49 0 0 1 50 98.00%WL 1 0 0 1 0 47 1 0 50 94.00%HV 5 1 0 1 0 0 43 0 50 86.00%BR 2 2 0 0 0 1 2 39 50 78.00%Totals 57 52 42 52 49 49 48 44 400Producer's accuracy 73.68% 86.54% 95.24% 82.69% 100% 95.92% 89.58% 88.64% Overall 87.00%
1986 land-cover data U 50 0 0 0 0 0 0 0 50 100.00%DF 1 44 0 2 0 1 2 0 50 88.00%CF 0 1 45 2 0 2 0 0 50 90.00%MF 2 0 4 43 0 1 0 0 50 86.00%W 0 0 0 0 49 0 0 1 50 98.00%WL 0 0 0 0 0 50 0 0 50 100.00%HV 5 3 1 2 0 0 31 8 50 62.00%BR 3 1 1 3 0 7 1 34 50 68.00%Totals 61 49 51 52 49 61 34 43 400Producer's accuracy 81.97% 89.80% 88.24% 82.69% 100% 81.97% 91.18% 79.07% Overall 86.50%
1976 land-cover data U 50 0 0 0 0 0 0 0 50 100.00%DF 0 44 1 1 0 1 1 2 50 88.00%CF 1 1 42 4 0 1 1 0 50 84.00%MF 1 2 2 44 0 0 0 1 50 88.00%W 0 0 0 0 50 0 0 0 50 100.00%WL 0 0 0 0 0 47 0 3 50 94.00%HV 8 5 0 1 0 1 26 9 50 52.00%BR 7 1 1 0 0 0 5 36 50 72.00%Totals 67 53 46 50 50 50 33 51 400Producer's accuracy 74.63% 83.02% 91.30% 88.00% 100.00% 94.00% 78.79% 70.59% Overall 84.75%
1460 Y. Wang et al. / Remote Sensing of Environment 113 (2009) 1453–1461
and north/south routes. This is the main factor that caused land-coverchange in this segment.
The temporal variation of land-cover change reveals the timeperiod that major development and changes occurred. Changing land-use patterns around Morristown NHP in northern New Jersey havealtered the character of the area from farmed or hardwood forestedareas intersected by streams to low density residential development,expanded networks of roads, and commercial and recreationaldevelopment. The NRI data show that for the state of New Jersey,developed land increased from 24% of area of the state in 1982, to 32%in 1987, to 33% in 1992 and to 38% in 1997. Although urban land didnot change much within the park boundary, the increase wassignificant in all buffer zones, particularly in the time period between1976 and 1988 when a major development occurred adjacent to thepark. As the available land became saturated, the change in urban areaslowed down between 1988 and 2002 within the buffer zones. Theresults answered the hypothesized questions that the national parkunits of the NETN that close to urban area or within historicalsuburban settings experienced more development adjacent to thepark boundaries in the past three decades than the statewidedevelopment patterns. Selected sensitive AT segments in the north-eastern U.S. experienced significant amount of urban developmentalong the central path of the trail.
This study confirms that the NETN park units are facing criticalmanagement challenges due to the complexity and variability oflandscape contexts outside the boundaries of their protected areas. TheNETN is not the only I&M network that faces such a challenge. Otherstudies show that rural areas in the American West, for example, areundergoing a dramatic transition in demography, economics, andecosystems (Riebsame et al., 1997; Theobald, 2001; Beyers & Nelson,2000). Studies in theGreater Yellow Stone Ecosystemsuggested that asnatural amenities attract people and commerce, the resulting land-usechange threaten biodiversity of the protected areas and challenge
efforts to sustain local communities and ecosystem (Hansen et al.,2002; Rasker & Hansen, 2000). Urban development adjacent theNational Parks and protected areas may be shrinking the naturalbuffers of those reserves and altering the ecosystems within them.Management of park units and protected areas will have to considerthe context of the landscape aswell as past and future changes in orderto achieve the goal of science based analysis, synthesis, and modeling.
Though the AT is but a thin ribbon when viewed from a regionalperspective, threats to the environment of the Appalachian Trail —including urbanization, recreational impacts, acid precipitation, exoticspecies, and climate change represent threats to this one of the mostbiologically diverse units of the National Park System (Doufour &Cristfield, 2008). The study for selected AT segments helps understandthe status of sensitive areas of the AT corridor, or a MEGA-Transect, inlandscape configuration. It provides baseline data for possible furtherstudies in landscape composition, diversity, distances from sources,edge-to-area ratios, and ecotonal features that may structure the plantand animal communities (Rosenberg et al., 1997; Schweiger et al.,2000). In cases where some development may be acceptable,management of AT can be incorporated into conservation of existinglandscape configuration so that AT can function as a connectionbetween larger protected areas. The protocol of this case study will besuitable for other linear protected areas such as river-based parks,roadways, habitat corridors, or trails across the country.
Landsat data and the derivatives of land-cover maps allow severalunits to be mapped at once and over time. As USGS plans to provideLandsat image products at no cost upon request for the entire U.S.archive (Woodcock et al., 2008), free imagery will help promoteremote sensing applications among user groups. The consistency ofmethods across the network should help the NPS assess how parks aredifferentially affected by natural and anthropogenic processes.
Land-cover change analysis is among the necessary tools forassessing landscape-scale impacts to park units, provided that we

1461Y. Wang et al. / Remote Sensing of Environment 113 (2009) 1453–1461
identify independent variables or processes that can be related to thechanges observed with the remote sensing data. For example,assessing the impact of urbanization on specific subject in a givenpark, such as invasive species, can be conducted by observing thechange of spatial patterns of the subject, and using spatial statistics tocorrelate severity of the subject with the urbanization or fragmenta-tion processes that can be estimated from the land-cover data.Identifying these independent variables requires multidisciplinaryexpertise, with ecologists, botanists, biologists, hydrologists, andothers working together and with land-cover data to answerquestions about threats and processes with information in land-cover change and landscape context.
Acknowledgements
This project was funded by the Northeast Temperate Network ofthe National Park Service Inventory & Monitoring program, inpartnership with the North Atlantic Coast Cooperative EcosystemStudies Unit. A great number of people assisted in completing thisproject. In particular we wish to express our sincere thanks to thefollowing individuals who provided expertise, insights, guidance andlogistical support throughout the project: Karen Anderson, Christo-pher Davis, Fred Dieffenbach, Dave Hayes, Chris Martin, ChristinaMarts, Robert Masson, Don Owen, Casey Reese, Matt Robinson, SteveWalasewicz, and Gregory Waters. Other individuals who advised usduring the project include David Barber, J.T. Horn, Beth Johnson,Michelle Miller, Bob Parker, Robin Reed, Nigel Shaw, Bob Sickley, LarryWheelock, and Don Whitney. Many other individuals and volunteerscontributed in countless ways to the project. We appreciate theencouragement, comments, critiques and suggestions from John Grossand three anonymous reviewers that helped to substantially improvethe quality of the manuscript.
References
Beyers, W. B., & Nelson, P. B. (2000). Contemporary development forces in thenonmetropolitanWest: New insights from rapidly growing communities. Journal ofRural Studies, 16, 459−474.
Brazner, J. C., Danz, N. P., Trebitz, A. S., Niemi, G. J., Regal, R. R., Hollenhorst, T., et al.(2007). Responsiveness of Great Lakes wetland indicators to human disturbances atmultiple spatial scales: A multi-assemblage assessment. Journal of Great LakesResearch, 33(Special Issue 3), 42−66.
Campbell, J. B. (1997). Introduction to remote sensing. New York: Guilford Press.Coppin, P. R., & Bauer, M. E. (1996). Change detection in forest ecosystems with remote
sensing digital imagery. Remote Sensing Reviews, 13, 207−234.Coppin, P., Jonckheere, I., Nackaerts, K., Muys, B., & Lambin, E. (2004). Digital change
detection methods in ecosystem monitoring: A review. International Journal ofRemote Sensing, 25(9), 1565−1596.
Doufour, C., & Cristfield, E. (2008). The Appalachian Trail MEGA-Transect, Harpers Ferry,WV, Appalachian Trail Conservancy, 2008.
Fancy, S. G., Gross, J. E., Carter, S. L. (2009). Monitoring the condition of natural resourcesin U.S. National Parks. Environmental Monitoring and Assessment, 151, 161–174.
Gross, J. E., Nemani, R. R., Turner, W., & Melton, F. (2006). Remote sensing for thenational parks. Park Science, 24, 30−36.
Hall, F. G., Botkin, D. B., Strebel, D. E., Woods, K. D., & Goetz, S. J. (1991). Large-scalepatterns of forest succession as determined by remote sensing. Ecology, 72,628−640.
Hansen, A. J., & Rotella, J. J. (2002). Biophysical factors, land use, and species viability inand around nature reserves. Conservation Biology, 16, 1−12.
Hansen, A. J., Rasker, R., Maxwell, B., Rotella, J. J., Wright, A., Langner, U., et al. (2002).Ecology and socioeconomics in the New West: A case study from GreaterYellowstone. Bioscience, 52, 151−162.
Hayes, D. J., & Sader, S. A. (2001). Comparison of change-detection techniques formonitoring tropical forest clearing and vegetation regrowth in a time series. Pho-togrammetric Engineering & Remote Sensing, 67(9), 1067−1075.
Healey, S. P., Cohen, W. B., Zhiqiang, Y., & Krankina, O. N. (2005). Comparison of TasseledCap-based Landsat data structures for use in forest disturbance detection. RemoteSensing of Environment, 97, 301−310.
Homer, C., Huang, C., Yang, L., Wylie, B., & Coan, M. (2000). Development of a 2001national landcover database for the United States. Photogrammetric Engineering andRemote Sensing, 70(7), 829−840.
Jantz, C. A., Goetz, S. J., & Shelley, M. A. (2003). Using the SLEUTH urban growthmodel tosimulate the land use impacts of policy scenarios in the Baltimore–Washingtonmetropolitan region. Environment and Planning (B), 31(2), 251−271.
Jensen, J. R. (1996). Introductory digital image processing: A remote sensing perspective.Upper Saddle River, New Jersey: Prentice-Hall.
Kennedy, R. E., Townsend, P. A., Gross, J. E., Cohen, W. B., Bolstad, P., Wang, Y. Q., et al.(2009). Remote sensing change detection tools for natural resource managers:Understanding concepts and tradeoffs in the design of landscape monitoringprojects. Remote Sensing Environment, 113, 1382−1396 (this issue).
Kennedy, C., Wilkinson, J., & Balch, J. (2003). Conservation thresholds for land useplanners.Washington, D.C.: Environmental Law Institute 55 pp.
Lambin, E. F., & Strahler, A. H. (1993). Change-vector analysis in multitemporal space: Atool to detect and categorize land-cover change processes using high-temporalresolution satellite data. Remote Sensing Environment, 48, 231−244.
Lunetta, R. S., Iiames, J., Knight, J., Congalton, R. G., & Mace, T. H. (2001). An assessmentof reference data variability using a “virtual field reference database. Photogram-metric Engineering & Remote Sensing, 63(6), 707−715.
Mas, J. F. (1999). Monitoring land-cover changes: A comparison of change detectiontechniques. International Journal of Remote Sensing, 20(1), 139−152.
Mitchell, B. R., Shriver, W. G., Dieffenbach, F., Moore, T., Faber-Langendoen, D., Tierney,G., et al. (2006). Northeast Temperate Network Vital Signs Monitoring Plan. Tech-nical Report NPS/NER/NRTR-2006/059. National Park Service, Northeast TemperateNetwork, Woodstock, Vermont.
Mouat, D. A., Mahin, G. G., & Lancaster, J. (1993). Remote sensing techniques in theanalysis of change detection. Geocarto International, 2, 39−50.
National Resources Inventory (2003). 2001 Annual NRI: Urbanization and Developmentof Rural Land, July 2003, Natural Resources Conservation Service, USDA,WashingtonD.C.
Parmenter, A. P., Hansen, A., Kennedy, R., Cohen, W., Langner, U., Lawrence, R., et al.(2003). Land use and land cover change in the Greater Yellowstone Ecosystem:1975–95. Ecological Applications, 13, 687−703.
Potere, D., Woodcock, C., Schnelder, A., Ozdogan, M., & Baccini, A. (2007). Patterns inForest Clearing Along the Appalachian Trail Corridor. Photogrammetric Engineering& Remote Sensing, 73(7), 783−791.
Rasker, R., & Hansen, A. J. (2000). Natural amenities and population growth in theGreater Yellowstone region. Human Ecology Review, 7, 30−40.
Rhemtulla, J. M., Mladenoff, D. J., & Clayton, M. K. (2007). Regional land-cover conversionin the U.S. upper Midwest: Magnitude of change and limited recovery (1850–1935–1993)Landscape Ecology, Vol. 22. (pp. 57−75) Supplement 1/December, 2007.
Riebsame, W. E., Gosnell, H., & Theobald, D. (Eds.). (1997). Atlas of the New West NewYork: W.W. Norton.
Roberts, D.A., Batista, G.T., Pereira, J.L.G., Waller, E.K., & Nelson, B.W. (1998). Changeidentification using multitemporal spectral mixture analysis: application in EasternAmazonia, In Remote sensing change detection: environmental monitoringmethods and applications, Lunetta and Elvidge (Editors), Ann Arbor Press, Chelsea,Michigan, pp. 137–161.
Rogan, J., Franklin, J., & Roberts, D. A. (2002). A comparison of methods for monitoringmultitemporal vegetation change using Thematic Mapper imagery. Remote Sensingof Environment, 80, 143−156.
Rosenberg, D. K., Noon, B. R., &Meslow, E. C. (1997). Biological corridors: Form, function,and efficacy. Bioscience, 47, 677−687.
Sala, O. E., Chapin, F. S., III, Armesto, J. J., Berlow, E., Blomfield, J., Dirzo, R., et al. (2000).Global biodiversity scenarios for the year 2100. Science, 287, 1770−1774.
Schweiger, E. W., Diffendorfer, J. E., Holt, R. D., Pierotti, R., & Gaines, M. S. (2000). Theinteraction of habitat fragmentation, plant, and small mammal succession in an oldfield. Ecological Monographs, 70, 383−400.
Shriver, G., Maniero, T., Schwarzkopf, K., Lambert, D., Dieffenbach, F., Owen, D., et al.(2005). Appalachian Trail Vital Signs, National Park Service, Northeast Region, Boston,Massachusetts, November 2005.
Song, C., Woodcock, C. E., Seto, K. C., Lenney, M. P., & Macomber, S. A. (2001).Classification and change detection using Landsat TM data: When and how tocorrect atmospheric effects? Remote Sensing of Environment, 75, 230−244.
Soule, M. S. (1991). Conservation: Tactics for a constant crisis. Science, 253, 744−750.Theobald, D. M. (2001). Land use dynamics beyond the American urban fringe. Geo-
graphical Review, 91, 544−564.Walker, R. (2003). Mapping process to pattern in the landscape change of the
Amazonian frontier. Annuals of the Association of American Geographers, 93(2),376−398.
Wang, Y., &Moskovits, D. K. (2001). Tracking fragmentation of natural communities andchanges in land cover: Applications of Landsat data for conservation in an urbanlandscape (Chicago Wilderness). Conservation Biology, 15(4), 835−843.
Wang, Y., Traber, M., Milstead, B., & Stevens, S. (2007). Terrestrial and submergedaquatic vegetation mapping in Fire Island National Seashore using high spatialresolution remote sensing data. Marine Geodesy, 30(1), 77−95.
Welch, R., Madden, M., & Jordan, T. (2002). Photogrammetric and GIS techniques for thedevelopment of vegetation database of mountainous areas: Great SmokyMountains National Park. ISPRS Journal of Photogrammetry and Remote Sensing,55, 53−68.
Wessels, K. J., De Fries, R. S., Dempewolf, J., Anderson, L. O., Hansen, A. J., Powell, S. L., et al.(2004). Mapping regional land cover with MODIS data for biological conservation:Examples from the Greater Yellowstone Ecosystem, USA and Pará State, Brazil. Re-mote Sensing of Environment, 92, 67−83.
Wilkinson, D. W., Parker, R. C., & Evans, D. L. (2008). Change detection techniques foruse in a statewide forest inventory program. PE & RS, 74(7), 893−901.
Woodcock, C. E., Allen, R., Anderson, M., Belward, A., Bindschadler, R., Cohen, W., et al.(2008, May 23). Free access to Landsat imageryScience, Vol. 320. (pp. 1011).
Woodcock, C.E., & Ozdogan, M. (2004). Trends in land cover mapping and monitoring,Land Change Science (Gutman, editor), Springer, New York, pp. 367–377.