Embed Size (px)
Citation preview

Remote Sensing of Environment 193 (2017) 165–179
Contents lists available at ScienceDirect
Remote Sensing of Environment
j ourna l homepage: www.e lsev ie r .com/ locate / rse
Assessing the effects of forest health on sun-induced chlorophyllfluorescence using the FluorFLIGHT 3-D radiative transfer model toaccount for forest structure
R. Hernández-Clemente a,⁎, P.R.J. North a, A. Hornero b, P.J. Zarco-Tejada c
a Department of Geography, Swansea University, SA2 8PP Swansea, UKb Instituto de Agricultura Sostenible (IAS), Consejo Superior de Investigaciones Científicas (CSIC), Córdoba, Spainc European Commission, Joint Research Centre (JRC), Directorate D – Sustainable Resources - Bio-Economy Unit, Via E. Fermi 2749 – TP 261, 26a/043, I-21027 Ispra, VA, Italy
⁎ Corresponding author.E-mail address: [email protected]
http://dx.doi.org/10.1016/j.rse.2017.02.0120034-4257/© 2017 Published by Elsevier Inc.
a b s t r a c t
a r t i c l e i n f oArticle history:Received 8 August 2016Received in revised form 3 February 2017Accepted 24 February 2017Available online xxxx
Sun-induced fluorescence (SIF) has been proven to serve as a proxy of photosynthesis activity and therefore, asan early indicator of physiological alterations for global monitoring of vegetation. However, the interpretation ofSIF over different spatial resolutions is critical to bridge the existing gap between local and global scales. Thisstudy provides insight into the influence of scene components, and forest structure and composition on the quan-tification of the red and far-red fluorescence signal as an early indicator of forest decline. The experiments wereconducted over an oak forest (Quercus ilex) affected by water stress and Phytophthora infection in the southwestof Spain. SIF retrievals through the Fraunhofer Line Depth (FLD) principlewith three spectral bands F (FLD3)wasassessed using high resolution (60 cm) hyperspectral imagery extracting sunlit crown, full crown and aggregatedpixels. Results showed the link between F (FLD3) extracted from sunlit crown pixels and the tree physiologicalcondition in this context of disease infection, yielding significant relationships (r2 = 0.57, p b 0.01) for middayxylem water potential (ψ), (r2 = 0.63, p b 0.001) for the de-epoxidation state of the xanthophyll cycle (DEPS),and (r2 = 0.74, p b 0.001) for leaf-level measurements of steady-state fluorescence yield (Fs). In contrast, apoor relationship was obtained when using aggregated pixels at 30 m spatial resolution, where the relationshipbetween the image-based F (FLD3) and Fs yielded a non-significant relationship (r2 = 0.25, p N 0.05). These re-sults demonstrate the need for methods to accurately retrieve crown SIF from aggregated pixels in heteroge-neous forest canopies with large physiological variability among individual trees. This aspect is critical wherestructural canopy variations and the direct influence of background and shadows affect the SIF amplitudemasking the natural variations caused by physiological condition. FluorFLIGHT, a modified version of the threedimensional (3-D) radiative transfer model FLIGHTwas developed for this work, enabling the simulation of can-opy radiance and reflectance including fluorescence at different spatial resolutions, such as may be derived fromproposed satellite missions such as FLEX, and accounting for canopy structure and varying percentage cover. The3-Dmodelling approach proposed here significantly improved the relationship between Fs and F (FLD3) extract-ed from aggregated pixels (r2= 0.70, p b 0.001), performing better thanwhen aggregation effects were not con-sidered (r2 = 0.42, p b 0.01). The FluorFLIGHT model used in this study improved the retrieval of SIF fromaggregated pixels as a function of fractional cover, Leaf Area Index and chlorophyll content yielding significantrelationships between Fs ground-data measurements and fluorescence quantum yield estimated withFluorFLIGHT at p b 0.01 (r2 = 0.79). The methodology presented here using FluorFLIGHT also demonstrated itscapabilities for mapping SIF at the tree level for single tree assessment of forest physiological condition in thecontext of early disease detection.
© 2017 Published by Elsevier Inc.
Keywords:FluorescenceStress detectionHyperspectralSIFRTMForest diebackOak forestPhytophthora infection
1. Introduction
Spatial and temporal estimation of photosynthesis of forest ecosys-tems can provide advance information on plant performance and forest
(R. Hernández-Clemente).
dynamics in a given environment. Sun-induced chlorophyll fluores-cence (SIF) has been extensively tested as a proxy of fundamental pro-cesses of plant physiology to understand the photosynthetic activity ofplants and the stress development affecting photochemistry (Dammet al., 2014; Krause andWeis, 1984; Zarco-Tejada et al., 2013a). Currentresearch efforts to monitor photosynthetic activity show a growing in-terest in remote sensing of the SIF signal due to its potential to be
166 R. Hernández-Clemente et al. / Remote Sensing of Environment 193 (2017) 165–179
measured at both local (high resolution images) and global scales (me-dium and low resolution images) being a direct proxy of photosynthe-sis. The first global maps of SIF were published (Frankenberg et al.,2011; Joiner et al., 2014) using the TANSO sensor on board GOSAT(Kuze et al., 2009) allowing qualitative assessments with annual andseasonal vegetation patterns (Guanter et al., 2012). The spatial resolu-tion provided by this sensor (10.5 km) is not, however, sufficient forthe understanding of the retrieved SIF in heterogeneous vegetation can-opies due to the aggregation of scene components and the large effectscaused by background and shadows (Zarco-Tejada et al., 2013b). Thefast development of new hyperspectral sensors to be carried on boardmanned and unmanned airborne platforms has given rise to the retriev-al of high spatial resolution SIF at local scales, which is becoming a novelarea of research (Dammet al., 2015; Zarco-Tejada et al., 2013c). Howev-er it remains very challenging to cover at very high resolution the largeareas required for forest monitoring analysis. This has hitherto been themain limitation in studying physiological condition of forest canopieswith higher detail, as currently available satellite sensors are limitedby their spatial and spectral resolution for SIF retrieval purposes. To ad-dress this gap, the ESA's Earth Explorer Mission of the ‘Fluorescence Ex-plorer’ (FLEX) (Kraft et al., 2012), the first mission designed to observethe photosynthetic activity of the vegetation layer has been recently ap-proved, with 2022 as the tentative launch date. This mission will makepossible, for the first time, the assessment of the dynamics of photosyn-thesis on forest canopies through SIF at 300 m spatial resolution, andwith potential to distinguish different fluorescence signals from PSIand PSII (Rossini et al., 2015). This offers a great advantage over currenttechniques used for photosynthesis monitoring based on structural in-dices (e.g. the Normalized Difference Vegetation Index (NDVI)) ac-quired from conventional Earth-resource satellites.
The chlorophyll fluorescence signal derived from global maps is af-fected by illumination effects, leaf and canopy structure and composi-tion of vegetation, and soil/background though to a lesser extent thanreflectance. The interplay of within-leaf scattering properties of leafstructure and biochemical constituents are known to affect the bidirec-tional chlorophyll fluorescence emission (Van Wittenberghe et al.,2015, 2014; Verrelst et al., 2015). SIF flux through a leaf, upward anddownward leaf chlorophyll fluorescence emissions and scattering ef-fects have been thoroughly studied using radiative transfer models(RTMs) (Miller, 2005). However, few fluorescence models have beendeveloped at the leaf level and even fewer are available at the canopylevel, especially for the case of heterogeneous and complex canopies.The first attempts were carried as part of a vegetation fluorescence can-opy model developed in the framework of the ESTEC ESA project(16365/02/NL/FF). The FluorMODleaf (Pedrós et al., 2008) andFluorSAIL (Verhoef, 2004) leaf and canopy fluorescence models weredevelopedwithin the same project. FluorMODleaf is based on thewide-ly used and validated PROSPECT leaf optical properties model and re-quires inputs from PROSPECT-5 plus the σII/σI ratio referring to therelative absorption cross-sections of PSI and PSII, as well as the fluores-cence quantum efficiency of PSI and PSII, represented by the corre-sponding mean fluorescence lifetimes τI and τII. The canopy model isbased on the turbid medium SAIL model (FluorSAIL) coupled withFluorMODleaf andMODTRAN to provide the illumination levels throughthe canopy. The Soil Canopy Observation, Photochemistry and Energyfluxes (SCOPE) model recently developed by van der Tol et al. (2009)as a means of jointly simulating directional Top of Canopy (TOC)reflected solar radiation, emitted thermal radiation and SIF signals aswell as energy balance, water and CO2 fluxes, enables vertical (1-D)modelling of integrated radiative transfer and energy balance by com-bining a number of intra-canopy radiative, turbulent and mass-transfermodels, bearing inmind various processes involved in leaf biochemistry(Duffour et al., 2015). Using retrievals of SIF simulated with SCOPE,Verrelst et al. (2015) demonstrated that the main variables affectingSIF signal were determined by leaf optical properties and canopy struc-tural variables with a contribution of 77.9% of the SIF total variability.
Canopy re-absorption and scattering effects must be better understoodand quantified. Consequently, it is very important to make progress oncanopy-scale modelling approaches providing an explicit connectionbetween the canopy biophysical processes, view and illumination ge-ometry and the resulting canopy fluorescence signal. In light of theabove, Zarco-Tejada et al. (2013b) demonstrated the need for RTMmethods to accurately retrieve vegetation fluorescence signal from veg-etation-soil/background aggregated pixels. Due to the lack of complexmodels to simulate SIF in heterogeneous canopies, Zarco-Tejada andco-authors conducted the study using a leaf-canopy fluorescencemodel (FluorMODleaf) combined with a geometric model to accountfor canopy heterogeneity (FluorSAIL) and a first-order approximationforest model (FLIM) of stand reflectance to account the effects ofcrown transparency and shadowingon apparent reflectance. The resultsdemonstrated the large structural effects on the fluorescence retrievalfrom mixed pixels, and therefore the need to develop more complexmodels to account for the effect caused by the canopy architecture.
This aspect becomes particularly important in the assessment ofcomplex forest canopies characterised by high horizontal and verticalheterogeneity (Widlowski et al., 2015). Unfortunately, currently avail-able fluorescence models are only valid on homogeneous and uniformcanopies. Strategies to simulate the spectral signature in heterogeneousforest canopies have been limited by difficulties in simulating canopystructure such as Leaf Area Index (LAI), tree density, fractional cover(FC), crown overlapping or mutual shading and multiple scattering be-tween crowns. This paper aims to fill these gaps and in doing so to as-sess the potential of chlorophyll fluorescence signal retrieval as anearly indicator of forest decline. The novel approach consists of couplingthe leaf optical model FLUSPECT (Vilfana et al., 2016) and the three-di-mensional (3-D) ray-tracing model FLIGHT developed by North (1996)to carry the scaling up approach from leaf to canopy dealing with mul-tiple canopy components. In particular, the study aims at assessing: i)SIF as an early indicator of forest health in a heterogeneous oak forestcanopy (Quercus ilex) affected by water stress and Phytophthora infec-tion using very high resolution airborne hyperspectral imagery, ii) thecanopy structure effects on the retrieval of SIF in forest canopies usinga 3-D RTM, and iii) the retrieval of SIF through model inversion usingcoarse-spatial resolution hyperspectral imagery.
2. Materials and methods
The methods used for the assessment of SIF from hyperspectral im-agery for the early detection of forest decline condition are describedbelow, outlining field and airborne data collection, as well as the ap-proach using the 3-D RTM FLIGHT adapted to account for fluorescence(FluorFLIGHT). In both cases, SIF was retrieved within the far-redregion.
2.1. Field data collection
The experimental area is located in Puebla deGuzmán (Huelva prov-ince, in southwestern Spain) (Lat 37°36′30.89″N, Lon 7°20′27.97″W)(Fig. 1). The topography is slightly hilly, with acidic and poor soils. Theannual rainfall is around 490 mmwith an annual average temperatureof 18.1 °C, reaching an annual average of 32 °C during summer and anannual average of 12.7 °C during winter. The vegetation is mainly com-posed of mature trees of the species Quercus ilex subsp. Bellota with anaverage density of 60 trees per ha (Roig Gómez et al., 2007). Since the1990s, trees have shown symptoms of decline, leading to highmortalityrates from the 2000s (Maurel et al., 2001). This region is particularlyvulnerable because of the combined effect of water deficiency, soil com-paction, nutrient losses, water erosion and the widespread distributionof soil-borne pathogen (Pytophthora cinnamomi and Pythiumspiculum)(Moralejo et al., 2009).
The field data measurements were conducted in 15 oak trees(Quercus ilex subsp. Bellota) with similar height and age located in low

Fig. 1.Airborne hyperspectralflight line acquiredwith themicro-hyperspectral imager yielding 60 cm resolution (a), oak forest study site and tree crowns selected for the quantification ofSIF (b), high resolution spectral reflectance extracted from sunlit and shadowed crown and soil components (c).
Table 1Ground truth data collected and optical measurements.
Variable Symbol Units
Biochemical constituents & physiological variablesChlorophyll content Ca + b μg/cm2
Carotenoid content Cx + c μg/cm2
Water content Cw mg/cm2
Dry matter Cm mg/cm2
Xanthophyll cycle DEPS Arbitrary unitsSteady State Fluorescence Fs Arbitrary unitsWater potential ψ mpa
Optical measurementsLeaf reflectance ρ %Leaf transmittance τ %Solar irradiance Io
wm−2 sr−1 nm−1
Forest canopy structureDensity D trees/haTrunk diameter Øt mTree height H mCrown diameter Øc mCrown height Hc mLeaf Area Index LAI m2/m2
167R. Hernández-Clemente et al. / Remote Sensing of Environment 193 (2017) 165–179
slope areas (b10%). The location of these trees was previously associat-ed with the pathogenicity of P. cinmaomi (Ferraz et al., 2000) and heat-induced tree die-off processes (Natalini et al., 2016). The trees were se-lected to ensure a gradient in health condition based on the physiolog-ical variables: de-epoxidation of the xanthophyll cycle (DEPS), middayxylem water potential (ψ) and steady-state fluorescence yield (Fs).Three different forest physiological conditions (FPC-1,2,3) wereestablished based on these variables, where FPC1 correspond with thehealthier and more vigorous trees, FPC2 with moderated affectedtrees, and FPC3 with declining trees. In order to determine whetherFPCs differed significantly in terms of DEPS, ψ and Fs, a one-wayANOVA was performed at a 0.05 significance level. Findings indicatedsignificant differences in physiological status for each FPC (p b 0.05). Asimilar procedure was used by Hernández-Clemente et al. (2011) toestablished physiological condition levels in a conifer forest affectedby water stress.
A summaryof thevariablesmeasured in thefield is included in Table 1.Physiological measurements were carried out concurrently with theairborne measurements (12:00 to 13:00 h local time) during three con-secutive days (25–28 August in 2012). ψ was measured with a pressurechamber (SKPM 1400, Skye Instruments Ltd., Powys, UK) (Scholander etal., 1965) from 12 branches per tree, three branches per orientation inthe four cardinal directions. Fswasmeasured onfive leaves per orientationand tree, with a total of 300 leaves sampled. Leaf fluorescence was mea-sured using a FluorPen FP100 (Photon Systems Instruments, Brno, CzechRepublic), which was self-calibrated at the start of each session. Althoughmeasurements made with the FluorPen FP100 differed from airborne SIFretrievals, leaf data served as a field-level assessment of variability instress conditions (Zarco-Tejada et al., 2016).
Leaf biochemical constituents measured from the selected treeswere total chlorophyll (Ca + b) (chlorophyll a (Ca) and chlorophyll b(Cb)), total carotenoids (Cx + c) and xanthophyll pigments, and leafwater content (Cw) and dry mass (Cs). Leaf-level measurements werecollected on a total of 48 leaves per tree, 12 samples per orientation,
with a total of 720 leaves sampled. The samples were collected fromthe top of the crownby selecting branches of illuminated areas. Leaf pig-ments were processed and extracted as reported by Hernández-Clemente et al. (2011). The DEPS was calculated as(A + Z) / (A + V + Z) (Thayer and Björkman, 1990), where V isviolaxanthin, A is antheraxanthin and Z is zeaxanthin.
Opticalmeasurementswere taken on leaves from the samebranchesand trees used for pigment quantification. Leaf reflectance (ρ) andtransmittance (τ) were measured with a Li-Cor 1800-12 integratingsphere (Li-Cor, Lincoln, NE, USA) coupled to a fiber optic spectrometer(Ocean Optics model USB2000 spectrometer, Ocean Optics, Dunedin,FL, USA), with a 1024-element detector array, 0.5 nm sampling interval,

Fig. 2. Example of a 30 × 30 m scene (highlighted squared) of the micro-hyperspectralimagery acquired at 40 cm resolution in color-infrared (a) and sunlit and shadowedcomponent identification of the crown on the micro-hyperspectral imagery (b).Example of a 30 × 30 m scene (highlighted squared) simulated with FluorFLIGHT (c)and sunlit and shadowed component identification on simulated images (d). (Forinterpretation of the references to color in this figure legend, the reader is referred tothe web version of this article.)
168 R. Hernández-Clemente et al. / Remote Sensing of Environment 193 (2017) 165–179
and 7.5 nm spectral resolution in the 340–940 nm range using themethod described in Zarco-Tejada et al. (2005).
In February 2013, the study areawas inventoried recording themainstructural variables of the canopy. A total of 200 trees were measuredrecoding the trunk diameter at 1.3 m, tree height, crown diameter,tree density, FC and height. Additionally, LAI values were taken from asubsample of 15 trees of this data set. A detailed description of themea-surement procedure can be found in Hernández-Clemente et al. (2014).
2.2. Airborne image acquisitions
The airborne campaign was conducted with a hyperspectral sensorinstalled on an aircraft (CESSNA C172S EC-JYN) operated by the Labora-tory for ResearchMethods inQuantitative Remote Sensing (QuantaLab),Consejo Superior de Investigaciones Científicas (IAS-CSIC, Spain) at650–700 m above ground level (AGL) and 2800 ft. above the sea level(ASL). The imageswere acquired concurrentwithfield data acquisitionson 28 August 2012 between 11:30 and 13:00, local time.
The images were collected with a visible and near-infrared (VNIR)micro-hyperspectral imager (Micro-Hyperspec VNIR model, HeadwallPhotonics, MA, USA). The sensor was configured in the spectral modeof 260 bands at 1.85 nm/pixel and 12-bit radiometric resolution and ra-diometrically calibrated as described in Zarco-Tejada et al. (2013c). Thehyperspectral sensor flown on board a manned platform yielding a6.4 nm full-width at half-maximum (FWHM) with a 25-micron slit inthe 400–885 nm region and 60 cm pixel size (Fig. 1). Data acquisitionand storage module achieved a 50 fps (frames per second) with 18-ms integration time. The 8-mm optical focal length lens yielded an in-stantaneous field of view (IFOV) of 0.93 mrad and an angular field ofview (FOV) of 49.82°. Radiance values were converted to reflectanceusing total incoming irradiance measured at the time of image acquisi-tion. Field measurements were taken with an ASD Field Spectrometer(FieldSpec Handheld Pro, ASD Inc., CO, USA) with a cosine corrector-diffuser probe for the 350–1050 nm spectral range at lower resolution(3 nm FWHM). The ASD Field Spectrometer was first calibrated usinga Spectralon (SRT-99-180, Labsphere, NH, USA) white panel. ASD mea-surementswere resampled to 6.5 nmbyGaussian convolution tomatchthe irradiance spectra to the spectral resolution of the radiance imageryacquired by the hyperspectral airborne sensor.
The high resolution hyperspectral imagery (Fig. 1a) acquired overthe oak forest (Fig. 1b) enabled the identification of different scene com-ponents (Fig. 1c) for field validation purposes. The fluorescence signalwas quantified using the 760-nm O2-A in-filling method based on theFraunhofer line depth (FLD) calculated from a total of three bands(FLD3):
F ¼ Eout � Lin−EinLoutEout−Ein
ð1Þ
where radiance, L, corresponds to Lin (L761), Lout (average of L747 andL780 bands), and the irradiance, E, to Ein (E761), and Eout (average ofE747 and E780 bands).
Other vegetation indices mostly related with physiology such as thePhotochemical Reflectance Index (PRI) (Gamon et al., 1992) and theRed Edge ratio index (RE) (Zarco-Tejada et al., 2001) and with canopystructure such as the NDVI (Rouse et al., 1974) were also tested in thisstudy.
The hyperspectral imagery acquired enabled full crown pixelsidentification (Fig. 2a) and shaded and sunlit components within eachcrown (Fig. 2b). Thus, in order to assess the implications of scene com-ponents on the SIF signalwhen quantified in large pixels, FLDwas quan-tified from three different strategies of aggregation (Fig. 2): from onlysunlit pixels within each crown, all pixels from each tree crown (fullcrown pixels, including shaded and sunlit pixels) and from aggregatedpixels at 30 × 30 m (including tree crown, bare soil and shadows).
2.3. FluorFLIGHT model
FluorFLIGHT is a 3-D integrated RTM to calculate reflectance andfluorescence in the observation direction as a function of canopy com-ponents. It is based on existing theory of radiative transfer by couplingthe leaf fluorescence model FLUSPECT and the 3-D ray-tracing modelFLIGHT to account for canopy heterogeneity. The FluorFLIGHT modelwas specifically developed to assess the sensitivity of the fluorescencesignal on heterogeneous forest canopy images.
FLUSPECTmodel is based on the Kubelka-Munk equation and requiresa total of 7 inputs included in Table 2. Six of them are original parametersfrom the PROSPECT model (Feret et al., 2008; Jacquemoud and Baret,1990), i.e., leaf structure parameterN, chlorophyll a+b(Ca+ b) and carot-enoid (Cc + x) content, water equivalent thickness in cm (Cw), dry mattercontent (Cm) and the senescence material (Cs). An additional parameter,the fluorescence quantum efficiency (Fi), from 0 (no fluorescence) to 0.1(10% fluorescence), is required to calculate the excitation-fluorescencematrix for each photosystem (PSI and PSII). For this study, the Fi of PSIwas fixed at one-fifth that of PSII, as the total spectrally integrated fluxof PSII has been reported to be typically fivefold that of PSI (Franck et al.,2002). The FLUSPECT model generates two excitation-emission fluores-cencematrices (EEFM) from640 to 850 nmat 1 nm resolution and the re-flectance and transmittance spectra of a leaf from 400 to 850 nm at 1 nmresolution. TheEEFMmatrices are separately generated for eachphotosys-tem for both sides of the leaf -the illuminated and the shaded side of theleaf-, backward and forward scattering matrices, respectively.
The FLIGHT model is based on Monte Carlo and deterministicray tracing techniques to simulate the observed reflectance responseof 3-D vegetation canopies (North, 1996; North et al., 2010). Multiplescattering within crown boundaries and between the crowns andother canopy components is modelled to account for canopy heteroge-neity. It has formed one of a set of six benchmark models for RTM eval-uation under the RTM Intercomparison (RAMI) project (Widlowski etal., 2008, 2007). Structural data may be specified as a statistical

Table 2Nominal values and range of variation used in FluorFLIGHT simulation analysis based onfield data measurements.
Variable Variablecode
Nominal values Range
FLUSPECTMesophyll structure N 2.1 –Chlorophyll content Ca + b
(μg/cm2)35 10–60
Carotenoid content Cx + c
(μg/cm2)12 5–20
Water content Cw(mg/cm2)
0.013 –
Dry matter Cdm
(mg/cm2)0.024 –
Senescent material Cs 0 0Fluorescence quantumefficiency
Fi 0.04 0–0.1
FLIGHTSolar zenith, view zenith (°) θs, θv 31.3, 0.0 –Solar azimuth, viewazimuth (°)
Φs, Φv 30.44, 0.0 –
Total LAI 3.15 0–3Leaf angle distribution LAD[1–9] 0.015, 0.045, 0.074, 0.1,0.123,
0.143, 0.158,0.168, 0.174Fractional cover (%) FC 70 0–100Crowns shape CSh EllipsoidCrown coordinates, radius,and centre to top distance
Xi, Yi, Exy,Ez (m)
6.0, 5.0
Minimum and Maximumheight to first branch (m)
Hmin,Hmax
4.0, 10.0
Density (trees/ha) D 60 8–400Soil reflectance ρλsoil ASD measurementsSoil roughness Θsoil 0Solar irradiance ρλs ASD measurements
169R. Hernández-Clemente et al. / Remote Sensing of Environment 193 (2017) 165–179
distribution, derived from field measurements or by direct inversionfrom lidar data (Bye et al., 2017). FLIGHT calculates directional reflec-tance by accumulating photon energy in the observation direction as afunction of different forest canopy components defining the canopystructure (crown shape and size, tree height, position, density and dis-tribution) (Table 2). The distribution and absorption of lightintercepting the canopy was calculated with a modified version ofFLIGHT including the EEFM contribution to radiance.
In addition, the canopy model requires a soil spectrum, solar irradi-ance (inputs from Table 2) and the six outputs obtained from the leafmodel: leaf reflectance without fluorescence (ρn), leaf transmittancewithout fluorescence (τn), and the backward and forward fluorescencematrices for each photosystem (MbI, MbII, MfI, MfII).
Within FLIGHT, illumination at a facet such as a leaf is calculated asthe sum of direct and diffuse incoming light. For a facet L with normalvectorΩL, viewed from vector directionΩm and illuminated from vectordirection Ω0, the surface-leaving radiance contribution to the detectorexcluding fluorescence is defined according to the equation:
IL λð Þ ¼ I0 λð ÞγL Ω0→Ωð ÞP0 þ 1m
∑m1 Im λð Þ Ωmð ÞγL Ωm→Ωð Þ ð2Þ
where I0 is the direct solar beam illumination radiance at wavelength λ,and Im denotes a sample of the incoming diffuse field from directionΩm,andγL is the bi-directional reflectance or transmittance factor for facet L.P0 has value 1 if there is a direct path to the source illumination, and 0otherwise.
The non-fluorescent scattering contribution for an individual facet Lat wavelength λ is approximated here using a bi-Lambertian reflec-tance/transmittance model:
γL ΩL;Ω0→Ω� �
¼ π−1ρn λð Þ Ω �ΩLj j; if Ω �ΩLð Þ Ω0 �ΩL� �
b0π−1τn λð Þ Ω �ΩLj j; if Ω �ΩLð Þ Ω0 �ΩL
� �N0
( )ð3Þ
The fluorescence contribution FL is calculated using similarequations, but using the full fluorescent scattering matrices at leaflevel, sampling direct and diffuse leaf-level incident illumination withinthe excitation range 400–750 nm:
FL λð Þ¼ ∑750
k¼400 I0 kð Þγ F Ω0→Ωð ÞP0 þ 1m
∑m1 Im kð Þ Ωmð Þγ F Ωm→Ωð Þ
� � ð4Þ
where
γ F ΩL;Ω0→Ω� �
¼ π−1Mb k;λ½ � Ω �ΩLj j; if Ω �ΩLð Þ Ω0 �ΩL� �
b0π−1Mf k;λ½ � Ω �ΩLj j; if Ω �ΩLð Þ Ω0 �ΩL
� �N0
( )ð5Þ
where Mb is the sum of backward scattering matrices for PSI and PSIIcontributions, and Mf for forward scattering. Total measured radianceis calculated as the sum of the reflected light and fluorescent emissionterms. The full evaluation of the fluorescence scattering matrices ateach photon interaction at leaf level allows inclusion of fluorescentemission in TOC spectra, accounting for 3-D structure, multiple scatter-ing, and leaf-level light environment. Furthermore, the simulated reflec-tance at the canopy level accounts for crown overlapping, mutualshading, and multiple scattering among crowns. Sunlit and shadowedpixels of the crown are identified based on the scene componentsmask derived from the FluorFLIGHT model simulations (Fig. 2c, d).This makes it possible to understand the contribution of each compo-nent at different resolutions, particularly important for sensors acquir-ing data with lower spatial resolutions and therefore, with higheraggregation effects (Fig. 3). As an example, thefluorescence peak exper-imentally observed in canopy reflectance and simulated withFluorFLIGHT can be shown in (Fig. 3a, b).
The model is originally developed at 1 nm FWHM. Nevertheless, forcomparisons against the airborne hyperspectral imagery, the modelsimulations are convolved to 6.5 nm FWHM to match the spectral reso-lution of the radiance imagery acquired by the hyperspectral airbornesensor. If no convolution is carried, the FWHM of the 1 nm (model) vs6.5 nm (image) would derive different levels of fluorescence emission.Accounting for the bandwidth of the imagery enables the comparisonbetween the fluorescence retrieved from the model and the one re-trieved from the image at the tree crown level.
2.4. Model simulation approach
The coupled 3-D fluorescence model FluorFLIGHT was used in thisstudy with two primary objectives: i) the analysis of forest structureeffects on SIF retrievals, and ii) the estimation of SIF for detecting foreststress from coarse-spatial-resolution imagery by Look-Up Table (LUT-based) model inversion to account for the canopy architecture.
i) Modelling forest canopy structural effects on fluorescence signal.ii) Fluorescence retrieval with FluorFLIGHT and hyperspectral data for
detecting forest stress.
FluorFLIGHTwas used to analyse the variation of SIF as a function offorest structural components. The aim of this analysis was to assess theinfluence of scene components on the retrieval of the chlorophyllfluorescence signal by identifying the key variables determining SIFvariations at different scales. To do this, SIF was quantified using the760-nm O2-A in-filling method (FLD3) from FluorFLIGHT simulateddata from three different strategies of aggregation (Fig. 2): from onlysunlit pixels within each crown, all pixels from each tree crown andfrom aggregated pixels at 30 × 30 m (including tree crown, bare soiland shadows). This selection was based on the SIF variations foundover different levels of aggregation in both, imagery and simulatedspectra (Fig. 4). Fig. 4 shows the variation in SIF extracted from the

Fig. 3. Example of the spectral radiance extracted from themicro-hyperspectral image (a) and from FluorFLIGHT simulated radiance (L) (b) for different scene components: sunlit crown,full crown, sunlit soil, shadowed soil and aggregated pixels (30 × 30 m) in the O2-A feature used for fluorescence quantification. Spectral features extracted from Fig. 2.
170 R. Hernández-Clemente et al. / Remote Sensing of Environment 193 (2017) 165–179
original high-resolution airborne hyperspectral image (Fig. 4c) andfroma FluorFLIGHT image (Fig. 4d) as a result of increasing the pixel-ag-gregation level from sunlit crown pixels to aggregated pixels of100 × 100 m window.
FluorFLIGHT simulations were calculated for a set of leaf fluores-cence quantum efficiency (Fi) values and forest structure scenarios.Leaffluorescence signalwas simulatedwith a varied range of Fi between0 and 0.1. To cover the full range of canopy structural scenarios, a variedrange of LAI (0–4), FC (0–100%) and density (10–200 trees/ha) wereused to simulate the spectral response at the crown level (Fig. 5a) andat the aggregated canopy level (Fig. 5b).
The potential of using FluorFLIGHT to predict SIF from spatially ag-gregated pixels in a heterogeneous oak forest was analysed. For thispurpose, FluorFLIGHT was used in a multi-step LUT-based inversionscheme (Fig. 6) to retrieve full crown SIF from a complex scene account-ing for the influence of scene structure and composition. The estimationof vegetation fluorescence emissionswas assessed from a spatial aggre-gation of 30 × 30 m, which included variations in crown coverage andshadows and sunlit proportions. The lack of complex RTMs to simulateSIF in heterogeneous canopies (Zarco-Tejada et al., 2013b) hasconstrained the progress on the fluorescence interpretation in forestcanopies. As shown in Fig. 6, SIF was quantified by inversion based onthe FLD3 estimated from the airborne image using the LUT derivedfrom FluorFLIGHT. As a prior step, an optimal parameter combinationof N, LAI, Ca + b, and FC was iteratively retrieved. Lastly, SIF retrievalswere then validated based on ground measurements of the physiologi-cal variables related with the photosynthetic activity of the vegetationsuch as DEPS, ψ, and Fs.
The detailed description of the inversion process shown in Fig. 6 isdetailed below.
Step 1. N determination by minimizing the merit function (ΔI):
ΔI2 ¼ ∑n ρm λið Þ−ρ� λi;Nð Þð Þ2 þ τm λið Þ−τ� λi;Nð Þð Þ2
h ið6Þ
where ρm(λi), τm(λi) are the leaf reflectance and transmittance at
wavelength λ measured from the field, and ρ∗and τ∗denote themodelled ones. A synthetic spectra database was simulated withFLUSPECT producing 1000 simulations with a set of N random values(1–4). Input parameterswere set up to simulate the typical range of var-iation observed in the field Table 2.
Step 2. Green FC determination by minimizing the merit function(ΔII):
For this purpose, FluorFLIGHTwas used for retrieving an optimal setof vegetation parameters (FC, LAI and Ca + b) using a LUT-based inver-sion scheme using aggregated pixels of 30 × 30 m.
ΔII2 ¼ ∑n vim−vi� Θð Þ½ �2 ð7Þ
where vim is the vegetation index used for the retrieval of each param-eter calculated from measured canopy reflectance and vi∗(Θ) and frommodelled canopy reflectance for a given set of input parameters Θ. FCand LAI were retrieved using theNDVI (Rouse et al., 1974);mean valuesof the range of possible solutions within the LUT were used since thereis ambiguity between FC and LAI corresponding to a givenVI valuewith-out additional constraints on allowable structure. Ca + b was retrievedusing the RE (Zarco-Tejada et al., 2001) that showed robustness to shad-owand structural effects in forest canopies. A synthetic spectra databasewas simulated with FluorFLIGHT producing 1000 simulations. Leafinput parameters were set up to simulate the typical range of variationobserved in the field (Ca + b = 10–80 μg/cm2; Cx + c = 2–18 μg/cm2;Cw = 0.02; Cdm = 0.01). Leaf level spectra were simulated using N =2.1 as derived from inversions of leaf-level optical measurements offield samples estimated above (Step 1). Leaf fluorescence signal wassimulatedwith a varied range of Fi ranging between 0 and 0.1. The nom-inal inputs used at the leaf level are shown in Table 2.
At the canopy level, forest structure attributes such as tree height,crown diameter and LAI were randomly varied for different oak-forestcover structures to generate a range of FC between (0–100%). Table 2shows the input parameters required by the model and the nominalvariation range for the parameters used for canopy modelling withFluorFLIGHT. The spectral sampling of the simulations was initially

Fig. 4. Subplots emulating the aggregation effects due to the spatial resolution overlaid onto themicro-hyperspectral imagery acquired at 60 cm resolution (a) and a FluorFLIGHT simulatedimage (b), both in color-infrared. F (FLD3) variation based on the hyperspectral image (c) and the simulated image (d) estimated from: sunlit pixels of the crown (SL crown), shadowedpixels of the crown (SW crown), full crown pixels (crown = SL + SW) and eighteen aggregated pixels from a 5 × 5 m window to a 100 × 100 m window. (For interpretation of thereferences to color in this figure legend, the reader is referred to the web version of this article.)
Fig. 5. Simulated canopy radiance including the effects of fluorescence using the FluorFLIGHTmodel for a varied range of Leaf Area Index (LAI) (0.5–4.5) (a) and fractional cover (FC) (15–65%) (b). Fluorescence quantum yield efficiency at photosystem level (Fi = 0.06). All other input parameters of the model were set using nominal values included in Table 1.
171R. Hernández-Clemente et al. / Remote Sensing of Environment 193 (2017) 165–179

Fig. 6. Overview of the processing steps followed in the retrieval of sun-induced fluorescence (SIF) showing the input variables used for the simulations. Inputs description included inTable 1.
Table 3Correlation coefficient R between steady-state fluorescence yield (Fs), de-epoxidationstate of the xanthophyll cycle (DEPS) and water potential (ψ) and crown-based spectralvegetation indices, including structural and physiological vegetation indices.
Functional-related indices Fs DEPS ψ
R R2 R R2 R R2
Fluorescence FLD3 0.79 0.62⁎⁎⁎ −0.67 0.44⁎⁎ 0.71 0.5⁎⁎
Photochemicalreflectanceindex
PRI −0.45 0.2 0.65 0.42⁎⁎ −0.51 0.27⁎
Chlorophyll-RE R750/R710 −0.24 0.06 0.13 0.02 −0.22 0.04Structure-NDVI NDVI −0.16 0.02 0.16 0.03 −0.18 0.03
⁎ Non-significant p N 0.05.⁎⁎ Significant p b 0.01.⁎⁎⁎ Highly significant p b 0.001.
172 R. Hernández-Clemente et al. / Remote Sensing of Environment 193 (2017) 165–179
adjusted to 1 nm covering a range for 400 to 1050 nm. Then, simulatedimages were resampled to the spectral bandwidth of the hyperspectralairborne sensor through Gaussian convolution. The inverted values ofFC, LAI and Ca + b were obtained by matching measured and modelledLUT vi through Eq. (7) and finding the optimal parameter combination(Leonenko et al., 2013; Prieto-Blanco et al., 2009) and validated againstFC, LAI and Ca + b field measurements.
Step 3. Fluorescence inversion using the inverted FC, LAI andCa+ b asmulti-constraint regularization.
The simulated spectra with FluorFLIGHT were used here to retrieveSIF using the inverted values of FC, LAI and Ca + b (Step 2) as constraintsin a regularization strategy attending to reduce the influence of struc-tural canopy variables of the fluorescence signal.
ΔIII2 ¼ ∑n Fm FLD3ð Þ−F�ðFLD3;ΘÞ½ �2 ð8Þ
where Fm(FLD3),is the FLD3 calculated from measured canopy radianceand F∗(FLD3,Θ) is the FLD3 calculated from modelled canopy reflectancefor a given set of input parametersΘ. In both cases, radiance spectrawereextracted from 30 × 30 m aggregated pixels (Fig. 6). The inverted valuesof crown FLD3 and leaf Fi were obtained by matching measured andmodelled LUT spectra through Eq. (8) and finding the optimal values.
Finally, model-based retrievals derived from hyperspectral imagerywere compared to ground-truth fluorescence data. Additionally, resultswere also compared to other physiological variables collected on theground.
3. Results
3.1. Relationships between physiological variables and airborne F (FLD3)
The capability of F (FLD) of discriminating different functional statusof the vegetation was analysed and compared to other vegetation
spectral indices (Table 3). The relationships between F (FLD3) quanti-fied from full crown vegetation pixels and different physiological vari-ables (Fs, DEPS, and ψ) were statistically significant (p b 0.01) andstronger than the relationship with other physiological vegetation indi-ces such as PRI or RE. Theweakness relationship foundwas between thephysiological variables and the NDVI, a sensitive indicator of canopystructure.
The high spatial resolution obtained by the hyperspectral imagery(60 cm resolution) enabled the identification of each scene components(Fig. 2), enabling the estimation of F (FLD3) from sunlit crowns pixels.The sunlit-crown F (FLD3) extracted was compared against (DEPS, ψand Fs) measured at the tree-level, yielding (r2 = 0.63; p b 0.001)(Fig. 7a) between sunlit-crown F (FLD3) and ground measured DEPS.Slightly lower relationships were found by comparing F (FLD3) and ψ(r2 = 0.57; p b 0.01) (Fig. 7b). Statistically significant relationshipsbetween sunlit-crown F (FLD3) and DEPS and ψ were consistent withthe relationships obtained between leaf Fs and airborne F (FLD3)

Fig. 7.Relationship between de-epoxidation state of the xanthophyll cycle (DEPS) (a) andwater potential (b) against F (FLD3) from sunlit pixel radiance L retrieved from the hyperspectralimage. Relationships between steady-state fluorescence yield (Fs) ground-data measurements of 15 oak trees and airborne-based F (FLD3) retrieved from sunlit pixel radiance (c) and30 × 30 m aggregated pixels radiance (L) retrieved from the hyperspectral image (d). Trees with higher and lower level of affectation are highlighted within a dashed grey and blackline respectively.
173R. Hernández-Clemente et al. / Remote Sensing of Environment 193 (2017) 165–179
(r2 = 0.74; p b 0.001) (Fig. 7c). These results indicate that SIF retrievedfrom sunlit vegetation radiance of the crowns was a good indicator ofphysiological status of the trees within the context of this study.
It was also observed that healthy trees (FPC1) showed higher Fs andψ and lower DEPS while affected trees (FPC3) showed the opposite,with moderate level of affectation (FPC2) in between. These resultsshowed that sunlit-crown F (FLD3) was also sensitive to the stresslevels, tracking the physiological change forced by forest declineprocesses.
Additionally, the F (FLD3) was calculated from spectra extractedfrom aggregated pixels from a 30 × 30 m window using as centralpoint the location of each tree. The SIF signal retrieved from aggregatedpixels was lower than that extracted from sunlit crown pixels with F(FLD3) values ranged between (1.9–4.9 and 2.5–8) Wm−2 μm−1 sr−1
respectively (Fig. 7c, d). As it is shown in Fig. 7d, the sensitivity to Fsground-data was lower with F (FLD3) retrieved from aggregatedradiance pixels, yielding a (r2 = 0.25; statistically non-significant).These results demonstrates the expected effect caused by the canopyarchitecture on SIF retrieved from mixed pixels, and therefore, theneed of modelling those effects while using coarse-spatial resolutionimages.
3.2. Modelling forest structural effects on SIF at the canopy level
The sensitivity of the fluorescence signal to the variation in canopystructural components based on the relationships between crown SIFand SIF from 30 × 30 m aggregated pixels is presented in Fig. 8. F(FLD3) was retrieved for a range of LAI, tree density and percentage of
FC values showing the influence of scene components on fluorescencesignal from full crowns (Fig. 8a) and aggregated pixels (Fig. 8b).
The sensitivity of SIF to variations in forest canopy structure is higherat lower values of LAI and FC, especiallywith aggregated pixels (Fig. 8b).According to these results, SIF signal variations at the crown and canopylevel can only be directly linked to variations in photosynthetic activitywhen structural parameters remain constant (Fig. 8). Only in this case, F(FLD3) increased as the Fi input parameters increased.
Additionally, FluorFLIGHT simulations were used to develop rela-tionships between sunlit crown pixels, crown pixels and aggregatedpixels as a function of FC and LAI. As shown in Fig. 9, LAI and FC werevaried to generate a range between 1 and 4 and 10–100%, respectively.
The simulated SIFwas calculated using the FLDmethod for the spec-tral radiance extracted from sunlit crowns and then compared to differ-ent components of the scene such as full crown (Fig. 9a) and aggregatedpixels of the scene (Fig. 9b). Modelling results show that the SIF signalretrieved from exposed crown and full crown pixels is higher than foraggregated pixels. The differences are even significant between the SIFsignal retrieved from sunlit pixels and full crown pixels (Fig. 9a) withslightly higher values for exposed crowns. The results of quantifyingSIF from 30 × 30 m aggregated pixels as a function of LAI (Fig.9a) andFC (Fig. 9b) show the large effects of both parameters of the fluores-cence quantification. The contribution of a small percentage of sparsegrass component on the soil reflectance measured from ground mea-surements hindered F (FLD3) to reach values slightly above zero.
Additionally, (Fig. 10) shows the impact on SIF retrieval through theFLD3 method when it is retrieved from different levels of aggregation(sunlit crown pixels, full crown pixels and aggregated pixels) for avaried range of Fi, LAI and FC. Comparing the results obtained for the

Fig. 8. Effects of forest structural variables on simulated canopy fluorescence (FLD3) as a function of LAI (0–5) at the crown level (a) and fractional cover FC (10–90%) at the canopy level(b). All other input parameters of the model were set using nominal values included in Table 1.
174 R. Hernández-Clemente et al. / Remote Sensing of Environment 193 (2017) 165–179
different levels of aggregation, changes in aggregated pixels causedhighest uncertainties in retrieved F (FLD3), followed by full crownpixels and shaded pixels. In contrast, LAI variations exerted a small var-iation in F (FLD3) retrieved from sunlit pixels. The SIF signal retrievedfrom sunlit crowns ranged between 0 and 8Wm−2 μm−1 sr−1, decreas-ing the maximum range with the level of aggregation to 5.2, 3.6 and1 Wm−2 μm−1 sr−1 for full crown, aggregated pixels and shadedcrowns, respectively. Moreover, the SIF signal retrieved from aggregat-ed pixels was less sensitive to Fi variation than the SIF signal retrievedfrom sunlit pixels. SIF signal in shaded crown pixels had minimal sensi-tivity to Fi variations.
FluorFLIGHT model simulations obtained using a random syntheticdata set of values within the typical range of variation observed in thefield (Table 2) are shown in Fig. 11. F (FLD3) calculated from aggregatedradiance pixels wasweakly related to Fi due to the large variability in FCpercentages and LAI within simulations (Fig. 11a). A cross-comparisonof simulation results generated from different levels of aggregationshows that the retrieval offluorescence improved usingfluorescence ra-diance data from full crown pixels (r2= 0.75; p b 0.001) and improvingeven more when sunlit crown pixels were used to calculate SIF (r2 =0.91; p b 0.001) (Fig. 11b, c). This result was caused by the increase ofthe effects of vegetation structure and percentages of soil and shadowsin aggregated pixels. The SIF signal retrieved from sunlit crown pixels isless affected by such effects, increasing its sensitivity to leaffluorescencequantum efficiency.
Fig. 9. Relationships between FluorFLIGHT simulations of canopy L obtained from sunlit crownsimulations of crown L obtained from sunlit crowns and aggregated pixels as a function of FC (
The sensitivity of SIF signal retrieved from sunlit crownswas furtheranalysed to determine the impact of using FWHM spectral resolutionlower than 1 nm. FluorFLIGHT simulations in Fig. 11c, d show the resultsof estimating SIF signal with FLD3 in-filling method against the fluores-cence simulated at 1 nm resolution and 6.5 nm resolution (as a proxy ofthe spectral resolution of the micro-hyperspectral imager used in thisstudy). SIF signal retrieved at 6.5 nm and 1 nmhad relatively similar ac-curacies, yielding r2 = 0.90 (for 6.5 nm data) and r2 = 0.97 (for 1 nmdata).
Therefore, the forest structure and composition were shown to playthemajor role in retrieved SIF due to the confounding effects caused onaggregated pixels, with much less effect caused by the spectralbandwidth.
These modelling results demonstrate the difficulties of interpretingSIF from coarse resolution images where each aggregated pixel includesa large variety of percentages of sunlit and shaded vegetation and soil.The effect of the illumination condition of the crowns corroborates theneed to separate the two crown factions as is shown with high resolu-tion SIF maps (Fig. 12).
Accounting for variations in those percentages, FluorFLIGHT wasthen used to retrieve SIF from 30x30m aggregated pixels. The estima-tion of leaf Fi and crown F (FLD3) through FluorFLIGHTmodel inversionis shown in (Fig. 13).
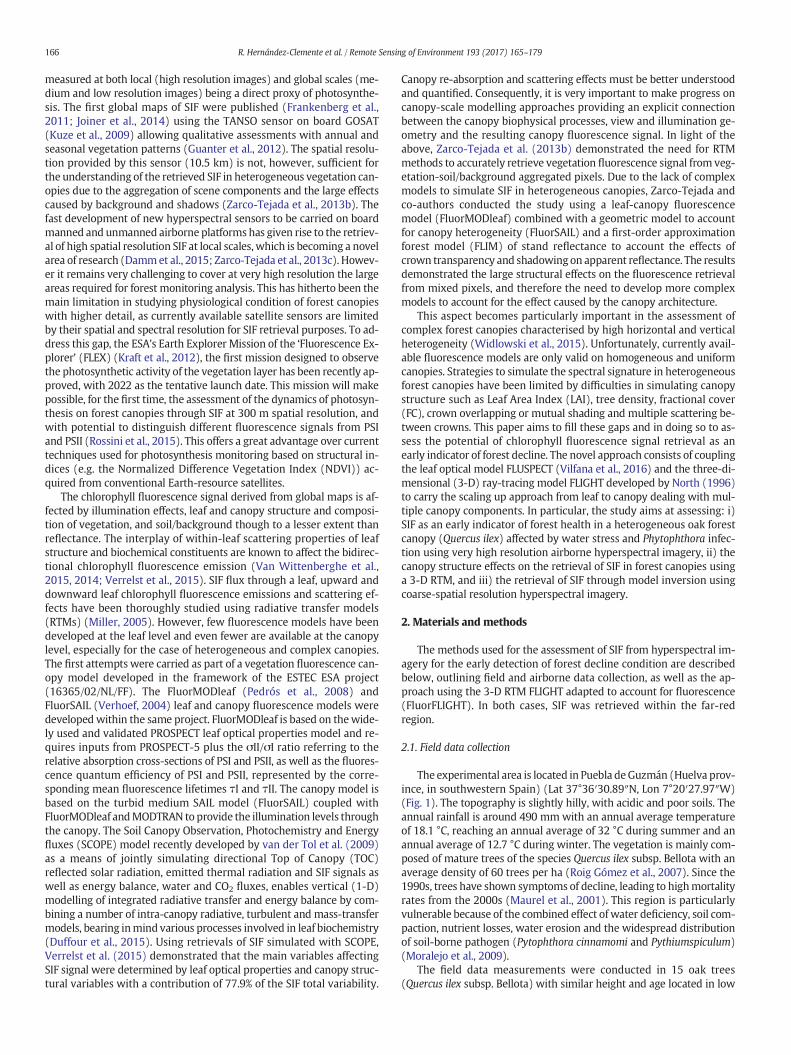
Fig. 13a shows the relationship between Fs ground-data and the SIFsignal retrieved by inversion using FluorFLIGHT through the FLD3
pixels and full crowns as a function of LAI (1–4) (a). Relationships between FluorFLIGHT10–90%) (b).

Fig. 10.Comparison of FluorFLIGHTmodel-basedfluorescence quantumefficiency (Fi) andF (FLD3) retrieved from shaded and sunlit crown pixels, full crown pixels and aggregatedpixels as a function of LAI (0–4) and FC (0–100%).
Fig. 11. Relationships between the simulated FluorFLIGHT fluorescence quantum efficiency ret(a), full crown pixels (b) and sunlit crown pixels at 6.5 nm (c) and at 1 nm (d). LAI (0–4) and FCin Table 1.
175R. Hernández-Clemente et al. / Remote Sensing of Environment 193 (2017) 165–179
method from aggregated pixels (30 × 30m). According to these results,pixel aggregation affected the accuracy in SIF retrieval (r2=0.42)whenpixel aggregationwas not considered. The retrieval accuracy was signif-icantly improved when accounting for the effects of scene componentsand FC (r2 = 0.70). When the Fi was retrieved from FluorFLIGHT ac-counting for the percentage cover within each pixel, the relationshipwith Fs ground-data measurements were significantly related (r2 =0.79, Fig. 13b). These results are consistent with the relationshipfound between Fi and the airborne-based F (FLD3) retrieved fromaggre-gated pixels and sunlit pixels (Fig. 11a, c). Fig.14 shows the outputmapsafter the inversion approach applied at the crown level. The map showsthe spatial variability of fluorescence estimates within the oak forestbased on the F (FLD3) and the Fi inverted from FluorFLIGHT (Fig. 14).The spatial distribution of fluorescence agrees with the spatial patternof Phytophthora infections showing different susceptibility levels fromtrees nearby.
4. Discussion
The consistent relationship between the fluorescence signal SIFretrieved from imagery and physiological variables (see Fig. 7) supportsthe hypothesis that SIF signal is a good indicator of the physiological sta-tus of the trees. Although similar observations have been made within
rieved (FLD3 method) from synthetic spectra retrieved from 30 × 30 m aggregated pixels(40–60%). All other input parameters of themodel were set using nominal values included
Fig. 12. (a) Sunlit and shadowed component identification of the crown on the micro-hyperspectral imagery. (b) SIF map showing different values between sunlit and shaded crown F(FLD3).
176 R. Hernández-Clemente et al. / Remote Sensing of Environment 193 (2017) 165–179
other species e.g., for coastal shrubs (Naumann et al., 2008); forvineyards and orange trees (Zarco-Tejada et al., 2013a and Zarco-Tejada et al., 2016), this is the first attempt showing a consistent rela-tionship between SIF calculated using the FLD3 method from imagepixels and physiological variables such as DEPS, Fs orΨ across differentfunctional forest health conditions (FPC 1, 2 and 3). In this particularcase, SIF was demonstrated to be a good indicator of the susceptibilityof oak species to damage associated with root pathogen on water
Fig. 13. Relationships between Fs ground-data measurements and fluorescence estimationsaggregation (30 × 30 m aggregated pixels) and accounting for pixel aggregation (full cmeasurements and fluorescence quantum yield estimated with FluorFLIGHT (b).
relations. Other physiological vegetation indices such as PRI should bealso further explored and potentially applied in combination with SIF.Stress-induced damage in oaks is related with an increase in Ψ (abso-lute values), an increase in the deposition of xanthophylls and a declinein the chlorophyll fluorescence emission (Fig. 7). These results arepromising because the early detection of the decline in the physiologicalcondition of the trees is essential to successfully control and managethreatened forests.
retrievals using FluorFLIGHT applied to aggregated pixels without accounting for pixelrown pixels) with FluorFLIGHT (a) Leaf level relationship between Fs ground-data

Fig. 14. Fi retrieval at the crown level estimated from the 60-cm hyperspectral image using the fluorescence in-filling method F (FLD3) within the oak forest.
177R. Hernández-Clemente et al. / Remote Sensing of Environment 193 (2017) 165–179
A major benefit of using a 60-cm hyperspectral image is that it en-ables identification of the fluorescence signal emitted by the differentcomponents of the canopy. When comparing the relationship betweenthe ground-based Fs against the SIF extracted from sunlit crown and30× 30maggregated image pixels (r2=0.74 and r2=0.25, respective-ly), we observe a significant decrease in the coefficient of determinationwhen using coarse pixel radiance. The slope of the SIF extracted fromsunlit crowns is greater than for 30 × 30 m aggregated pixels, showingtherefore a greater rate of change, probably increased by the reduced ef-fects of the background in vegetation sunlit pixels. The sensitivity of re-motely measured SIF to pixel aggregations is mainly produced by thenatural variations in canopy structure and chlorophyll concentrationof a heterogeneous canopy (Verrelst et al., 2016; Zarco-Tejada et al.,2013b). The variation in SIF showed changes as a function of the pixelaggregation level with the highest value yielded with aggregated pixelsfrom the sunlit part of the crown. SIF retrieved from aggregated resolu-tions with a higher percentage of shadows (SW crown) and soil yieldedlower values. Beyond a spatial resolution of 25 × 25m, where the num-ber of soil pixels is twice as large as the crown, the aggregation level nolonger exerted any influence on F (FLD3). F (FLD3) derived from simu-lated data and from the hyperspectral image show similar effects: thehighest F (FLD3) values corresponded to sunlit crown pixels, and wereapproximately 25% higher than F (FLD3) extracted from full crownpixels (simulated images) and 32% higher (hyperspectral images).Shaded crowns dramatically reduced the simulated fluorescence,being 66% lower than F (FLD3) values from sunlit crowns. Shadedcrowns had a large effect on the radiance signal derived fromhyperspectral images by reducing up to 47% the F (FLD3) values as com-pared to the sunlit part of the crown. Both, FluorFLIGHT-based F (FLD3)and hyperspectral image-based F (FLD3) were significantly reducedwith the increase in pixel aggregation level. These results demonstratethe difficulty of quantifying the fluorescence signal using aggregatedpixels beyond the crown scale in heterogeneous canopies.
Zarco-Tejada et al. (2013b) investigated the possibility of estimatingfull crown fluorescence from aggregated pixels. Such efforts addressedthe effect of canopy structure of the SIF signal, raising important ques-tions about the need to develop new models to simulate SIF from het-erogeneous canopies. The main limitation of their study was the use ofthe coupled FluorMODleaf + FluorSAIL accounting for the geometrythrough FLIM, which did not take into account scene componentssuch as crown overlapping or illumination conditionswithin the canopyin the simulations. The FluorFLIGHT model used in this study is a 3-DRTM that allowed the study of the effects caused by the canopy struc-ture, including sunlit and shaded proportions of the crowns and back-ground effects on the retrieval of fluorescence signal from mixedpixels. The experimental and modelling results demonstrated that theestimation of SIF from sunlit crown pixel radiance is a critical issue af-fecting the estimation accuracy as the mixture with shaded and back-ground pixels increases.
In order to provide a proper interpretation of SIF signal retrieved atglobal scales it is crucial to decouple the fluorescence signal producedby the photosynthetic activity and the confounding effects producedby the canopy structure and multiple scattering (Damm et al., 2014;Verrelst et al., 2015). The FluorFLIGHT simulation analysis presentedhere suggests that the canopy structure and compositionmay affect sig-nificantly the quantification of SIF from coarse resolutions at globalscale. These results confirm some recent efforts done by other authorsin order to provide insights into the key variables that drive SIF fromvegetation canopies using RTM approaches within the SCOPE model(Verrelst et al., 2016). However, multiple scattering effects within thecanopy cannot be addressed with the 1-D RTM SCOPE. Additionally,FluorFLIGHT used here also investigated the effect of scene componentssuch as the percentage of vegetation or the illumination condition onthe interpretation of fluorescence signal retrieved from forest heteroge-neous canopies. The proportion of sunlit green vegetation absorbs morelight and hence produce a higher SIF intensity (Genty et al., 1989)whichexplains the higher values in SIF retrieval on sunlit crowns using theFLD3 method. These results were demonstrated here through both themodel simulation approach and experimental data.
Another important issue that requires attention is the potential ef-fect of the spectral resolution on the retrieval of fluorescence, whichhas been questioned by some authors (Damm et al., 2014). To raisingawareness on this issue, the spectral resolution of the hyperspectralsensor used in this study (6.5 nm) was also analysed. Both, experimen-tal and simulation analysis demonstrated that the retrieval of fluores-cence is feasible with such spectral resolution. SIF accuracy retrievalsare only slightly diminished by using a spectral resolution of 6.5 nmcomparedwith the effect produced by other factors such as forest struc-ture and density. The expected deviation between absolute SIF valuesretrieved at 1 nm and with 6.5 nm FWHM (with high sampling inter-vals) do not likely affect the conclusions obtained in studies such asthis one, which focuses in fluorescence retrievals for stress detectionpurposes rather than the absolute quantification of SIF values. In thesestudies, the variation of fluorescence in relative terms enables the as-sessment of early stress related to disease severity levels and forest de-cline variability.
Besides the intrinsic factors that modulate the SIF at the canopylevel, the pixel aggregation used affects the estimated intensity. In par-ticular, the accuracy of SIF retrieved from aggregated pixels beyond thecrown level is uncertain because the pixel mixturemay include the con-founding effects of shaded pixels and background soil, decreasing theabsorption in the O2\\B band, and therefore, the overall magnitude ofthe F-signal. A more refined 3-D canopy model including physiological,aerodynamic and geometry variableswould be needed to better analysethephysiological regulation of thefluorescence yield as a function ofmi-crometeorological drivers. Nevertheless, the results of the present studyshowed a strong improvement in the retrieval of SIF at the leaf levelfrom coarse resolution pixels based on the inversion of FluorFLIGHT

178 R. Hernández-Clemente et al. / Remote Sensing of Environment 193 (2017) 165–179
accounting for structural variables (r2 = 0.70) compared to the resultsobtained ignoring those effects (r2 = 0.42).
Therefore, these results suggest that the use of a 3-D RTM, such asFluorFLIGHT, may improve the estimation of SIF at global scales. SIF es-timation at the crown level becomes particularly critical with invasiveplant pathogens affecting individual trees alternately and selectivelywithin the forest canopy. This is the case of sudden oak death diseaseprogression at local and spatial scales (Ramage et al., 2012). Local patch-iness in disease presence/severity can be clearly observed with the highlocal variability of the Fi inversion map estimated at the oak site. Hence,mapping fluorescence emission based on FluorFLIGHT model inversionapproaches sets a new standard in the early detection of stress effectstowards precision forestry. The early detection of hotspot locations(focus of infection or decline) might help to combat forest decline pro-cesses, and in case of Phytophthora infections, prevent the spread of theinfection.
These results are of particular interest for the FLEX mission, ap-proved as ESA's Earth Explorer 8 (Drusch et al., 2016), which will withprovidefluorescence emission atfiner spatial scale than currently possi-ble, and potential to resolve full fluorescence emission spectrum withfurther information on stress attribution (Ač et al., 2015; Cogliati et al.,2015). There are still many challenges for measurement of SIF fromspace; further validation studies need to be undertaken to assessmodel-ling results and the effect of environmental stress factors on ecophysio-logical traits and forest productivity. Another important issue thatrequires attention is the potential application of thesemethods to differ-ent forest types increasingly complex in terms of structure and tree spe-cies composition. The canopy structure and spatial heterogeneity of theopen-and-sparse oakwoodland studied heremay have a different effecton global SIF estimates to other types of land covers:with higher canopydensity (closed forest canopies), with higher heterogeneity in speciesand/or soil composition or higher vertical heterogeneity within forestcanopies.
It is important to highlight the difficulties of validating the estima-tion of SIF from spaceborne sensors over forest canopies, which encom-pass challenging experimental field campaigns and samplingconditions. The use of very high resolution airbornehyperspectral imag-ery as used in this and similar studies may be valuable. More studiessupporting the validation of SIF are foreseen to improve our under-standing in the link between SIF and photosynthetic activity with agreater degree of confidence. SIF retrievals using FluorFLIGHT shouldbe further validated for different types of canopies and physiologicalconditions for monitoring forest decline processes.
5. Conclusions
Measuring SIF remotely is potentially a valuable tool to track thehealth and productivity of forest but also brings important challenges.This study gives the first 3-D model of canopy fluorescence, combinedwith an original field campaign aimed at quantifying the link betweencanopy physiology and detection at scales suitable for satellite remotesensing. The results show a link between physiologically based indica-tors and SIF retrieval from hyperspectral remote sensing for an oak for-est affected by root pathogen infections and water stress.
Model estimations against in-situ measurements conducted overthe oak forest demonstrated significant utility of SIF for precision phys-iological condition characterization. The FluorFLIGHT model enabledthe estimation of sunlit vegetation fluorescence from coarse pixels(r2 = 0.79, p b 0.01) accounting for the large effects produced by theFC and canopy structure. The model inversion approach at three steps,which progressively approximates the observed canopy structure het-erogeneity from the study sites, showed improvements in the estima-tion of leaf-based fluorescence measurement.
The results presented in this study demonstrated the fluorescencesignal retrieved frommixed pixels is significantly affected by the effectscaused by the illumination condition and the structural component of
the canopy (r2=0.42). Those effects are intrinsic to all radiance spectralretrieved from aggregated pixels irrespective of the sample size, but getincreasingly critical with increasing levels of aggregation (pixel size). Inparticular, the SIF signal was significantly lower when retrieved fromcoarse pixels (lower than 10 × 10 m resolution) than from sunlit pixelcrowns (b50%). Fluorescence retrieval using FluorFLIGHT and account-ing for pixel aggregation minimized the impact of the canopy structureand other scene components improving the accuracy of the estimations(r2 = 0.70).
Acknowledgements
This studywas conducted under theMarie Curie Intra-European Fel-lowship for Career Development. Data collection was partially support-ed by the THERMOLIDAR FP7 Project and the QUERCUSAT project fromthe Spanish funding agency “Ministerio de Economia y Competitividad”.The authors are most grateful to the Treesat research group (ERSAF,University of Cordoba, Spain) for the support provided during the fieldcampaigns.
References
Ač, A., Malenovský, Z., Olejníčková, J., Gallé, A., Rascher, U., Mohammed, G., 2015. Meta-analysis assessing potential of steady-state chlorophyll fluorescence for remote sens-ing detection of plant water, temperature and nitrogen stress. Remote Sens. Environ.168:420–436. http://dx.doi.org/10.1016/j.rse.2015.07.022.
Bye, I.J., North, P.R.J., Los, S.O., Kljun, N., Rosette, J.A.B., Hopkinson, C., Chasmer, L.,Mahoney, C., 2017. Estimating forest canopy parameters from satellite waveformLiDAR by inversion of the FLIGHT three-dimensional radiative transfer model. Re-mote Sens. Environ. 188:177–189. http://dx.doi.org/10.1016/j.rse.2016.10.048.
Cogliati, S., Verhoef, W., Kraft, S., Sabater, N., Alonso, L., Vicent, J., Moreno, J., Drusch, M.,Colombo, R., 2015. Retrieval of sun-induced fluorescence using advanced spectralfitting methods. Remote Sens. Environ. 169:344–357. http://dx.doi.org/10.1016/j.rse.2015.08.022.
Damm, A., Guanter, L., Laurent, V.C.E., Schaepman, M.E., Schickling, A., Rascher, U., 2014.FLD-based retrieval of sun-induced chlorophyll fluorescence from medium spectralresolution airborne spectroscopy data. Remote Sens. Environ. 147:256–266. http://dx.doi.org/10.1016/j.rse.2014.03.009.
Damm, A., Guanter, L., Verhoef, W., Schläpfer, D., Garbari, S., Schaepman, M.E., 2015. Im-pact of varying irradiance on vegetation indices and chlorophyll fluorescence derivedfrom spectroscopy data. Remote Sens. Environ. 156:202–215. http://dx.doi.org/10.1016/j.rse.2014.09.031.
Drusch, M., Moreno, J., Del Bello, U., Franco, R., Goulas, Y., Huth, A., Kraft, S., Middleton,E.M., Miglietta, F., Mohammed, G., Nedbal, L., Rascher, U., Schüttemeyer, D.,Verhoef, W., 2016. The FLuorescence EXplorer Mission Concept-ESA's Earth Explorer8. IEEE Trans. Geosci. Remote Sens. PP (99):1–12. http://dx.doi.org/10.1109/TGRS.2016.2621820.
Duffour, C., Olioso, A., Demarty, J., Van der Tol, C., Lagouarde, J.-P., 2015. An evaluation ofSCOPE: a tool to simulate the directional anisotropy of satellite-measured surfacetemperatures. Remote Sens. Environ. 158:362–375. http://dx.doi.org/10.1016/j.rse.2014.10.019.
Feret, J.-B., François, C., Asner, G.P., Gitelson, A.A., Martin, R.E., Bidel, L.P.R., Ustin, S.L., leMaire, G., Jacquemoud, S., 2008. PROSPECT-4 and 5: advances in the leaf optical prop-erties model separating photosynthetic pigments. Remote Sens. Environ. 112:3030–3043. http://dx.doi.org/10.1016/j.rse.2008.02.012.
Ferraz, J., Casas, A.T., Caetano, P., 2000. El decaimiento ymuerte de encinas en tres dehesasde la provincia de Huelva. Bol. Sanid. Veg. Plagas 26, 447–464.
Franck, F., Juneau, P., Popovic, R., 2002. Resolution of the Photosystem I and PhotosystemII contributions to chlorophyll fluorescence of intact leaves at room temperature.Biochim. Biophys. Acta BBA - Bioenerg. 1556:239–246. http://dx.doi.org/10.1016/S0005-2728(02)00366-3.
Frankenberg, C., Fisher, J.B., Worden, J., Badgley, G., Saatchi, S.S., Lee, J.-E., Toon, G.C., Butz,A., Jung, M., Kuze, A., Yokota, T., 2011. New global observations of the terrestrial car-bon cycle from GOSAT: patterns of plant fluorescence with gross primary productiv-ity. Geophys. Res. Lett. 38, L17706. http://dx.doi.org/10.1029/2011GL048738.
Gamon, J.A., Peñuelas, J., Field, C.B., 1992. A narrow-waveband spectral index that tracksdiurnal changes in photosynthetic efficiency. Remote Sens. Environ. 41:35–44.http://dx.doi.org/10.1016/0034-4257(92)90059-S.
Genty, B., Briantais, J.-M., Baker, N.R., 1989. The relationship between the quantum yieldof photosynthetic electron transport and quenching of chlorophyll fluorescence.Biochim. Biophys. Acta Gen. Subj. 990:87–92. http://dx.doi.org/10.1016/S0304-4165(89)80016-9.
Guanter, L., Frankenberg, C., Dudhia, A., Lewis, P.E., Gómez-Dans, J., Kuze, A., Suto, H.,Grainger, R.G., 2012. Retrieval and global assessment of terrestrial chlorophyll fluo-rescence from GOSAT space measurements. Remote Sens. Environ. 121:236–251.http://dx.doi.org/10.1016/j.rse.2012.02.006.
Hernández-Clemente, R., Navarro-Cerrillo, R.M., Suarez, L., Morales, F., Zarco-Tejada, P.J.,2011. Assessing structural effects on PRI for stress detection in conifer forests. RemoteSens. Environ. 115:2360–2375. http://dx.doi.org/10.1016/j.rse.2011.04.036.

179R. Hernández-Clemente et al. / Remote Sensing of Environment 193 (2017) 165–179
Hernández-Clemente, R., Navarro-Cerrillo, R.M., Ramírez, F.J.R., Hornero, A., Zarco-Tejada,P.J., 2014. A novel methodology to estimate single-tree biophysical parameters from3-D digital imagery compared to aerial laser scanner data. Remote Sens. 6 (11):11627–11648. http://dx.doi.org/10.3390/rs61111627.
Jacquemoud, S., Baret, F., 1990. PROSPECT: a model of leaf optical properties spectra. Re-mote Sens. Environ. 34:75–91. http://dx.doi.org/10.1016/0034-4257(90)90100-Z.
Joiner, J., Yoshida, Y., Vasilkov, A.P., Schaefer, K., Jung, M., Guanter, L., Zhang, Y., Garrity, S.,Middleton, E.M., Huemmrich, K.F., Gu, L., Belelli Marchesini, L., 2014. The seasonalcycle of satellite chlorophyll fluorescence observations and its relationship to vegeta-tion phenology and ecosystem atmosphere carbon exchange. Remote Sens. Environ.152:375–391. http://dx.doi.org/10.1016/j.rse.2014.06.022.
Kraft, S., Bello, U.D., Bouvet, M., Drusch, M., Moreno, J., 2012. FLEX: ESA's Earth Explorer 8candidate mission. 2012 IEEE International Geoscience and Remote Sensing Sympo-sium :pp. 7125–7128 Presented at the 2012 IEEE International Geoscience and Re-mote Sensing Symposium. 10.1109/IGARSS.2012.6352020.
Krause, G.H., Weis, E., 1984. Chlorophyll fluorescence as a tool in plant physiology.Photosynth. Res. 5:139–157. http://dx.doi.org/10.1007/BF00028527.
Kuze, A., Suto, H., Nakajima, M., Hamazaki, T., 2009. Thermal and near infrared sensor forcarbon observation Fourier-transform spectrometer on the Greenhouse Gases Ob-serving Satellite for greenhouse gases monitoring. Appl. Opt. 48, 6716–6733.
Leonenko, G., Los, S.O., North, P.R.J., 2013. Statistical distances and their applications tobiophysical parameter estimation: information measures, M-estimates, and mini-mum contrast methods. Remote Sens. 5:1355–1388. http://dx.doi.org/10.3390/rs5031355.
Maurel, M., Robin, C., Capron, G., Desprez-Loustau, M.-L., 2001. Effects of root damage as-sociated with Phytophthora cinnamomi on water relations, biomass accumulation,mineral nutrition and vulnerability to water deficit of five oak and chestnut species.For. Pathol. 31:353–369. http://dx.doi.org/10.1046/j.1439-0329.2001.00258.x.
Miller, J., 2005. Development of a Vegetation Fluorescence Canopy Model.Moralejo, E., García-Muñoz, J.A., Descals, E., 2009. Susceptibility of Iberian trees to
Phytophthora ramorum and P. cinnamomi. Plant Pathol. 58:271–283. http://dx.doi.org/10.1111/j.1365-3059.2008.01956.x.
Natalini, F., Alejano, R., Vázquez-Piqué, J., Cañellas, I., Gea-Izquierdo, G., 2016. The role ofclimate change in the widespreadmortality of holm oak in openwoodlands of South-western Spain. Dendrochronologia 38:51–60. http://dx.doi.org/10.1016/j.dendro.2016.03.003.
Naumann, J.C., Anderson, J.E., Young, D.R., 2008. Linking physiological responses, chloro-phyll fluorescence and hyperspectral imagery to detect salinity stress using the phys-iological reflectance index in the coastal shrub,Myrica cerifera. Remote Sens. Environ.112:3865–3875. http://dx.doi.org/10.1016/j.rse.2008.06.004.
North, P., 1996. Three-dimensional forest light interaction model using a Monte Carlomethod. IEEE Trans. Geosci. Remote Sens. 34:946–956. http://dx.doi.org/10.1109/36.508411.
North, P.R.J., Rosette, J.A.B., Suárez, J.C., Los, S.O., 2010. A Monte Carlo radiative transfermodel of satellite waveform LiDAR. Int. J. Remote Sens. 31:1343–1358. http://dx.doi.org/10.1080/01431160903380664.
Pedrós, R., Moya, I., Goulas, Y., Jacquemoud, S., 2008. Chlorophyll fluorescence emissionspectrum inside a leaf. Photochem. Amp Photobiol. Sci. Off. J. Eur. Photochem.Assoc. Eur. Soc. Photobiol. 7:498–502. http://dx.doi.org/10.1039/b719506k.
Prieto-Blanco, A., North, P.R.J., Barnsley, M.J., Fox, N., 2009. Satellite-driven modelling ofNet Primary Productivity (NPP): theoretical analysis. Remote Sens. Environ. 113:137–147. http://dx.doi.org/10.1016/j.rse.2008.09.002.
Ramage, B.S., Forrestel, A.B., Moritz, M.A., O'Hara, K.L., 2012. Sudden oak death diseaseprogression across two forest types and spatial scales. J. Veg. Sci. 23:151–163.http://dx.doi.org/10.1111/j.1654-1103.2011.01340.x.
Roig Gómez, S., Ponce, R.A., González Sánchez, M., García del Barrio, J.M., Cañellas Rey deViñas, I., 2007. Caracterización de la dehesa española de encina y alcornoque a partirdel inventario forestal nacional. Cuad. Soc. Esp. Cienc. For. 163–170.
Rossini, M., Nedbal, L., Guanter, L., Ač, A., Alonso, L., Burkart, A., Cogliati, S., Colombo, R.,Damm, A., Drusch, M., Hanus, J., Janoutova, R., Julitta, T., Kokkalis, P., Moreno, J.,Novotny, J., Panigada, C., Pinto, F., Schickling, A., Schüttemeyer, D., Zemek, F.,Rascher, U., 2015. Red and far red sun-induced chlorophyll fluorescence as a measureof plant photosynthesis. Geophys. Res. Lett. 42 2014GL062943. 10.1002/2014GL062943.
Rouse Jr., J.W., Haas, R.H., Schell, J.A., Deering, D.W., 1974. Monitoring the vernal advance-ment and retrogradation (green wave effect) of natural vegetation. Prog. Rep. RSC1978-1, Remote Sensing Center, Texas A&M Univ., College Station ( 93p., NTIS No.E73-106393).
Scholander, P.F., Bradstreet, E.D., Hemmingsen, E.A., Hammel, H.T., 1965. Sap pressure invascular plants. Science 148:339–346. http://dx.doi.org/10.1126/science.148.3668.339.
Thayer, S.S., Björkman, O., 1990. Leaf xanthophyll content and composition in sun andshade determined by HPLC. Photosynth. Res. 23:331–343. http://dx.doi.org/10.1007/BF00034864.
van der Tol, C., Verhoef, W., Timmermans, J., Verhoef, A., Su, Z., 2009. An integrated modelof soil-canopy spectral radiances, photosynthesis, fluorescence, temperature and
energy balance. Biogeosciences 6:3109–3129. http://dx.doi.org/10.5194/bg-6-3109-2009.
Van Wittenberghe, S., Alonso, L., Verrelst, J., Hermans, I., Valcke, R., Veroustraete, F.,Moreno, J., Samson, R., 2014. A field study on solar-induced chlorophyll fluorescenceand pigment parameters along a vertical canopy gradient of four tree species in anurban environment. Sci. Total Environ. 466–467:185–194. http://dx.doi.org/10.1016/j.scitotenv.2013.07.024.
Van Wittenberghe, S., Alonso, L., Verrelst, J., Moreno, J., Samson, R., 2015. Bidirectionalsun-induced chlorophyll fluorescence emission is influenced by leaf structure andlight scattering properties — a bottom-up approach. Remote Sens. Environ. 158:169–179. http://dx.doi.org/10.1016/j.rse.2014.11.012.
Verhoef, W., 2004. Extension of SAIL to model solar - induced canopy fluorescence spec-tra. Proceedings of the 2nd international workshop on remote sensing of vegetationfluorescence, 17–19 Nov. 2004. ESA, 2004, Montreal, Canada/Paris (ESA WPP ; 242,18 p.).
Verrelst, J., Rivera, J.P., van der Tol, C., Magnani, F., Mohammed, G., Moreno, J., 2015. Globalsensitivity analysis of the SCOPE model: what drives simulated canopy-leaving sun-induced fluorescence? Remote Sens. Environment 166:8–21. http://dx.doi.org/10.1016/j.rse.2015.06.002.
Verrelst, J., van der Tol, C., Magnani, F., Sabater, N., Rivera, J.P., Mohammed, G., Moreno, J.,2016. Evaluating the predictive power of sun-induced chlorophyll fluorescence to es-timate net photosynthesis of vegetation canopies: a SCOPE modeling study. RemoteSens. Environ. 176:139–151. http://dx.doi.org/10.1016/j.rse.2016.01.018.
Vilfana, N., van der Tol, C., Muller, O., Rascher, U., Verhoef, W., 2016. Fluspect-B: a modelfor leaf fluorescence, reflectance and transmittance spectra. Remote Sens. Environ.186:596–615. http://dx.doi.org/10.1016/j.rse.2016.09.017.
Widlowski, J.-L., Taberner, M., Pinty, B., Bruniquel-Pinel, V., Disney, M., Fernandes, R.,Gastellu-Etchegorry, J.-P., Gobron, N., Kuusk, A., Lavergne, T., Leblanc, S., Lewis, P.E.,Martin, E., Mõttus, M., North, P.R.J., Qin, W., Robustelli, M., Rochdi, N., Ruiloba, R.,Soler, C., Thompson, R., Verhoef, W., Verstraete, M.M., Xie, D., 2007. Third RadiationTransfer Model Intercomparison (RAMI) exercise: documenting progress in canopyreflectance models. J. Geophys. Res. Atmos. 112, D09111. http://dx.doi.org/10.1029/2006JD007821.
Widlowski, J.-L., Robustelli, M., Disney, M., Gastellu-Etchegorry, J.-P., Lavergne, T., Lewis,P., North, P.R.J., Pinty, B., Thompson, R., Verstraete, M.M., 2008. The RAMI On-lineModel Checker (ROMC): a web-based benchmarking facility for canopy reflectancemodels. Remote Sens. Environ. 112:1144–1150. http://dx.doi.org/10.1016/j.rse.2007.07.016.
Widlowski, J.-L., Mio, C., Disney, M., Adams, J., Andredakis, I., Atzberger, C., Brennan, J.,Busetto, L., Chelle, M., Ceccherini, G., Colombo, R., Côté, J.-F., Eenmäe, A., Essery, R.,Gastellu-Etchegorry, J.-P., Gobron, N., Grau, E., Haverd, V., Homolová, L., Huang, H.,Hunt, L., Kobayashi, H., Koetz, B., Kuusk, A., Kuusk, J., Lang, M., Lewis, P.E., Lovell,J.L., Malenovský, Z., Meroni, M., Morsdorf, F., Mõttus, M., Ni-Meister, W., Pinty, B.,Rautiainen, M., Schlerf, M., Somers, B., Stuckens, J., Verstraete, M.M., Yang, W., Zhao,F., Zenone, T., 2015. The fourth phase of the radiative transfer model intercomparison(RAMI) exercise: actual canopy scenarios and conformity testing. Remote Sens. Envi-ron. 169:418–437. http://dx.doi.org/10.1016/j.rse.2015.08.016.
Zarco-Tejada, P.J., Miller, J.R., Noland, T.L., Mohammed, G.H., Sampson, P.H., 2001. Scaling-up and model inversion methods with narrowband optical indices for chlorophyllcontent estimation in closed forest canopies with hyperspectral data. IEEE Trans.Geosci. Remote Sens. 39:1491–1507. http://dx.doi.org/10.1109/36.934080.
Zarco-Tejada, P., Berjon, A., Lopezlozano, R., Miller, J., Martin, P., Cachorro, V., Gonzalez, M.,de Frutos, A., 2005. Assessing vineyard condition with hyperspectral indices: leaf andcanopy reflectance simulation in a row-structured discontinuous canopy. RemoteSens. Environ. 99:271–287. http://dx.doi.org/10.1016/j.rse.2005.09.002.
Zarco-Tejada, P.J., Catalina, A., González, M.R., Martín, P., 2013a. Relationships betweennet photosynthesis and steady-state chlorophyll fluorescence retrieved from air-borne hyperspectral imagery. Remote Sens. Environ. 136:247–258. http://dx.doi.org/10.1016/j.rse.2013.05.011.
Zarco-Tejada, P.J., Suarez, L., Gonzalez-Dugo, V., 2013b. Spatial resolution effects on chlo-rophyll fluorescence retrieval in a heterogeneous canopy using hyperspectral imag-ery and radiative transfer simulation. IEEE Geosci. Remote Sens. Lett. 10:937–941.http://dx.doi.org/10.1109/LGRS.2013.2252877.
Zarco-Tejada, P.J., Morales, A., Testi, L., Villalobos, F.J., 2013c. Spatio-temporal patterns ofchlorophyll fluorescence and physiological and structural indices acquired fromhyperspectral imagery as compared with carbon fluxes measured with eddy covari-ance. Remote Sens. Environ. 133:102–115. http://dx.doi.org/10.1016/j.rse.2013.02.003.
Zarco-Tejada, P.J., González-Dugo, M.V., Fereres, E., 2016. Seasonal stability of chlorophyllfluorescence quantified from airborne hyperspectral imagery as an indicator of netphotosynthesis in the context of precision agriculture. Remote Sens. Environ. 179:89–103. http://dx.doi.org/10.1016/j.rse.2016.03.024.