Embed Size (px)
Citation preview

i
Asian Institute of Technology
Vincent Herbreteau Nationality: French Previous Degree: French agricultural engineer,
ENITA Bordeaux, France
Remote sensing and GIS in risk zonation of human exposure
to hantavirus related diseases. Case of Nakhon Pathom province, Thailand.
AIT Examination Committee: IRD consultants: Dr. Haja Andrianasolo (Committee chairman) Dr. Jean-Paul Gonzalez, Dr. Nitin K. Tripathi, Gilles Chauvancy. Dr. Kiyoshi Honda.
Space Technology Applications and Research Program
Asian Institute of Technology
-2001-

ii
Acknowledgment
I would like to express my sincere gratitude to Dr. Haja Andrianasolo, advisor and committee chairman from whom I’ve learnt a lot during my stay in AIT and I want to thank him for the guidance and understanding to achieve the thesis. I also thank Kanchana Nakhapakorn for her kindness and her useful help to solve all the technical problems I encountered. This work has been closely realized with the IRD (Institut de Recherche pour le Développement) in Salaya (Thailand) and I am really grateful to Jean-Paul Gonzalez for his support and Gilles Chauvancy for his help and all the knowledge he brought to this study. Finally I would like to thank Dr. Kioshy Honda and Dr. Nitin K. Tripathi for their support during the master.

iii
Abstract The emerging diseases are mostly caused by viruses and among them hantaviruses regroup some viral species, which have been documented for only a few years. Rodents are known as important vectors and reservoirs of hantaviruses and many other zoonotic diseases from various origins: virus (hantavirus or arenavirus), bacteria (pestis, leptospirosis), rickettia or parasites (nematodes). The presence and emergence of one disease is directly linked to the presence and emergence of one vector. Then the study focuses on the delineation of these rodents’ habitats, which allows assessing the potential contacts for humans with these rodents and then the risks of human exposure to these diseases. Using remote sensing and GIS tools we can delimit each rodents habitats by identifying the ecological parameters, which describe the ecology of one rodent. The study was realized in Nakhon Pathom province (west of Bangkok, Thailand) where a large sampling has been conducted. From the rodents trapped and the data associated we can define the parameters (physical, demographic, social), which characterize each species and then make their zonation. This delineation should help to understand what in the global environment makes one species and then one disease emerging and furthermore to know where we have to act to avoid the development of such diseases.

iv
Table of Contents
Chapter title Page Title page Acknowledgment ii Abstract iii Table of Contents iv List of Figures ................................................................................................................................ vi List of Tables ................................................................................................................................ vii List of abbreviations .................................................................................................................... viii 1. Introduction......................................................................................................................... 1
1.1. Background. 1 1.2. Rationale. 1 1.3. Objectives of the study. 2 1.4. Scope of the study. 2 1.5. Study area. 3
2. Literature review: synthesis about hantaviruses. ................................................................ 5
2.1. Hantavirus virology. 6 2.2. Aerosolization, the main means of transmission of hantavirus to human populations.
2.2.1. Aerosolization: an airborne transmission of hantaviruses. 7 2.2.2. A suspected person-to-person transmission. 7
2.3. Hantavirus vectors: rodents 8 2.3.1. Ecology of rodents in relation to different ecosystems. 8 2.3.2. Each hantavirus is usually linked to one specific vector. 8
2.4. Environmental analysis of the emergence of hantaviruses. 11 2.4.1. Definition of the environmental parameters. 11
2.4.1.1. Driving forces of the development of habitats for rodents. 11 2.4.1.2. Pressure on environment. 12 2.4.1.3. Influence of the global warming on populations. 14 2.4.1.4. Artificial introduction of vectors and viruses. 15 2.4.1.5. Synthesis. 15
2.4.2. Understanding the emergence of hantaviruses. 17 2.4.3. State in Thailand. 19
2.4.3.1. Vectors identified. 19 2.4.3.2. Presence of hantaviruses. 19
3. Methodology: from habitats to human exposure risk. ...................................................... 23
3.1. Synchronic approach of environmental parameters. 23 3.1.1. Physical parameters. 23
3.1.1.1. Topographic description: elevation, slope and aspect. 23 3.1.1.2. Geology and soils. 23 3.1.1.3. Land use and hydrology. 23
v
3.1.2. Human parameters. 31 3.1.2.1. Demographic parameters. 31 3.1.2.2. Sanitary parameters. 35
3.2. Integration of the environmental parameters to model the presence of rodents and then the exposure to hantavirus related diseases. 37 3.3. Zonation of the distribution of each rodent and assessment of the human exposure to hantavirus related diseases. 39
3.3.1. Catching place and differentiation between domestic and wild species. 39 3.3.2. Description of the land use around the catching places. 40 3.3.3. Index by species 44
3.3.3.1. Bandicota indica. 44 3.3.3.2. Rattus exulans. 46 3.3.3.3. Rattus norvegicus. 48 3.3.3.4. Rattus rattus. 51
4. Results and discussion. ..................................................................................................... 53
4.1. Bandicota indica. 53 4.2. Rattus exulans. 54 4.3. Rattus norvegicus. 54 4.4. Rattus rattus. 55 4.5. Human exposure to these four rodents. 55
5. Conclusion and recommendations. ................................................................................... 58 References..................................................................................................................................... 59 Appendices.................................................................................................................................... 62

vi
List of Figures
Figure 1: Map of Nakhon Pathom province. 4 Figure 2: Thin-section electron micrograph of Sin Nombre virus isolated, a causative agent of
hantavirus pulmonary syndrome (HPS). From the 1994 outbreak of HPS in the southwestern UnFigure 3: Schematic representation of hantaviruses. 6 Figure 4: Relationships physical environment - human environment – 11 Figure 5: Main categories of the Earth land use. 13 Figure 6: Hantavirus related diseases cause-effect framework 16 Figure 7: Fishbone of the emergence of hantavirus related diseases. 18 Figure 8: Range of Bandicota indica in Thailand 20 Figure 9: Range of Rattus norvegicus in Thailand. 21 Figure 10: Range of Rattus rattus in Thailand. 22 Figure 11: Range of Rattus exulans in Thailand. 22 Figure 12: View of the window of Multiscope3.1 during the processing of the classification. 24 Figure 13: LANDSAT image. 25 Figure 14: Result of a large magic wand selection in a paddy field area, using Multiscope 3.1. 26 Figure 15: Selection of parameters for the photo interpretation tools. 27 Figure 16: Land use classification. 29 Figure 17: Land use classes in Nakhon Pathom province. 30 Figure 18: Population density. 32 Figure 19: Characteristics of the five classes of population density. 33 Figure 20: Household density. 34 Figure 21: Characteristics of the five classes of household density. 35 Figure 22: Map of sanitary conditions. 36 Figure 23: Principles of spatial analysis of vector biology assessing the vector presence and the risks to contract the diseases. 38 Figure 24: Repartition of the catching place by rodents. 40 Figure 25: Buffering around the catching places. 41 Figure 26: Repartition of each land use class by species in the 8 buffer areas. 43 Figure 27: Potential presence of Bandicota indica. 45 Figure 28: Potential presence of Rattus exulans. 47 Figure 29: Description of the building of the index of presence of Bandicota indica. 48 Figure 30: Potential presence of Rattus norvegicus. 50 Figure 31: Potential presence of Rattus rattus. 52 Figure 32: Corresponding area for each class of potential presence of Bandicota indica. 53 Figure 33: Corresponding area for each class of potential presence of Rattus norvegicus. 54 Figure 34: Corresponding area for each class of potential presence of Rattus rattus. 55 Figure 35: Human risk exposure. 57

vii
List of Tables
Table 1: Description of Nakhon Pathom districts: 3 Table 2: Members of the genus Hantavirus, diseases caused, reservoirs and distribution: 9 Table 3: Rodents identified in Thailand: 19 Table 4: Repartition of each land use class in Nakhon Pathom province: 30 Table 5: Characteristics of the map of population density: 31 Table 6: Characteristics of the map of household density: 35 Table 7: Repartition of each species by the catching place. 39 Table 8: Number of rodents found at each catching places per species. 40 Table 9: Repartition of the land use classes (in hectare) at each catching places, inside the buffer areas (radius of 1 km). 42 Table 10: Number of species for each land use class in the 8 buffer areas. 42 Table 11: Repartition of the four species for each land use class in the 8 buffer areas. 43 Table 12: Index for the potential presence of Bandicota indica: 44 Table 13: Index describing the physical parameter of Rattus exulans: 46 Table 14: Index for the physical parameter of Rattus norvegicus: 48 Table 15: Index for the physical parameter of Rattus rattus: 51

viii
List of abbreviations
Bi : Bandicota indica. CDC : Centers for Disease Control and Prevention, U.S. Department of Health and
Human Services. DF : Dengue fever DHF : Dengue hemorrhagic fever refer to specific gradations of dengue. DSS : Dengue shock syndrome HFRS : Haemorrhagic Fever with Renal Syndrom. HPS : Hantavirus Pulmonary Syndrom. HRD : Hantavirus Related Diseases. GIS : Geographic Information System. GPS : Global Positioning System. IRD : Institut de Recherche pour le Développement (French institute). LANDSAT : Land Space Application Technology (Series of Satellites). RCEVD : Research Center for Emerging Viral Disease (IRD), Mahidol University,
Thailand. Re : Rattus exulans. Rn : Rattus norvegicus. Rr : Rattus rattus. RS : Remote Sensing. SNV : Sin Nombre Virus. TM : Thematic Mapper (Sensor for LANDSAT). UN : United Nations. WHO : World Health Organization.

1
1. Introduction.
1.1. Background. The emergence of new diseases should appear as a surprising phenomenon, while entering a new millennium and considering the huge progress of medicine and hygiene during the twentieth century. Since 1973, 30 previously unknown infectious diseases, including AIDS, have appeared (Time 19/02/2001). We could optimistically say that some diseases have disappeared or don’t cause any more death with progress but we must also understand that the economic development causing important ecologic changes is a main cause to explain most of these emerging diseases. The historical association of wild animals, especially rodents, with certain human endemic diseases is well documented and was referred to for centuries before the economic and scientific developments since the nineteenth century. However knowledge concerning the enzootic nature of such diseases in relation to the ecology of the rodent vectors and even more the understanding of the environmental changes that make a disease emerge has rarely been studied. Rodents are known to carry many diseases and in particular hantaviruses, which have caused several deaths especially in North America. Deaths caused by hantaviruses have recently been registered in Thailand. The emergence of hantavirus related diseases is now reaching Thailand, where these diseases are still not being studied. Little data is thus available but this creates a great challenge to describe the present state of hantaviruses. This study deals with the identification and delineation of the main rodents with medical interest in Thailand in order to assess the human exposure to hantavirus related diseases. It is part of a study on emerging viral diseases realized by the unit 34 of IRD (Institut de Recherche pour le Développement) in Salaya (Thailand).
1.2. Rationale. Rodents have been studied for several years by the unit 34 of IRD in Salaya. The data is huge and tackles ecological, medical and human aspects. Scientists need now to realize a spatial description of these rodents in order to understand their presence and dynamics, which made them emerged among other species. In order to prevent the emergence of diseases, the best way is to prevent the emergence of their vectors. This database will constitute a first step in the vectors’ description. For each rodent caught, a characterization of the ecology has been made in order to describe the different habitats. The GPS coordinates have also been taken to localize precisely each sample and allow us to integrate this data in a GIS. The study will then focus on the:
- Characterization of rodents’ habitats using remotely sensed data. - Assessment of hantavirus presence or expected presence and potential risks for
humans exposed to hantavirus related diseases.

2
1.3. Objectives of the study. The first difficulty for studying hantavirus related diseases is that they depend on three main factors:
- presence of viruses, - presence of vectors, which are rodents in this case, - presence of humans, who have an active role. With mosquito-borned diseases, we can
consider that humans have a passive role because mosquitoes go to the humans and transmit the viruses to them. In the case of hantaviruses, humans have to go and actually be near the rodent habitats and to disturb them to contract the diseases. Transmission can also take place for instance in domestic life or whilst working in fields. Therefore, the urbanization or the increasing population are factors, which help hantaviruses related diseases to emerge.
The study will then deal with:
- the identification of risk areas in order to avoid human contact with rodents habitats. This requires the description of vectors, their ecology and the hantavirus carried.
- the determination of risk indicators. - the understanding of the dynamics of vectors’ populations.
The lack of data relating to hantaviruses (viruses themselves, inoculations or deaths) will make their assessment more difficult and probably prevent the validation of the hypothesises. However, we do not need to wait for illnesses or deaths, while studying emerging diseases.
1.4. Scope of the study.
- Choice of rodent’s species. It’s not possible for such study to deal with every species. Then we will limit the study to the species of rodents, which present a medical interest in Thailand. These rodents are the ones who carry the greatest number of diseases (from various origins: virus (hantavirus or arenavirus), bacteria (pestis, leptospirosis), rickettia or parasites (nematodes). They have also for us a statistical interest because they represent the greatest number of samples and data that we have.
- Assessment of the presence of these vectors by using remotely sensed data. The
database relating to the rodents has been geographically referenced for each sampling location. Then it can be integrated into a spatial study using space technologies (GIS and Remote-sensing). We will use satellite images for the environmental description and we will limit the study area to one Thai province for technical and time reasons.
- Characterization of rodents’ habitats. For each rodent studied, the study should
understand and describe the ecological characteristics, which can be described using environmental or human parameters. These characteristics should vary from species to species but should be usable to assess the presence in other locations by extrapolation.
- Assessment of the presence of hantaviruses or expected presence. As soon as we will
be able to locate the rodents we should be able to locate as well the diseases and their responsible agents carried. For each rodents, blood analyses have been made to
3
identify the presence of viruses and bacteria. We have then the knowledge of the diseases carried and always the geographical location.
At first we have to select a Thai province as a study area.
1.5. Study area. The rodents’ database presents the largest number of samples in the province of Nakhon Pathom, which has then been chosen for the study. Nakhon Pathom province is located in the central plain of Thailand (See Figure 1 next page: Map of Nakhon Pathom province), in the western part of Bangkok metropolitan area (56 km). It’s a small Thai province (2168,327 sq. km), which is mostly a paddy field area with then a flat topography. The city of Nakhon Pathom (46700 inhabitants) is probably one of the eldest Thai cities as would say its name, which comes from “Nagara Pathama” and means “first city”.
Table 1: Description of Nakhon Pathom districts:
Number of Area District name
Tambon Village Population
Km2 rai Muang Nakhon Pathom 25 208 190985 417,440 260900 Samphan 16 134 106510 249,347 155842 Nakhon Chaisi 24 106 86346 284,031 177519 Kamphang San 13 150 106274 405,019 253137 Bang Len 15 173 81738 588,836 368023 Don Tum 8 66 11450 171,354 107096 Phutthamonthon 3 15 14974 52,300 32687 Total 104 825 598277 2168,327 1355204
Source: Ministry of Agriculture and co-operatives, 1993. The IRD is located in Nakhon Pathom province in Mahidol University. Then the choice is also really convenient for field sampling and field surveying.

4
Figure 1: Map of Nakhon Pathom province.
5
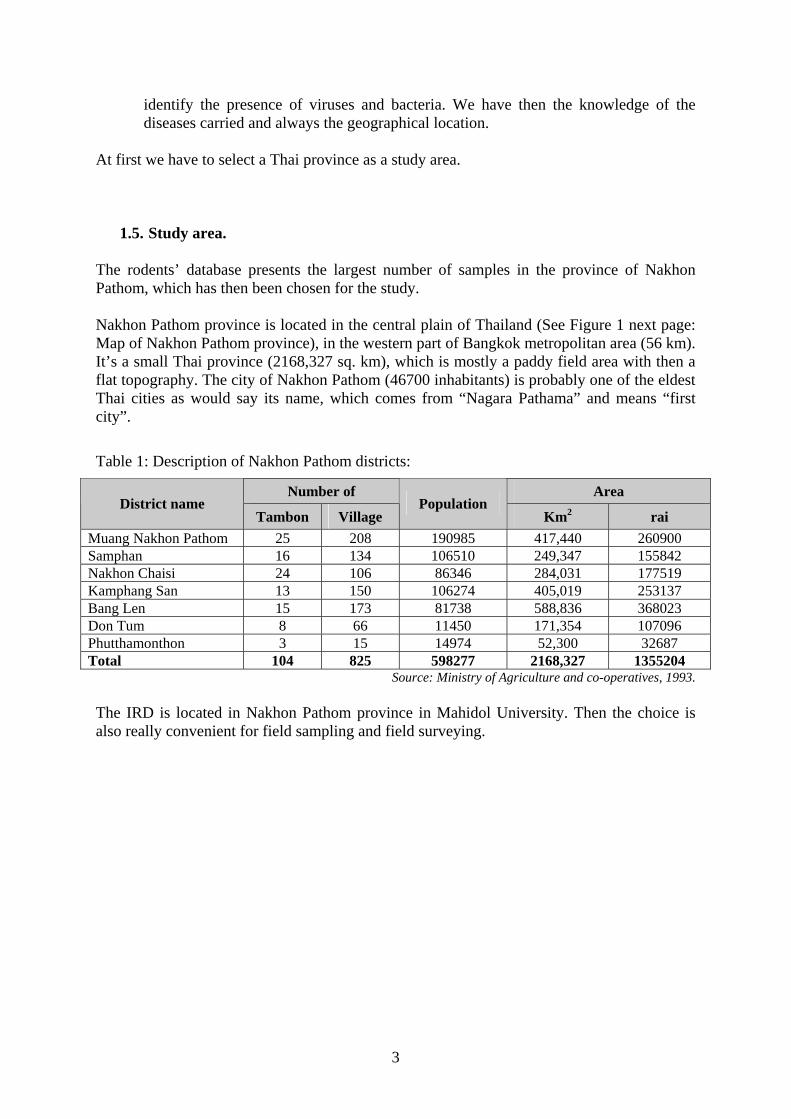
2. Literature review: synthesis about hantaviruses. Hantaviruses belong to the group of zoonotic viruses, which can be transmitted from animals to humans. They are spherical, about 100 nm in diameter.
Source: CDC, from: Cynthia Goldsmith, Sherif Zaki,
and Luanne Elliott, Infectious Disease Pathology Activity, DVRD, NCID, CDC.
Figure 2: Thin-section electron micrograph of Sin Nombre virus isolated, a causative agent of hantavirus pulmonary syndrome (HPS). From the 1994 outbreak of HPS in the southwestern
United States.

6
2.1. Hantavirus virology. Hantaviruses belong to the Bunyaviridae family, which is represented by four other genera: phlebovirus, nairovirus, tospovirus and bunyavirus. Like all genera of this family hantaviruses have a negative-sensed, single-stranded RNA. The genome is composed of a string of ribonucleotids contrary to the genome of living plants or animals made of DNA composed of desoxyribonucleotids. The negative-sensed RNA of hantaviruses should firstly be transcripted positive-sensed RNA before being translated in proteins. Some specific enzymes (RNA polymerases) realize this first step. These RNA polymerases are known to make more mistakes than the usual DNA polymerases during the translation. Because these errors are not corrected an infected cell can form a heterogeneous population of viruses. This fact explains the quick adaptation of these viruses to environmental changes. They are able to find new hosts in a different environment. In fact three segments, protected by the nucleocapsid, compose this genome. The small one encodes the nucleocapsid protein. The medium one encodes a glycoprotein, cleaved to yield the envelope glycoproteins G1 and G2. The large segment encodes the RNA polymerase, which functions as the viral transcriptase and replicase. If several viruses infect a cell, thus can combine with each other: the segments of one virus can be associated with the segments of another and form new clones.
Figure 3: Schematic representation of hantaviruses.
The hantavirus envelope holds many glycoproteins G1 and G2. Hantaviruses are then surrounded by a lipid envelope, which is somewhat fragile. This lipid envelope can be destroyed and the virus killed by fat solvents like alcohol, ordinary disinfectants and household bleach. This can be a way to prevent transmitting HPS by carefully wetting down dead rodents and areas where rodents have been with disinfectant and/or bleach Hantaviruses do not destroy cells after penetrating them. The incubation period is long: from 12 to 21 days. These viruses mainly affect the endothelial cells in renal pulmonary vessels.

7
2.2. Aerosolization, the main means of transmission of hantavirus to human populations.
2.2.1. Aerosolization: an airborne transmission of hantaviruses. The main known means of transmission of hantavirus is an airborne transmission by aerolization, which happens when a person breathes in the hantavirus from the air. Viruses are then spread like aerosols and enter into people through the respiratory system and especially the alveoli of the lungs. Small particles of many different sizes contaminated with the virus may rise up from soil, humus, and vegetation or inside houses from bedding or floors when these are moved, cleaned or blown by wind. These dust particles may be viruses themselves, tiny bits of infected feces, or tiny particles of dirt or soil that have been contaminated with the virus. These particles may remain suspended in the air for long periods of time, and some retain their ability to cause disease, while others degenerate due to the effects of sunlight and dryness. In the case of the HPS (hantavirus pulmonary syndrome), the rodent carriers produce urine. The act of spraying the urine may create the aerosols directly, or the virus particles may rise into the air as the urine evaporates. In other situations, the evaporation of infected particles may occur as an unintended result of work processes or atomisation by heating, cooling, or venting systems. Larger droplets or objects that may be sprayed or blown but that immediately settle down on something rather than remain suspended, are not considered to belong to the airborne transmission mechanism. Such sprays are considered direct transmission. Rodents carry hantaviruses without being affected by them. Viruses simply live in their bodies but rodents continually shed them into their droppings, urine or saliva. Then the aerosolization processes transmit hantaviruses to human.
2.2.2. A suspected person-to-person transmission. A person-to-person transmission has not yet been proved but is seriously suspected. “An adolescent patient in Buenos Aires apparently contracted hantavirus infection from her parents, who were infected in Patagonia. This unprecedented observation of apparent person-to-person spread of a hantavirus clearly requires laboratory confirmation.” (Hjelle B, torrez-Martinez N, Koster FT, Jay M, Ascher MS, Brown T, et al. Epidemiologic linkage of rodent and human hantavirus genomic sequences in case investigations of HPS. J Infect Dis 1996;173:781-6).

8
2.3. Hantavirus vectors: rodents
2.3.1. Ecology of rodents in relation to different ecosystems. Rodents are the most numerous mammals in terms of numbers of both species and individuals. Then they have a great potential for adaptation in all ecosystems (whether natural or man-made), where they are abundant. Each adaptation is characterized by a different ecology and a same species in temperate or tropical zones will have different ecologies. In tropical areas, seasonal population fluctuations are lower than those in temperate zones then there are more species of rodents with lower number of individuals in tropical areas. Reproductive patterns also differ in tropical and temperate zones. In the former, they usually reflect the influence of dry and wet seasons but, unlike in temperate areas, most tropical rodents can breed throughout the year. All these considerations should be understood as general ones because population or reproductive patterns can differ between tropical countries or even more in different biomes in one country. The differences between rodent populations are less marked in the populations living closely to humans because the natural environment is modified by men. Hence comparisons between rodent populations in different urban areas representing different ecosystems are generally more easily made than are those between rodents living in other habitats, less artificialized.
2.3.2. Each hantavirus is usually linked to one specific vector. We can divide hantaviruses into two major groups.
- The Hantaan, Puumala, and Seoul viruses are mostly found in Asia and Europe. They cause a group of illnesses called hemorrhagic fever with renal syndrome (HFRS). In people with HRFS, the kidneys may not function properly, so the body is not as able to produce urine. People with severe cases of HFRS may have circulatory problems, including shock, bleeding, and fluid build-up in the lungs, and abnormal liver function is sometimes seen. In general, these hantaviruses cause death in less than 10% of the people who become infected.
- The second group of hantaviruses cause a group of illness called hantavirus pulmonary syndrome (HPS). They have been found only in the Americas. In the United States, this group includes the Sin Nombre virus (SNV), carried by the deer mouse, which caused the "Four Corners" outbreak. Three other hantaviruses have been recently discovered that have caused several cases with the same pulmonary symptoms. The Black Creek Canal virus, carried by the cotton rat, was found in Florida, while the Bayou Virus, carried by the rice rat, was found in Louisiana. In New York, the New York-1 virus was linked to the white-footed mouse. Several other hantaviruses, Prospect Hill, Rio Segundo, Rio Mamore, and El Moro Canyon, have also been discovered, but they have not yet been associated with any disease in humans.
HPS cases have also been confirmed elsewhere in the Americas, in Argentina, Brazil, Canada, Chile, Paraguay and Uruguay. In addition, rodents carrying viruses similar to Sin Nombre have also been found in Bolivia, Costa Rica and Mexico, but these hantaviruses have not been associated with disease in humans.

9
Table 2: Members of the genus Hantavirus, diseases caused, reservoirs and distribution:
Species Disease Principal
reservoir Distribution
of virus Distribution of reservoir
Hantaan (HTN) HFRS Apodemus agrarius (striped field mouse)
China, Russia, Korea
Central Europe south to Thrace, Causasus, & Tien Shan Mountains; Amur river through Korea to E Xizang & E Yunnan, W Si-chuan, Fujiau
Taiwan (China) Dobrava-Belgrade (DOB)
HFRS Apodemus flavicollis (yellow-neck mouse)
Balkans England & Wales, from NW Spain, France. S Scandinavia through European Russia to Urals, S Italy, the Balkans, Syria, Lebanon, & Israel
Seoul (SEO) HFRS Rattus norvegicus (Norway rat)
Worldwide Worldwide
Puumala (PUU) HFRS Clethrionomys glareolus (Bank vole)
Europe, Russia, Scandinavia
W Paleartctic from France and Scandinavia to Lake Baikai, south to N Spain, N Italy, Balkans, W Turkey, N Kazakhstan, Altai & Sayan mountains; Britain & SW Ireland
Thailand (THAI) Nd Bandicota indica (Bandicoot rat)
Thailand Sri Lanka, peninsular India to Nepal, Burma, NE India, South China, Laos, Taiwan, Thailand, Vietnam
Prospect Hill (PH) Nd Microtus pennsylvanicus (Meadow vole)
US, Canada C Alaska to Labrador, including Newfoundland & Prince Edward Island, Canada; Rocky mountains to N New Mexico, in Great Plains to N Kansas, & in Appalachians to N Georgia, US
Khabarovsk (KHB)
Nd Microtus fortis (reed vole)
Russia Transbaikalia Amur region; E China
Thottapalayam (TPM)
Nd Suncus murinus (musk shrew)
India Afghanistan, Pakistan, India, Sri Lanka, Nepal, Bhutan, Burma, China, Taiwan, Japan, Indomalayan region
Tula (TUL) Nd Microtus arvalis (European common vole)
Europe Throughout Europe to Black Sea & NE to Kirov region, Russia
Sin Nombre (SN) HPS Peromyscus maniculatus (Deer mouse)
US, Canada, Mexico
Alaska Panhandle across N Canada, south through most continental US, excluding SE & E seaboard, to southern-most Baja California Sur and to NC Oaxaca, Mexico
NewYork (NY) HPS Peromyscus US C and E US to S Alberta & S

10
leucopus (white-footed mouse)
Ontario, Quebec & Nova Scotia, Canada; to N Durango & along Caribbean coast to Isthmus of Tehuantepec & Yucatan Peninsula, Mexico.
Black Creek Canal (BCC)
HPS Sigmodon hispidus (cotton rat)
US SE US, from S Nebraska to C Virginia south to SE Arizona & peninsular Florida; interior & E Mexico through Middle America to C Panama; in South America to N Colombia & N Venezuela
El Moro Canyon (ELMC)
Nd Reithrodontomys megalotis (Western harvest mouse)
US, Mexico British Columbia & SE Alberta, Canada; W and NC US, S to N Baja California & interior Mexico to central Oaxaca
Bayou (BAY) HPS Oryzomys palustris (Rice rat)
US SE Kansas to E Texas, eastward to S New Jersey & peninsular Florida
Source: Emerging Infectious Diseases, Vol. 3, No. 2, April-June 1997. Nd: not documented
In recent years the identification of new hantaviruses was dramatically increasing throughout the world. 30 hantaviruses are now recognized. Most studies have been conducted in North America and there is a lack of information in tropical countries, where rodent populations have of course different dynamics.
11
2.4. Environmental analysis of the emergence of hantaviruses.
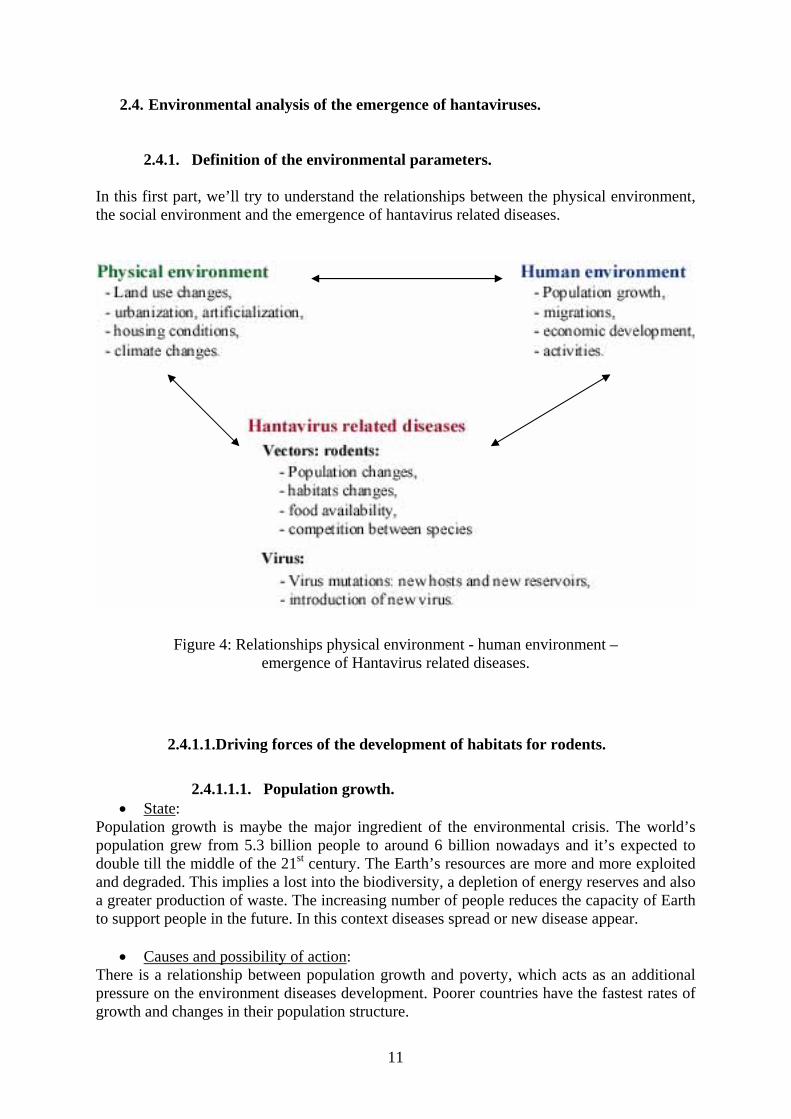
2.4.1. Definition of the environmental parameters. In this first part, we’ll try to understand the relationships between the physical environment, the social environment and the emergence of hantavirus related diseases.
Figure 4: Relationships physical environment - human environment – emergence of Hantavirus related diseases.
2.4.1.1.Driving forces of the development of habitats for rodents.
2.4.1.1.1. Population growth. • State:
Population growth is maybe the major ingredient of the environmental crisis. The world’s population grew from 5.3 billion people to around 6 billion nowadays and it’s expected to double till the middle of the 21st century. The Earth’s resources are more and more exploited and degraded. This implies a lost into the biodiversity, a depletion of energy reserves and also a greater production of waste. The increasing number of people reduces the capacity of Earth to support people in the future. In this context diseases spread or new disease appear.
• Causes and possibility of action: There is a relationship between population growth and poverty, which acts as an additional pressure on the environment diseases development. Poorer countries have the fastest rates of growth and changes in their population structure.

12
Development helps to lower the infant mortality rate and to improve the life expectancy. Although the total number of human population is increasing, the rate of population growth has been declining for the past several years. This rate is the difference between the birth rate and the death rate, which have both been decreasing since 1950. Most of governments try to offer family planning services to educate about health care or contraceptives. Population control measures are a purpose for governments. If population growth is slowed and resource consumption per person is decreased, the world will better tackle many of its environmental problems such as health protection.
2.4.1.1.2. Economic development. Poverty is one of the main driving forces for the development of diseases. “The importance of economic development for health and environment is highlighted by the fact that, overall, life expectancy and other health indicators have improved for those benefiting from economic development” (WHO, 1995). Economic growth generally benefits to rich and middle-income earners. Health services, water supply and sanitation services are directly linked to the economic development. If this one is poorly planned, vulnerability to environmental health hazards is increased. These major driving forces are increasing the pressure on the environment: they are the basis of what will help rodents’ habitats to develop.
2.4.1.2.Pressure on environment.
2.4.1.2.1. Urbanization. Before the industrial revolution, at the beginning of the nineteenth century, 3% of the world’s population was living in cities. Since this period the population distribution has radically been changed. From 1950 to 1980, the world’s population almost tripled, increasing from 701 to 1983 million, or from 25% to 41% of the total world population (WHO, 1991). Almost half of the population lives in cities now and the great majority of all world population growth over the next few decades will take place in the cities, with all the problems that implies. With this high concentration of inhabitants and activities, cities produce considerable waste and pollution. Urban growth management is also a challenge for health purposes: how to deal with water and waste in order not to make them a resource for rodents? Cities are growing fast. The scale of current urbanization is unlike that of any previous period in history. Most of the growth occurs in developing countries. Average annual growth rates of 3,5% have not been uncommon for urban populations in developing countries, and the increases in some countries may have been underestimated. Rates of growth in developing countries cities has been two to three times those experienced in industrialized countries in the past.

13
“As much as 30-60% of the urban population in low-income countries is believed to live in poor-quality housing and many case-studies undertaken in larger cities support this estimate (United Nation Centre for Human Settlements, 1996). Unhealthy housing are mainly represented by a deficiency in the water and sanitation facilities but it can also be inadequate drainage, poor refuse storage and collection. In such conditions, rodents have found new kind of habitats directly in human housings. The migration of humans from the countryside to increasing cities is also the desertion of natural lands and water bodies, which become reservoirs for rodents. Poor waste and water management is then the main focus for disease prevention in urban areas.
2.4.1.2.2. Artificial land and changes in land use. Hantavirus related diseases carried by rodents seem to occur in both urban and rural areas. Most of the Earth’s surface has become artificial. Although only 2% of the land is devoted to concrete human occupations (residential areas, industrial or commercial areas, roads and highways…) the human presence has transformed and made artificial much of the land. For example, much of forests, which represent 30% of the land, have been harvested at least once.
11%
25%
30%
32%
2%
human habitations &occupationscrops
pastures
forests
remaining
Figure 5: Main categories of the Earth land use.
The remaining third area of the world, which is not used for agricultural or other human activities, is too cold, too dry or too inaccessible to be exploited. Human activities affect water resources in terms of quality, quantity, and also geographical distribution. It’s especially the case of agricultural activities, which can transform aquatic ecosystems with irrigation, drainage or water retentions in reservoirs. The health topic should be integrated into the planning for agriculture, industry, …

14
2.4.1.2.3. Production and consumption. Production and consumption are increasing worldwide in consequence of which the production of household waste is also raising. Disposal and treatment are important for health purposes. If wastes are not disposed of adequately places (dumped a long time in the streets or in backyards), they’ll become so many places for rodents’ habitats. In many developing countries a small proportion of the population has access to municipal waste services. In low-income neighborhoods there may be no collection at all and then high level of health risks.
2.4.1.3.Influence of the global warming on populations. Scientists agree that there is a significant warming trend caused by the emissions of greenhouse gases, especially carbon dioxide (CO2), into the atmosphere. This global warming has serious negative effects on the environment but it can also have important consequences on human health. This is a part of the indirect effects of climate change, which are difficult to estimate. Actually climate restricts the range of animal populations then vector-borne diseases. Moreover we can expect that not only the geographic distribution of vectors will be affected but also their life cycle dynamics. Although accurate temperature records extend back only a little more than a hundred years, tree rings, ice-core samples and fossil pollen records indicate that the 1990s have been the hottest decade in over 600 years. According to a 1996 World Health Organization (WHO) report, at least 30 infections new to medicine have emerged in the past 20 years. While biological changes, social inequities are contributing to the emergence of infectious disease, environmental changes, including global warming, are apparently contributing to this global resurgence and may do so to an even greater extent in the future. Prevention of global warming: If we were able to stop now the emission of greenhouses gases, the Earth would still suffer from the global warming due to the greenhouse gases already accumulated during the past hundred years. However the additional gases pollution is making worse the severity of the climate changes. The development of alternatives to fossil fuel (in particularly renewable energy sources) offers a permanent solution to the emissions of carbon dioxides. Technical innovations in order to trap the carbon dioxide emitted from smokestacks should be developed. The Polluter Pay Principle is also a good incitement to work for the reduction of the emission of greenhouse gases. Nowadays some ways to mitigate the global warming are also followed. Most of them are the increasing of the use of atmospheric carbon dioxide by plants. Planting and maintaining new forests is then a good initiative. Developed and polluting countries should pay manage this purpose and help developing countries to maintain the tropical forests.

15
2.4.1.4.Artificial introduction of vectors and viruses. Migration of people that plays a role for the disease expansion occurs at different scales. For instance Rattus species (especially Rattus norvegicus and Rattus rattus) have been increased through human action by transportation by boats or caravans (Nowak, Paradiso, 1983). Firstly with transportation facilities it’s a worldwide scale for the migrations of vectors. On the other hand migrations in small areas are also really important. Denser human populations increase virus transmission by increasing the contacts with rodents. The movement of persons inside cities is maybe more important than the movement of rodents themselves. For example, people in their working place may move infected staff to their home and then move viruses. These kind of artificial migrations for rodents or viruses are inevitable and increase so.
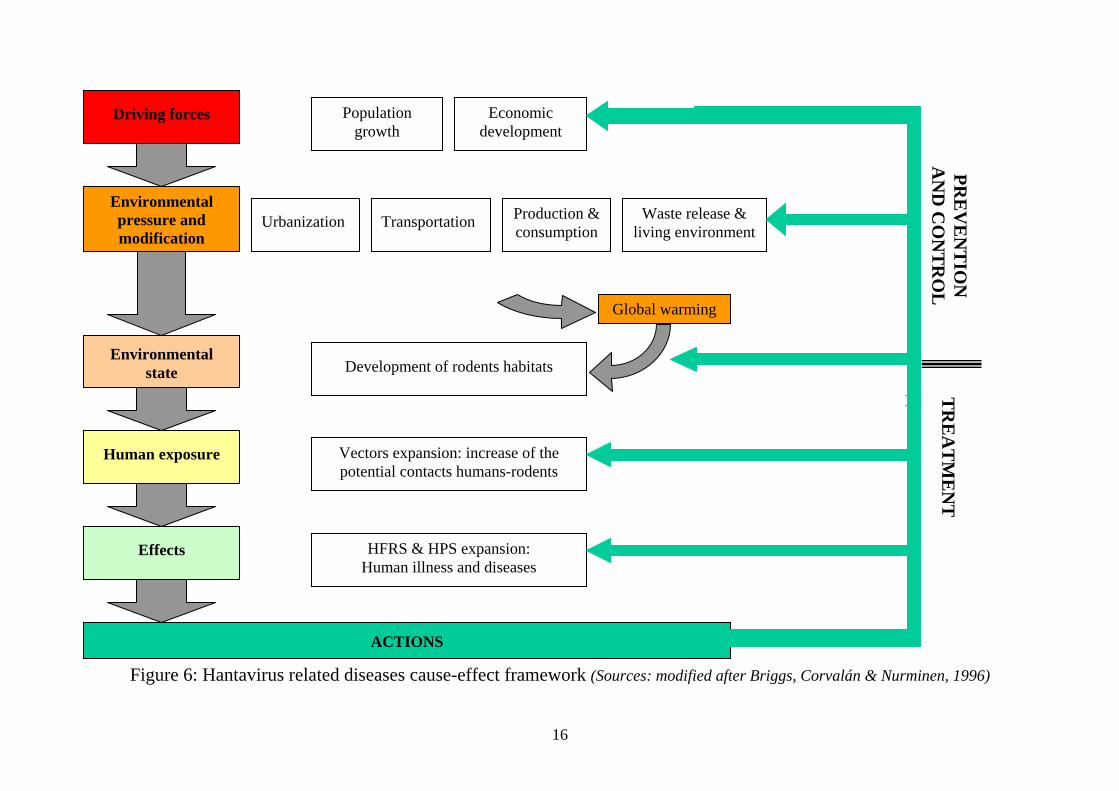
2.4.1.5.Synthesis. We can now synthesize this information in a cause-effect diagram as the WHO proposes it. The relationships between environment and hantavirus related diseases are highly complex because of the difficulty to find the real causes (physical, economic and social parameters…), to understand the interrelationships between causes and their dynamics in the space and time. In this diagram we’ll try to understand on which parameters actions should be taken to prevent emergence of hantavirus related diseases (see diagram next page).
16
Figure 6: Hantavirus related diseases cause-effect framework (Sources: modified after Briggs, Corvalán & Nurminen, 1996)
Population growth
Economic development
Urbanization Production & consumption
HFRS & HPS expansion: Human illness and diseases
Global warming
Development of rodents habitats
Vectors expansion: increase of the potential contacts humans-rodents
Transportation Waste release & living environment
Driving forces
Environmental pressure and modification
Environmental state
Human exposure
Effects
PRE
VE
NT
ION
A
ND
CO
NT
RO
L
TR
EA
TM
EN
T
ACTIONS

17
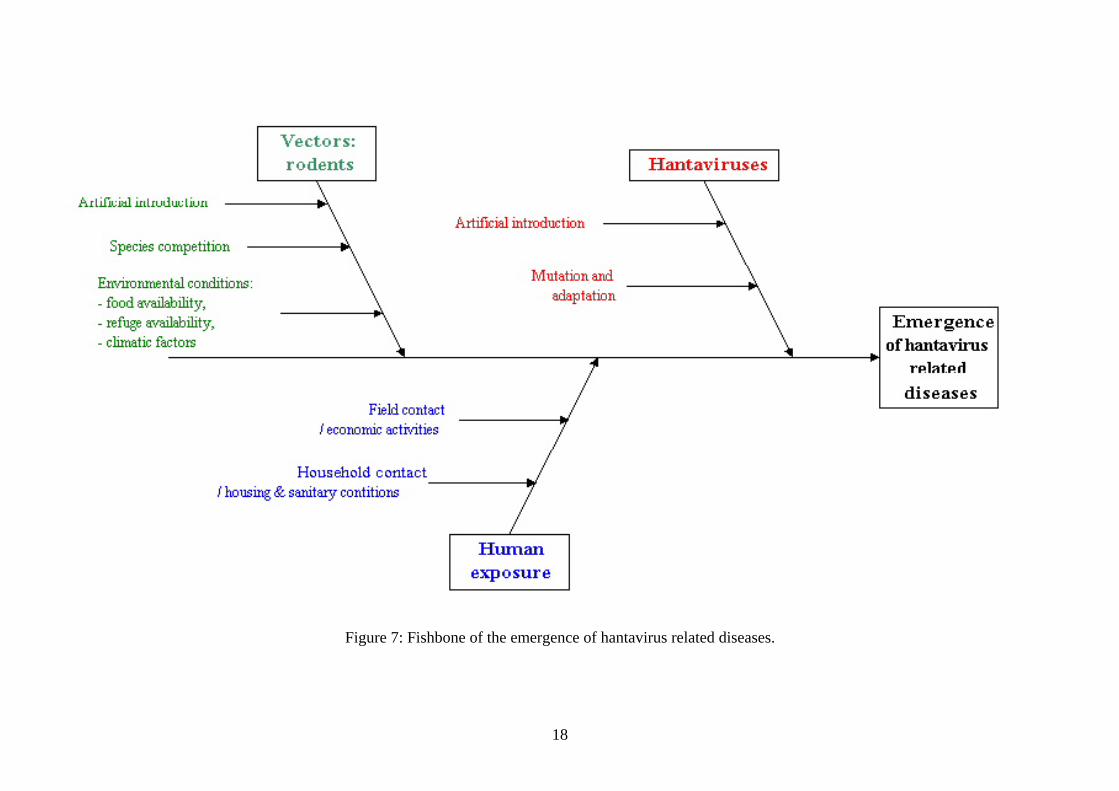
2.4.2. Understanding the emergence of hantaviruses. To understand the emergence of hantaviruses, we have to consider three parameters, which are hantaviruses themselves but also the rodents and the place of human. Then we can draw a fishbone in order to approach the concept of emergence by identifying every cause. These causes will help us to determine and choose later the variables.
- Hantaviruses: o The viruses can already be present into the biotope but the diseases not
emerging if the necessary conditions of the emergence are not satisfied. o The viruses can be artificially introduced into the biotope by human actions.
The economic development and especially the transportation are the main causes.
o The viruses can emerge following mutations and adaptations to the environment and to the potential rodents present.
This study will focus on rodents, the vectors of hantaviruses.
- Vectors: o The vectors can also be introduced artificially into a biotope where they’re
likely to live. o The presence of rodents is related to the ecosystem: the food availability
(plants and small animals), the capacity to find or build refuge (improved habitat is associated with improved reproductive success and survivorship), the climatic conditions, the presence of predators.
o Finally one species will emerge among others following species competition.
- Human exposure:
The human exposure is linked to human activities (economic and social factors), the living conditions (social factors) and also the population characteristics (demographic factors) and dynamics (in particularly the urbanization).
18
Figure 7: Fishbone of the emergence of hantavirus related diseases.

19
2.4.3. State in Thailand.
2.4.3.1.Vectors identified. The study of rodents throughout Thailand has identified 18 different species of rats or mice. These rodents have been trapped and analyses have then been conducted to identify potential viruses. These species should be potential vectors for hantaviruses.
Table 3: Rodents identified in Thailand:
Thai rodents
Species Number of
samples % of total
rodents trapped
Rodents with
medical interest
Ecology
Bandicota indica 212 20.8 * wild, agricultural Bandicota salvei 27 2.74 Mus caroli 40 3.9 Mus castaneus 19 1.9 Mus cervicolor 31 3.0 Mus shortridgei 8 0.8 Rattus argentiventer 8 0.8 Rattus b. bukit 1 0.1 Rattus cremoriventer 2 0.2 Rattus exulans 403 39.5 * both agricultural and domestic Rattus losea 6 0.6 Rattus nitidus 1 0.1 Rattus norvegicus 55 5.4 * domestic Rattus rattus 157 15.4 * domestic Rattus surifer 3 0.3 not clearly identified 14 1.4 TOTAL 987 100.0 The two main species trapped are Bandicota indica (21% of all species) and Rattus exulans (40%). We already know that the first one, the Bandicoot rat, is the vector of a THAI hantavirus (see table 1).
2.4.3.2.Presence of hantaviruses. From these 18 different rodents species, the analyses have found some hantaviruses. Four rodents have been identified, positive to hantavirus ELISA test. The study will then focus on these four rodents species (description referring to Marshall (1977) and Chaimanee (1998)):
- Bandicota indica (Bandicoot rats):

20
Classification: Rodentia, family: Muridae, genus: Bandicota (Gray, 1873),
Figure 8: Range of Bandicota indica in Thailand
o Description:
head and body length: 160-360 mm, tail length: 130-258 mm, coloration of upper parts: from light grayish to various shades of brown or
almost black, coloration of lower parts: dirty white, ferocious nature.
o Habitat: Grassland or anthropic deforested areas converted to agriculture, common
in low-land rice fields never in our around dwellings, good swimmers and divers, good diggers: the burrow may extend to a depth of 60 cm and contains
enlarged chambers used for nesting and food storage, stay in elaborate burrows at the edge of fields, in dikes and streams banks,
and even in city streets, omnivorous in diet but in some areas can feed largely on products of
cultivation, such as rice, grains, sugar cane historical presence: very late immigration into Thailand, spread relating to
the development of agriculture. o Living distribution: throughout Thailand.
- Rattus:
o Classification: Rodentia, family: Muridae, genus: Rattus (Fischer, 1803), subgeni: • Rattus norvegicus (Norway rat, Brown rat), • Rattus rattus (black rat, roof rat, house rat), • Rattus exulans (Polynesian rat). Rattus is the mammalian genus, which have the greatest number of species (56). Nine species of rattus have been found during the survey.
o Description:
head and body length: 80-300 mm, tail length: vary by species, from shorter to much longer than head and
body length,

21
coloration of upper parts: great variety of black, brown, gray, yellow, orange, and red shades,
coloration of lower parts: white or grayish, o Habitat: generally shelter in such places as burrows, under rocks, in logs, and in
piles of rubbish. They are omnivorous and eat a wide variety of plant and animal matter. Rattus rattus and Rattus norvegicus eat everything that people eat and much else.
Rattus norvegicus: o in urban areas, o in human neglected places, o like humidity, o ground dweller, o burrows with long branching tunnels, o in buildings, generally live in lowers floors, basements or
cellars o also occupy sewers and rubbish heaps,
Rattus rattus: o in urban areas, o in human neglected places, o dislike humidity o extremely agile climber, which is then found inside
buildings, in the dry upper floors. Rattus exulans:
o in houses and rice fields o in close association with humans,
o Living distribution: throughout Thailand.
Figure 9: Range of Rattus norvegicus in
Thailand.
Rattus norvegicus: known over much
of the world for its destruction of property and stored food, and its threats to the health and safety of people, domestic animals, and wildlife.

22
Figure 10: Range of Rattus rattus in Thailand.
Figure 11: Range of Rattus exulans in
Thailand.
Rattus rattus: responsible for the spread of disease and immense agricultural losses.
Rattus exulans: carried over Southeast Asia in association with early human migrations, and now considered as a menace to health and agriculture.
Some hantaviruses were identified in these four species only but these four species were also the four main species trapped. Then we should not conclude that the other species are not able to be hantaviruses vectors. We can also notice that Rattus norvegicus found positive in Thailand is known as the main vector for the hantavirus Seoul causing HFRS in different parts of the world. Then there is a potential for HFRS presence.
23
3. Methodology: from habitats to human exposure risk.
3.1. Synchronic approach of environmental parameters. The first step is to define all the parameters (physical, human, social,), which describe the presence of a given rodent. These parameters will help to define the localization of this rodent at a given date in a synchronic approach.
3.1.1. Physical parameters.
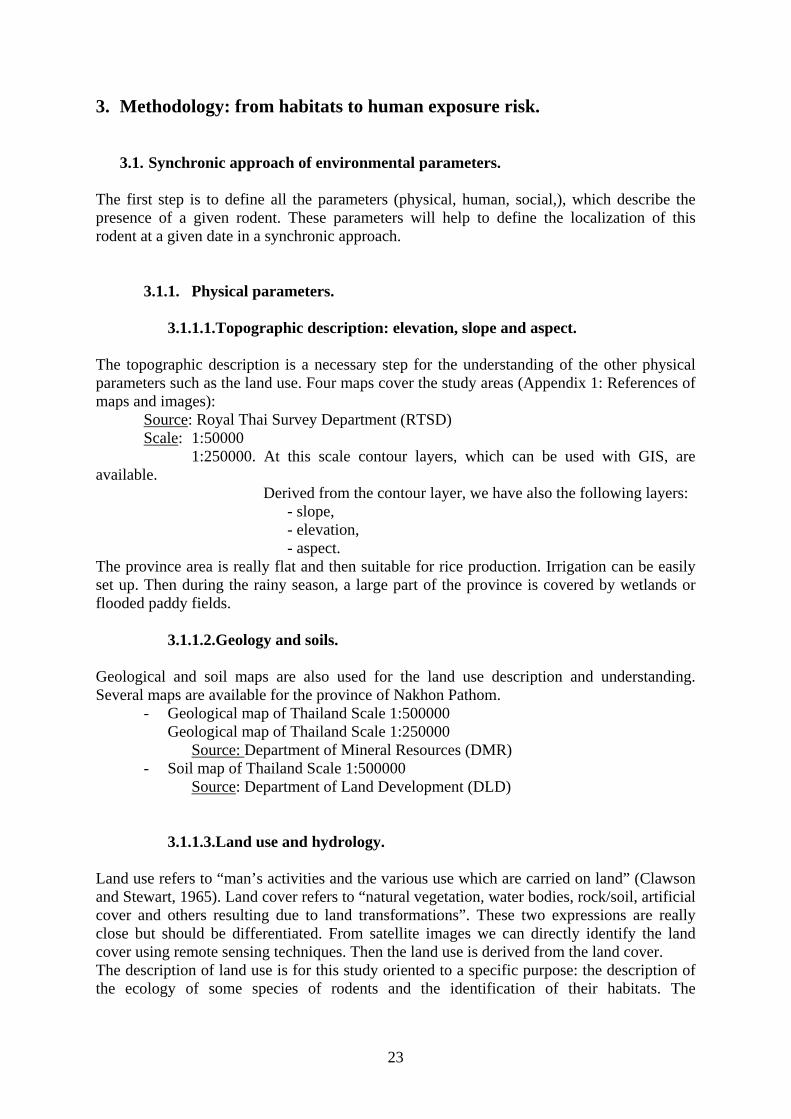
3.1.1.1.Topographic description: elevation, slope and aspect. The topographic description is a necessary step for the understanding of the other physical parameters such as the land use. Four maps cover the study areas (Appendix 1: References of maps and images):
Source: Royal Thai Survey Department (RTSD) Scale: 1:50000 1:250000. At this scale contour layers, which can be used with GIS, are available. Derived from the contour layer, we have also the following layers: - slope, - elevation, - aspect. The province area is really flat and then suitable for rice production. Irrigation can be easily set up. Then during the rainy season, a large part of the province is covered by wetlands or flooded paddy fields.
3.1.1.2.Geology and soils. Geological and soil maps are also used for the land use description and understanding. Several maps are available for the province of Nakhon Pathom.
- Geological map of Thailand Scale 1:500000 Geological map of Thailand Scale 1:250000
Source: Department of Mineral Resources (DMR) - Soil map of Thailand Scale 1:500000
Source: Department of Land Development (DLD)
3.1.1.3.Land use and hydrology. Land use refers to “man’s activities and the various use which are carried on land” (Clawson and Stewart, 1965). Land cover refers to “natural vegetation, water bodies, rock/soil, artificial cover and others resulting due to land transformations”. These two expressions are really close but should be differentiated. From satellite images we can directly identify the land cover using remote sensing techniques. Then the land use is derived from the land cover. The description of land use is for this study oriented to a specific purpose: the description of the ecology of some species of rodents and the identification of their habitats. The

24
classification is then related to what we can observe on the images and what we want to obtain to describe these habitats.
3.1.1.3.1. Materials and techniques to describe the land use. The land cover description has been realized using remote sensing techniques. Satellite images provide a synoptic view, which allows delineating the land use classes and also their spatial distribution. This provides a large view of the study area, the whole province of Nakhon Pathom. We can differentiate the occupations and then establish some correlations between different regions. For this purpose I used a LANDSAT 5 TM image (see references in Appendix 1 and image in Figure 13, next page) taken in June 11th 1997. The resolution of thus image, which is 30 meters for one pixel, is quite low but convenient relating to the huge study area (2168 km2). I analyzed the image with Multiscope 3.1, a remote sensing software developed by EADS Matra, which provides also photo interpretation tools and a set of GIS functions.
Figure 12: View of the window of Multiscope3.1 during the processing of the classification.

25
Figure 13: LANDSAT image.

26
The aim of this analysis was to derive from the LANDSAT image a land use cover that I can export later as a vector cover and intersect it with other layers into a GIS software. I needed to obtain a cover where each occupation is clearly defined by polygons and not mixed as usually it is after the process of supervised or unsupervised classification functions. Multiscope offers to “vectorize” homogeneous areas around a selected pixel using a Magic wand.
Figure 14: Result of a large magic wand selection in a paddy field area, using Multiscope 3.1.
The homogeneous pixels can be computed with four different algorithms:
- RGB algorithm: based on the pixel value on the three planes, - Intensity algorithm: analyzing the intensity value of each pixel, - Hue: considering hue values,
Magic wand selection
27
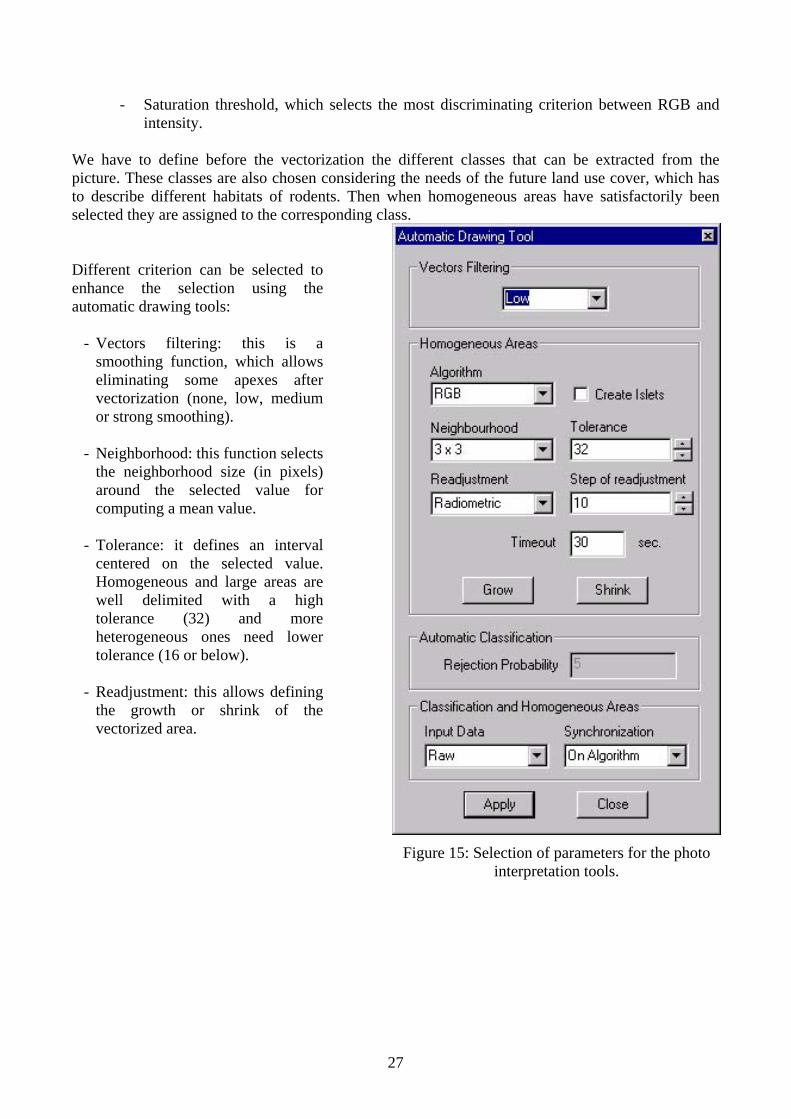
- Saturation threshold, which selects the most discriminating criterion between RGB and intensity.
We have to define before the vectorization the different classes that can be extracted from the picture. These classes are also chosen considering the needs of the future land use cover, which has to describe different habitats of rodents. Then when homogeneous areas have satisfactorily been selected they are assigned to the corresponding class. Different criterion can be selected to enhance the selection using the automatic drawing tools:
- Vectors filtering: this is a smoothing function, which allows eliminating some apexes after vectorization (none, low, medium or strong smoothing).
- Neighborhood: this function selects
the neighborhood size (in pixels) around the selected value for computing a mean value.
- Tolerance: it defines an interval
centered on the selected value. Homogeneous and large areas are well delimited with a high tolerance (32) and more heterogeneous ones need lower tolerance (16 or below).
- Readjustment: this allows defining
the growth or shrink of the vectorized area.
Figure 15: Selection of parameters for the photo
interpretation tools.

28
3.1.1.3.2. Land use classification. See Figure 15: Land use classification, next page. Processing Multiscope tools on the LANDSAT image of Nakhon Pathom, I could classify the land use into 14 classes. The name of each class comes from the land use classification realized by the Thai Department of Land Development. The 14 classes are in alphabetical order:
- Grasslands: this first class describes lawns and associated artificial grasslands. In Nakhon Pathom province the main related areas are the aerodrome in the north-east part of the province, Kasetsart and Mahidol University and some golf courses. This is not a class where we expect to find the greatest number of rats because these places are clean and will provide fewer sources of food.
- Bare lands: on satellite images we can easily define bare lands where we can observe the soil. Bare lands are generally unused agricultural areas and also dry lands. These areas are often transitions lands between agricultural and urban regions and then they are privileged places for rats to dig burrows.
- Crops: The north-east part of the province is a large dry agricultural area for crops. This is a homogeneous surface, which can be easily delimited with remote sensing tools.
- Fisheries: we can find in the south-west part of the province a large area of ponds mainly used for fish farming (shrimp farms).
- Flooded fields: this class groups together agricultural flooded fields, which differ from water bodies grouped in another class. Of course most of them are paddy fields.
- Mixed culture: all the agricultural fields, which cannot be classified into the other categories, are attributed to this class. Then it is a heterogeneous one that is found in transition between urban and large agricultural areas where agricultural activities are not specialized.
- Main roads: the 30-meter resolution is to low to delimit the main roads and, in Nakhon Pathom, this class only describes the aerodrome tracks in the north-east part.
- Paddy (high vegetation): this class describes the last step of paddy fields where we have high plants.
- Paddy (intermediate): paddy fields characterized by an intermediate state are grouped here. We can see on the image both vegetation and water.
- Suburban: this is a transitory class between the urban and rural classes. It’s always characterized by a great heterogeneity.
- Plantation: this class corresponds to a homogeneous area in the south-east province, near the Nakhon Chaisi River.
- Streams and rivers: for the same reason encountered with the “main road” class, this class cannot delimit every stream and is simply reduced to Nakhon Chaisi River, which is the main one, crossing the province from north to south.
- Urban and built-up lands: this class groups together the main cities and villages, which can be delimited by bright pixels (gray variants or white), characteristics of concrete, tarmac and artificial area. This is quite a homogeneous class, in which there are some pixels characteristics of grass or trees.
- Water bodies: Piece of water and small one as well can easily be delimited. They are grouped together in this class as homogeneous dark areas.

29
Figure 16: Land use classification.

30
Table 4: Repartition of each land use class in Nakhon Pathom province:
Land use classes % area Grassland 1.69 Bare lands 3.24 Crops 24.34 Fisheries 1.42 Flooded fields 23.24 Main roads 0.06 Mixed agriculture 12.13 Paddy (high vegetation) 15.03 Paddy (intermediate) 4.21 Suburban 6.70 Plantations 1.25 Streams and rivers 0.42 Urban and built-up lands 5.82 Water bodies 0.44 Total 100
Figure 17: Land use classes in Nakhon Pathom province.
The province of Nakhon Pathom is mainly agricultural (83,5% of the total area) and especially dedicated to rice production, because if we group together the three states of paddy (flooded, intermediate and high vegetation), they represent 42,5% of the total area. Multiscope software allows creating a vector cover of the land cover. Then we have to export and make it usable by GIS software. First we have to process the georeferencing using the dedicated module and later to export the layer with all classes or class by class. Inside the GIS software the cover has been rebuilt in order to have no polygon superimposed on one another.
12.13
15.03
4.21
5.82
24.34
1.42
23.240.06
0.443.24
1.69
6.701.25
0.42Grasslands
Bare lands
Crops
Fisheries
Flooded fields
Main roads
Mixed agriculture
Paddy (high vegetation)
Paddy (intermediate)
Suburban
Plantations
Streams and rivers
Urban and built-up lands
Water bodies

31
3.1.2. Human parameters. The human environment conditions the physical environment. Social and cultural factors that affect health include overcrowding, low income, access to education, inadequate diet, social instability, and insecurity. Poverty is the most serious threat to health in cities and rural areas alike. The socioeconomic data come from the National Rural Development Committee (NRD2C) and the census was realized in 1994.
3.1.2.1.Demographic parameters. The demographic indicators should describe the human exposure to hantaviruses. As we have shown this in the fishbone describing the emergence of hantavirus, the human exposure is correlated to the population density, the dynamics of cities or urbanization and the housing conditions.
3.1.2.1.1. Population density. See Figure 18: Map of population density in Nakhon Pathom province. According to the UN, the population density is the ratio of population to the area. That shows the concentration of population in a given area. This indicator is important for the study because the concentration of people influences in particularly the water quality and the amount of solid waste, which will be causes of the presence of rodents. The associated map indicates the human density per sub-district. The density is calculated as the ratio of population to the area as follows:
Density = (Number of people / surface area) * 106 inhabitant per sq. km. Data source: These data come from the National Rural Development Committee (NRD2C) and are given at the sub-district level (tambon). 4 sub-districts are missing then 96 sub-districts are used for the study.
Table 5: Characteristics of the map of population density:
Statistical analysis Value (person/sq. km) Maximum 1290 Minimum 36 Average 306 Median 263 Standard deviation 208

32
Figure 18: Population density.
33
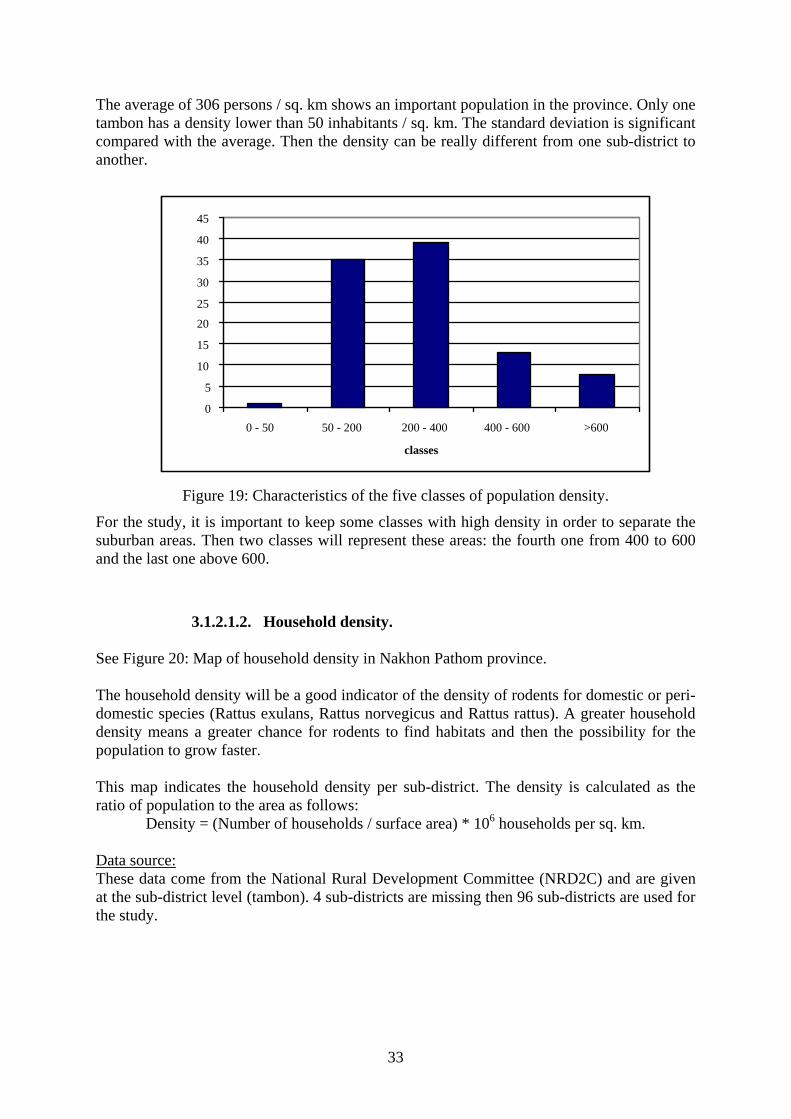
The average of 306 persons / sq. km shows an important population in the province. Only one tambon has a density lower than 50 inhabitants / sq. km. The standard deviation is significant compared with the average. Then the density can be really different from one sub-district to another.
Figure 19: Characteristics of the five classes of population density.
For the study, it is important to keep some classes with high density in order to separate the suburban areas. Then two classes will represent these areas: the fourth one from 400 to 600 and the last one above 600.
3.1.2.1.2. Household density. See Figure 20: Map of household density in Nakhon Pathom province. The household density will be a good indicator of the density of rodents for domestic or peri-domestic species (Rattus exulans, Rattus norvegicus and Rattus rattus). A greater household density means a greater chance for rodents to find habitats and then the possibility for the population to grow faster. This map indicates the household density per sub-district. The density is calculated as the ratio of population to the area as follows:
Density = (Number of households / surface area) * 106 households per sq. km. Data source: These data come from the National Rural Development Committee (NRD2C) and are given at the sub-district level (tambon). 4 sub-districts are missing then 96 sub-districts are used for the study.
0
5
10
15
20
25
30
35
40
45
0 - 50 50 - 200 200 - 400 400 - 600 >600
classes

34
Figure 20: Household density.

35
Table 6: Characteristics of the map of household density:
Statistical analysis Value (households/sq. km) Maximum 480 Minimum 6 Average 64 Median 50 Standard deviation 63
The average of 50 households / sq. km is also low and shows deserted rural areas. The standard deviation is almost equal to the average because of a regular distribution of the household density per tambon. Then there is a great diversity between tambons.
Figure 21: Characteristics of the five classes of household density.
This indicator will allow segregating the desert areas. But this indicator isn’t sufficient because it doesn’t reflect the level of development. We have to find other parameters, which can describe the sanitary conditions.
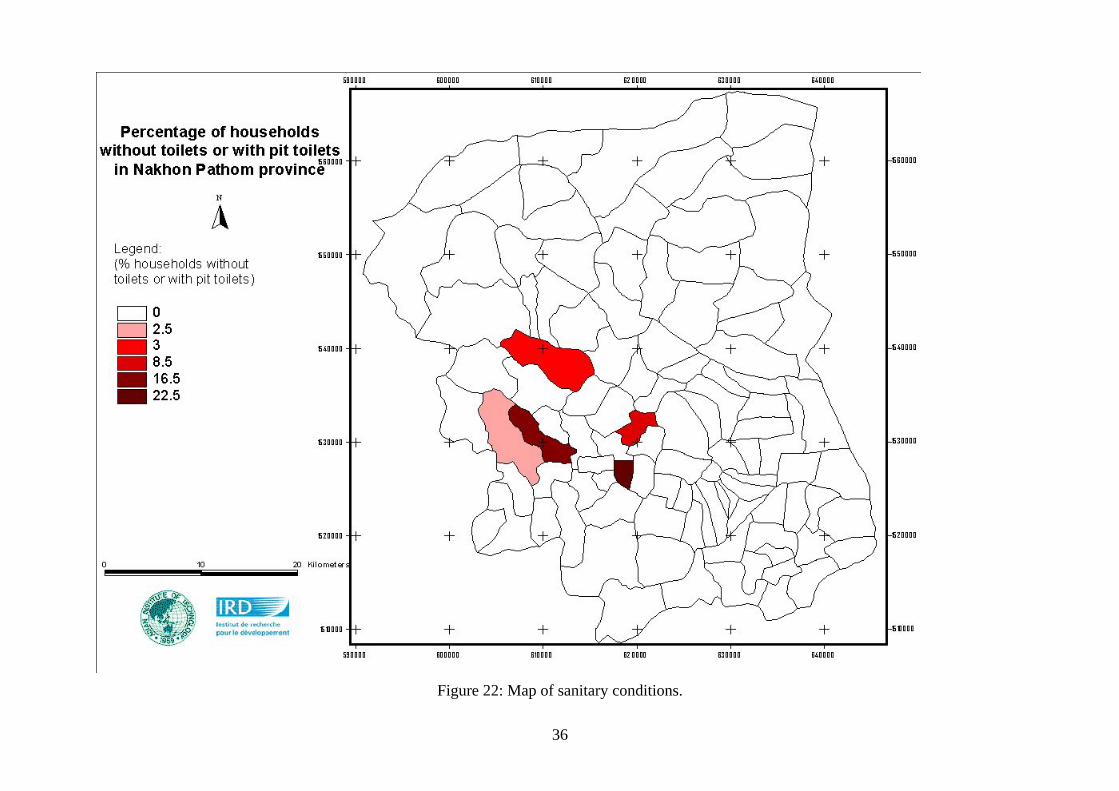
3.1.2.2.Sanitary parameters. The development of rodents’ populations is linked to the food availability and the refuge availability, which will depend on economic and social human conditions. These factors are difficult to assess and integrate into a geographical analysis and we have to choose the most suitable descriptive data. Sanitary and housing living conditions can be described by the kind of toilets found inside the quarters. From the National Rural Development Committee (NRD2C) we have the percentage of households without any toilets and the percentage of households with pit toilets. The data are given at the sub-district level (tambon level). A few sub-districts differ from the sanitary aspect. See Figure 22: Percentage of households with pit toilets or without toilets in Nakhon Pathom province.
0
10
20
30
40
50
60
0 - 50 50 - 100 100 - 200 200 - 400 > 400
classes
36
Figure 22: Map of sanitary conditions.

37
3.2. Integration of the environmental parameters to model the presence of rodents and then the exposure to hantavirus related diseases.
Each parameter makes up a cover for the GIS. For a given point the GIS will inform the physical, demographic, social and economic parameters, and also their spatial description. The information from the disease survey and especially the rodents survey will be associated later.
- Firstly, after the description of the ecology of the four species with medical importance for hantavirus in Thailand I can identify the parameters defining the presence of each rodent.
- Secondly, I will model the presence of each rodent using the rodents’ sampling data,
which show the importance of each parameter. This modeling will allow to spatially define the distribution of rodents.
- Finally, from the regional distribution of each rodent, we will be able to evaluate the
potential risks for humans. This will involve the knowledge of the hantaviruses present (from the hantaviruses found in the rodents analysis) and the assessment of the human presence close to these vectors (either field or household contacts).
See figure 23, next page: Principles of spatial analysis of vector biology assessing the vector presence and the risks to contract the diseases. Then the objectives are to delimit coherent regions, which express same characteristics of the presence of a given rodent and further the emergence of hantavirus related diseases. Different regions can show different reasons of emergence.

38
Figure 23: Principles of spatial analysis of vector biology assessing the vector presence and the risks to contract the diseases.

39
3.3. Zonation of the distribution of each rodent and assessment of the human exposure to hantavirus related diseases.
Among the rodents trapped in Nakhon Pathom province since 1998, 390 belong to the four species studied: Bandicota indica (44% of these four species), Rattus exulans (15%), Rattus norvegicus (14%) and Rattus rattus (27%). The rodents have been trapped around eight different points, which have been geographically referenced with a GPS. Practical reasons and not ecological ones guided the choice of the sampling points. Around these points the traps were disposed within a radius of 20 meters, inside or outside houses. For each rodents caught many data have been recorded:
- physiological data: relating to the animal itself, - medical data: relating to the diseases eventually carried, - ecological data: relating to the location of the trap.
The ecological data from the sampling are for us the basis data to set up a model assessing the presence of each rodent. At first we use the description of the catching place.
3.3.1. Catching place and differentiation between domestic and wild species. For each rodent, the catching place has been recorded into three classes:
- Inside houses, which correspond to domestic species. - Outside houses, but in the neighborhood of houses, where we find domestic or peri-
domestic species. - Outside villages, where are caught wild species.
Table 7: Repartition of each species by the catching place.
Bandicota indica Rattus exulans Rattus norvegicus Rattus rattus number % number % number % number %
Outside villages 117 74.5 0 0.0 16 29.1 4 5.8
Inside houses 7 4.5 42 95.4 15 27.3 31 44.9
Outside houses 33 21.0 2 4.5 24 43.6 34 49.3
Total 157 100.0 44 100.0 55 100.0 69 100.0
40
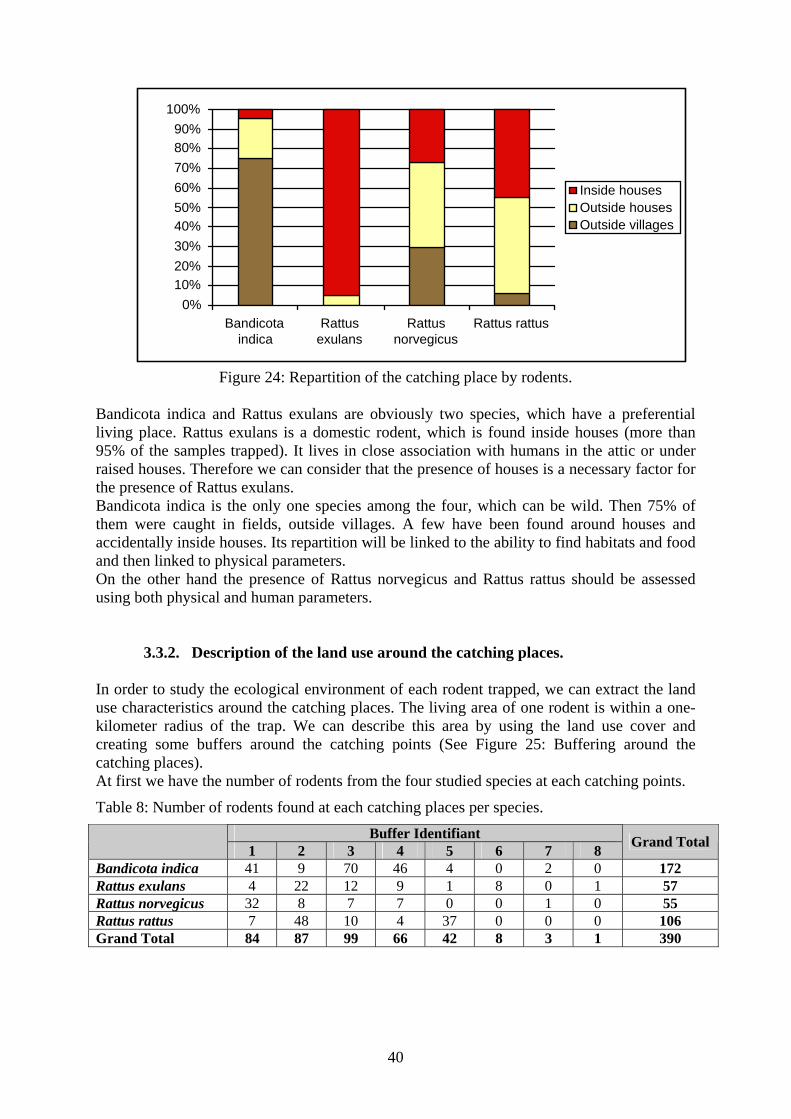
Figure 24: Repartition of the catching place by rodents. Bandicota indica and Rattus exulans are obviously two species, which have a preferential living place. Rattus exulans is a domestic rodent, which is found inside houses (more than 95% of the samples trapped). It lives in close association with humans in the attic or under raised houses. Therefore we can consider that the presence of houses is a necessary factor for the presence of Rattus exulans. Bandicota indica is the only one species among the four, which can be wild. Then 75% of them were caught in fields, outside villages. A few have been found around houses and accidentally inside houses. Its repartition will be linked to the ability to find habitats and food and then linked to physical parameters. On the other hand the presence of Rattus norvegicus and Rattus rattus should be assessed using both physical and human parameters.
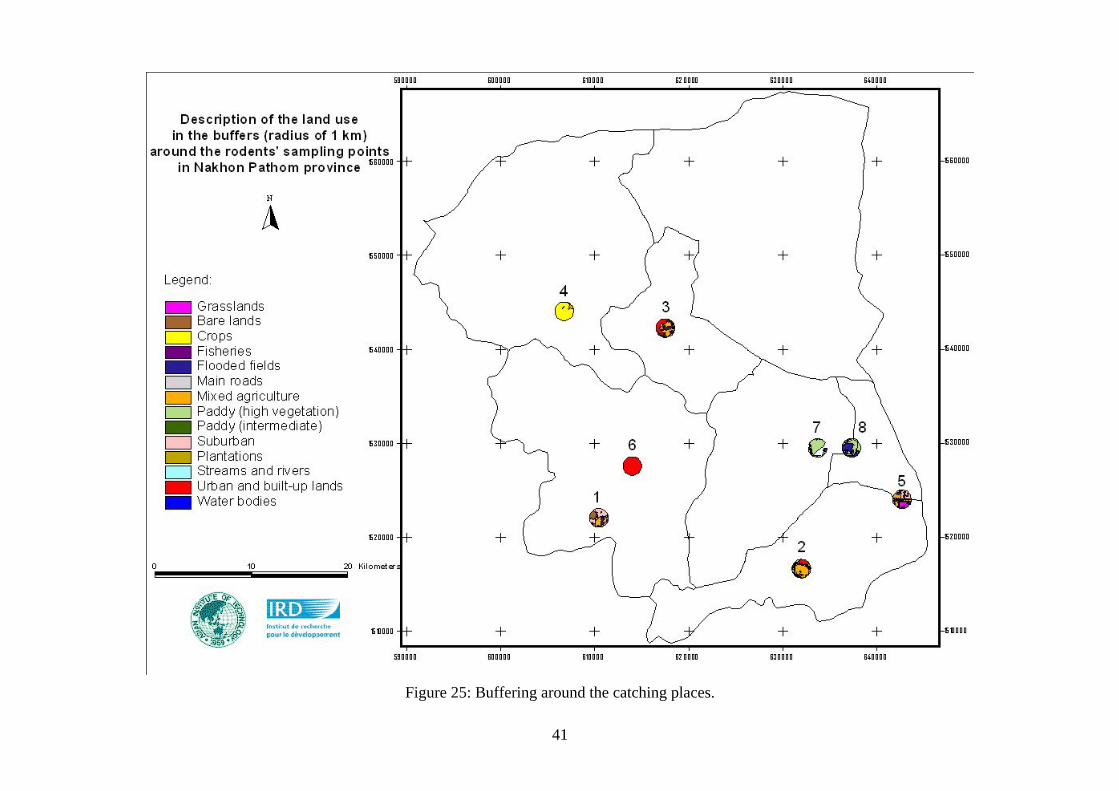
3.3.2. Description of the land use around the catching places. In order to study the ecological environment of each rodent trapped, we can extract the land use characteristics around the catching places. The living area of one rodent is within a one-kilometer radius of the trap. We can describe this area by using the land use cover and creating some buffers around the catching points (See Figure 25: Buffering around the catching places). At first we have the number of rodents from the four studied species at each catching points.
Table 8: Number of rodents found at each catching places per species. Buffer Identifiant
1 2 3 4 5 6 7 8 Grand Total
Bandicota indica 41 9 70 46 4 0 2 0 172 Rattus exulans 4 22 12 9 1 8 0 1 57 Rattus norvegicus 32 8 7 7 0 0 1 0 55 Rattus rattus 7 48 10 4 37 0 0 0 106 Grand Total 84 87 99 66 42 8 3 1 390
0%10%20%30%40%50%60%70%80%90%
100%
Bandicotaindica
Rattusexulans
Rattusnorvegicus
Rattus rattus
Inside housesOutside housesOutside villages
41
Figure 25: Buffering around the catching places.
42
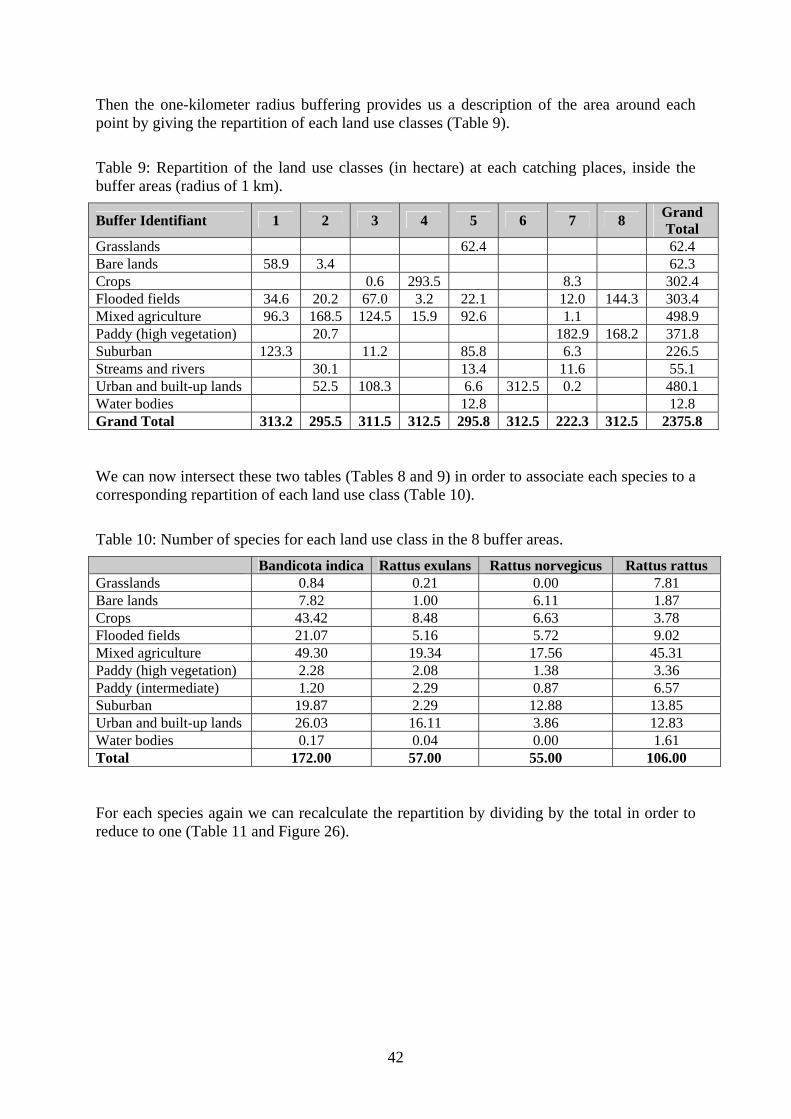
Then the one-kilometer radius buffering provides us a description of the area around each point by giving the repartition of each land use classes (Table 9).
Table 9: Repartition of the land use classes (in hectare) at each catching places, inside the buffer areas (radius of 1 km).
Buffer Identifiant 1 2 3 4 5 6 7 8 Grand Total
Grasslands 62.4 62.4 Bare lands 58.9 3.4 62.3 Crops 0.6 293.5 8.3 302.4 Flooded fields 34.6 20.2 67.0 3.2 22.1 12.0 144.3 303.4 Mixed agriculture 96.3 168.5 124.5 15.9 92.6 1.1 498.9 Paddy (high vegetation) 20.7 182.9 168.2 371.8 Suburban 123.3 11.2 85.8 6.3 226.5 Streams and rivers 30.1 13.4 11.6 55.1 Urban and built-up lands 52.5 108.3 6.6 312.5 0.2 480.1 Water bodies 12.8 12.8 Grand Total 313.2 295.5 311.5 312.5 295.8 312.5 222.3 312.5 2375.8 We can now intersect these two tables (Tables 8 and 9) in order to associate each species to a corresponding repartition of each land use class (Table 10).
Table 10: Number of species for each land use class in the 8 buffer areas. Bandicota indica Rattus exulans Rattus norvegicus Rattus rattus
Grasslands 0.84 0.21 0.00 7.81 Bare lands 7.82 1.00 6.11 1.87 Crops 43.42 8.48 6.63 3.78 Flooded fields 21.07 5.16 5.72 9.02 Mixed agriculture 49.30 19.34 17.56 45.31 Paddy (high vegetation) 2.28 2.08 1.38 3.36 Paddy (intermediate) 1.20 2.29 0.87 6.57 Suburban 19.87 2.29 12.88 13.85 Urban and built-up lands 26.03 16.11 3.86 12.83 Water bodies 0.17 0.04 0.00 1.61 Total 172.00 57.00 55.00 106.00 For each species again we can recalculate the repartition by dividing by the total in order to reduce to one (Table 11 and Figure 26).
43
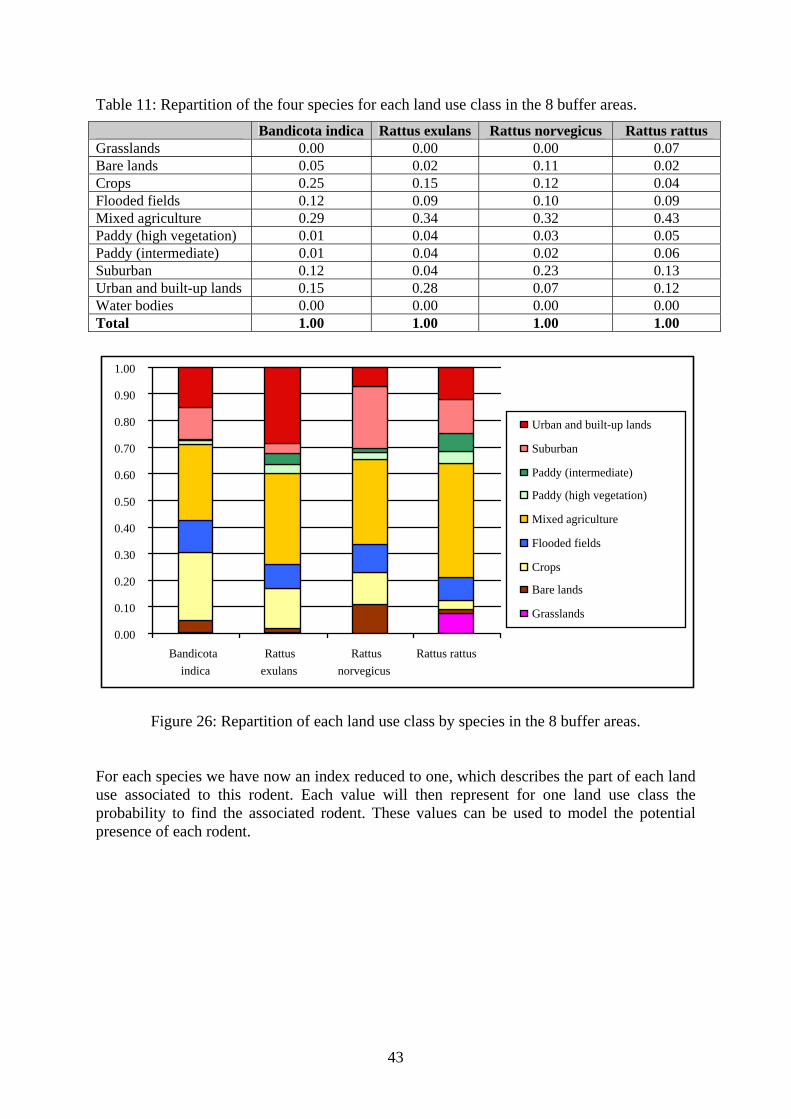
Table 11: Repartition of the four species for each land use class in the 8 buffer areas. Bandicota indica Rattus exulans Rattus norvegicus Rattus rattus
Grasslands 0.00 0.00 0.00 0.07 Bare lands 0.05 0.02 0.11 0.02 Crops 0.25 0.15 0.12 0.04 Flooded fields 0.12 0.09 0.10 0.09 Mixed agriculture 0.29 0.34 0.32 0.43 Paddy (high vegetation) 0.01 0.04 0.03 0.05 Paddy (intermediate) 0.01 0.04 0.02 0.06 Suburban 0.12 0.04 0.23 0.13 Urban and built-up lands 0.15 0.28 0.07 0.12 Water bodies 0.00 0.00 0.00 0.00 Total 1.00 1.00 1.00 1.00
Figure 26: Repartition of each land use class by species in the 8 buffer areas.
For each species we have now an index reduced to one, which describes the part of each land use associated to this rodent. Each value will then represent for one land use class the probability to find the associated rodent. These values can be used to model the potential presence of each rodent.
0.00
0.10
0.20
0.30
0.40
0.50
0.60
0.70
0.80
0.90
1.00
Bandicotaindica
Rattusexulans
Rattusnorvegicus
Rattus rattus
Urban and built-up lands
Suburban
Paddy (intermediate)
Paddy (high vegetation)
Mixed agriculture
Flooded fields
Crops
Bare lands
Grasslands

44
3.3.3. Index by species
3.3.3.1.Bandicota indica. Considering the ecology and the description of the catching places of Bandicota indica, the presence of this species can be directly assessed from the type of land use. This is a field species, which was rarely found inside (4.5%) or around houses (21%). The index assessing the presence of Bandicota indica is then deducted from the percentage of rats found in each class of land use (see Table 11). From the previous results we have this index not in percentage but from 0 to 1 (Table 12, second column) with a maximum of 0.29 for the “mixed agriculture” class. To build an index of presence going from 0 to 1, we can divide this first one by the maximum (0.29). Then the “mixed agriculture” class is affected by the index 1, which is meaning a high probability to find Bandicota indica.
Table 12: Index for the potential presence of Bandicota indica:
Land use classes Bandicota indica Relative index (from 0 to 1)
Grasslands 0.00 0 Bare lands 0.05 0.17 Crops 0.25 0.86 Flooded fields 0.12 0.41 Mixed agriculture 0.29 1 Paddy (high vegetation) 0.01 0.03 Paddy (intermediate) 0.01 0.03 Suburban 0.12 0.41 Urban and built-up lands 0.15 0.52 Water bodies 0.00 0 Total 1.00
Corresponding index: Bi-physical Bi-physical2 Index of potential presence of Bandicota indica:
Bi = Bi-physical2 Equation 1
Using the map of land use and this index Bi we can now realize the map of the potential presence of Bandicota indica in Nakhon Pathom province. To visualize the results I classified the values in five equidistant classes (Figure 27).

45
Figure 27: Potential presence of Bandicota indica.

46
3.3.3.2.Rattus exulans. 95% of Rattus exulans caught during the sampling was living inside houses. It’s a domestic species then its ecology is linked to human parameters. The integration of land use data to assess the presence of this rat should be done by considering the human presence. Then the classes where it is impossible to find houses will be affect with a coefficient of 0. The urban class will have the highest coefficient (0.8) and a lower for the suburban one (0.6) corresponding to the house density. The other categories will be affected indifferently by a coefficient of 0.2. Then we obtain the physical parameter:
Table 13: Index describing the physical parameter of Rattus exulans: Land use classes Rattus exulans
Grasslands 0.2 Bare lands 0.2 Crops 0.2 Fisheries 0 Flooded fields 0 Main roads 0 Mixed agriculture 0.2 Paddy (high vegetation) 0.2 Paddy (intermediate) 0 Suburban 0.6 Plantation 0.2 Streams and rivers 0 Urban and built-up lands 0.8 Water bodies 0
Corresponding index: Re-physical We have now to integrate the human data describing more precisely the household density. The highest household density means logically the highest probability to find Rattus exulans. It is the human parameter. To obtain again an index from 0 to 1 we will divide by the maximum value. Household density: Re-human = (Household density) / (max (household density))
= (Household density) / 480 Equation 2
Then we can associate these two parameters to define the index of potential presence: Index of potential presence of Rattus exulans:
Re = 1/2 (Re-physical + Re-human) Equation 3
This index describes the house density taking into account both land use and human characteristics and its values space out from 0 to 1. The map showing this index can now being displayed (Figure 28).

47
Figure 28: Potential presence of Rattus exulans.

48
3.3.3.3.Rattus norvegicus. Considering Table 7 Rattus norvegicus was found indifferently everywhere: 29.1% outside villages, 27.3% inside houses and 43.6% outside houses. Its presence should be assessed considering both physical and human parameters and the human parameter should now take into account every aspect that we can integrate: both population and sanitary.
Figure 29: Description of the building of the index of presence of Bandicota indica.
• Physical parameter:
The index describing the physical parameter is calculated as it was for Bandicota indica, taking the values extracted from the land use classification.
Table 14: Index for the physical parameter of Rattus norvegicus:
Land use classes Rattus norvegicus
Relative index (from 0 to 1)
Grasslands 0.00 0 Bare lands 0.11 0.34 Crops 0.12 0.37 Flooded fields 0.10 0.31 Mixed agriculture 0.32 1 Paddy (high vegetation) 0.03 0.09 Paddy (intermediate) 0.02 0.06 Suburban 0.23 0.72 Urban and built-up lands 0.07 0.22 Water bodies 0.00 0 Total 1.00
Corresponding index: Rn-physical Rn-physical2 • Human parameter:
For each subdivision of the index we will give an equal weight.
49
o Population parameters:
• Population density: Rn-pd = (Population density) / (max (population density))
= (Population density) / 1290 Equation 4
• Household density:
Rn-hd = (Household density) / (max (household density))
= (Household density) / 480 Equation 5
• Population parameter:
Rn-pop = 1/2 (Rn-pd + Rn-hd)
Rn-pop2 = (Rn-pop) / (max (Rn-pop)) Equation 6
o Social parameters:
Social = 1/2 [(% houses with pit toilets) / 100 + (% houses without toilets) / 100]
Social2 = (Social) / (max (Social)) Equation 7
o Human index:
Rn-human = 1/2 (Rn-pop2 + Social)
Rn-human2 = (Rn-human) / (max (Rn-human)) Equation 8
Then we can compute the physical and human parameters to assess the potential presence of Rattus norvegicus.
• Index of potential presence of Rattus norvegicus:
Rn = 1/2 (Rn-physical2 + Rn-human2) Equation 9
The map of the potential presence of Rattus norvegicus (Figure 30) represents this index Rn with again five equal classes from 0 to 1.

50
Figure 30: Potential presence of Rattus norvegicus.

51
3.3.3.4.Rattus rattus. The index Rr of the potential presence of Rattus rattus will be exactly calculated as it was for Rattus norvegicus. Only the physical parameter will differ from the other species.
• Physical parameter:
Table 15: Index for the physical parameter of Rattus rattus:
Land use classes Rattus rattus Relative index (from 0 to 1)
Grasslands 0.07 0.16 Bare lands 0.02 0.05 Crops 0.04 0.09 Flooded fields 0.09 0.21 Mixed agriculture 0.43 1 Paddy (high vegetation) 0.05 0.12 Paddy (intermediate) 0.06 0.14 Suburban 0.13 0.30 Urban and built-up lands 0.12 0.28 Water bodies 0.00 0 Total 1.00
Corresponding index: Rr-physical Rr-physical2
• Human parameter: •
Rr-human2 = Rn-human2 Equation 10
• Index of potential presence of Rattus rattus: •
Rr = 1/2 (Rr-physical2 + Rr-human2) Equation 11
The map of the potential presence of Rattus rattus (Figure 31) shows the index Rr with the five equal classes from 0 to 1.

52
Figure 31: Potential presence of Rattus rattus.

53
4. Results and discussion.
4.1. Bandicota indica. The map of the potential presence of Bandicota indica (Figure 27) clearly shows that it’s a field rat, which can be found almost everywhere. From this map we can calculate the area represented by each class (Figure 32).
Figure 32: Corresponding area for each class of potential presence of Bandicota indica.
Only three classes are represented. The first one (27.6% of all surfaces), which describes the areas with a low presence of Bandicota indica, corresponds to grasslands, plantations and wetlands. The second one (35.7% of all surfaces) groups together the urban and suburban areas. We know that Bandicota indica is also attracted by the human presence because humans mean for rodents the possibility to find food but among the four species studied it is the only one, which can be wild. The last class (36.6% of all surfaces) represents the agricultural fields themselves (crops or paddy) and some heterogeneous areas in transition between agricultural and urban classes. These areas are often bare lands or classed into mixed agriculture and are places where rats will find refuge in proximity to large fields. The presence of Bandicota indica should be precisely assessed if we consider we have only a low, a medium or a high probability to find the rats by knowing the land use. This constitutes only an approach, which should be explored by sampling in the areas corresponding to these three classes.
0.0
100.0
200.0
300.0
400.0
500.0
600.0
700.0
800.0
0-0.2 0.2-0.4 0.4-0.6 0.6-0.8 0.8-1
potential presence classes
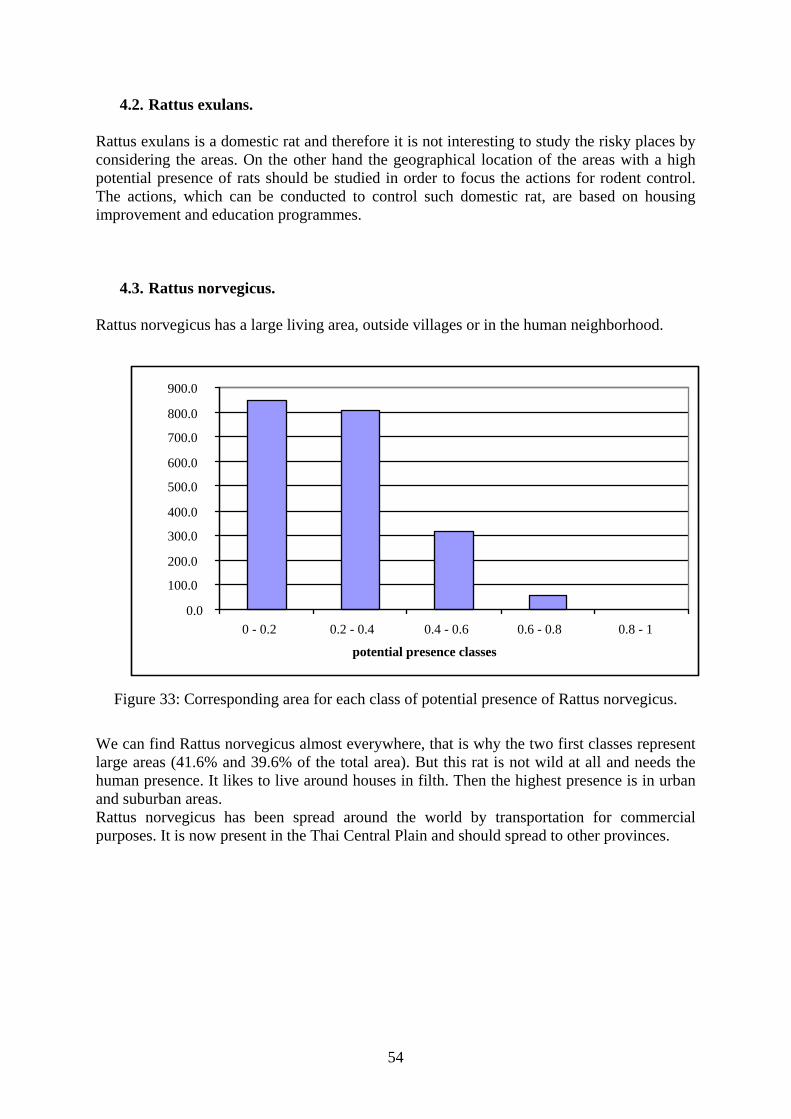
54
4.2. Rattus exulans. Rattus exulans is a domestic rat and therefore it is not interesting to study the risky places by considering the areas. On the other hand the geographical location of the areas with a high potential presence of rats should be studied in order to focus the actions for rodent control. The actions, which can be conducted to control such domestic rat, are based on housing improvement and education programmes.
4.3. Rattus norvegicus. Rattus norvegicus has a large living area, outside villages or in the human neighborhood.
Figure 33: Corresponding area for each class of potential presence of Rattus norvegicus.
We can find Rattus norvegicus almost everywhere, that is why the two first classes represent large areas (41.6% and 39.6% of the total area). But this rat is not wild at all and needs the human presence. It likes to live around houses in filth. Then the highest presence is in urban and suburban areas. Rattus norvegicus has been spread around the world by transportation for commercial purposes. It is now present in the Thai Central Plain and should spread to other provinces.
0.0
100.0
200.0
300.0
400.0
500.0
600.0
700.0
800.0
900.0
0 - 0.2 0.2 - 0.4 0.4 - 0.6 0.6 - 0.8 0.8 - 1
potential presence classes
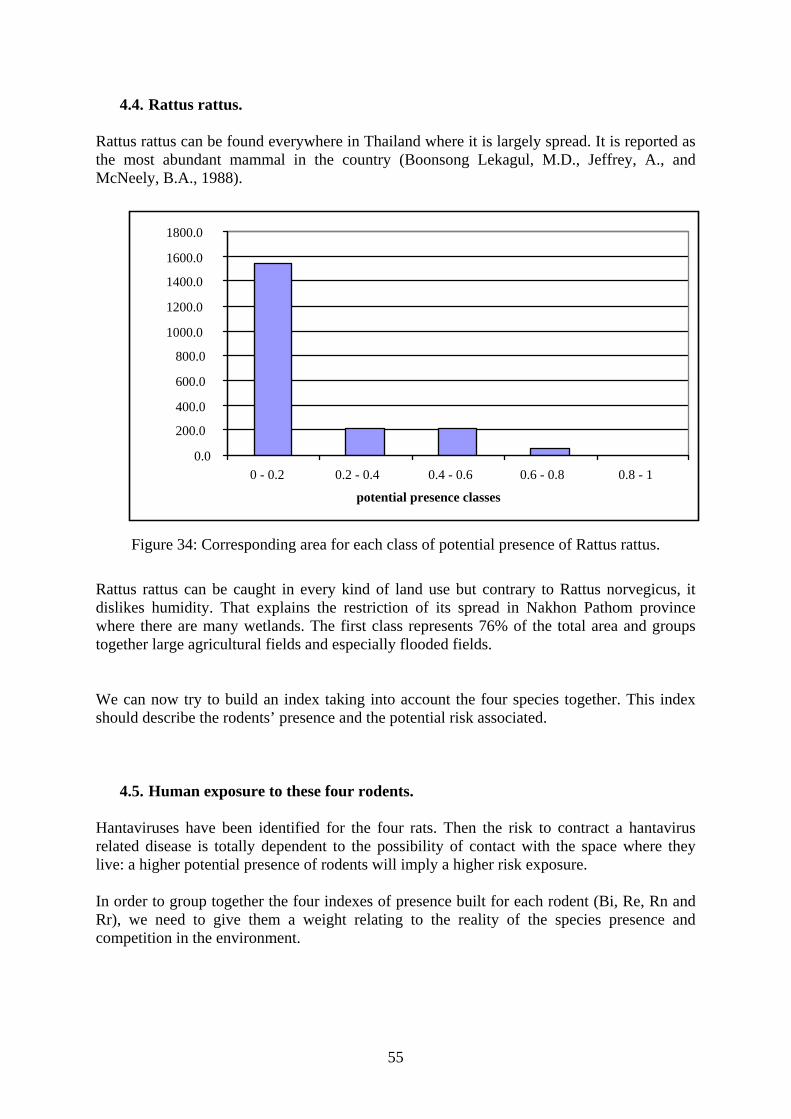
55
4.4. Rattus rattus. Rattus rattus can be found everywhere in Thailand where it is largely spread. It is reported as the most abundant mammal in the country (Boonsong Lekagul, M.D., Jeffrey, A., and McNeely, B.A., 1988).
Figure 34: Corresponding area for each class of potential presence of Rattus rattus.
Rattus rattus can be caught in every kind of land use but contrary to Rattus norvegicus, it dislikes humidity. That explains the restriction of its spread in Nakhon Pathom province where there are many wetlands. The first class represents 76% of the total area and groups together large agricultural fields and especially flooded fields. We can now try to build an index taking into account the four species together. This index should describe the rodents’ presence and the potential risk associated.
4.5. Human exposure to these four rodents. Hantaviruses have been identified for the four rats. Then the risk to contract a hantavirus related disease is totally dependent to the possibility of contact with the space where they live: a higher potential presence of rodents will imply a higher risk exposure. In order to group together the four indexes of presence built for each rodent (Bi, Re, Rn and Rr), we need to give them a weight relating to the reality of the species presence and competition in the environment.
0.0
200.0
400.0
600.0
800.0
1000.0
1200.0
1400.0
1600.0
1800.0
0 - 0.2 0.2 - 0.4 0.4 - 0.6 0.6 - 0.8 0.8 - 1
potential presence classes

56
The best way is to use the number of each rodent caught among the total: - Bandicota indica: 44% of these four species, - Rattus exulans: 15%, - Rattus norvegicus: 14%, - Rattus rattus: 27%.
These four figures constitute the weight attributed to each rodent. Then we can multiply them by each index to define a general risk to meet these species:
Risk = Bi * 0.44 + Re * 0.15 + Rn * 0.14 +Rr * 0.27 Equation 12
Risk-index = Risk / max (Risk) Equation 13
We obtain an indicator of human exposure based on the potential presence to find one of these rats. We can display this “risk” indicator by intersecting all the previous layers dedicated to each species (Figure 35). The areas with the highest chance to be in contact with rats and called “high risk exposure” are in the urban and suburban classes but also in some heterogeneous classes (mixed agriculture, bare lands) in transition between agricultural homogeneous classes and cities. 73.4% of the total area is classified in the low risk exposure because it corresponds to a low presence of rice rats and large agricultural areas where the human presence is also low. Only people who work in the primary sector will be exposed.

57
Figure 35: Human risk exposure.

58
5. Conclusion and recommendations. This study has helped in displaying the presence of the four main Thai rodents: Bandicota indica, Rattus exulans, Rattus norvegicus and Rattus rattus. These rodents are the ones, which present a medical interest because they carry numerous of diseases and among them hantaviruses have a special importance nowadays because we expect their emergence in south-east Asia. Hantaviruses have already been identified in our samples. That’s why a map assessing the presence of rats means also the assessment of the presence of hantaviruses. This zonation is only valid for Nakhon Pathom province and even within this province further samplings should improve the results. The actual maps done for each species will be useful tools to conduct next samplings. The number of catching points is actually not enough and we have to trap some rats in all land use classes and in transitory areas between several classes. Then we will be able to understand the proximity between classes and their influence on the ecology of rats. This should help to better define what compose each habitat. Future recommendations: Creating a land use map similar to the one done for Nakhon Pathom province is really time consuming and cannot be automatically done by the software. In order to extrapolate to the whole country we need to carry such studies in really different provinces and then to compare the results using similar modeling. It is a necessary work to understand the dynamics of species because the scale of one province is for this inadequate. This should be the purpose of further studies.

59
References
Acha, P.N., and Szyfres, B., 1980. Zoonoses and communicable diseases common to man and animals. Pan American Health Organization. 693 pages. Boonsong Lekagul, M.D., Jeffrey, A., and McNeely, B.A., 1988. Mammals of Thailand. Bangkok. 758 pages. Chaimanee, Y., 1998. Plio-Pleistocene Rodents of Thailand. Thai studies in Biodiversity. 303 pages. Clawson, M., 1965. Land use information committee on land use statistics, resources for the future. The John Hopkins Press: Baltimore. Cocquerez, J.P., and Philipp, S., 1995. Analyse d’images : filtrage et segmentation. Masson: Paris. 457 pages. Commission européenne, 1997. Indicateurs de développement durable – Une étude pilote selon la méthodologie de la Commission du développement durable des Nations Unies. Office des publications officielles des Communautés européennes: Luxembourg. 128 pages. Fleury, H.J.A., 1999. Virologie humaine, 3rd edition. Masson: Paris. 205 pages. Health Promotion, 1986. Ottawa Charter for Health Promotion. Ministry of agriculture and co-operatives, Office of agriculture economics, 07/1993. Map of agricultural resources from remotely sensed data, Vol 2. 127 pages. National Remote Sensing Agency Department of Space, Government of India, 1990. Description and classification of land use/land cover. Balanagar, Hyderaba. 81 pages. Nitatpattana, N.; Chauvancy, G. et Al., 06/2000. Serological study of hantavirus in the rodent population of Nakhon Pathom and Nakhon Ratchasima provinces Thailand. In Southeast Asian Journal Tropical Medicine Public Health, Vol. 31, No. 2. 277-282. Nowak, R.M., and Pardiso, J.L., 1983. Walker’s Mammals of the world, 4th edition. The John’s Hopkins University Press: Baltimore and Boston. 1362 pages. Pinchemel, P. & G., 1992. La face de la Terre, éléments de géographie, 2ème édition. Armand Colin: Paris. 519 pages. Schmaljohn, C., and Hjelle, B., April-June 1997. Hantaviruses: a global disease problem. In Emerging Infectious Diseases, Vol. 3, No. 2, 95-104. Thomson, M.C., Obsomer, V. et al., 23/09/2000. Satellite mapping of Loa loa prevalence in relation to ivermectin use in west and central Africa. In The Lancet, Vol. 356, No. 9235. 1077-1078.
60
World Health Organization, 1974. Ecology and control of rodents of public health importance. Report of a WHO scientific group. Technical report series 553. WHO: Geneva. 42 pages. World Health Organization, 1980. Environmental management for vector control. Fourth report of the WHO Expert Committee on Vector Biology and Control. In WHO Technical Report Series, No. 649. WHO: Geneva. 84 pages. World Health Organization, 1991. Environmental health in urban development. Report of the WHO Expert Committee. Technical report series 807. WHO: Geneva. 66 pages. World Health Organization, 1994. “Constitution of the World Health Organization”, in WHO, basic documents, 40th edition. WHO: Geneva. World Health Organization, 1996. Linkage methods for environment and health analysis, general guidelines. A report of the Health and Environment Analysis for Decision-making (HEADLAMP) project. WHO: Geneva. 136 pages. World Health Organization, 1997. Dengue hemorrhagic fever: diagnosis, treatment, prevention and control, 2nd edition. WHO: Geneva. 84 pages. World Health Organization, 1997. European sustainable development and health series, 2: City planning for sustainable and health development. WHO: Geneva. 110 pages. World Health Organization, 1997. Health and Environment in Sustainable Development: Five years after the Earth Summit. WHO: Geneva. 245 pages.

61
Internet references AIT (Asian Institute of Technology).
http://www.ait.ac.th/ STAR (Space Technology Application and Research program) http://www.star.ait.ac.th/ Department of Local Administration, Thailand. Database for population and house statistics. http://www.dola.go.th/English/ Desert Research Institute, USA. Investigating hantavirus from space:
http://www.dri.edu/General/Newsletter/1999/winter98-99/Hantavirus.html Hantavirus Information Network: http://www.hantavirus.net/ IRD (Institut pour la Recherche et le Développement) http://www.ird.fr
IRD, UR 034: http://www.star.ait.ac.th/~haja/index.html
National Center for Infectious Diseases:
http://www.cdc.gov/ http://www.cdc.gov/ncidod/diseases/hanta/hps/index.htm Using Remotely Sensed Data To Identify Areas at Risk for Hantavirus Pulmonary
Syndrome: http://www.cdc.gov/ncidod/eid/vol6no3/glass.htm Robert M. Bock Laboratories UW-Madison, USA: Hantaviruses, with emphasis on Four Corners Hantavirus
http://www.bocklabs.wisc.edu/ed/hanta.html#table Seattle and King County: public health: Hantavirus fact sheet: http://www.metrokc.gov/health/prevcont/hanta.htm#symptoms Yahoo hantavirus fact sheet:
http://health.yahoo.com/health/Diseases_and_Conditions/Disease_Feed_Data/Hanta_virus/

62
Appendices
Appendix 1: References of maps and images. 63 Appendix 2: Hantavirus typical features. 65
63
References of maps and images
1- Topographic maps:
• Source: Royal Thai Survey Department (RTSD).
• Scale: 1:50000.
• • Series: L7017, Edition 1. • • Sheet:
o 4937 II: Ban Thung Khok. o 5037 III: Amphoe Bang Len. o 4936 I: Amphoe Ban Pong. o 5036 IV: Changwat Nakhon Pathom.
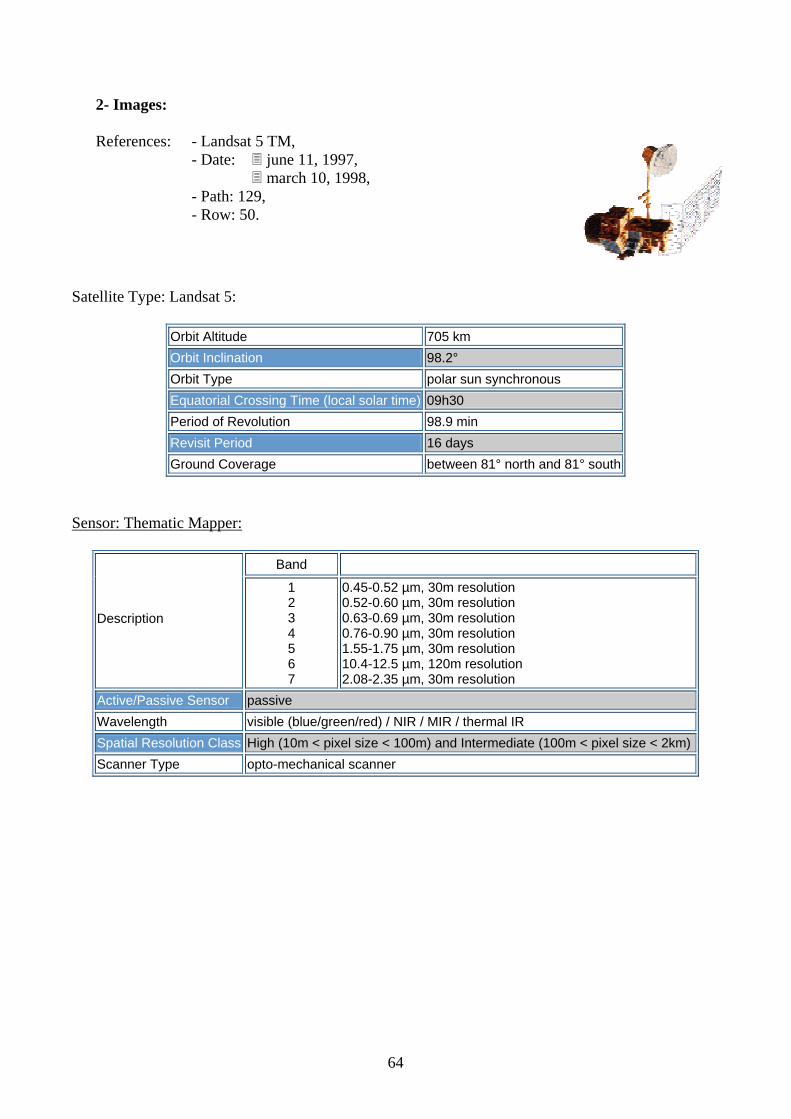
64
2- Images: References: - Landsat 5 TM, - Date: june 11, 1997, march 10, 1998,
- Path: 129, - Row: 50.
Satellite Type: Landsat 5:
Orbit Altitude 705 km Orbit Inclination 98.2° Orbit Type polar sun synchronous Equatorial Crossing Time (local solar time) 09h30 Period of Revolution 98.9 min Revisit Period 16 days Ground Coverage between 81° north and 81° south
Sensor: Thematic Mapper:
Band
Description
1 2 3 4 5 6 7
0.45-0.52 µm, 30m resolution 0.52-0.60 µm, 30m resolution 0.63-0.69 µm, 30m resolution 0.76-0.90 µm, 30m resolution 1.55-1.75 µm, 30m resolution 10.4-12.5 µm, 120m resolution 2.08-2.35 µm, 30m resolution
Active/Passive Sensor passive Wavelength visible (blue/green/red) / NIR / MIR / thermal IR Spatial Resolution Class High (10m < pixel size < 100m) and Intermediate (100m < pixel size < 2km) Scanner Type opto-mechanical scanner

65
Hantavirus typical features
Discovered in 1993 by a task force of scientists in New Mexico. Hantavirus is spread to humans through direct contact with rodents and by air via the animals' urine and droppings. The deadly virus kills almost half of its victims.
• Virus morphology: Belong to family Bunyaviridae, 14 Hantavirus known, Negative sensed (genome complementary), three single-stranded RNA segments:
• S (small) RNA encodes the nucleocapsid N protein • M (medium) RNA encodes a polyprotein that is cotranslationally
cleaved to yield the envelope glycoproteins G1 and G2, • L (large) RNA encodes the L protein, which functions as the viral
transcriptase/replicase, Helical nucleocapsid.
• Pathogenesis:
Rodent-borne virus, These rodents shed the virus in their urine, feces and saliva.
• Transmission:
Virus are mainly transmitted to people by breathing in contaminated air. When fresh urine or feces are stirred up. Tiny droplets containing the virus get into
the air: “aerosolization”. Rarely transmitted by the bite of rodent to human. By touching contaminated urine or droppings. By eating food, which has been contaminated by infected urine or droppings. No transmission from person to person reported. No transmission by blood transfusion reported.
• Symptoms:
Fever, chills, muscle aches (myaglia), headache, general ill feeling, malaise, dry cough, increased respiratory rate (tachypnea), shortness of breath, respiratory failure.
Complications: cardiorepiratory failure, death. Mortality rates: exceeding 50%.
• Vectors:
Transmitted by rodents as: Deer mouse (Peromyscus maniculatus), Cotton rat (Sigmodon hispidus), Rice rat (Oryzomys palustris), White-footed mouse (Peromyscus leucopus).
No known transmission from other animals or insect. However domestic cats and dogs may bring infected rodents into contact with humans.