Embed Size (px)
Citation preview

05/12/99 WED 19:52 FAX 17037841378 CWL @002 1— a-ya; ie: io ; S»WM I IUI V. \->£.i
REMOTE NEAR-INFRARED FUEL MONITORING SYSTEM
INTERIM REPORT TFLRF No. XXX
By
Scott A. HutzJer Gary B. Bessee
U.S. Army TARDEC Fuels and Lubricants Research Facility (SwRI) Southwest Research Institute
San Antonio, TX
Under Contract to
Contract No. DAAK70-92-C-0059
Approved for public release; distribution unlimited
December 1997
r ßTIC QUALITY DTOPECTED I
19990609 075
05/12/99_WED 19:52 FAX 17037841378 CWL ^ _ __ _ ^ ÜJOO^
Disclaimers
The findings in this report are not be construed as an official Department of the Army position unless so designated by other authorized documents.
Trade names cited in this report do not constitute an official endorsement or approval of the use of such commercial hardware or software.
DTIC Availability Notice
Qualified requestors may obtain copies of this report from the Defense Technical Information Center, Attn: DTIC-OCC, 8725 John J. Kingman Road, Suite 0944. Fort Belvoir, Virginia 22060-6218.
Disposition Instructions
Destroy this report when no longer needed. Do not return it to the originator.
05/12/99 WED 19:52 FAX 17037841378 CWL @005 1- S-99;lS:iB i SWR I (D I V. OZI ,ciw "" .. ^ . ~ «■ • -.
EXECUTIVE SUMMARY
Objective: The objectives of this study were (1) to demonstrate the feasibility of replacing
standard field methods for fuel analysis with a rapid analytical technique based on near-
infrared spectroscopy, (2) to design a system that could provide real-time monitoring of fuel
being distributed from a bulk fuel farm, and (3) to provide the United States Marine Corps
(USMC) with a system for tracking fuel inventory.
Accomplishments: Based on the requirements set forth by the United States Marine
Corps, a system was designed and prototyped to monitor fuel in real-time as it was being
dispensed from a remotely located bulk fuel farm. The Remote Near-Infrared Fuel
Monitor was able to determine the quality of both diesel fuel and kerosene and relay this
information back to a remote monitoring station. The system also allowed the entry of
fuel inventory data for the purpose of tracking fuel usage and fuel on hand.
Military Impact: The advantages of using the Remote Near-Infrared Fuel Monitor are
overwhelming. When placed in-line in a bulk fuel farm, distribution of contaminated fuel
could be virtually eliminated. This small effort could (1) limit the number of maintenance
personnel and spare parts (e.g. fuel filters) that must be maintained on the battlefield, (2)
reduce the frequency of fuel related vehicle problems, and (3) increase combat readiness.
Fuel being delivered to the farm may also be tested prior to receipt. This could prevent a
contaminated shipment from contaminating the rest of the fuel supply. Also, captured fuels
may be tested and identified on the battlefield prior to use, eliminating the time consuming
task of transporting a sample to the rear for evaluation. In addition, tracking fuel inventory
electronically, and in real-time, allows the rear command to anticipate future fuel
requirements. Using the Remote Near-Infrared Fuel Monitor allows a pro-active, rather than
reactive, approach to fuel management.
m
05/12/99 WED 19:52 FAX 17037841378 CWL @004
REPORT DOCUMENTATION PAGE Form Approved OMB No. 0704-01BB
Public reporting burden lor this collection of Information is estimated to average 1 hour per response. Including Ihe tin» lor reviewing Instruction, searching ejdeting data sources, gathering and marnlaining the dale needed, and completing and reviewing Ihe collection ol inhumation. Send comments regarding this burden cellmate or any other aspect of (hit collection ol information, including suggestions for reducing this burden, to Washington Headquarter Services, directorate for Inloimsllon Operations and Reports, 1Z15 Jefferson Davis Highway, Suite 1204. Arlington, VA 22202-4302, and Is the Office of Management and Budget. Paperwork Reduction Project (Q704-01BB), Washington. DC 20503.
t. AGENCY USE (Leave blank) 2. REPORT DATE 3. REPORT TYPE AND DATES COVERED
4. TITLE AND SUBTITLE Remote Near-Infrared Fuel Monitoring System
5. FUNDING NUMBERS
B.AUTHOR(S) Bessee. G. B. and Hutzter, S.A.
7. PERFORMING ORGANIZATION NAME(S) AND ADDRESS(ES)
VS. Army TAR DEC Fuels and Lubricants Research Facility (SwRI) Southwest Research Institute P.O. Drawer 2 B510 Sao Antonio, Tear» 7822B-05IO
B. PERFORMING ORGANIZATION REPORT NUMBER
TFLRFNo.XXX
9. SPONSORrNGTMONITORING AGENCY iMAME(S) AND ADDRESS(ES)
Department of the Army Mobility Technology Center
la SPONSORING/ MONITORING AGENCY REPORT NUMBER
I (.SUPPLEMENTARY NOTES
12*. DISTRIBUTION/AVAILABILITY Approved for public release; distribution unlimited
12b. DISTRIBUTION CODE
13. ABSTRACT (Maximum 200 words)
14. SUBJECT TERMS 15. NUMBER OF PAOJES
IS PRICE CODE
INSECURITY CLASSIFICATION OF REPORT
8. SECURITY CLASSIFICATION OF THIS PACE
19. SECURITY CLASSIFICATION OF ABSTRACT
20. LIMITATION OF ABSTRACT
Unclassified Unclassified
Unclassified
MSN 7540-01.2TO550U Standard Form 198 IHev. !-««>
Prescribed by ANSI Sid. Z39-I« 29»-1W
05/12/99 WED 19:53 FAX 17037841378 CWL @]006 1— b-y»; ID; lea ; =>wn i n-< i v. \j£.i
FOREWORD / ACKNOWLEDGMENTS
This work was performed at the U.S. Army TARDEC Fuels and Lubricants Research Facility
(TFLRF) located at Southwest Research Institute (SwRI), San Antonio, TX, under Contract
No. DAAK70-92-C-0059. The work was funded by the United States Marine Corps.
The authors gratefully acknowledge the valued support provided by S.R. Westbrook, S.E.
Novosad, N.Y. Rosson, L.S. Stavinoha, M.S. Voigt, D.M. Yost, G.L. Phillips, R.E.
Grinstead, and A.T. Nunez of TFLRF (SwRI) and David Strachan and Igor Nazarov of
Brimrose Corporation of America.
The editorial support provided by W.C. Mills of the TFLRF (SwRI) editorial group is also
thankfully acknowledged.
IV
05/12/99 WED 19:53 FAX 17037841378 1- 6-99;l6:i6 ;SWR I (DIV. 02I
CWL , c i «-» -* *
1^007
TABLE OF CONTENTS
Section
I. OBJECTIVE
II. INTRODUCTION AND BACKGROUND
IE. TECHNICAL APPROACH
IV. THEORY OF OPERATION
A. NEAR-INFRARED SPECTROSCOPY
B. CHEMOMETRICS
V. THE REMOTE FUEL MONITOR
A. CONFIGURATION
B. INSTRUMENT CALIBRATION
C. MODE OF OPERATION
D. SOFTWARE
1. INSTRUMENT CONTROL SOFTWARE
2. INVENTORY CONTROL SOFTWARE .
VI. EXPERIMENTAL
VII. RESULTS AND DISCUSSION
A. SUCCESS STORIES
VIE. SUGGESTED MODIFICATIONS
DC. CONCLUSIONS
X. REFERENCES
XI. APPENDDC A (Figures)
Eags
05/12/99 WED 19:53 FAX 17037841378 CWL 0008
I. OBJECTIVE
The objectives of this study were (1) to demonstrate the feasibility of replacing standard field
methods for fuel analysis with a rapid analytical technique based on near-infrared
spectroscopy, (2) to design a system that could monitor fuel being received and distributed
from a bulk fuel farm, and (3) to provide the United States Marine Corps (USMC) with a
system for tracking fuel inventory.
II. INTRODUCTION AND BACKGROUND
Believing that a number of vehicle maintenance problems stem from poor or contaminated
fuel, the United States Marine Corps sought to develop the capability to monitor fuel quality
in the field in real-time. The current protocol is to test fuel only after a vehicle has been
diagnosed with fuel-related problems. By using a proactive rather than reactive management
of their fuel supply, the USMC postulated that it could ultimately reduce maintenance
personnel and spare part requirements thus augmenting their operational readiness.
The USMC commissioned the U.S. Army TARDEC Fuels and Lubricants Research Facility
(TFLRF) at Southwest Research Institute (SwRI) to develop a system, based on a near-
infrared spectrometer, that could monitor fuel quality "in-line" as it was being dispensed.
Since SwRI had been investigating a similar system for the U.S. Army, most of the
knowledge required to implement such a system was already in hand (1. 2)- The system
being investigated for the Army had to undergo only a few minor modifications to allow it
to acquire information on flowing fuel in real-time. To expedite the completion of the
USMC system, the U. S. Army agreed to transfer one of its existing near-infrared instruments
to the USMC. Upon completion, the Remote Fuel Monitor was to be deployed in Twenty-
nine Palms, CA during Hunter-Warrior in early 1997.

05/12/99 WED 19:54 FAX 17037841378 CWL 1009 b-ya; i o; 10 > ;»wr-t i IUI v. wci
III. TECHNICAL APPROACH
SwRI had a near-infrared spectrometer ruggedized to withstand the desert environment in
which it would be deployed for the Hunter-Warrior exercise. A pipe section was constructed
to contain the sensor package (fiber-optic probe, flowmeter, thermocouple). The pipe section
was outfitted with quick disconnects so that it could be easily inserted into the USMC's
current fuel distribution system. Two computers were acquired for controlling and
monitoring the instrument: a ruggedized laptop for primary control of the system and a
desktop PC to be used as a remote monitoring station. A siren and an alarm were built into
the system to warn operators of out-of-tolerance fuel.
Customized software was designed for both the laptop and the desktop PC. Each version of
the software had the ability to display historical fuel inventory data. In addition, the software
for the laptop computer contained the primary interface for the instruments functions and the
calculations for generating the fuel property estimates. The fuel property calibrations
required for the near-infrared spectrometer had already been generated under the Army's
project.
For testing purposes, the Remote Fuel Monitor was deployed in a bulk-fuel farm in
Twenty-nine Palms, CA during Hunter-Warrior in 1997. The desktop PC was located at the
CSSOC at Camp Pendleton. The system was subjected to a battery of tests involving both
acceptable and contaminated fuels. Experiments were conducted using diesel, JP-5, and
MOGAS.
The following criteria were used to judge the success of the Remote Fuel Monitor.
1. The system must be able to detect changes in the property estimates when
substances other than diesel are sent through the system.
2. The system should issue an alarm when out-of-tolerance properties are
detected so that operators can stop distributing fuel.
05/12/99 WED 19:54 FAX 17037841378 CWL l£|010 1- 5-99 ; 16 : 1 B i SWR I IDIV. UZ] ,tii>=»t<iocrw „..,-.-
3. At the CSSOC, the system should indicate which properties are
out-of-tolerance so that corrective action can be taken.
IV. THEORY OF OPERATION
A NEAR-INFRARED SPECTROSCOPY
The most utilized portion of the near-infrared region is that between 1000 and 2500 nm
(10,000 - 4,000 cm'1). For organic molecules, near-infrared spectra are the result of
combination and overtone bands of the fundamental vibrational frequencies found in the
mid-infrared region (3). Overtone bands appear at integer multiples (approximately) of the
fundamental vibrational frequencies and each subsequent overtone is dramatically weaker
in intensity. The first overtone for a fundamental vibrational frequency in the mid-infrared
region appears at twice the wavenumber (or one half of the wavelength), the second overtone
appears at three times the wavenumber (or one third of the wavelength), etc. For this reason,
near-infrared spectra are typically comprised of first and second overtones of C-H, N-H, and
O-H stretching vibrations. Other vibrational modes (e.g. bending, scissoring, etc.) and other
functional groups (e.g. C-O-C, C=C, etc.) can contribute to the spectrum through
combination bands. This makes near-infrared spectroscopy highly suitable for use with
hydrocarbon fuels. However, to be useful a correlation must exist between the minor spectral
differences related to fuel composition and the fuel property of interest.
Near-infrared light emitted from a tungsten-halogen light source is transmitted through the
fuel and detected on the other side. As the light passes through the fuel, a variety of chemical
species will absorb the light at various wavelengths and to varying degrees. As a result, the
characteristics of the fuel will be imparted on the near-infrared spectrum. The instrument's
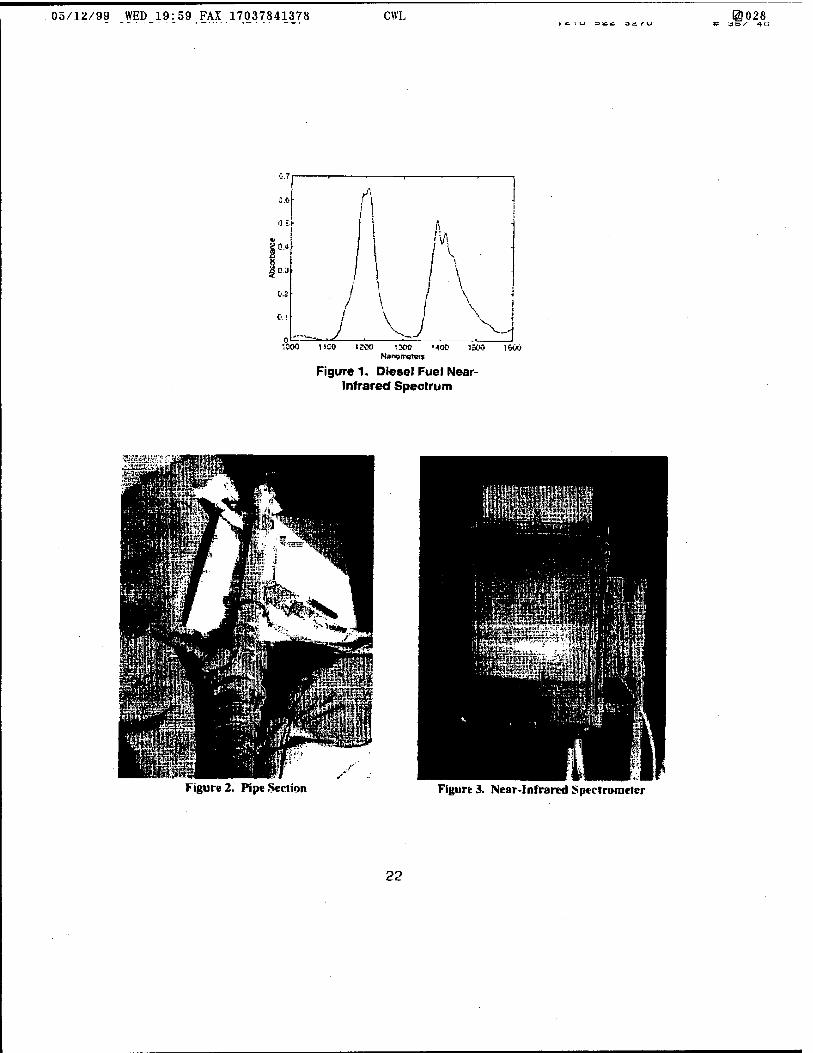
detector measures the intensity of the transmitted light and generates an absorbance spectrum
over the selected wavelength range (example shown in Figure 1). Unlike some analyzers that
detect only a few wavelengths of the transmitted light, the spectrometer used in this work

05/12/99 WED 19:54 FAX 17037841378 CWL @011 1- 6-99;lS:i6 ; SWR I (DIV. OE) i *■ l " =•** 3"u " ' °" ""
performs a full spectral analysis which may contain 300 or more wavelengths. Fuel
properties can be correlated to the subtle spectral changes that are present from sample to
sample. These spectral changes represent the variation in the fuel properties and can be
quantified.
R CHEMOMETRICS
Chemometrics is a branch of chemistry that applies mathematical and statistical routines to
chemical and physical data. The goal is to relate the state {i.e. a chemical or physical
characteristic) of a system to measurements (e.g. spectral data) collected on the system. A
significant factor contributing to the popularity and growth of chemometrics is that the vast
amounts of spectral data being generated by today's analytical instruments is not being
utilized to its full potential. This is due, in part, to the fact that much of the useful
information contained in the spectra is the way in which individual measurements co-vary.
The situation is complicated by the fact that the some of the information is redundant and
some degree of noise is present in the spectra. Chemometric routines compress the spectra
by extracting only the essential information and leaving behind most of the noise and
redundancies. The result is that the changes in the spectra can be described using far fewer
variables (wavelengths) without a significant loss of relevant information. Ultimately, the
compressed spectral data must be correlated to the fuel property data to be useful.
In many cases, rather than measuring individual chemical components, a bulk property of the
system like density is sought. The term given to this type of observation is indirect because
the value of the bulk property is inferred from the overall chemical composition of the
system (4, 5). This is entirely feasible because the chemical composition governs the value
of the bulk property and is reflected in the spectral data. All that remains is to uncover the
mathematical relationship between the spectral data and the property of interest. This work
utilized linear calibration models generated from a Partial Least Squares (PLS) regression.
These models assume that the near-infrared spectra result from linear combinations of the
05/12/99 WED 19:55 FAX 17037841378 CWL @012 i- 6-99; IE: 16 ; SWR I IUIV. usi ,^.^=c^o^.w „,=,-»„
individual chemical components found in fuel.
V. THE REMOTE FUEL MONITOR
AT CONFIGURATION
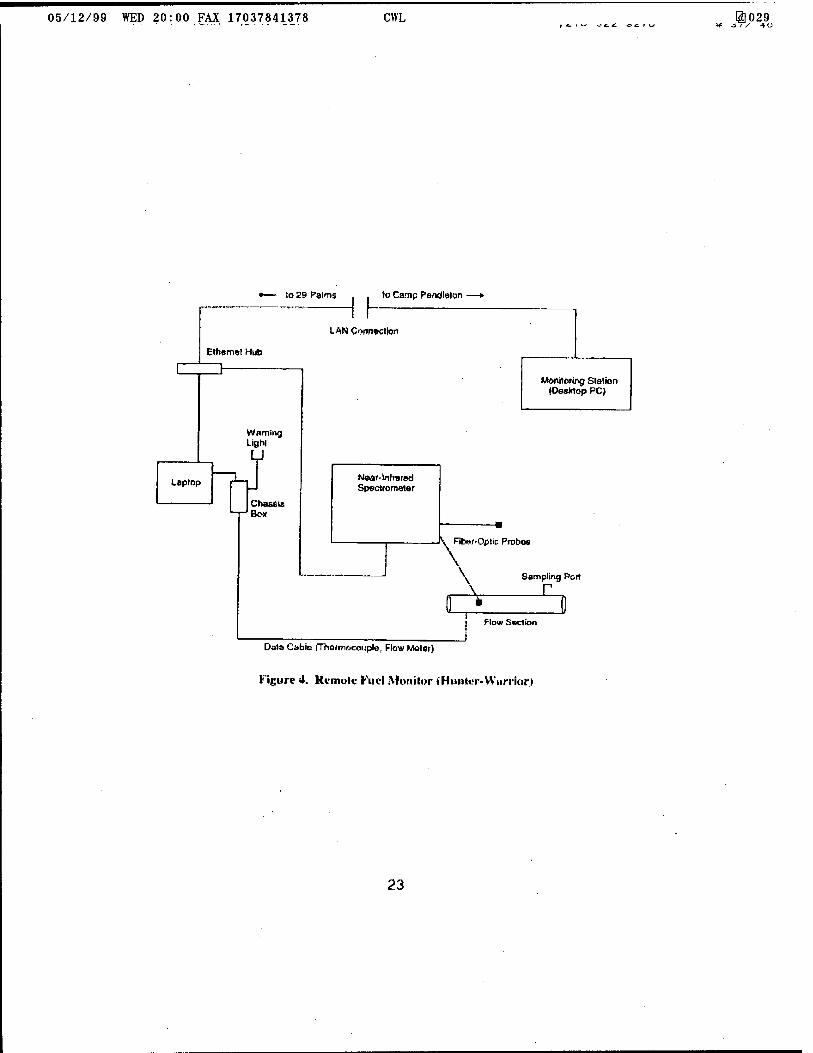
The prototype system (Figures 2, 3, and 4) contained the following features:
Rack-mounted, near-infrared spectrometer (with two internal cooling fans)
Pipe section:
► quick disconnects to connect to the existing USMC fuel distribution
system (4 inch hoses)
► flow meter
» thermocouple
» sampling port
► in-line, fiber-optic transreflectance probe
One (1) external sampling device (probe)
Ruggedized laptop computer - provided primary control for the instrument
Desktop computer (Remote Fuel Monitoring Workstation)
Custom software for instrument control and inventory tracking
Real-time acquisition of fuel-quality data
Flow-activated scanning
Warning light and alarm
Real-time transmission of fuel inventory/quality data from the laptop to the
desktop via TCP/IP
The Remote Near-Infrared Fuel Monitor was based on a near-infrared process analyzer that
was ruggedized for field use. Fiber-optic cables coupled to a fiber-optic probe were used to
collect near-infrared spectra of the flowing fuel as it was being dispensed. A pipe section
05/12/99 WED_19:55 FAX 17037841378 CWL ©013 aa, ic. i D , afvn i | L/ i v . i-»£.;
was developed that could be quickly inserted into the USMC's current fuel distribution
system. The fiber-optic probe, flow meter, sampling port, and thermocouple were installed
in the pipe section. The Remote Fuel Monitor utilized a ruggedized laptop (fieldworks. Inc.)
to control all of the spectrometer's functions, allow for entry of fuel inventory data, and
transmit the fuel inventory and quality data over TCP/IP to a remotely located workstation.
The fuel quality and inventory data was stored in a database on the laptop and on the remote
workstation. Each computer had the ability to show the current status of the fuel supply and
to view historical data.
B. INSTRUMENT CALIBRATION
The fuel property calibrations for the near-infrared spectrometer were generated using a
database of approximately 800 fuel samples. Although the fuel samples were primarily
diesel (about 5% of the set were aviation kerosenes), the calibrations were also applicable
to kerosene samples because they share many of the same characteristics. The sample set
was split into two equal groups to create a calibration training set and a validation set. Using
the calibration training set, Partial Least Squares (PLS) calibration models were developed
for each of the following fuel properties: Density (ASTM D4052), g/mL at 15 °C; Viscosity
(ASTM D445), cSt at 40°C; Total Aromatic Content (ASTM D 5186), mass%; Cetane Index
(D 4737); Net Heat of Combustion (ASTM D 240), MJ/Kg; Cloud Point (ASTM D 2500),
°C. While calibration models for over 30 fuel properties are available, their degrees of
accuracy vary. These properties were chosen because they provide the most accurate
estimates and the most information concerning the quality of the fuel. The validation set was
used to test the calibration models once they were created.
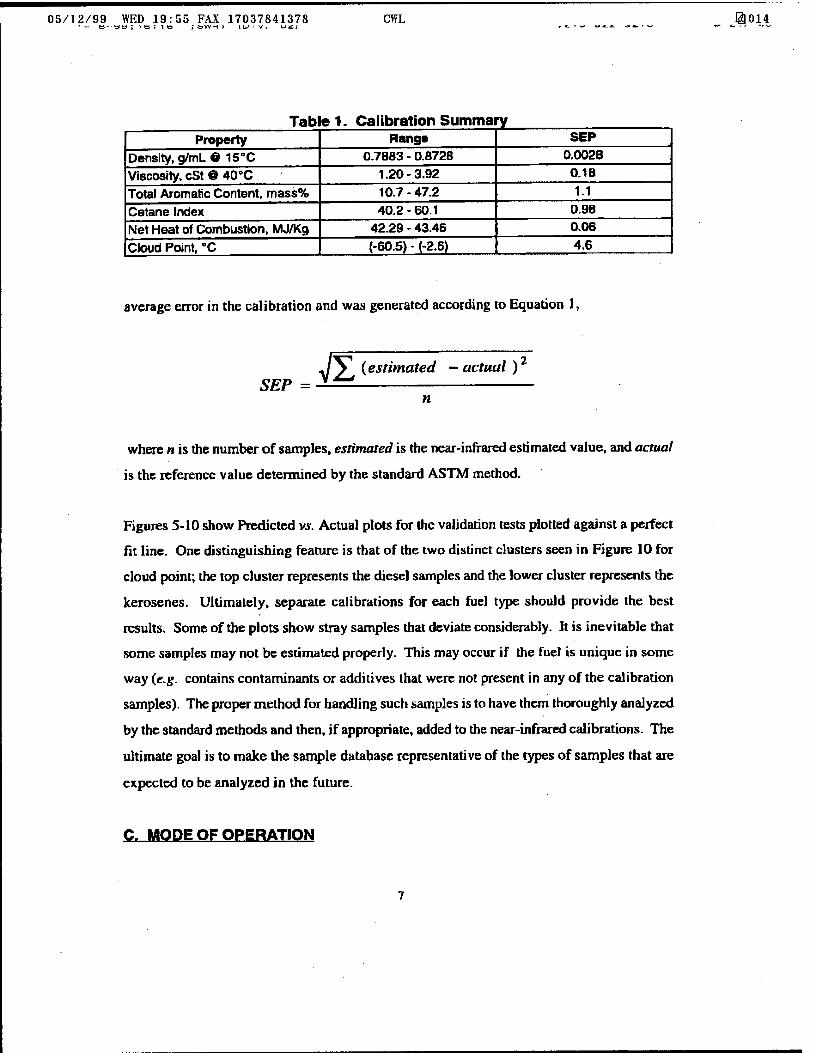
Table 1 summarizes the calibration results and indicates the range over which the fuel
properties were calibrated; while the model can estimate fuel property values outside of this
range, the estimation would be an extrapolation of the model and more susceptible to
deviation from the true value. The Standard Error of Prediction (SEP) is an estimate of the
05/12/99 WED 19:55 FAX 17037841378 CWL @]014
Table 1. Calibration Summary Property Range SEP
Density, g/mL © 15°C 0.7883 - 0.8728 0.0028
Viscosity, cSt © 40°C 1.20-3.92 0.1B
Total Aromatic Content, mass% 10.7 - 47.2 1.1
Cetane Index 40.2-60.1 0.9B
Net Heat of Combustion, MJ/Kg 42.29 - 43.46 0.06
Cloud Point, "C (-60.5) - (-2.6) 4.6
average error in the calibration and was generated according to Equation 1,
SEP = ■J^ (estimated —actual)'
n
where n is the number of samples, estimated is the near-infrared estimated value, and actual
is the reference value determined by the standard ASTM method.
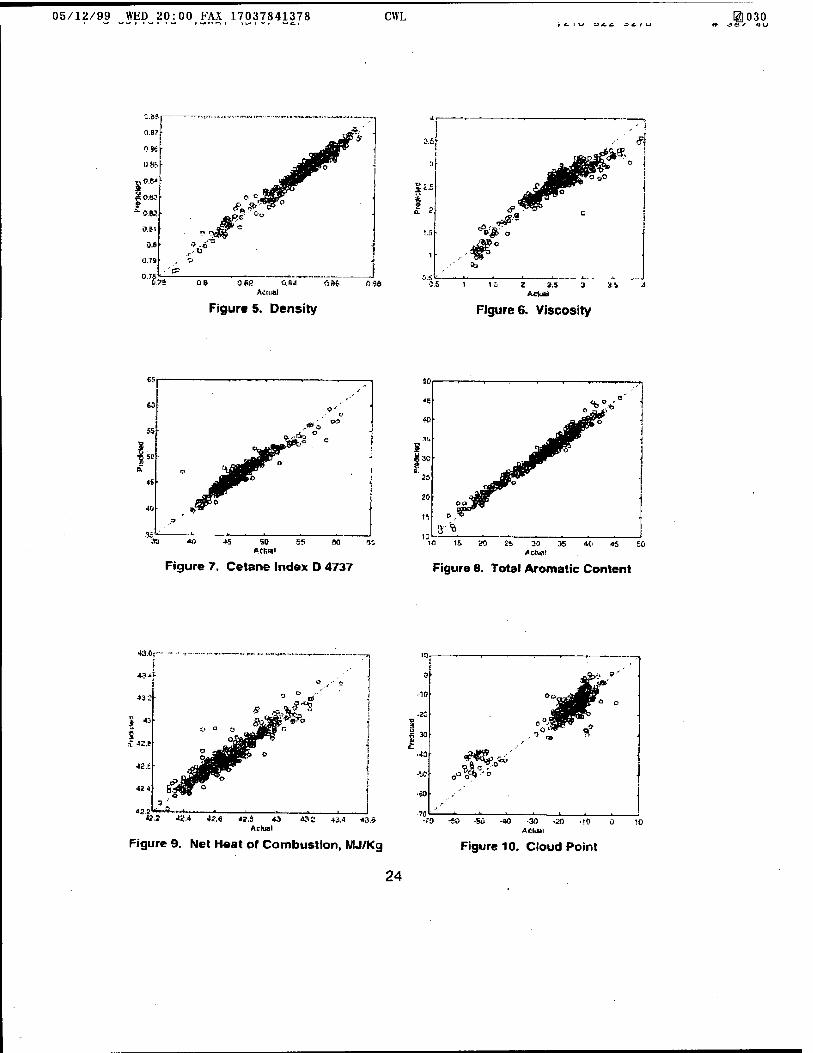
Figures 5-10 show Predicted vs. Actual plots for the validation tests plotted against a perfect
fit line. One distinguishing feature is that of the two distinct clusters seen in Figure 10 for
cloud point; the top cluster represents the diesel samples and the lower cluster represents the
kerosenes. Ultimately, separate calibrations for each fuel type should provide the best
results. Some of the plots show stray samples that deviate considerably. It is inevitable that
some samples may not be estimated properly. This may occur if the fuel is unique in some
way (e.g. contains contaminants or additives that were not present in any of the calibration
samples). The proper method for handling such samples is to have them thoroughly analyzed
by the standard methods and then, if appropriate, added to the near-infrared calibrations. The
ultimate goal is to make the sample database representative of the types of samples that are
expected to be analyzed in the future.
C. MODE OF OPERATION
05/12/99 WED 19:56 FAX 17037841378 CWL @]015 I o : > o i ^yvr* i \ u J v. w c i
Triggered by flow in the line, the system collects a near-infrared spectrum of the fuel every
ten seconds while flow is detected. If the fuel is determined to be out of tolerance, the alarm
sounds allowing attendants to halt fueling before a significant amount of fuel reaches the
vehicle. In addition, the system automatically collects a spectrum when 30 minutes elapse
without detection of flow. By also incorporating an external sampling device (probe),
additional samples like fuel shipments and fuel extracted from vehicles, can be analyzed.
As a result, contaminated fuel will not be received or dispensed.
With the ability to track fuel inventory, an attendant can quickly determine the total volume
of fuel dispensed and fuel on hand. The volume of fuel dispensed to individual units or over
a given period of time can also be charted. The fuel inventory/quality data that is collected
can be transmitted in real-time via TCP/IP to a workstation in the rear. This allows the rear
command to be immediately aware of possible fuel-related problems and to anticipate the
fuel farm's future fuel requirements.
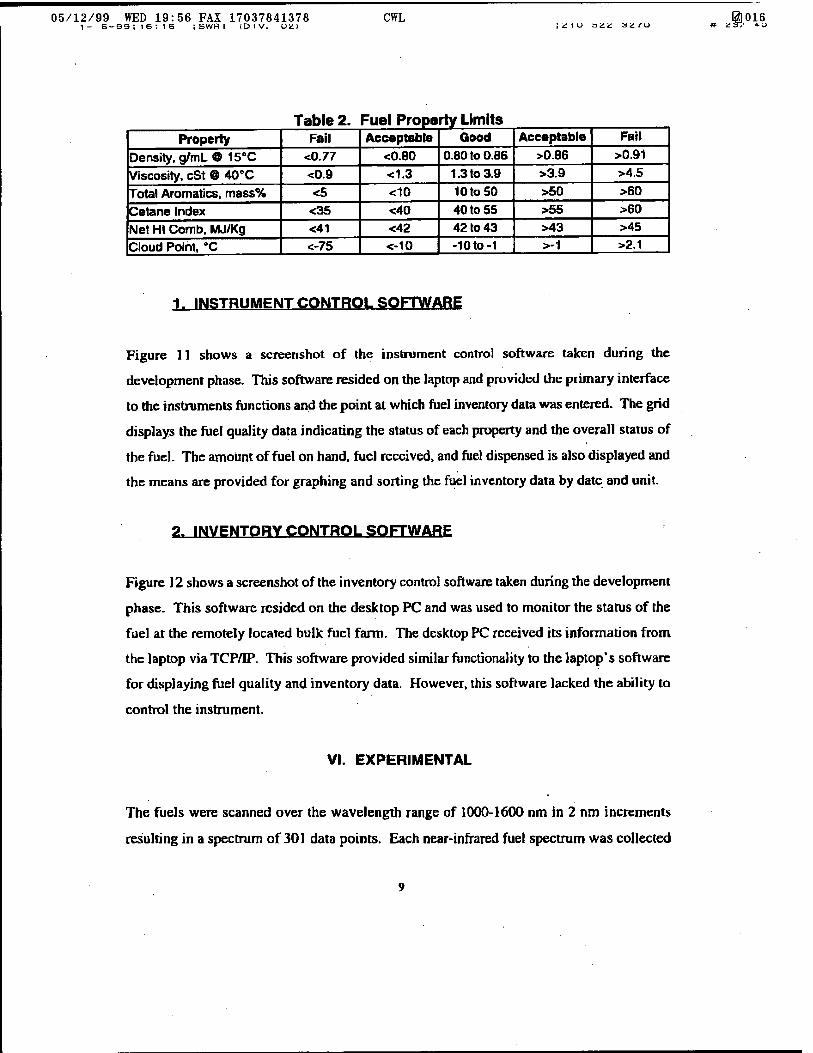
The overall fuel quality is determined by comparing the estimated property values to
predefined limits. The limits rate each estimated value as good (green), acceptable (yellow),
or fail (red), and are depicted as colored 'meatballs' in the software. The overall fuel quality
is defined as the lowest rating received by any of the properties, i.e., if five properties were
"good" and one was "fail," the overall rating would be "fail." An overall rating of "fail"
would cause the alarm to sound. Table 2 shows the fuel property limits used during Hunter-
Warrior.
P, SOFTWARE
The custom software for the laptop and the desktop PC was written in Microsoft® Visual
Basic® 4.0. The TCP/IP capability was developed using PowerTCP™ (Dart
Communications), an ActiveX control for Visual Basic0.
05/12/99 WED 19:56 FAX 17037841378 1- 6-SS;i6:16 ;SWR I IDIV. OZ>
CWL ;ü1U t>£ü AltL f\J
@016 ff 23/ ft U
Table 2. Fuel Property Limits Property Fail Acceptable Good Acceptable Fail
Density, g/mL ® 15"C <0.77 <0.80 0.80 to 0.86 >0.86 >0.91
Viscosity, cSt @ 40°C <0.9 <1.3 1.3 to 3.9 >3.9 >4.5
Total Aromatics, mass% <5 <10 10 to 50 >50 >60
Cetane Index <35 <40 40 to 55 >55 >60
Net Ht Comb. MJ/Kg <41 <42 42 to 43 >43 >45
Cloud Point, "C <-75 <-10 -10to-1 >-1 >2.1
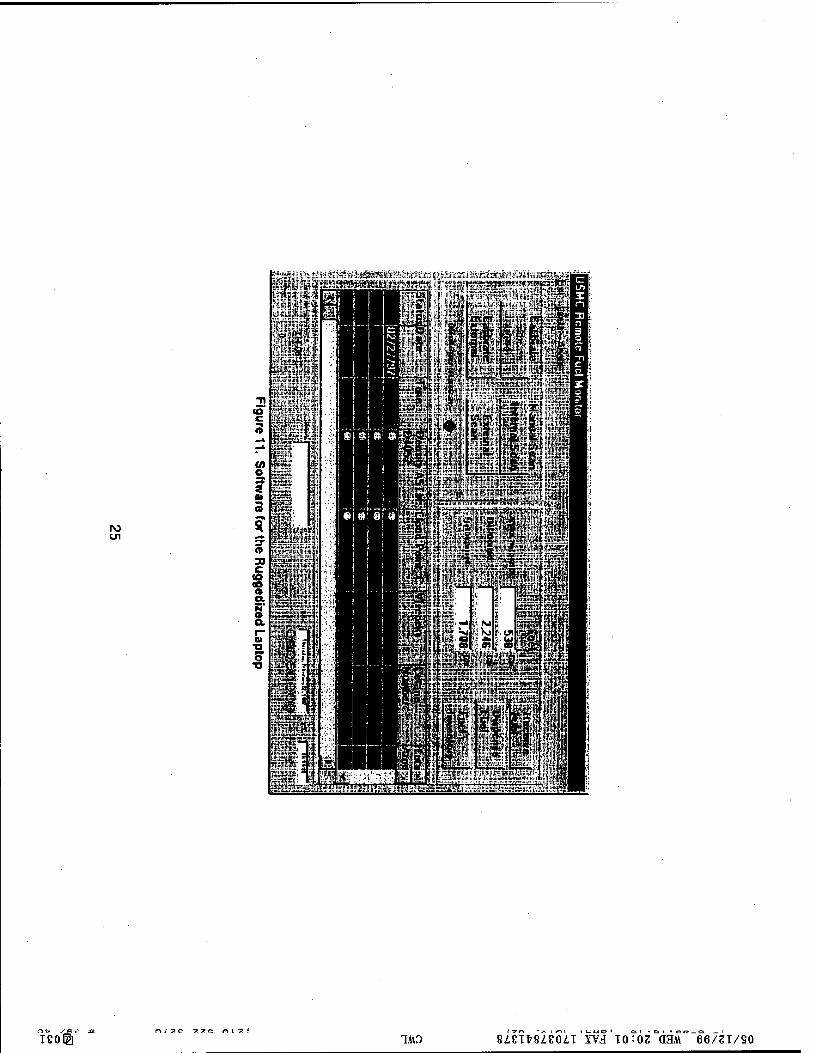
1. INSTRUMENT CONTROL SOFTWARE
Figure 11 shows a Screenshot of the instrument control software taken during the
development phase. This software resided on the laptop and provided the primary interface
to the instruments functions and the point at which fuel inventory data was entered. The grid
displays the fuel quality data indicating the status of each property and the overall status of
the fuel. The amount of fuel on hand, fuel received, and fuel dispensed is also displayed and
the means are provided for graphing and sorting the fuel inventory data by date and unit.
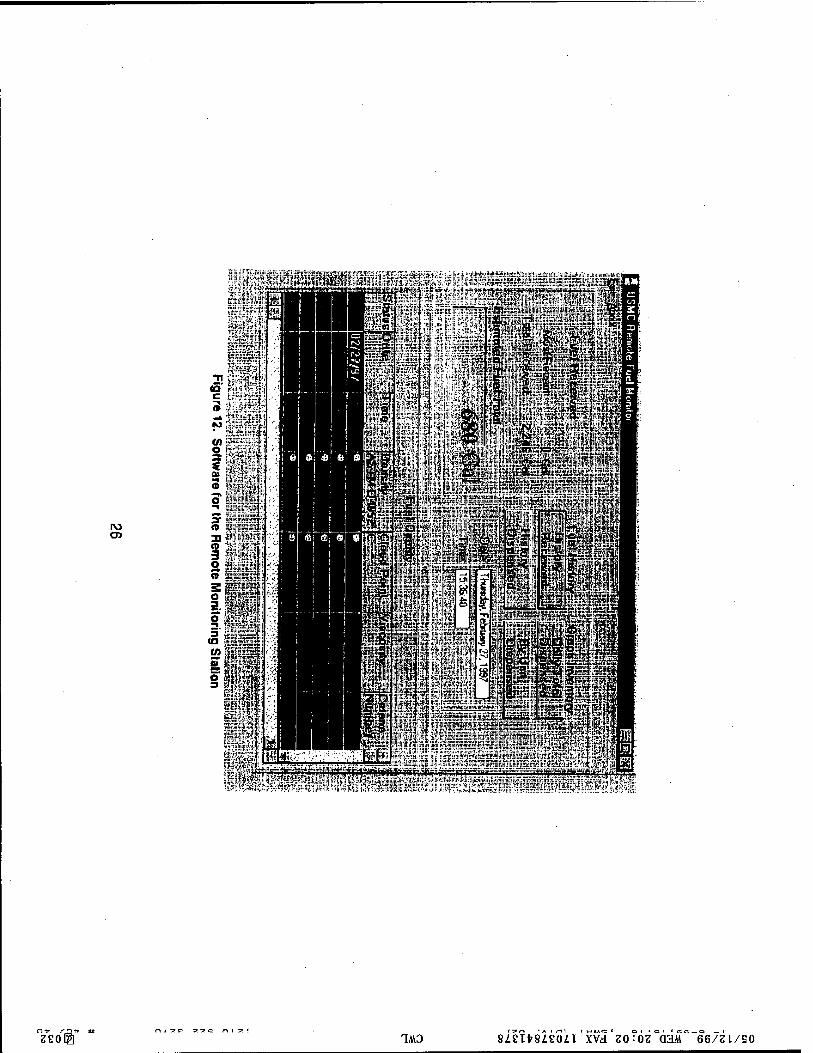
2. INVENTORY CONTROL SOFTWARE
Figure 12 shows a Screenshot of the inventory control software taken during the development
phase. This software resided on the desktop PC and was used to monitor the status of the
fuel at the remotely located bulk fuel farm. The desktop PC received its information from
the laptop via TCP/IP. This software provided similar functionality to the laptop's software
for displaying fuel quality and inventory data. However, this software lacked the ability to
control the instrument.
VI. EXPERIMENTAL
The fuels were scanned over the wavelength range of 1000-1600 nm in 2 nm increments
resulting in a spectrum of 301 data points. Each near-infrared fuel spectrum was collected
05/12/99 WED 19:56 FAX 17037841378 CWL S]017 1- 6-9S;lS:i6 ; SWR I ID I V. C2I ; * l u ?,*-■£. 3 2IU w £.•*/■ i-u
as an average of 32 complete scans with a total scan time of approximately 5 seconds. The
spectra were mathematically pre-treated by generating first-difference spectra followed by
mean-centering. Calculating first-difference spectra involves subtraction of adjacent data
points. For a spectrum, x, with n points the first-difference spectrum would be: [(Xj-x,), (x,-
XJJ), ...(VXM )]■ Mean-centering is accomplished by subtracting the average spectrum of all
the spectra from each individual spectrum. First-difference preprocessing removes any
baseline offset in the spectra. Mean-centering enhances the minor spectral differences related
to fuel composition by removing a major component of useless spectral variation, the non-
zero mean.
Because the experimentation was carried out on a fuel distribution system that was in use at
the time, the majority of the fuel testing was conducted through the use of the external probe.
Experiments were conducted using diesel, JP-5, and MOGAS. Tests were conducted by
mixing various fuel types to see how the system would respond. Although the prototype
system was designed primarily for diesel, a requirement of the system was that it be able to
indicate when a substance other than diesel was present. Because JP-5 and diesel are almost
indistinguishable by near-infrared, we expected that the system would respond similarly to
each.
VII. RESULTS AND DISCUSSION
For the required criteria (vide supra), Items 2 and 3 were part of the original design
specification and were handled effectively. An. audible alarm and warning light were used
to warn operators when an out-of-tolerance fuel was encountered. In addition, a warning
screen and audible alarm was flashed across the laptop and the desktop PC prohibiting
further use of the system until acknowledged. For item 3, on both the laptop and desktop PC,
the software showed the overall fuel-quality rating as well as the individual rating for each
property.
10
05/12/99 WED 19:57 FAX 17037841378 CWL 12)018 i— b-aa; IB: IIS ; öWH I tu I V. OüJ ; <c -\ w => *L X. O K f \J TFüO^M-U
During testing, a 25% / 75% MOGAS/diescl mixture lowered the overall fuel rating to
"acceptable." A 65% / 35% MOGAS/Diesel mixture was required to give a "fail" rating. As
little as 1% water in diesel generated an out-of-tolerance warning. Mixtures of JP-5 and
diese! were also run with all results returning a "good" rating.
Table 3 shows data that is representative of that which was generated during Hunter-Warrior.
Table IV reports the ASTM reference values for the corresponding samples in Table III.
Problems were discovered with the calculations for Total Aromatics and Cloud Point; every
sample gave approximately the same property value. Upon inspection, errors were
discovered in the calibration data and the problem was fixed when the system was returned
to SwRI after Hunter-Warrior. The estimates for JP-5 were found to be only slightly worse
than those for the low sulfur diesel. This was expected since the system was calibrated
primarily for diesel fuel.
A, SUCCESS STORIES
The following quotes were excerpted from the USMC's after-action report for Hunter-
Warrior.
The Fuel Monitor reported a red reading at 18:49:15 on 22 FEB. The
20,000 gallon pod had approximately 500 gallons of diesel. It is the
opinion of the Fuel Farm Chief that bad fuel was indeed Rowing through
the system, as the bottom of the pod generally has Fuel emulsified with
water and dirt that has fallen into the sump. Red readings continued to
occur. The decision was made to shut down the fuel farm until another
fuel delivery arrived. -USMC Project Officer
Several samples were defueled from vehicles. The three sample sources
were (1) Light Armored Vehicle (LAV), (1) High Mobility Multi-
11
05/12/99 WED 19:57 FAX 17037841378 CWL ®019 i— o — as; ia: ID ; ä w r-< i (UIV. UJ£J ;ziu 3üi: aic/u 4? z (3 /*' 4- u
Wheeled Vehicle (HMMWV), and (1) 5-ton truck. The HMMWV and
5 Ton fuel samples were within tolerance (both yellow)...The LAV fuel
sample scanned as out of tolerance by the external probe, a diagnosis
supported by Laboratory analysis of water and particulate
contamination. It was in the shop for non-fuel related problems. -USMC
Project Officer
The Remote Fuel Monitoring system is ready to deploy now. It needs to
be expanded to include all relevant fuel types: JP-5, JP-8, JA-1, etc. This
system could be fielded now, both as a remote and portable capability,
and realize immediate cost savings in reducing fuel related maintenance
problems. This capability, once fielded, should be resident in any CSS
unit responsible for providing bulk Class III support: MWSSs, ESBs,
task organized CSSEs at all levels. For purposes of T/E accountability,
this equipment would be resident in the MWSS, ESB, and any standing
CSSE (CSSG-1, CSSG-3, etc.), as well [as] Ft. Lee Tor training. -CSS
Enterprise Deputy Commander's Comments on Remote Fuel Monitoring
VIII. SUGGESTED MODIFICATIONS
The following is a list of potential upgrades to the Remote Near-Infrared Fuel Monitor
organized into a series of tasks. Each task contains upgrades that provide improvements or
additional capabilities to a common area of the prototype system. The various tasks would
allow the upgrades to occur as time and funding permits while providing reasonable delivery
times in between upgrades. Each task also lists the associated advantages with the proposed
upgrades.
Task 1 - Instrument Packaging
12
05/12/99 WED 19:57 FAX 17037841378 CWL 0020
The first task will be to repackage the current system to make it suitable for
a tactical environment. The new instrument package will have the following
characteristics:
From the prototype system:
• Pipe section with quick disconnects
• Flow meter and thermocouple
• Flow activated scanning
• Warning lights and alarms
• Custom software for instrument control and inventory tracking
• One in-line probe for fuel monitoring
• Desktop Computer (Fuel Monitoring workstation)
• Real-time transmission of fuel inventory/quality data from the fuel
monitor to the desktop via TCP/IP
• Capable of estimating several properties for diesel fuel and kerosene
Modifications and Upgrades:
• "4-man carry" instrument package. Contains all necessary hardware
including the instrument, computer, pipe section, etc.
• Environment resistant {i.e. capable of withstanding extreme weather
conditions)
• Reduced instrument weight (by removing the instrument electronics
from its current stainless steel enclosure)
• Internal climate control for all components
• NEMA 4/12 panel mount monitor with touch screen interface, sealed
keyboard and sealed mouse pad built into the instrument package
(replaces the laptop)
• Wireless networking (up to 500 feet)
• External sampling device (cuvette) built into the instrument package
13
05/12/99 WED 19:58 FAX 17037841378 CWL ©021
• On-line help with illustrated (video) instructions for setup and use
• Remote instrument diagnostics (by modem)
Advantages:
• Rapid deployment in any type of environment
• Hardware setup has been reduced to a minimum
• No need for hardwired network access
• The numerous components required in the original system are now
maintained in a single package
• The new packaging prevents the need to handle the fragile fiber-optic
cables and other equipment resulting in increased longevity
• Reduced footprint (physical dimensions and weight)
• Instrument problems can be diagnosed from a remotely located site
[e.g. SwRI)
Task 2 - Capabilities
Task 2 will focus on upgrading the instrument's fuel analysis capabilities.
Modifications and Upgrades:
• Investigate the use of mid-infrared instrumentation to replace near-
infrared
• Ability to provide property estimates for multiple fuel types (diesel,
kerosene, gasoline)
• Ability to discriminate fuel types (diesel, kerosene, gasoline)
• Automated1 instrument recalibration
• Diagnostics to monitor instrument performance
• Ability to identify potential fuel contamination (e.g. water)
1 Requires some operator assistance
14
05/12/99 WED 19:58 FAX 17037841378 CWL 01022 I- o- = =i I o .- io ianni IUI V. U2| |2IU » * i; äifU ff 23/- 4D
Advantages:
• Mid-infrared spectrometers provide more detailed information about
a fuel's chemical composition and fiber-optic cables are not required
• System is more robust
• System becomes deployable at a variety of installations {e.g. fuel
farms, tank farms, shipyards, airfields, etc.)
• System is self-monitoring and thus more reliable
Task 3 - Handheld Instrument
Task 3 will be to design a portable device for remote fuel analysis.
Technology permitting the device will be handheld. This task will be
undertaken once the technology to produce a miniature near-infrared
spectrometer has matured to an acceptable level.
Expected Hardware and Capabilities
Hand transportable instrument package (handheld or briefcase size)
Rapid analysis of fuel quality (GO/NO GO or full analysis)
Interchangeable sampling devices (cuvette or probe)
Possible power sources: rechargeable batteries, vehicle battery, solar
power, standard 120 VAC
Multi-fuel analysis capability (diesel. kerosene, gasoline)
Ability to discriminate fuel types
Ability to identify possible contamination {e.g. water)
Use of palmtop computers
Advantages
• No sample preparation
15
05/12/99 WED 19:58 FAX 17037841378 CWL g]023 , 4S. \ KJ =>£.■£. Jü / u w aus «*u
• Easily transported by scout teams in the field
• Can use disposable sampling accessories (cuvettes) so there is no
need to carry solvents or compressed air in the field
• Variety of sources for power
• Information stored in computer can be uploaded to main database
• Interchangeable sampling devices give flexibility in the field
Task 4 - Inventory and Data Presentation
The fourth task will seek to automate the collection and display of fuel
inventory/quality data through additional hardware and software upgrades.
Modifications and Upgrades:
• Handheld and wireless data loggers for entering transactions
• Bar code scanners for data entry
• Wireless (or Wired) flow meters for automated collection of volume
data while dispensing or receiving fuel
• Automatic pump shut-offs or flow restriction when fuel specifications
are beyond tolerance levels
• Multipoint monitoring (ability to acquire fuel quality data at multiple
points simultaneously)
• Upgraded fuel inventory/quality tracking
• Ability to export fuel/inventory quality data
• Ability to print situation reports (local or network printer)
• Ability to track vehicle-specific refueling incidents
• Ability to track inventory for multiple fuel pods and fuel types at a
given site
16
05/12/99 WED 19:58 FAX 17037841378 CWL • •£. I *-* => £. Ü Ji ?U
11024 ?F J 1 ^ -S-U
Advantages:
Access to refueling history for individual vehicles (when, where, by
whom, how much, type of fuel, and quality)
Bar coding automates the entry of vehicle and personnel data into the
system
Added features for plotting/extracting fuel inventory/quality historical
data (i.e. enhanced database search capability)
No need to travel between the dispensing site and the monitoring site
for data entry
Automatic pump shutdown prevents contaminated fuel from entering
vehicles
Can monitor feeds from multiple pods and entry and exit points of the
fuel distribution system simultaneously
Wireless devices remove restrictions (e.g. distance) imposed by
hardwiring
Task 5 - Integration Upgrades
Task S will seek to globalize the fuel inventory/quality data in an effort to
increase total fuel asset visibility.
Modifications and Upgrades:
• Real time transmission of fuel inventory/quality data to secured web
site and/or to a server for global distribution
• Renovated Graphical User Interface (GUI)
• Download of fuel inventory/quality data to Personal Data Assistants
(PDA)
• Server interfaces (computer, display, and keyboard) located at all fuel
17
05/12/99 WED 19:59 FAX 17037841378 CWL @|025 ,itiu=jkiicjüfu » Jit/ 4L)
related sites (e.g. tank farms, dispensing terminals, pipelines,
airfields, shipyards, etc.)
. • On-line ordering of fuel and spare parts from supply sources and/or
units
• Automated scheduling of maintenance/quality checks on vehicles,
equipment, and fuel
• Registry of fuel related equipment at each site (e.g. petroleum
laboratory equipment)
• Each site has a list of parameters identifying its capabilities and
inventory (e.g. fuel storage capacity, fuel/spare parts on hand, fuel
analysis capabilities, etc.)
Advantages:
• All fuel related sites are interconnected thereby reducing the
communication gap
• Automated re-ordering of fuel and spare parts
• Remote recognition and anticipation of customer fuel status and
requirements
• All fuel related equipment is tracked and can be located by a simple
database search
• Each site is aware of the capabilities and inventory of every other site
• New GUI is user friendly and displays information in an organized
and efficient manner
IX. CONCLUSIONS
Guided by the requirements specified by the United States Marine Corps, the Remote Near-
Infrared Fuel Monitor was developed to monitor fuel quality and track fuel inventory in real-
time. The system was deployed in a remotely located bulk fuel in Twenty-nine Palms, CA
18
05/12/99 WED 19:59 FAX 17037841378 CWL 0)026 C t O fc f 1_# TFJ 3V -4- U
during Hunter-Warrior in 1997. Both contaminated and acceptable fuels were used to test
the system with good results. The Remote Fuel Monitor successfully identified contaminated
fuel in both the fuel distribution system and in vehicles.
The fuel inventory and quality data that was collected was sent to a remote monitoring
station at Camp Pendleton. The remote monitoring station at Camp Pendleton had access
to the same vital fuel quality and quantity data as did the bulk fuel farm. As a result, the
ability to track fuel inventory and quality was successfully demonstrated. By tracking fuel
inventory and quality in real-time, the future requirements of the fuel farm can be anticipated.
Using the Remote Near-Infrared Fuel Monitor allows a pro-active, rather than reactive,
approach to fuel management.
Based on the experimental data collected during Hunter-Warrior, several modifications to
the system have been suggested. These modifications would further ruggedize the system,
provide monitoring capability for multiple fuel types, increase inventory tracking capability,
and prepare the system for wide-scale use.
X. REFERENCES
1. Westbrook. S.R., Hutzler S.A., Interim Report TFLRF No. 313, U.S. Army
TARDEC Fuels and Lubricants Research Facility (SwRI), Southwest Research
Institute, San Antonio, Texas.
2. Fodor. G.E.. Hutzler S.A., Interim Report TFLRF No. 321, U.S. Army TARDEC
Fuels and Lubricants Research Facility (SwRI), Southwest Research Institute, San
Antonio, Texas.
3. Burns, D.A.; Ciurczak, E.W., Handbook of Near-Infrared Analysis, Marcel Dekker,
Inc., New York., 1992.
4. Brown, S.D. Appl. Spectrosc. 1995,49, 14A-31 A.
5. Thomas, E.V. Anal. Chem. 1984, 66,795A-804A.
19
INTENTIONALLY LEFT BLANK
20
05/12/99 WED 19:59 FAX 17037841378 CWL ©027 ■rt- o zy s *nj
XI. APPENDIX A (Figures)
21
05/12/99 WED 19:59 FAX 17037841378 CWL a ■£.£. SÜ f KJ
@K g)028
C.T
C.C-
a.S
■i 0.4 I I 0.3
J f\
1 1 li ■ 1 / / / /
J ■ —- • s
1 1 1
\
A- K
J s i |
i low i too tSOD 1300 MOO 1500 !600
Figure 1. Diesel Fuel Near- Infrared Spectrum
Figure 2. Pipe Section Figure 3. Near-Infrared Spectrometer
22
05/12/99 WED 20:00 FAX 17037841378 CWL a £- £. -O X. f U
@029
to 29 Palms
Ethernet Hub
>
Laptop
Wnmirvj Lirjhl □
Chassis Bo*
to Camp Pendlelon ■
LAN Connection
Near-Infrared Spectrometer
Monitoring Station (Desktop PC)
Fiber-Oplic Probes
\
\
Sampling Port
r , j Flow Section
Data Cable (Thermocouple, Flow fcteler)
Figure 4. Kimuic Fuel .Monitor (Hunter«Wurrior)
23
05/12/99 WED 20:00 FAX 17037841378 CWL I W ^ £.£. J3 -£. I U
@]030 W S&S 4U
'-'■--
ri.B? ■
0.94 ' US* ■
fl.8« ■
Ö.63
OJH
0.»:
0.8 •7
■3.79 A Ci
0 6 O.B2 G.!W Actual
Figure 5. Density
.4
5*.s
1.5
£1
2 2.5 3 35
Figure 6. Viscosity
35 *w 45 50 55 90
Figure 7. Cetane Index D 4737 Figure 8. Total Aromatic Content
43.0
435
\ 45
£ «.f
42 4
«.2 U>A «.6 «.S 4-3 Actual
.£ 43.4 43.4
Figure 9. Net Heat of Combustion, MJ/Kg Figure 10. Cloud Point
24
n-fr Stzsr. M TCO©
rw^c -7.7.C r\ t -p. • IAD
i « e= _ Q
silitiUdh'xvI'io^oz aaM 66/ZT/SO
PO 05
.\o?-;»-*;,;
^■SViji-wsi
MX* fr ll 'I1 EurK'w"■ ^"""ii^pii^p<nj:'ult'MUH' piimii'jlinf
* W£ 11$
OTi
:i;:-:ri:-3<£££3iKiLi!iH
- ^^M
JHkpf
lipIlSIlii
zvötfa n 1 •?' c- Z>T. c: nt t
1M0 $L£U$L£0LT YVd Z0:0Z Q3M 66/ZT/SO
*************** -IND. XMT JOURNAL- **************** DATE JUN-04-1999 ***** TIME 13=33 ********
DATE/TIME
JOURNAL No.
COMM.RESULT
PAGECS)
DURATION
FILE No.
MODE
DESTINATION
RECEIUED ID
RESOLUTION
= JUN-04-1999 13=27
= 01
= OK
= 023/023
= 00= 05'24
= 090
= MEMORY TRANSMISSION
= 9914197240255
/
= STD
^|\ /j\ sj\ Jf* J|\ sj\ ^TL ^\ ^\ ^s •fs ^\ ^\ ffs ^s ^, ^\ ^X% jf*- sj* JTb *T^ 'l^ 'F* ^V* fV* *I^ 'M 'TN'l^^T^'I^'M'I^'T^'l^