Embed Size (px)
Citation preview

Remote Electronic Alcohol Monitoring
2002 Report
February 2002
Minnesota Department of Corrections 1450 Energy Park Drive, Suite 200
St. Paul, Minnesota, 55108-5219 (651) 642-0200
TTY (651) 643-3589
This information will be made available in alternative format upon request. Printed on recycled paper with at least 10 percent post-consumer waste.
The total cost of salaries, printing, and supplies incurred in the development
and preparation of this report is $1,809 (report required by M.S. 3.197).

2002 REAM Report Research & Evaluation Unit i
Table of Contents Executive Summary ................................................................................................................... 1
Introduction ................................................................................................................................ 3
Overall Summary of Findings ..................................................................................................... 5
Pre-Sentence Participants .............................................................................................. 5 Post-Sentence Participants........................................................................................... 17
Conclusion ............................................................................................................................... 30

2002 REAM Report Research & Evaluation Unit ii
Figures Pre-Sentence Participants Figure 1 Offenders’ Race .......................................................................................................... 5 Figure 2 Whether Offender is Hispanic...................................................................................... 5 Figure 3 Marital Status .............................................................................................................. 6 Figure 4 Monthly Gross Income................................................................................................. 6 Figure 5 Gender ........................................................................................................................ 7 Figure 6 Number of Dependents ............................................................................................... 7 Figure 7 Employment Status at REAM Enrollment .................................................................... 8 Figure 8 Employment Status at REAM Discharge ..................................................................... 8 Figure 9 Offense Level .............................................................................................................. 9 Figure 10 DUI Level .................................................................................................................. 9 Figure 11 Number of Prior Alcohol-Related Driving Offenses .................................................. 10 Figure 12 Whether Offender Received a Public Defender ....................................................... 11 Figure 13 Type of REAM Payment .......................................................................................... 11 Figure 14 Whether Offender had Violations While on Monitoring............................................. 12 Figure 15 Types of Violations While on Monitoring .................................................................. 13 Figure 16 Types of Arrests While on Monitoring ...................................................................... 13 Figure 17 County Response to Violations & Arrests ................................................................ 14 Figure 18 Type of Discharge ................................................................................................... 15 Figure 19 Length of REAM Enrollment .................................................................................... 16 Post-Sentence Participants Figure 20 Offenders’ Race ...................................................................................................... 17 Figure 21 Whether Offender is Hispanic.................................................................................. 17 Figure 22 Marital Status .......................................................................................................... 18 Figure 23 Monthly Gross Income............................................................................................. 18 Figure 24 Gender .................................................................................................................... 19 Figure 25 Number of Dependents ........................................................................................... 19 Figure 26 Employment Status at REAM Enrollment ................................................................ 20 Figure 27 Employment Status at REAM Discharge ................................................................. 20 Figure 28 Offense Level .......................................................................................................... 21 Figure 29 DUI Level ................................................................................................................ 21 Figure 30 Number of Prior Alcohol-Related Driving Offenses .................................................. 22 Figure 31 Whether Offender Received a Public Defender ....................................................... 23 Figure 32 Type of REAM Payment .......................................................................................... 23 Figure 33 Number of Months of Probation Ordered ............................................................... 24 Figure 34 Whether Offender Participated in an Intensive Probation Program for DUI Offenders.......................................................................................................... 24 Figure 35 Whether Offender had Violations While on Monitoring............................................. 25 Figure 36 Types of Violations While on Monitoring .................................................................. 26 Figure 37 Types of Arrests While on Monitoring ...................................................................... 26 Figure 38 County Response to Violations & Arrests ................................................................ 27 Figure 39 Type of Discharge ................................................................................................... 28 Figure 40 Length of REAM Enrollment .................................................................................... 29

2002 REAM Report Research & Evaluation Unit 1
Executive Summary This report fulfills the legislative mandate requiring the Department of Corrections (DOC) to submit a report on the effectiveness of REAM (Remote Electronic Alcohol Monitoring) programming (Laws 2001, Chapter 80). This report answers two primary questions: Who participates in REAM programming, and what happens when a person on REAM commits a program violation or is arrested?
Although it will be important to determine the recidivism rates of those DUI offenders who participate in REAM programming, there has been insufficient time since offender completion of programming for the DOC to conduct a recidivism study. The sample of REAM participants on which this study is based completed their REAM program no later than December 15, 2001. Recidivism rates will be included in a report completed in 2004. It is possible that by 2004 the advent of the Statewide Supervision System (SSS) will allow the DOC to construct a control group from non-REAM counties for comparison without denying some offenders the opportunity to participate in REAM. It would be unethical to deny offenders, especially indigent offenders who would spend more time in jail, the opportunity to participate in REAM for research purposes. The SSS will be used to construct a comparison group without denying anyone the opportunity to participate, allowing for comparison in recidivism rates between the control and REAM groups. A comparison group is not necessary to determine if REAM is meeting its other goals, so this current report examines the REAM program itself to assess whether REAM: gives indigent offenders alternatives to jail and an opportunity to remain employed while on supervision, and aids in supervision of DUI offenders. This report is organized into two sections. The first section reports the information on those offenders who are assigned to REAM prior to sentencing. The second section is based on those offenders who are assigned to REAM after their sentencing. It is important to note that this report includes all participants to REAM programming, not just those offenders who receive cost subsidies from counties. Pre-Sentence REAM Participants ♦ The majority of pre-sentence REAM participants are white males with an average monthly gross income of
$1,982. On average, pre-sentence participants were enrolled in REAM for 40 days. ♦ One goal of REAM is to keep people out of jails and able to maintain their employment. Almost three-
quarters of participants were employed either full or part-time at REAM enrollment. An almost equal percentage (72%) was employed at discharge.
♦ Most pre-sentence participants were arrested for a gross misdemeanor offense; almost equal percentages
were arrested for 1st degree (42%) or 2nd degree DUI (38%). Forty-six percent of the participants had one or two prior DUI offenses (degree unknown). Ten percent had at least three prior DUI offenses (degree unknown).
♦ REAM legislation stipulates that funds be available to help indigent offenders pay for the cost of the
monitoring. Because the legislation does not define indigent, many counties assume that if an offender receives a public defender, they are eligible for a subsidy. More than one-third (37%) of pre-sentence participants received a public defender. Of these, 47 percent received a partial subsidy to cover their REAM costs and 34 percent received a full subsidy. Overall, over half (53%) of the pre-sentence participants fully paid their REAM cost themselves. Less than two in ten (18%) had their cost fully subsidized by the county.
♦ In studying REAM, it is important to determine participants’ level of program violations and arrests. Only 15
percent of the pre-sentence participants committed some type of program violation or were arrested while on monitoring. This resulted in a total of 153 violations or arrests. Approximately 50 percent or less of the total violations were alcohol-related or for electronic monitoring violations (alcohol-related includes having alcohol on breath during a check, and electronic monitoring violations include things such as missing a test, an incomplete test, or not paying costs). In addition, very few offenders (between one and two percent) were arrested for a new DUI offense while participating in the program.
2002 REAM Report Research & Evaluation Unit 2
♦ A major tenet of REAM programs is that program response to violations and arrests is swift and certain. Only two percent of the violations or arrests received no official response, while almost four in ten (39%) resulted in a warrant request to the court. Other responses include referrals to court or prosecution, verbal warnings, and apprehension and detention holds.
♦ Overall, more than three-quarters (77%) of pre-sentence REAM participants successfully completed their
REAM program. Less than one in ten (8%) were removed because they posted bail in lieu of monitoring or because they had alcohol-related program violations (6%).
Post-Sentence REAM Participants ♦ The highest percentages of post-sentence REAM participants are white males. Forty-two percent are
single and almost three in ten (29%) do not have any monthly income. In addition, 43 percent earn less than $2,000 a month while almost one-quarter (23%) earn more than $2,000 monthly. On average, post-sentence REAM participants have two dependents (including themselves) and earn $1,656 a month. Participants spent an average of 42 days enrolled in REAM.
♦ Sixty-two percent of REAM participants were employed full or part-time at REAM enrollment and
maintained that employment through discharge. The unemployment rate remained constant at enrollment (18%) and at discharge (17%).
♦ Almost nine in ten (88%) participants were arrested for a gross misdemeanor. Forty-three percent were
arrested for a DUI (degree unknown) while one-third (32%) were arrested for a 2nd degree DUI. REAM participants also had prior arrest histories; 20 percent of participants had been arrested for one prior DUI (degree unknown), while an additional 20 percent had three or more prior DUIs (degree unknown).
♦ Almost half (49%) of participants received a public defender. Of these, almost half (49%) received a partial
subsidy from the county to pay their REAM costs while one-quarter received a full subsidy. Overall, slightly more than four in ten (42%) fully paid their REAM costs while one-third (34%) received partial payment and one-quarter (24%) received a full subsidy from the county.
♦ Most post-sentence REAM participants participated in the program in conjunction with probation. Almost
half (49%) of the REAM participants received between 24 and 36 months of probation, while two in ten (19%) received 48 months. While 13 percent received no probation at all, 15 percent received 60 months or more. Slightly more than two in ten (21%) participants participated in an intensive probation program for DUI offenders while they were enrolled in REAM. Twenty percent of the offenders involved in intensive probation had some type of violation or arrest while on REAM as compared to only seven percent of those who did not have intensive probation.
♦ Overall, one in ten (10%) participants had a violation or arrest while enrolled in REAM. This resulted in 37
violations, half of which were alcohol-related. Thirty-two percent of the violations were for electronic monitoring infractions (missing a test, incomplete test, etc.) and 14 percent were for absconding. Five percent of the violations or arrests were for a non-alcohol related driving offense. There were two non-alcohol related driving offenses and one each of a 2nd degree DUI, degree-unknown DUI, and a felony person offense.
♦ Approximately one-third (32%) of the violations/arrests resulted in an apprehension and detention hold or
the filing of a probation violation. One-quarter (24%) resulted in a verbal warning. All violations/arrests resulted in some type of program response. On average, the program response came 16 days after the violation or arrest occurred. However, more than half (57%) of the program responses came on the same day as the violation or arrest.
♦ Overall, 92 percent of the participants successfully completed their REAM programming.
2002 REAM Report Research & Evaluation Unit 3
Introduction What is REAM? REAM programs pair traditional electronic monitoring with a breath analyzer unit similar to those used by law enforcement personnel. This allows monitoring of both the identity and location of the offender as well as their alcohol concentration level. Offenders are phoned at random times during the time the offender is required to be home. The offender then responds to the call using the in-home equipment to verify his or her identity. Once the offender’s identity has been verified, the offender performs a breath test over the phone using the analyzer equipment. If the breath analysis test indicates the offender’s alcohol concentration is .03 or higher a second test is completed. If a violation is determined, the electronic monitoring company will report the violation to the probation officer for follow-up. Legislative History of REAM Judge James Dehn of the Tenth Judicial District pioneered the use of REAM in Minnesota. In 1995, the Minnesota legislature set aside $250,000 in grants to be awarded for a three-year pilot project to judicial districts interested in establishing REAM programs. The pilot programs were to ensure swift consequences for violating the court order to remain abstinent and, unless they were indigent, the offenders were to pay the per diem cost of monitoring. If the offender was indigent, the DOC was required to reimburse the district for monitoring costs incurred. The project received $235,000 a year during the three-year pilot (1996,1997, and 1998). An evaluation of the pilot projects was completed in 1998, and the legislature appropriated $765,000 in base funding for REAM. This base funding was awarded on a competitive basis to counties and judicial districts. Currently, there are 21 counties being funded by the REAM grant. Prior Evaluation & Current Research Methods An evaluation was completed after the three-year pilot project. At that time the DOC determined that ethical considerations prohibited the construction of a control group to compare to REAM participants. Some offenders (especially indigent offenders) would spend more time in jail if they were assigned to the control group. Instead, the DOC determined five research questions based on other intended goals of REAM programming:
♦ Do persons arrested for or convicted of a DWI maintain (or obtain) gainful employment while on REAM?
♦ How effective is REAM in preventing drinking and driving behavior and other criminal behavior while on REAM monitoring?
♦ Are sanctions for REAM violations swift and certain? ♦ What percentage of the offenders who successfully complete a REAM program are re-arrested for an
alcohol-related driving offense? ♦ Can the availability of grant funds increase the use of REAM among indigent offenders?
The 1998 evaluation found that 945 offenders had been assigned to one of the REAM pilot projects either as pre-sentence or post-sentence participants. The majority of these offenders were white males with an average age of 35 years. The study also found that 85 percent of the pre-sentence offenders completed REAM successfully while 95 percent of the post-sentence offenders successfully completed the program. The pilot also found that offenders retained the same level of employment at the beginning and end of the program. In addition, the program found that only nine offenders were re-arrested for any type of driving-related crime. Of these, eight of these offenses did not include alcohol. Finally, the report found that sanctions for program violations were swift and certain and the program provided a much-needed alternative to jail for indigent offenders. While the 1998 report was able to answer the five questions listed above, the data collection process was difficult for both the counties and the DOC, the data was often unusable or not necessary to answer the research questions, and the method for sending the data to the DOC was outdated. When legislation was introduced requiring submission of a report on REAM in 2002, the DOC decided to implement changes in how the data was collected and the type of data collected. The first step in producing the outcome evaluation was to

2002 REAM Report Research & Evaluation Unit 4
meet with REAM providers and county staff to develop better data collection methods. It was determined that a web-based reporting tool was needed that accomplished the following:
♦ Standardized data definitions and responses ♦ Ability to delete and edit records in the database ♦ Easy way to download individual county and aggregate data for research purposes ♦ Eliminate the need to send data to the DOC each quarter
Variables for the web-based data collection were determined with REAM providers and county staff based on the questions above by the legislature. The website went into effect July 1, 2001. It is important to note that this evaluation is based on those offenders whose data has been entered into the new web-based reporting site and who completed their REAM participation by December 15, 2001. Due to the lack of time between program completion and follow-up, recidivism rates of REAM offenders are not reported. This will be included in the report due in 2004. The continued use of the SSS will also allow the DOC to ethically construct a control group to use when measuring recidivism rates of REAM offenders. The SSS will allow the DOC to create a comparison group of DUI offenders who never had the opportunity to participate in REAM instead of creating one by denying offenders the opportunity to participate in a beneficial program. Please note that a control group is only useful in comparing recidivism rates. It is not useful in looking at whether REAM meets its other intended goals. Currently, there are 594 pre-sentence program completers and 273 post-sentence program completers. This report is organized into two main sections: pre-sentence completers and post-sentence completers. The overall data for the groups is followed by a conclusion discussing whether the REAM program is successful in helping offenders maintain employment, keeps offenders on monitoring from committing further crimes, provides swift and certain sanctions for program violators, and allows indigent offenders access to the program. The 2004 report will contain all of this information as well as recidivism information.

2002 REAM Report Research & Evaluation Unit 5
Overall Summary of Findings
FIGURE 1
FIGURE 2
Offenders' Race(N = 594)
White78%
Black9%
American Indian/
7%
Asian/
1%
Other5%
Alaskan Native
Pacific Islander
Pre-Sentence Participants
♦ More than three-quarters (78%) of pre-sentence REAM participants are white (Figure 1). Seven percent are American Indian or an Alaskan Native, while five percent identified their race as other.
♦ The Federal government considers race and Hispanic origin to be two separate and distinct concepts. For this reason, people of Hispanic origin can be of any race. For the 2000 census, race and Hispanic origin were asked of every individual. The DOC has adopted the same protocol as the federal government in asking race and ethnicity questions in its own demographic studies.
♦ Nine in ten (90%) REAM participants
are not Hispanic (Figure 2).
Whether Offender is Hispanic(N = 594)
Yes9%
No90%
Unknown1%

2002 REAM Report Research & Evaluation Unit 6
FIGURE 3
FIGURE 4
Other Findings ♦ One-quarter (25%) of those participants who received a public defender had no monthly gross income. In
addition, 14 percent had an income of less than $1,000 while 42 percent had a monthly income between $1,000 and $1,999. Thirteen percent had an income between $2,000 and $3,999 a month.
Marital Status(N = 594)
Married11%
Co-habitating2%
Divorced9%
Single19%
Widowed1%
Unknown57%
Other 1%
Monthly Gross Income*(N = 594)
*If offender is married, spouse's income is included in total.
No Income18%
Less Than $10008%
$1,001 to $1,99936%
$2,000 to $3,99927%
$4,000 to $5,9997%
$6,000 or More4%
♦ Figure 3 shows that the marital status of over half (57%) of the REAM participants is unknown. Almost two in ten (19%) of the participants are single while approximately one in ten are either divorced (9%) or married (11%).
♦ Almost two in ten (18%) of pre-sentence REAM participants do not have a monthly income (Figure 4). Forty-four percent earn less than $2,000 a month, while almost four in ten (38%) earn $2,000 or more each month.
♦ The average monthly income for pre-
sentence participants is $1,981.79.

2002 REAM Report Research & Evaluation Unit 7
FIGURE 5
FIGURE 6
Gender(N = 594)
Male80%
Female 20%
Number of Dependents*(N = 594)
*Includes the offender
One Dependent61%
Two Dependents18%
Three Dependents11%
Four Dependents6%
Five Dependents3%
More than 5 Dependents1%
♦ Eight in ten (80%) pre-sentence REAM participants are male while two in ten (20%) are female (Figure 5).
♦ Figure 6 shows the number of dependents for pre-sentence REAM participants. Slightly more than six in ten (61%) have no dependents other than themselves.
♦ Pre-sentence participants have
an average of two dependents.

2002 REAM Report Research & Evaluation Unit 8
FIGURE 7
FIGURE 8
Other Findings ♦ Sixty-two percent of participants who received a public defender were employed at REAM enrollment as
compared to approximately 83 percent of those participants who did not receive a public defender.
Employment Status at REAM Enrollment(N = 594)
Student1%
Full-time Employment64%
Part-time Employment9%
Retired1% Disabled
2%
Unemployed19%
Other1%
Unknown/Missing3%
Employment Status at REAM Discharge(N = 594)
Unemployed20%
Full-time Employment63%
Student1%
Retired1%
Unknown/Missing5%
Part-time Employment9%
Disabled1%
♦ One of the goals of REAM is to allow people arrested for DUI to retain their employment. To understand if this goal is being met, employment status at the beginning and end of an offender’s REAM participation must be captured. Figure 7 shows that almost three-quarters (73%) of participants were employed either full or part-time at the beginning of their REAM participation.
♦ Figure 8 shows that there is no significant difference in employment status at REAM discharge. Seventy-two percent of participants were employed either part or full-time at discharge.

2002 REAM Report Research & Evaluation Unit 9
FIGURE 9
FIGURE 10
Offense Level (N = 594)
Misdemeanor4%
Gross Misdemeanor95%
Felony1%
DUI Level(N = 594)
1st Degree42%
2nd Degree38%
3rd Degree4%
Degree Unknown/
16%Unspecified
♦ Almost all (95%) pre-sentence REAM participants were arrested for a gross misdemeanor offense (Figure 9).
♦ A little more than four in ten (42%) pre-sentence offenders were arrested for a 1st degree DUI (Figure 10). Almost four in ten (38%) were arrested for a 2nd degree DUI.
♦ The level of DUI was unknown for 16
percent of offenders.

2002 REAM Report Research & Evaluation Unit 10
FIGURE 11
♦ Figure 11 shows that, with the exception of DUIs with unknown degrees, pre-sentence REAM participants did not have many prior alcohol-related offenses.
♦ Almost one-quarter (23%) of participants had either one prior level-unknown DUI offense or two prior
unknown-level DUI offenses (23%). One in ten (10%) participants had three prior level-unknown DUI offenses, and five percent had four of this type of offense.
Number of Prior Alcohol-Related Driving Offenses(N = 594)
98% 96% 91%
39%
96% 96% 96% 99%
2% 3%7%
23%
3% 3% 3%1%1%
2%
23%
1% 1% 1%
10%
2%3%
DUI1st Degree
DUI2nd Degree
DUI3rd Degree
DUI DegreeUnknown
CarelessDriving
Underage Drinking& Driving
Open Bottle Other 0%
20%
40%
60%
80%
100%
No Prior Offenses One Prior Offense Two Prior OffensesThree Prior Offenses Four Prior Offenses More Than Four Prior Offenses

2002 REAM Report Research & Evaluation Unit 11
FIGURE 12
FIGURE 13
Other Findings ♦ Forty-seven percent of the participants who received a public defender received partial payment for their
REAM participation, while approximately one-third (34%) received full payment from the county for their REAM costs. In comparison, only 16 percent of the participants who did not receive a public defender received partial payment from the county, and even fewer (7%) received full payment.
Type of REAM Payment(N = 594)
Full PaymentOffender
53%
Partial Payment29%
Full PaymentCounty
18%
Whether Offender Received a Public Defender(N = 594)
Yes37%
No48%
Unknown15%
♦ One of the goals of REAM is to ensure indigent offenders have a chance to participate in jail alternatives, live in the community, and maintain employment. Because the legislation that funds the REAM grant does not define indigency, each county developed indigency criteria to determine who is eligible for the grant. For many counties, if an offender is eligible for a public defender he or she is also eligible for the REAM grant.
♦ Figure 12 shows that more than one-
third (37%) of offenders received a public defender.
♦ As shown in Figure 13, over half (53%) of REAM participants fully paid for their REAM participation. Almost three in ten (29%) partially paid for their REAM participation while the county fully paid for 18 percent of participants’ REAM costs.

2002 REAM Report Research & Evaluation Unit 12
FIGURE 14
♦ The majority (85%) of pre-sentence REAM participants did not have any violations (either program violations or new arrests) while participating in the REAM program (Figure 14).
Other Findings ♦ Research has shown that DUI offenders who pay for their DUI treatment have higher success rates than
those who do not have to pay for their intervention. Eight percent of the participants who fully paid for their REAM participation themselves had a violation while on monitoring. Twenty percent of those who had partial payment and 24 percent of those whose participation was fully subsidized by the county had violations while participating in a REAM program. Offenders who remain in jail are unable to drink and drive; for REAM to be a success, offenders on monitoring and in the community must also have low levels of program violations and arrests. Therefore, the rate of violations can be seen as a measure of program success.
Whether Offender Had Violations While on Monitoring
(N = 594)
Yes15%
No85%

2002 REAM Report Research & Evaluation Unit 13
FIGURE 15
FIGURE 16
Types of Violations While on Monitoring*(N = 153)
*There were 86 offenders with violations while on REAM. These offenders had a total of 153 violations. Therefore, percents do not equal 100. This question was asked only of those offenders who had violations.
50%
4%
48%
0%5% 5% 4%
AlcoholRelated
DrugRelated
ElectronicMonitoring
TreatmentViolation
Failure ToReport
Abscond Other0%
20%
40%
60%
80%
100%
Types of Arrests While on Monitoring*(N = 153)
*Offenders could have more than one arrest. Therefore, percents do not equal 100 and are based on the number of arrests, not the number of offenders. This question was also asked only of those offenders with arrests.
0% 1% 1% 1% 2% 1% 0% 0% 1% 0%
DrivingOffense
(Non-Alcohol)
DUI1st
Degree
DUI2nd
Degree
DUI3rd
Degree
DUIDegreeUnkown
DrivingOffense(Alcohol)
M/GMPropertyOffense
M/GMPersonOffense
FelonyPropertyOffense
FelonyPersonOffense
0%
20%
40%
60%
80%
100%
♦ Figure 15 shows that of the 153 participants who had a violation while on monitoring, half had an alcohol- related violation (positive for alcohol when calling in) while almost half (48%) had some type of electronic monitoring violation (i.e., incomplete test, missed phone call, failure to pay monitoring costs, etc.).
♦ Very few participants who had a violation while on REAM were arrested for a new offense during their participation (Figure 16). Two percent of these participants were arrested for a level-unknown DUI while three percent were arrested for either a level one, two, or three DUI during their REAM participation.

2002 REAM Report Research & Evaluation Unit 14
FIGURE 17
♦ Often, counties do not know the final outcome of a REAM participant’s program violation or arrest because their involvement ends with a warrant request or a referral to court. The court’s outcome is often not communicated to the county. Because of this, only the REAM program’s response to the violation or arrest is reported here. Figure 17 shows a warrant request was submitted to the court for 39 percent of participants who had some type of violation or arrest during their participation. Almost one-quarter of program violators received a referral to court or prosecution, while almost two in ten (18%) received a verbal warning.
♦ Fourteen percent of participants received some other response to their violation or arrest. These other
responses include maximum bail imposed, terminated from monitoring, violation information sent to prosecutor, and having the violation information forwarded to the probation officer.
♦ One of the goals of REAM is to ensure that participants receive swift and certain responses to program
violations and arrests that occur while on monitoring. As indicated in Figure 17, only two percent of participants with any type of violation or arrest received no program response. In addition, there was an average of five days between the actual violation or arrest occurring and the subsequent program response. In 46 percent of the cases, the program response occurred on the same day as the violation and 31 percent of the violations received a program response within one to two days after it occurred.
County Response to Violations & Arrests(N = 153)
*Counties could impose more than one response for offender violations or arrests. Therefore, percents do not equal 100 and are based on the number of violations and arrests, not the number of offenders.
13%
39%
1% 1%6%
24%18%
14%
2%
Apprehension& Detention
Hold
WarrantRequestto Court
IncreasedUA/BATesting
ReferredTo
Treatment
WarrantlessArrest OfReleaseViolation
Referral To Court Or
Prosecution
VerbalWarning
OtherResponse
No Response0%
20%
40%
60%
80%
100%

2002 REAM Report Research & Evaluation Unit 15
FIGURE 18
♦ More than three-quarters (77%) of pre-sentence REAM participants successfully completed the REAM
program (Figure 18). Eight percent did not complete the program because they posted bail in lieu of monitoring, while 11 percent were removed for some type of violation or arrest.
♦ Four percent of the participants received some other type of discharge not listed in the web-based data
collection instrument. These other discharges included termination due to enrollment in in-patient treatment programs, marginally successful (balance still owing), equipment did not work on participant’s phone line, and case dismissed.
Other Findings ♦ The rate of successful completion of the REAM program was high for all three payment groups: 80 percent
for those offenders who fully paid for their REAM programming, 74 percent for those who received partial payment from the counties, and 77 percent for those who had their REAM costs fully subsidized.
Type of Discharge(N = 594)
77%
6%1% 1%
8%3% 4%
SuccessfulCompletion
Removedfor
Alcohol-RelatedProgram Violation
Removed/Arrested For
NewOffense
Moved ToPost Trial
Participation
PostedBail In Lieu Of
Monitoring
Removed ForNon-Alcohol
Program Violation
OtherDischargeReason
0%
20%
40%
60%
80%
100%

2002 REAM Report Research & Evaluation Unit 16
FIGURE 19
♦ Figure 20 shows the number of days offenders spent on pre-sentence REAM monitoring. Approximately eight in ten (81%) participants spent between 60 days or less on REAM while almost two in ten spent more than 60 days on pre-trial REAM.
♦ The average number of days on REAM for pre-sentence participants is 40 days. The highest number of
days reported was 515.
Length of REAM Enrollment(N = 594)
Ten Days or Less17%
11 to 30 Days35%
31 to 60 Days29%
61 to 90 Days11%
91 to 120 Days3%
121 to 240 Days4%
More Than 240 Days1%
2002 REAM Report Research & Evaluation Unit 17
♦
FIGURE 20
FIGURE 21
Post-Sentence Participants
Whether Offender is Hispanic(N = 273)
Yes3%
No96%
Unknown1%
Offenders' Race(N = 273)
White89%
Black1%
American Indian/
9%
Asian/
1%
Alaskan Native
Pacific Islander
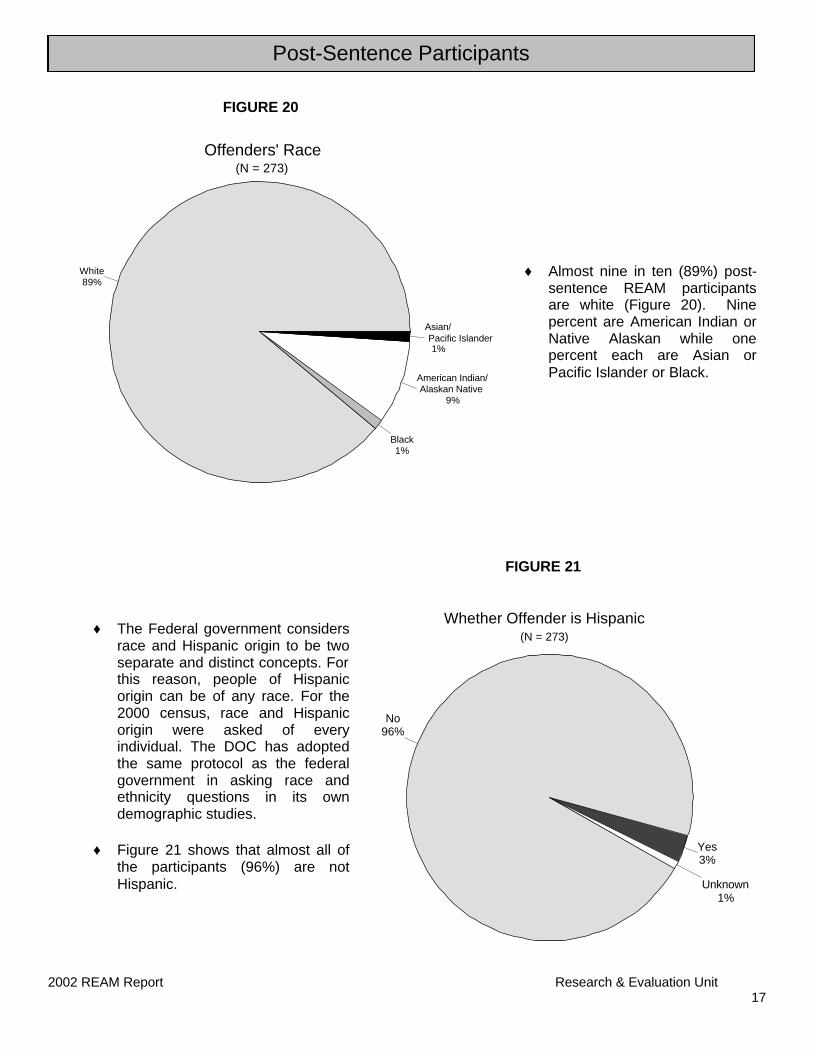
♦ Almost nine in ten (89%) post-sentence REAM participants are white (Figure 20). Nine percent are American Indian or Native Alaskan while one percent each are Asian or Pacific Islander or Black.
♦ The Federal government considers race and Hispanic origin to be two separate and distinct concepts. For this reason, people of Hispanic origin can be of any race. For the 2000 census, race and Hispanic origin were asked of every individual. The DOC has adopted the same protocol as the federal government in asking race and ethnicity questions in its own demographic studies.
♦ Figure 21 shows that almost all of
the participants (96%) are not Hispanic.
2002 REAM Report Research & Evaluation Unit 18
FIGURE 22
FIGURE 23
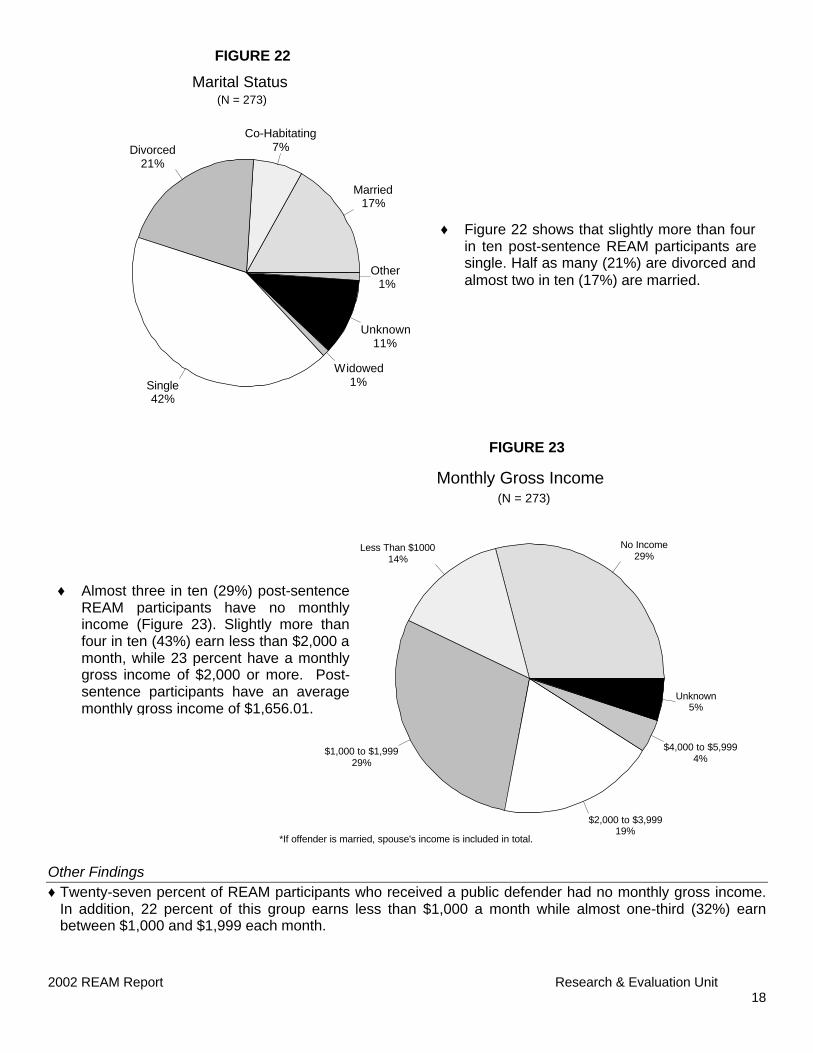
Other Findings ♦ Twenty-seven percent of REAM participants who received a public defender had no monthly gross income.
In addition, 22 percent of this group earns less than $1,000 a month while almost one-third (32%) earn between $1,000 and $1,999 each month.
Marital Status(N = 273)
Married17%
Co-Habitating7%Divorced
21%
Single42%
Widowed1%
Unknown11%
Other 1%
Monthly Gross Income(N = 273)
*If offender is married, spouse's income is included in total.
No Income29%
Less Than $100014%
$1,000 to $1,99929%
$2,000 to $3,99919%
$4,000 to $5,9994%
Unknown5%
♦ Figure 22 shows that slightly more than four in ten post-sentence REAM participants are single. Half as many (21%) are divorced and almost two in ten (17%) are married.
♦ Almost three in ten (29%) post-sentence REAM participants have no monthly income (Figure 23). Slightly more than four in ten (43%) earn less than $2,000 a month, while 23 percent have a monthly gross income of $2,000 or more. Post-sentence participants have an average monthly gross income of $1,656.01.

2002 REAM Report Research & Evaluation Unit 19
FIGURE 24
FIGURE 25
Gender(N = 273)
Male75%
Female25%
Number of Dependents*(N = 273)
*Including the offender
One Dependent60%
Two Dependents17%
Three Dependents9%
Four Dependents9%
Five Dependents3%
More Than 5 Dependents2%
♦ Three-quarters (75%) of post-sentence REAM participants were male while one-quarter (25%) were female (Figure 24).
♦ Six in ten (60%) participants have no dependents other than themselves (Figure 25).
♦ Post-sentence participants have an
average of two dependents.

2002 REAM Report Research & Evaluation Unit 20
FIGURE 26
FIGURE 27
Employment Status at REAM Discharge(N = 273)
Unemployed17%
Full-TimeEmployment
51%
Part-TimeEmployment
11%
Retired1%
Disabled3%
Student2%
Other1%
Unknown/Missing
14%
♦ Figure 26 shows that 62 percent of post-sentence REAM participants were employed full or part-time at REAM enrollment.
♦ Approximately two in ten (18%)
participants were unemployed at enrollment.
♦ Figure 27 shows that the employment rates at REAM discharge were very similar to the REAM enrollment employment rates; 62 percent of participants were employed either full or part-time at discharge while 17 percent were unemployed.
Employment Status at REAM Enrollment(N = 273)
Unemployed18%
Full-time Employment51%
Part-time Employment11% Retired
1%
Disabled3%
Student2% Other
2%
Unknown/Missing12%

2002 REAM Report Research & Evaluation Unit 21
FIGURE 28
FIGURE 29
Offense Level (N = 273)
Misdemeanor12%
Gross Misdemeanor88%
DUI Level(N = 273)
1st Degree19%
2nd Degree32%
3rd Degree6%
Degree Uknown/
43%Unspecified
♦ Almost nine in ten (88%) post-sentence REAM participants were placed on REAM for a gross misdemeanor offense (Figure 28).
♦ Slightly more than four in ten (43%) participants were placed on REAM for an level-unknown DUI offense (Figure 29). Almost one-third (32%) had a 2nd degree DUI offense, while 19 percent had a 1st degree offense.
2002 REAM Report Research & Evaluation Unit 22
FIGURE 30
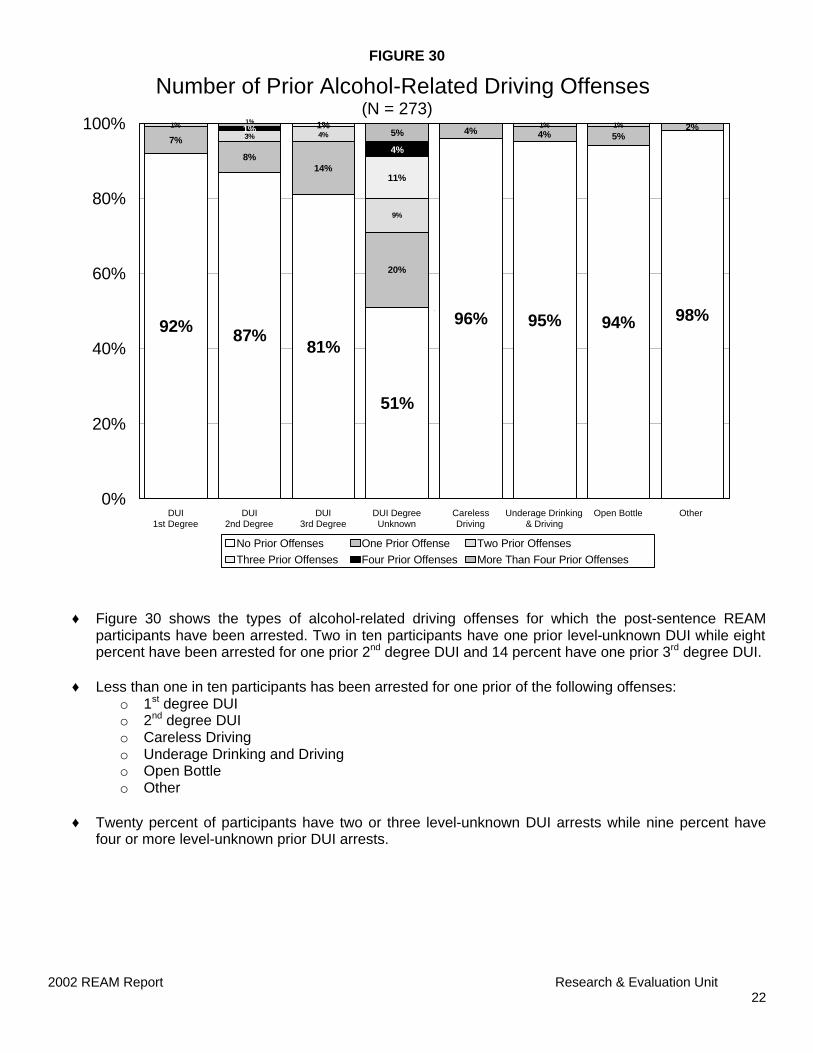
♦ Figure 30 shows the types of alcohol-related driving offenses for which the post-sentence REAM participants have been arrested. Two in ten participants have one prior level-unknown DUI while eight percent have been arrested for one prior 2nd degree DUI and 14 percent have one prior 3rd degree DUI.
♦ Less than one in ten participants has been arrested for one prior of the following offenses:
o 1st degree DUI o 2nd degree DUI o Careless Driving o Underage Drinking and Driving o Open Bottle o Other
♦ Twenty percent of participants have two or three level-unknown DUI arrests while nine percent have
four or more level-unknown prior DUI arrests.
Number of Prior Alcohol-Related Driving Offenses(N = 273)
92% 87%81%
51%
96% 95% 94% 98%
7%
8%14%
20%
4% 4% 5%2%1%
3% 4%
9%
1% 1%1%
11%
1%
4%
1%
5%
DUI1st Degree
DUI2nd Degree
DUI3rd Degree
DUI DegreeUnknown
CarelessDriving
Underage Drinking& Driving
Open Bottle Other 0%
20%
40%
60%
80%
100%
No Prior Offenses One Prior Offense Two Prior Offenses
Three Prior Offenses Four Prior Offenses More Than Four Prior Offenses

2002 REAM Report Research & Evaluation Unit 23
FIGURE 31
FIGURE 32
Other Findings ♦ More than one-quarter (26%) of those offenders who received a public defender fully paid for their
REAM participation. Almost half (49%) had their participation partially subsidized while one-quarter (25%) had their participation fully subsidized by the county. In contrast, more than two-thirds (67%) of those who did not receive a public defender fully paid for their costs themselves. Almost one-quarter (23%) had their payments partially subsidized while only nine percent of those who did not have a public defender had their payments fully subsidized by the county.
Whether Offender Received a Public Defender(N = 273)
Yes49%
No27%
Unknown24%
Type of REAM Payment(N = 273)
Full PaymentOffender
42%
Partial Payment34%
Full PaymentCounty
24%
♦ Figure 31 shows that almost half (49%) of participants received a public defender. Almost equal percentages of participants did not receive a public defender (27%) or their defender status was unknown (24%).
♦ Slightly more than four in ten (42%) participants fully paid for their REAM participation themselves (Figure 32).
♦ Approximately one-third paid partially
with the county subsidizing part of the REAM costs.
♦ Almost one-quarter (24%) had their
REAM costs fully subsidized by the county.
2002 REAM Report Research & Evaluation Unit 24
FIGURE 33
FIGURE 34
Whether Offender Participated in an Intensive Probation Program for DUI Offenders
(N = 273)
Yes21%
No79%
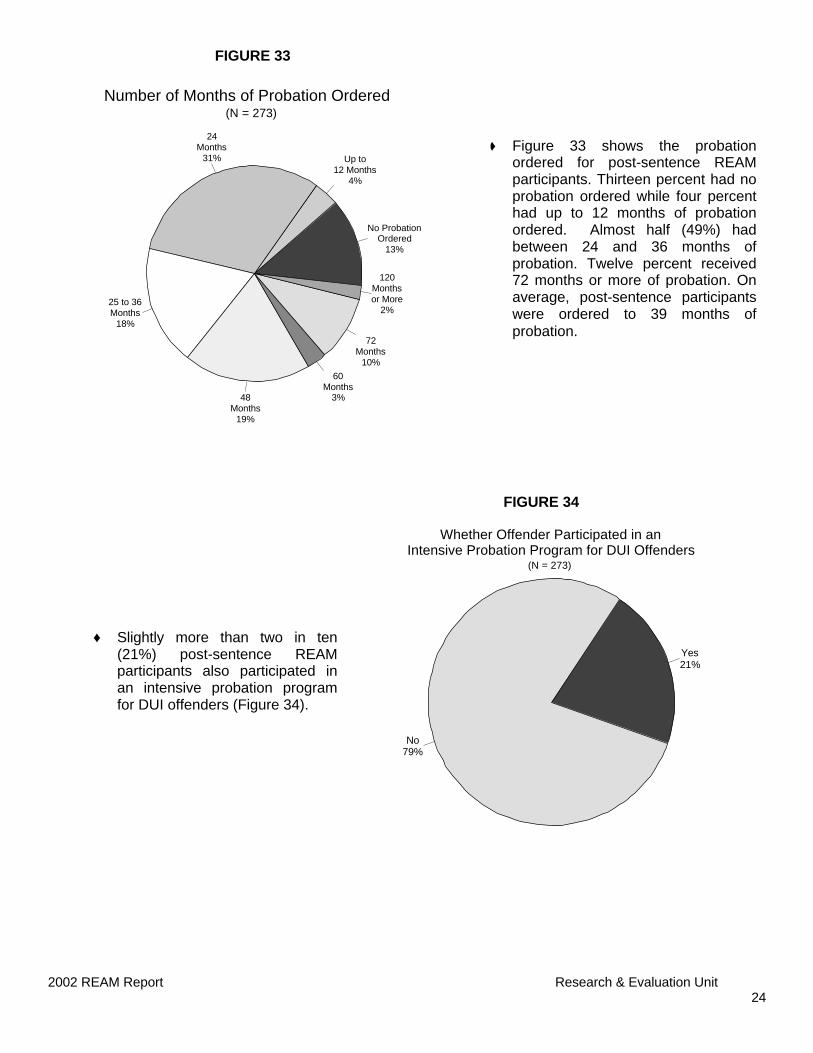
♦ Figure 33 shows the probation ordered for post-sentence REAM participants. Thirteen percent had no probation ordered while four percent had up to 12 months of probation ordered. Almost half (49%) had between 24 and 36 months of probation. Twelve percent received 72 months or more of probation. On average, post-sentence participants were ordered to 39 months of probation.
♦ Slightly more than two in ten (21%) post-sentence REAM participants also participated in an intensive probation program for DUI offenders (Figure 34).
Number of Months of Probation Ordered(N = 273)
No ProbationOrdered
13%
Up to12 Months
4%
24Months
31%
25 to 36Months
18%
48Months
19%
60Months
3%
72Months
10%
120Monthsor More
2%

2002 REAM Report Research & Evaluation Unit 25
FIGURE 35
♦ One in ten (10%) post-sentence REAM participants had some type of program violation or arrest while participating in the REAM program (Figure 35).
Other Findings ♦ Four percent of those participants who fully paid for their REAM participation themselves had violations
while on monitoring. This is also true for 16 percent of those who had their participation partially subsidized by the county. Twelve percent of those who had their participation fully subsidized by the county violated while on monitoring.
♦ Twenty percent of those offenders who participated in an intensive probation program had violations while
on monitoring while only seven percent of those who did not participate in intensive probation had a violation.
Whether Offender Had Violations While on Monitoring
(N = 273)
Yes10%
No90%

2002 REAM Report Research & Evaluation Unit 26
FIGURE 36
FIGURE 37
Types of Violations While on Monitoring*(N = 37)
*Offenders could have more than one violation. Therefore, percents do not equal 100 and are based on total number of violations, not number of offenders who violated. Also, this question was asked only of those offenders who had a violation.
54%
8%
32%
5%
14%
AlcoholRelated
DrugRelated
ElectronicMonitoring
TreatmentViolation
Failure ToReport
Abscond Other0%
20%
40%
60%
80%
100%
Types of Arrests While on Monitoring*(N = 37)
*Offenders could have more than one arrest. Therefore, percents do not equal 100. Also, this question was asked only of those offenders who were arrested while on monitoring.
5% 3% 3% 3%
Driving Offense DUI2nd
Degree
DUIDegreeUnkown
FelonyPersonOffense
0%
20%
40%
60%
80%
100%
(Not Alcohol-Related)
♦ Of the 37 participants who had some type of violation while enrolled in REAM, more than half (54%) had an alcohol-related violation while approximately one-third (32%) had electronic monitoring violations (Figure 36).
♦ Fourteen percent of participants
with violations absconded while on the program.
♦ Five percent of participants were arrested for a non-alcohol related driving offense while participating in the REAM program (Figure 37). Three percent were arrested for each of the following:
o 2nd degree DUI o DUI degree unknown o Felony person offense

2002 REAM Report Research & Evaluation Unit 27
FIGURE 38
♦ It is important to track the program’s response to any violations or arrests. As shown in Figure 38, almost one-third of program violators had an apprehension and detention hold (A&D hold) or probation violation filed against them. Almost one-quarter with a violation or arrest received a verbal warning while approximately two in ten (19%) had a warrant request issued to the court.
♦ While all of the violators received some type of program response to their violation, there were, on
average, 16 days between the violation and the program response. However, in more than half (57%) of the cases the program response occurred the same day as the violation. More than one-quarter (27%) of the violations received a program response within one day of the violation.
County Response to Violations & Arrests(N = 37)
*Counties could impose more than one response for offender violations. Therefore, percents do not equal 100 and are based on the number of violations and arrests, not the number of offenders. Also, this question was asked only of those offenders who had violations.
32%
19%
3%
32%
11%8%
5% 3%
24%
11%
0%
A&DHold
WarrantRequestTo Court
ReferredTo
Treatment
ProbationViolation
Filed
IncreasedProbation
Supervision
ReturnTo
Custody
IncreasedUAs/BAs
OtherAdmin.
Response
VerbalWarning
OtherResponse
NoResponse
0%
20%
40%
60%
80%
100%

2002 REAM Report Research & Evaluation Unit 28
FIGURE 39
♦ Almost all (92%) of post-sentence REAM participants successfully completed their REAM program (Figure 39). Four percent were discharged from the program for alcohol use, and two percent were removed from the program for other rule violations.
♦ Of the two percent who were removed for other reasons, three offenders were discharged as marginally
successful because they continue to owe money for their REAM participation. Another participant was removed from REAM for drug use.
Other Findings ♦ The rate of successful completion was high for participants in all three payment-type groups: 94 percent of
those who fully paid for REAM themselves completed successfully as did 92 percent of those with a partial payment subsidy and 91 percent of those with a full subsidy.
♦ Eighty-eight percent of offenders who participated in an intensive supervision program were successfully
discharged from REAM. Ninety-four percent of those who did not participate in an intensive supervision program completed REAM successfully.
Type of Discharge(N = 273)
92%
4% 2% 2%
SuccessfulCompletion
RemovedFor
AlcoholUse
Removed ForOther ProgramRule Violation
OtherDischargeReason
0%
20%
40%
60%
80%
100%

2002 REAM Report Research & Evaluation Unit 29
FIGURE 40
♦ Figure 40 shows that more than half (57%) of post-sentence offenders spent between 11 and 30 days on REAM monitoring while slightly more than two in ten (21%) spent between 31 and 60 days enrolled in REAM. Approximately one in ten (9%) offenders spent ten days or less on REAM while a slightly higher percentage (13%) spent more than 60 days on monitoring.
♦ On average, post-sentence offenders were enrolled in REAM 42 days. The highest number of days an
offender was enrolled in REAM was 598.
Length of REAM Enrollment(N = 273)
Ten Days or Less9%
11 to 30 Days57%
31 to 60 Days21%
61 to 90 Days5%
91 to 120 Days3%
121 to 240 Days3%
More Than 240 Days2%
2002 REAM Report Research & Evaluation Unit 30
Conclusion Overall, the REAM program appears to be meeting its intended goals. Offenders who are indigent (as determine by individual counties) are being given the opportunity to participate in REAM and are receiving subsidizes to offset the cost of programming. In addition, it appears that participants are able to maintain their current level of employment while enrolled in REAM. There also appears to be no significant difference in the successful completion rate of those who fully pay their costs themselves and those who receive the subsidy. While there does seem to be a difference in the rate of violations based on payment, the small number of violators overall makes this result suspect. It will be important to look at this issue in the future when the database contains a larger number of violators in each of the payment groups. Overall, the rate of program violations and arrests while on REAM also seems to be minimal; 15 percent of pre-sentence participants had violations or arrests while enrolled and 10 percent of post-sentence participants violated or were arrested during their REAM monitoring. While these violations tend to be alcohol or monitoring-related, very few arrests for new DUIs occurred while on REAM. When the violations did occur, the program response was swift and certain; for pre-sentence participants only two percent of the violations had no response while all of the post-sentence violations received some type of county response. In addition, the responses to violations or arrests came quickly; almost half of the pre-sentence violations/arrests received a response the same day the violation occurred while this is true for more than half of the post-sentence violations/arrests. The REAM program seems successful in keeping offenders out of jail and employed, the rate of violations and arrests while on monitoring are minimal, participants are receiving swift and certain program responses to violations and arrests, and participants are successfully completing the program. In 2004, the DOC will be able to determine recidivism rates for those offenders who have participated in the program.