Embed Size (px)
Citation preview
1 Remote control
Remote control The Community Development Program, remote Australia’s Work for the Dole scheme
The CDP is expected to perform a herculean task. Remote Australia has few jobs and a disadvantaged workforce. However, the CDP is failing. It pays less
than the minimum wage and imposes harsh penalties. It costs taxpayers more than similar
programs. Government claims of success are based on creative interpretation of statistics, not on
outcomes.
Rod Campbell Bill Browne Matt Grudnoff May 2018 Report commissioned by the Australian Council of Trade Unions.
2 Remote control
ABOUT THE AUSTRALIA INSTITUTE
The Australia Institute is an independent public policy think tank based in Canberra. It
is funded by donations from philanthropic trusts and individuals and commissioned
research. Since its launch in 1994, the Institute has carried out highly influential
research on a broad range of economic, social and environmental issues.
OUR PHILOSOPHY
As we begin the 21st century, new dilemmas confront our society and our planet.
Unprecedented levels of consumption co-exist with extreme poverty. Through new
technology we are more connected than we have ever been, yet civic engagement is
declining. Environmental neglect continues despite heightened ecological awareness.
A better balance is urgently needed.
The Australia Institute’s directors, staff and supporters represent a broad range of
views and priorities. What unites us is a belief that through a combination of research
and creativity we can promote new solutions and ways of thinking.
OUR PURPOSE – ‘RESEARCH THAT MATTERS’
The Institute aims to foster informed debate about our culture, our economy and our
environment and bring greater accountability to the democratic process. Our goal is to
gather, interpret and communicate evidence in order to both diagnose the problems
we face and propose new solutions to tackle them.
The Institute is wholly independent and not affiliated with any other organisation. As
an Approved Research Institute, donations to its Research Fund are tax deductible for
the donor. Anyone wishing to donate can do so via the website at
https://www.tai.org.au or by calling the Institute on 02 6130 0530. Our secure and
user-friendly website allows donors to make either one-off or regular monthly
donations and we encourage everyone who can to donate in this way as it assists our
research in the most significant manner.
Endeavour House, 1 Franklin St
Canberra, ACT 2603
Tel: (02) 61300530
Email: [email protected]
Website: www.tai.org.au
3 Remote control
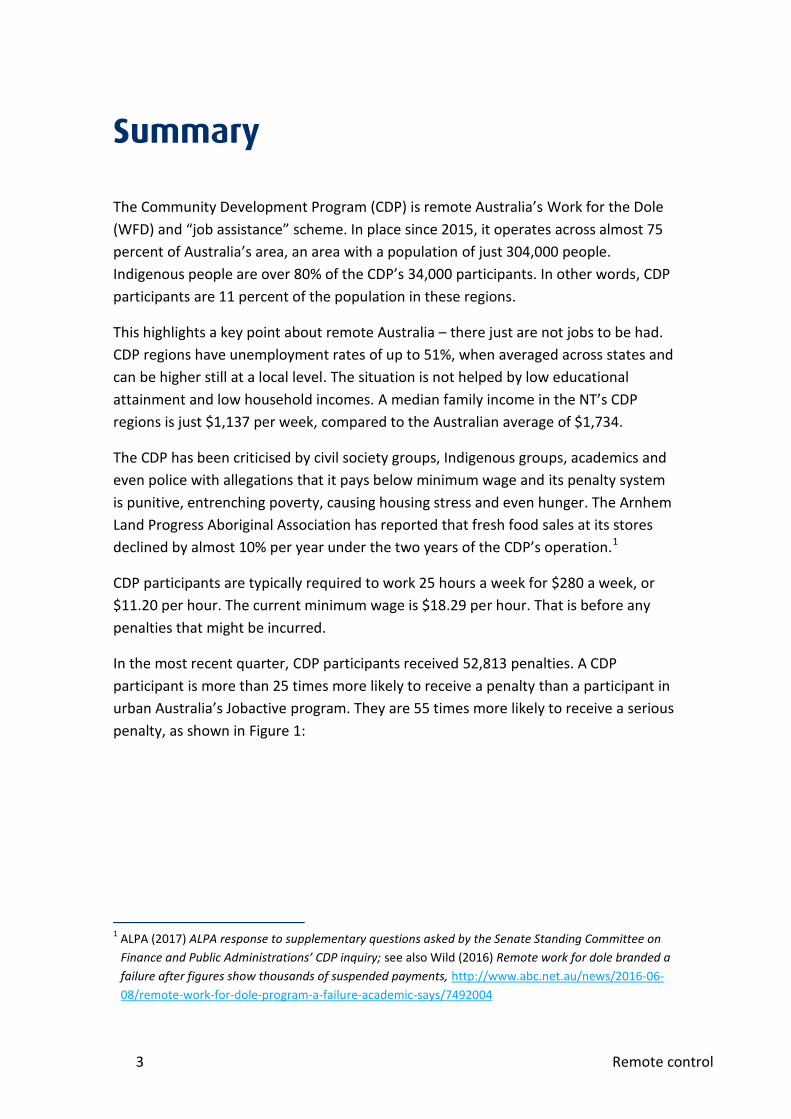
Summary
The Community Development Program (CDP) is remote Australia’s Work for the Dole
(WFD) and “job assistance” scheme. In place since 2015, it operates across almost 75
percent of Australia’s area, an area with a population of just 304,000 people.
Indigenous people are over 80% of the CDP’s 34,000 participants. In other words, CDP
participants are 11 percent of the population in these regions.
This highlights a key point about remote Australia – there just are not jobs to be had.
CDP regions have unemployment rates of up to 51%, when averaged across states and
can be higher still at a local level. The situation is not helped by low educational
attainment and low household incomes. A median family income in the NT’s CDP
regions is just $1,137 per week, compared to the Australian average of $1,734.
The CDP has been criticised by civil society groups, Indigenous groups, academics and
even police with allegations that it pays below minimum wage and its penalty system
is punitive, entrenching poverty, causing housing stress and even hunger. The Arnhem
Land Progress Aboriginal Association has reported that fresh food sales at its stores
declined by almost 10% per year under the two years of the CDP’s operation.1
CDP participants are typically required to work 25 hours a week for $280 a week, or
$11.20 per hour. The current minimum wage is $18.29 per hour. That is before any
penalties that might be incurred.
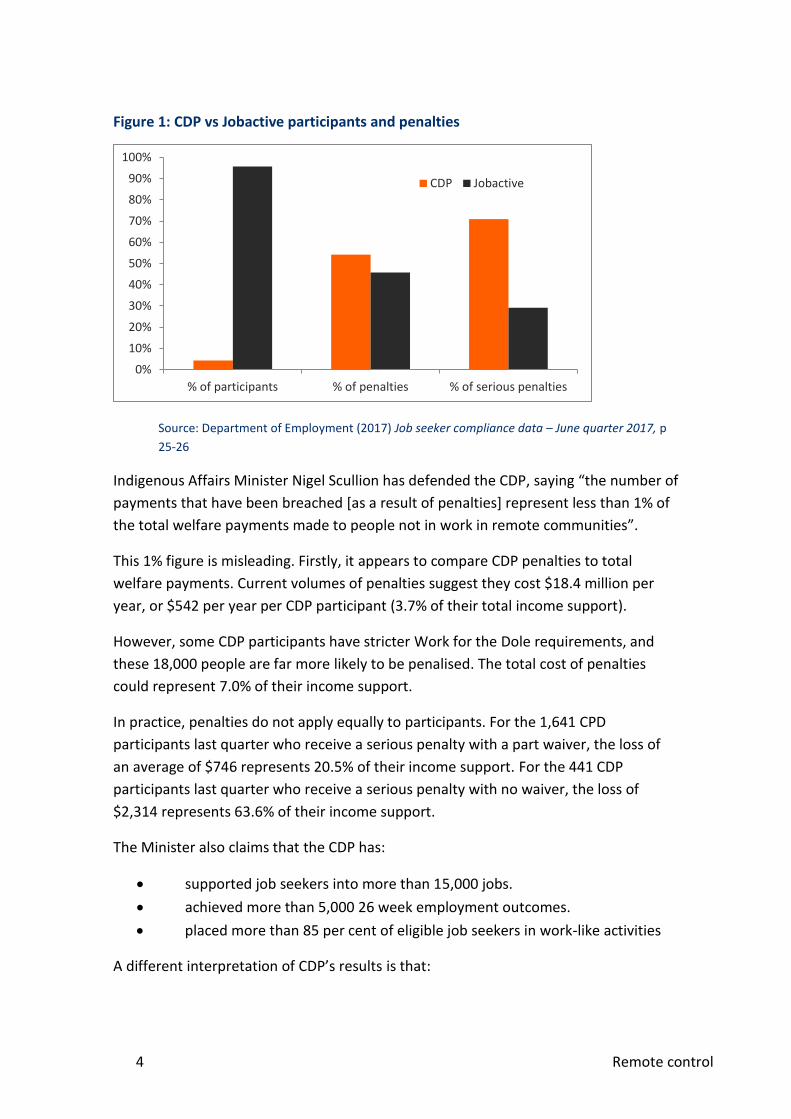
In the most recent quarter, CDP participants received 52,813 penalties. A CDP
participant is more than 25 times more likely to receive a penalty than a participant in
urban Australia’s Jobactive program. They are 55 times more likely to receive a serious
penalty, as shown in Figure 1:
1 ALPA (2017) ALPA response to supplementary questions asked by the Senate Standing Committee on
Finance and Public Administrations’ CDP inquiry; see also Wild (2016) Remote work for dole branded a
failure after figures show thousands of suspended payments, http://www.abc.net.au/news/2016-06-
08/remote-work-for-dole-program-a-failure-academic-says/7492004
4 Remote control
Figure 1: CDP vs Jobactive participants and penalties
Source: Department of Employment (2017) Job seeker compliance data – June quarter 2017, p
25-26
Indigenous Affairs Minister Nigel Scullion has defended the CDP, saying “the number of
payments that have been breached [as a result of penalties] represent less than 1% of
the total welfare payments made to people not in work in remote communities”.
This 1% figure is misleading. Firstly, it appears to compare CDP penalties to total
welfare payments. Current volumes of penalties suggest they cost $18.4 million per
year, or $542 per year per CDP participant (3.7% of their total income support).
However, some CDP participants have stricter Work for the Dole requirements, and
these 18,000 people are far more likely to be penalised. The total cost of penalties
could represent 7.0% of their income support.
In practice, penalties do not apply equally to participants. For the 1,641 CPD
participants last quarter who receive a serious penalty with a part waiver, the loss of
an average of $746 represents 20.5% of their income support. For the 441 CDP
participants last quarter who receive a serious penalty with no waiver, the loss of
$2,314 represents 63.6% of their income support.
The Minister also claims that the CDP has:
supported job seekers into more than 15,000 jobs.
achieved more than 5,000 26 week employment outcomes.
placed more than 85 per cent of eligible job seekers in work-like activities
A different interpretation of CDP’s results is that:
0%
10%
20%
30%
40%
50%
60%
70%
80%
90%
100%
% of participants % of penalties % of serious penalties
CDP Jobactive
5 Remote control
Each year, less than one in five CDP participants is supported into a job, and
less than one in 10 remains in that job for six months.
On average, a CDP participant would spend 9.5 years in the scheme before
achieving a 13-week employment outcome.
On average, a participant would spend 12.7 years in the scheme before
achieving a 26-week employment outcome.
The CDP is also expensive. For every dollar that a CDP recipient receives in income
support, approximately 70 cents is spent administering the scheme. It costs five times
as much per participant as Jobactive and twice as much as the scheme it replaced.
The achievement of 2,682 part- and full-time 26-week employment outcomes each
year must be put in the context of the overall CDP scheme, which costs about $360
million per year to operate. That amount could directly employ 19,700 people for 26
weeks full-time.
The task the CDP is expected to perform is herculean. Remote Australia has few jobs
and a disadvantaged workforce. However, the CDP is failing. It pays less than minimum
wage and imposes harsh penalties that can cost already low income households
dearly. It costs taxpayers far more than similar programs. The government’s claims
about the success of the program are based on creative interpretation of statistics, not
on outcomes. The CDP needs urgent reform or replacement.
6 Remote control
Introduction
The Community Development Program (CDP) is the main program of job-related
assistance for unemployed people in remote areas of Australia. It is effectively Work
for the Dole (WFD) for vast areas of the country, and being focused on remote areas
Indigenous Australians are the vast majority – around 84% – of its 33,000–38,000
participants (participant numbers fluctuate).
The CDP began in 2015 as the Coalition Government’s replacement for the Remote
Jobs and Communities Program, which itself replaced the Community Development
and Employment Program (CDEP). The CDP has been criticised by various civil society
groups, Indigenous groups, academics and even police with allegations that the
program has implemented punitive penalties to participants resulting in entrenched
poverty, housing stress and even hunger.2
Tony Abbott has since said:
Abolishing CDEP was a well-intentioned mistake and CDP is our attempt to
atone for it.3
By contrast, Indigenous Affairs Minister Nigel Scullion has defended the CDP, claiming
it “has been a success” although conceding “more needs to be done”. The government
points to various statistics to demonstrate this success, for example:
The CDP has supported job seekers into more than 15,000 jobs.
Participants have achieved more than 5,000 26-week employment
outcomes.
85 per cent of eligible job seekers have been placed in work-like activities.4
2 See for example Tomlin (2017) Community Development Program driving up crime in remote WA
communities, Senate committee told, http://www.abc.net.au/news/2017-08-23/community-
development-program-driving-up-crime-senate-told/8835990; ALPA (2017) ALPA response to
supplementary questions asked by the Senate Standing Committee on Finance and Public
Administrations’ CDP inquiry; see also Wild (2016) Remote work for dole branded a failure after figures
show thousands of suspended payments, http://www.abc.net.au/news/2016-06-08/remote-work-for-
dole-program-a-failure-academic-says/7492004 3 Aikman (2016) Widen welfare rules to all jobless, says Tony Abbott,
http://www.theaustralian.com.au/national-affairs/indigenous/widen-welfare-rules-to-all-jobless-says-
tony-abbott/news-story/8720125387b8731d8dd6cd731cc18395 4 Scullion (2017) Minister Scullion: CDP hits major milestone for remote jobseekers,
http://www.indigenous.gov.au/news-and-media/announcements/minister-scullion-cdp-hits-major-
7 Remote control
Without context, however, such statistics reveal little about the CDP overall or in
comparison to the programs it has replaced.
milestone-remote-jobseekers; Davidson (2016) Nigel Scullion defends ‘harmful’ Indigenous work-for-
the-dole program, https://www.theguardian.com/australia-news/2016/oct/05/nigel-scullion-defends-
harmful-indigenous-work-for-the-dole-program
8 Remote control
Putting the CDP in context
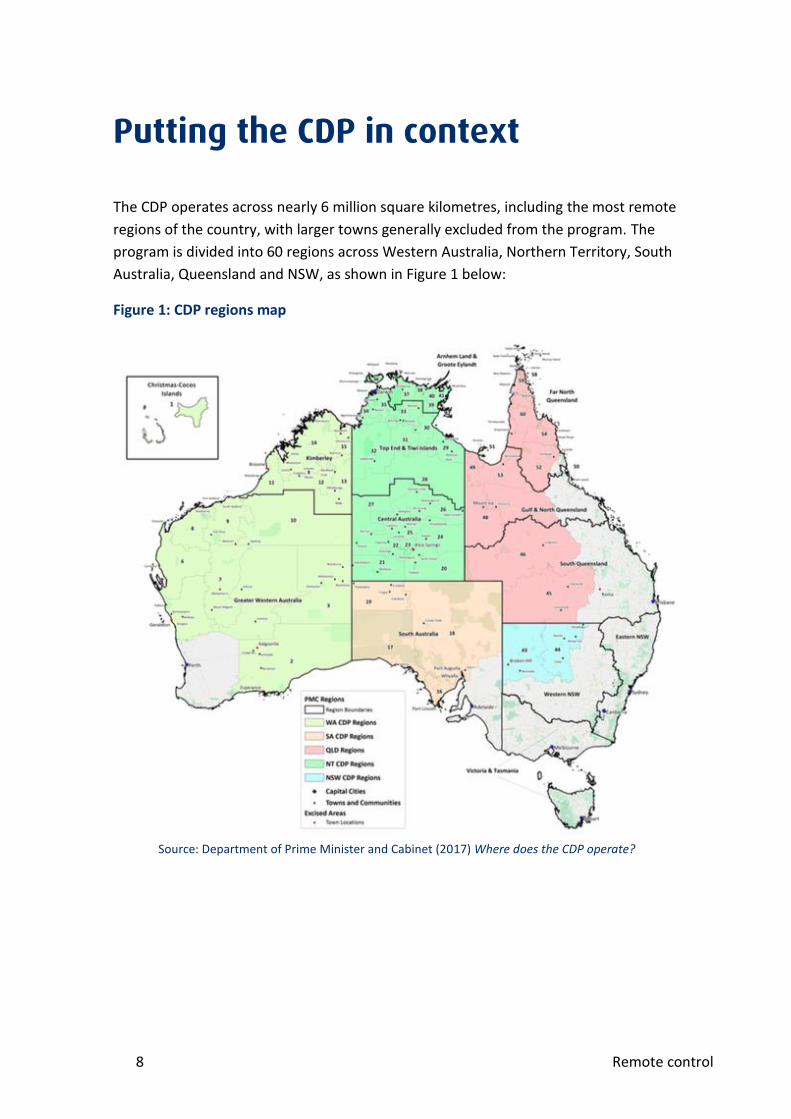
The CDP operates across nearly 6 million square kilometres, including the most remote
regions of the country, with larger towns generally excluded from the program. The
program is divided into 60 regions across Western Australia, Northern Territory, South
Australia, Queensland and NSW, as shown in Figure 1 below:
Figure 1: CDP regions map
Source: Department of Prime Minister and Cabinet (2017) Where does the CDP operate?
9 Remote control
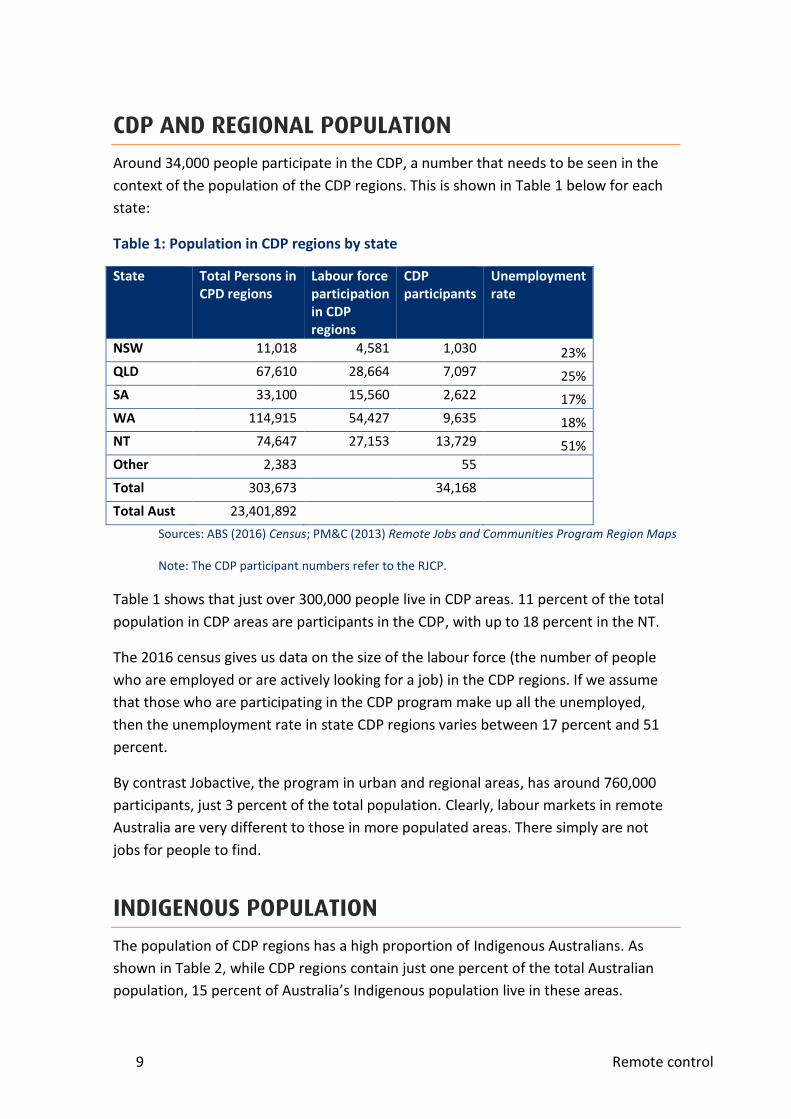
CDP AND REGIONAL POPULATION
Around 34,000 people participate in the CDP, a number that needs to be seen in the
context of the population of the CDP regions. This is shown in Table 1 below for each
state:
Table 1: Population in CDP regions by state
State Total Persons in CPD regions
Labour force participation in CDP regions
CDP participants
Unemployment rate
NSW 11,018 4,581 1,030 23%
QLD 67,610 28,664 7,097 25%
SA 33,100 15,560 2,622 17%
WA 114,915 54,427 9,635 18%
NT 74,647 27,153 13,729 51%
Other 2,383 55
Total 303,673 34,168
Total Aust 23,401,892
Sources: ABS (2016) Census; PM&C (2013) Remote Jobs and Communities Program Region Maps
Note: The CDP participant numbers refer to the RJCP.
Table 1 shows that just over 300,000 people live in CDP areas. 11 percent of the total
population in CDP areas are participants in the CDP, with up to 18 percent in the NT.
The 2016 census gives us data on the size of the labour force (the number of people
who are employed or are actively looking for a job) in the CDP regions. If we assume
that those who are participating in the CDP program make up all the unemployed,
then the unemployment rate in state CDP regions varies between 17 percent and 51
percent.
By contrast Jobactive, the program in urban and regional areas, has around 760,000
participants, just 3 percent of the total population. Clearly, labour markets in remote
Australia are very different to those in more populated areas. There simply are not
jobs for people to find.
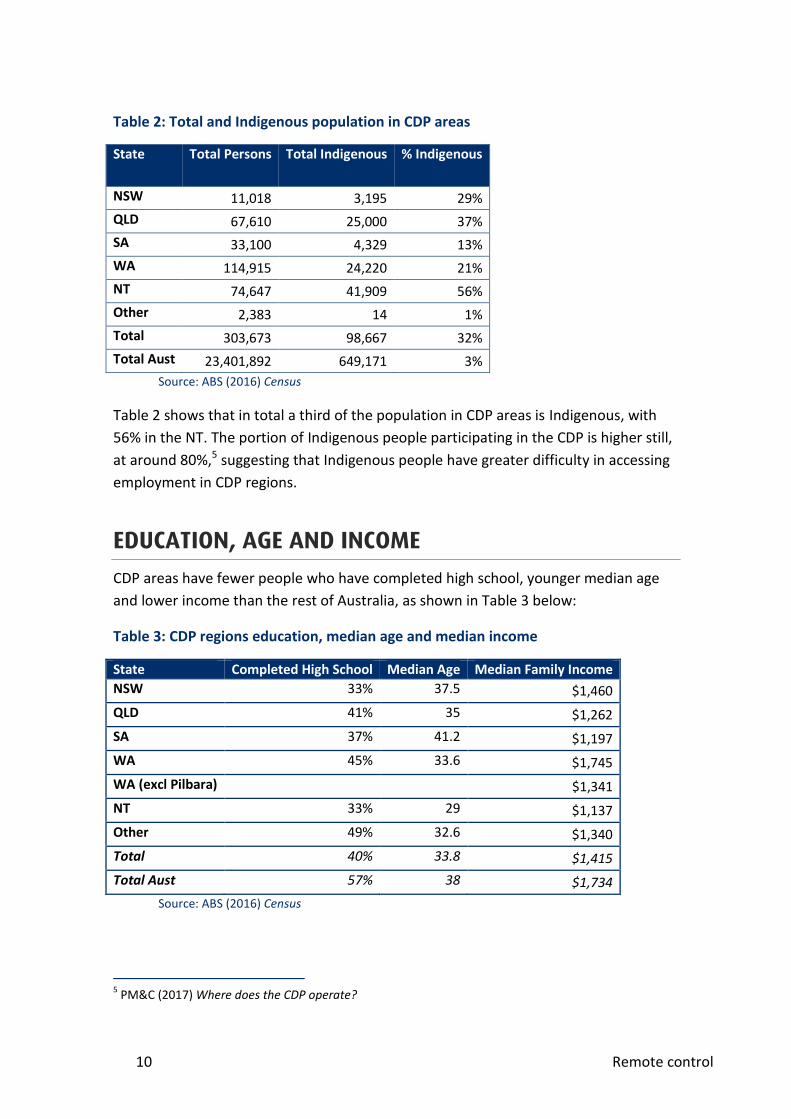
INDIGENOUS POPULATION
The population of CDP regions has a high proportion of Indigenous Australians. As
shown in Table 2, while CDP regions contain just one percent of the total Australian
population, 15 percent of Australia’s Indigenous population live in these areas.
10 Remote control
Table 2: Total and Indigenous population in CDP areas
State Total Persons Total Indigenous % Indigenous
NSW 11,018 3,195 29%
QLD 67,610 25,000 37%
SA 33,100 4,329 13%
WA 114,915 24,220 21%
NT 74,647 41,909 56%
Other 2,383 14 1%
Total 303,673 98,667 32%
Total Aust 23,401,892 649,171 3%
Source: ABS (2016) Census
Table 2 shows that in total a third of the population in CDP areas is Indigenous, with
56% in the NT. The portion of Indigenous people participating in the CDP is higher still,
at around 80%,5 suggesting that Indigenous people have greater difficulty in accessing
employment in CDP regions.
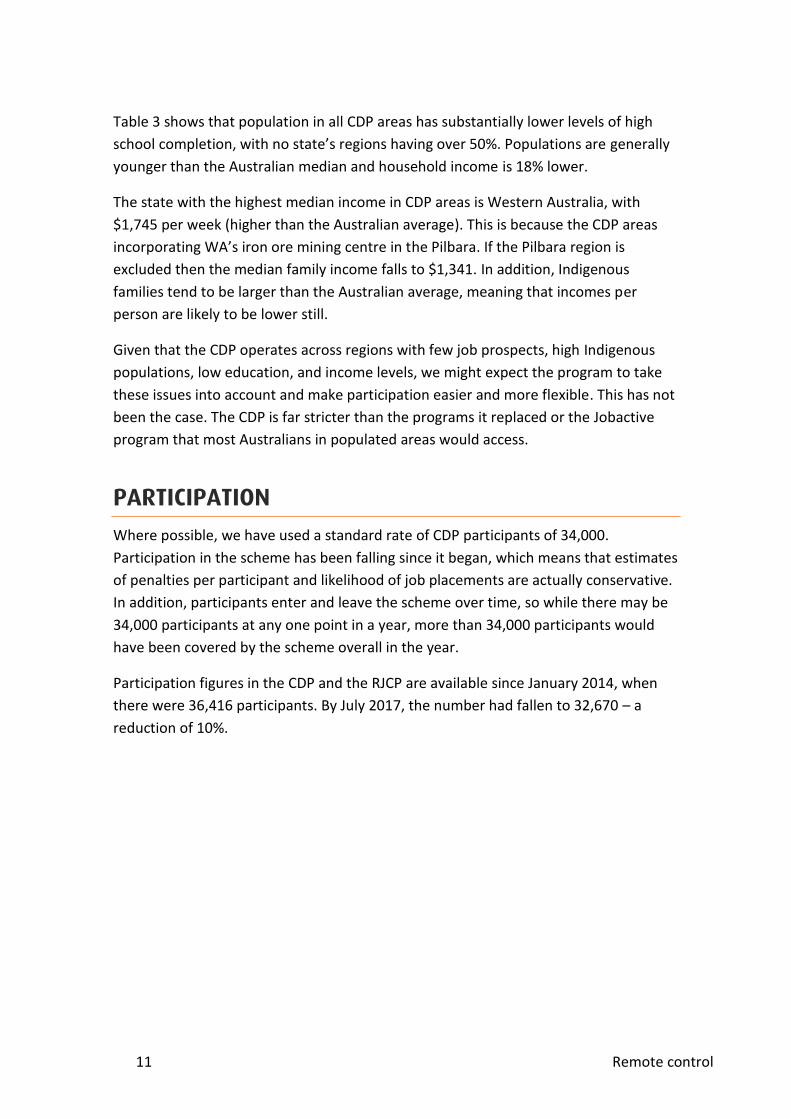
EDUCATION, AGE AND INCOME
CDP areas have fewer people who have completed high school, younger median age
and lower income than the rest of Australia, as shown in Table 3 below:
Table 3: CDP regions education, median age and median income
State Completed High School Median Age Median Family Income
NSW 33% 37.5 $1,460
QLD 41% 35 $1,262
SA 37% 41.2 $1,197
WA 45% 33.6 $1,745
WA (excl Pilbara) $1,341
NT 33% 29 $1,137
Other 49% 32.6 $1,340
Total 40% 33.8 $1,415
Total Aust 57% 38 $1,734
Source: ABS (2016) Census
5 PM&C (2017) Where does the CDP operate?
11 Remote control
Table 3 shows that population in all CDP areas has substantially lower levels of high
school completion, with no state’s regions having over 50%. Populations are generally
younger than the Australian median and household income is 18% lower.
The state with the highest median income in CDP areas is Western Australia, with
$1,745 per week (higher than the Australian average). This is because the CDP areas
incorporating WA’s iron ore mining centre in the Pilbara. If the Pilbara region is
excluded then the median family income falls to $1,341. In addition, Indigenous
families tend to be larger than the Australian average, meaning that incomes per
person are likely to be lower still.
Given that the CDP operates across regions with few job prospects, high Indigenous
populations, low education, and income levels, we might expect the program to take
these issues into account and make participation easier and more flexible. This has not
been the case. The CDP is far stricter than the programs it replaced or the Jobactive
program that most Australians in populated areas would access.
PARTICIPATION
Where possible, we have used a standard rate of CDP participants of 34,000.
Participation in the scheme has been falling since it began, which means that estimates
of penalties per participant and likelihood of job placements are actually conservative.
In addition, participants enter and leave the scheme over time, so while there may be
34,000 participants at any one point in a year, more than 34,000 participants would
have been covered by the scheme overall in the year.
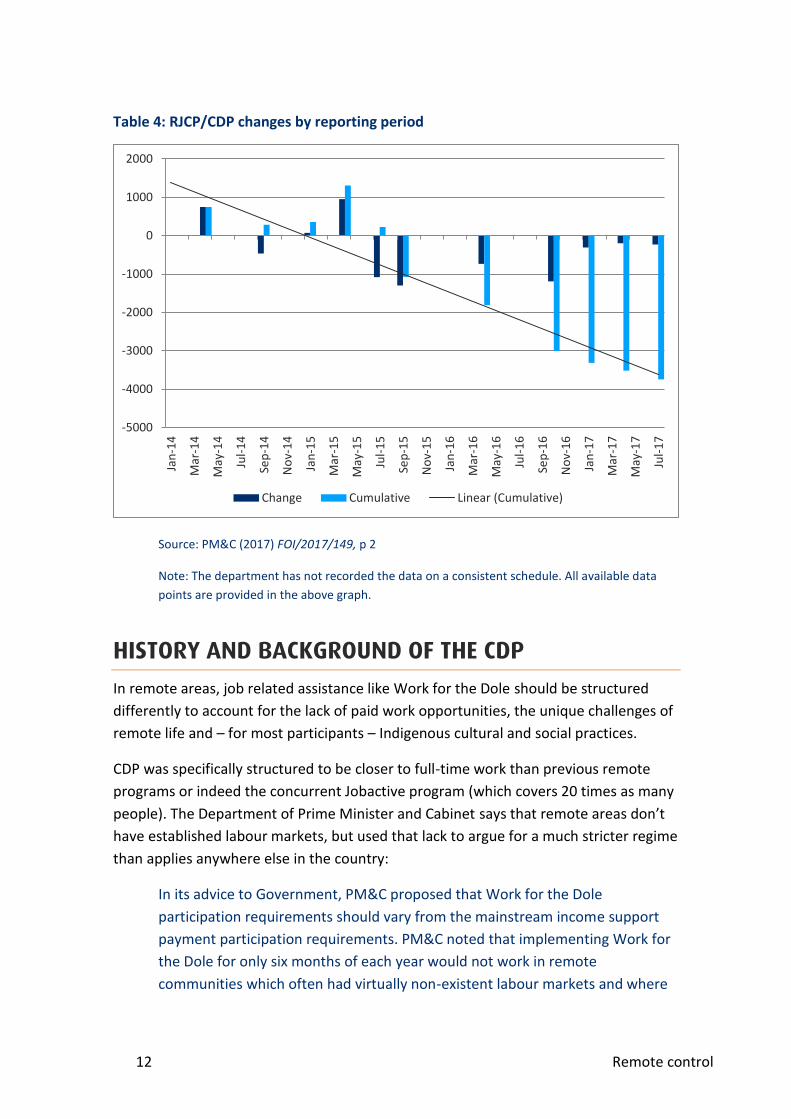
Participation figures in the CDP and the RJCP are available since January 2014, when
there were 36,416 participants. By July 2017, the number had fallen to 32,670 – a
reduction of 10%.
12 Remote control
Table 4: RJCP/CDP changes by reporting period
Source: PM&C (2017) FOI/2017/149, p 2
Note: The department has not recorded the data on a consistent schedule. All available data
points are provided in the above graph.
HISTORY AND BACKGROUND OF THE CDP
In remote areas, job related assistance like Work for the Dole should be structured
differently to account for the lack of paid work opportunities, the unique challenges of
remote life and – for most participants – Indigenous cultural and social practices.
CDP was specifically structured to be closer to full-time work than previous remote
programs or indeed the concurrent Jobactive program (which covers 20 times as many
people). The Department of Prime Minister and Cabinet says that remote areas don’t
have established labour markets, but used that lack to argue for a much stricter regime
than applies anywhere else in the country:
In its advice to Government, PM&C proposed that Work for the Dole
participation requirements should vary from the mainstream income support
payment participation requirements. PM&C noted that implementing Work for
the Dole for only six months of each year would not work in remote
communities which often had virtually non-existent labour markets and where
-5000
-4000
-3000
-2000
-1000
0
1000
2000Ja
n-1
4
Mar
-14
May
-14
Jul-
14
Sep
-14
No
v-1
4
Jan
-15
Mar
-15
May
-15
Jul-
15
Sep
-15
No
v-1
5
Jan
-16
Mar
-16
May
-16
Jul-
16
Sep
-16
No
v-1
6
Jan
-17
Mar
-17
May
-17
Jul-
17
Change Cumulative Linear (Cumulative)
13 Remote control
there was a need to establish social norms. Consequently, PM&C advised that
‘only a comprehensive full time Work for the Dole program applied to all
jobseekers will work in remote regions’. ‘Continuous’ Work for the Dole
activities was also considered a key factor in reducing the high level of idleness
in communities’.6
Previous remote programs also accounted for the nature of work in remote areas, but
by providing more flexibility and variety rather than trying to emulate full-time work in
places without conventional labour markets. In some cases, the schemes were much
more ambitious in scope.
When Dr HC (Nugget) Coombs championed the establishment of the CDEP in 1977, he
outlined a broad scope for the program:
[It is] not simply a means of providing employment as a source of a minimum
cash income, but a training exercise in self-management and increasing
independence for the Aboriginal communities involved.7
For the thirty years of its operation, CDEP fulfilled that role, with academic Jon Altman
outlining five main roles for CDEP.
1. it provides flexible employment opportunities, often in contexts where there
are no, or limited, mainstream employment opportunities, particularly for
Indigenous people.
2. it provides income security and the opportunity to earn additional income from
employment and enterprise [in particular, the scheme did not have the
standard social security taper so participants could earn more without the loss
of base income].
3. it provides opportunity for education and training.
4. it can assist participants to move into mainstream (unsubsidised) employment.
5. and most innovatively, it acts as an instrument for economic and community
development.8
6 ANAO (2017) Design and implementation of the Community Development Programme, p 27
7 Jordan and Fowkes (compilers) (2016) Job creation and income support in remote Indigenous Australia:
Moving forward with a better system, p 12 8 Bullets added by the authors. Altman and Gray (2005) The CDEP scheme: A flexible and innovative
employment and community development program for Indigenous Australians, p 5
14 Remote control
Scheme structures
Under both CDP and Jobactive, “jobseekers” (those with participation requirements
attached to their income support) are required to Work for the Dole. However, the
CDP scheme has considerably higher work requirements which, combined with
bureaucratic penalty enforcement, results in many more penalties being applied to
CDP participants than Jobactive participants. These penalties are financial, amounting
to about 20% of a weekly dole payment ($56 for someone on $280 a week, for
example) per ‘no show’ breach.9
WORK REQUIREMENTS
About 33,000-35,000 people are covered by CDP.10 Of these, about 18,000 are Work
for the Dole participants and 16,000 are Basic Services-only participants.11 Basic
Services are the job assistance provided to all participants. Basic Services-only
participants are those not required to Work for the Dole.12
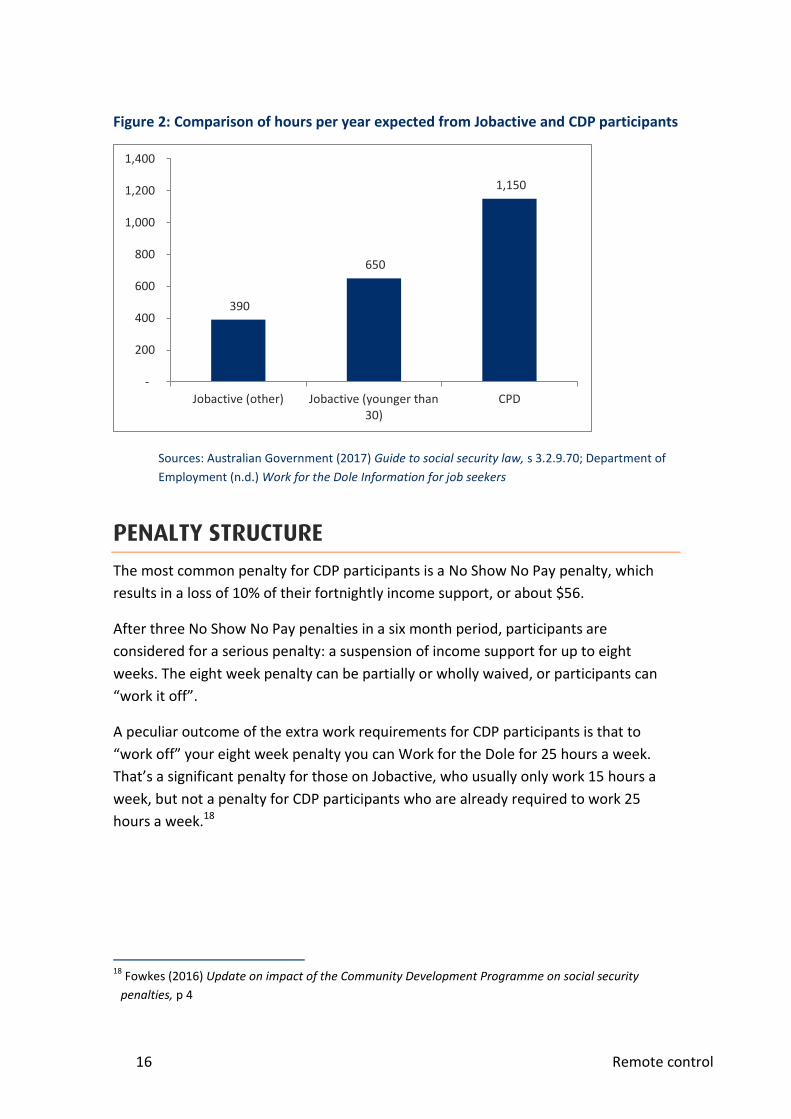
CDP Work for the Dole participants are typically required to work 25 hours a week for
46 weeks a year (1,150 hours a year), and that work must take place on all five week
days (Monday to Friday).13 Jobactive Work for the Dole participants are typically
required to work 15 hours a week for 26 weeks a year (390 hours a year), and work
does not have to take place on all five week days. Jobactive participants under 30 years
of age are required to work 25 hours a week, although again only for 26 weeks rather
9 $280 is used as a benchmark in this report as it is the weekly Newstart payment for a single person
with no children plus the WFD supplement of $10.40. Partnered people receive less, and people with
children receive more. There are other forms of income support as well. Department of Human
Services (n.d.) Newstart allowance: How much can you get,
https://www.humanservices.gov.au/individuals/services/centrelink/newstart-allowance/how-much-
you-can-get; Australian Govenrment (2017) Guide to social security law, s 3.2.9.60,
http://guides.dss.gov.au/guide-social-security-law/3/2/9/60 10
ANAO (2017) Design and implementation of the Community Development Programme, p 16 11
ANAO (2017) Design and implementation of the Community Development Programme, p 16-17 12
Fowkes (2017) Background note on CDP, https://www.clc.org.au/ 13
Australian Government (2017) Guide to social security law, s 3.2.9.70, http://guides.dss.gov.au/guide-
social-security-law/3/2/9/70
15 Remote control
than 46 (650 hours a year).14 Note that from September 2018 Jobactive participants
under 50 will be required to work 25 hours a week.15
Jobactive participants receive weekly income support for Work for the Dole roughly
equivalent to what they would make if they were earning minimum wage for those
hours. For example, a participant receiving $280 a week and working 15 hours is
effectively “earning” $18.67 per hour for those weeks where they are required to work
(the current minimum wage is $18.29 per hour).16 Those expected to work for 25
hours, like CDP participants, instead effectively “earn” $11.20 an hour, and that is
before financial penalties are considered.
This contrasts most strikingly with the CDEP, where participants “earned” their income
support through 15 hours of work, and then additional “top up” pay at award rates
was often available if participants worked more hours. On average, CDEP participants
earned $100 more per week than those on income support outside of the scheme.17
When Jobactive participants receive a serious penalty resulting in a freezing of income
support, they can “work off” their penalty by temporarily working 25 hours a week. In
other words, the standard workload for CDP participants is considered a punishment
for most Jobactive participants.
14
Department of Employment (n.d.) Work for the Dole Information for job seekers,
https://www.employment.gov.au/work-dole-information-job-seekers 15
Department of Social Services (2017) Welfare reform: 2017 budget, p 2,
https://www.dss.gov.au/sites/default/files/documents/05_2017/budget_2017_-_welfare_reform_-
_fact_sheet_for_web_0.pdf 16
Fair Work Ombudsman (n.d.) Minimum wages, https://www.fairwork.gov.au/how-we-will-
help/templates-and-guides/fact-sheets/minimum-workplace-entitlements/minimum-wages 17
Altman and Gray (2005) The CDEP scheme: A flexible and innovative employment and community
development program for Indigenous Australians, p 4-5, 6, 13; Jordan and Fowkes (compilers) (2016)
Job creation and income support in remote Indigenous Australia: Moving forward with a better system,
p 1; Altman, Gray and Levitus (2005) Policy issues for the Community Development Employment
Projects scheme in rural and remote Australia, p 10-11,
http://caepr.cass.anu.edu.au/sites/default/files/docs/2005_DP271_0.pdf
16 Remote control
Figure 2: Comparison of hours per year expected from Jobactive and CDP participants
Sources: Australian Government (2017) Guide to social security law, s 3.2.9.70; Department of
Employment (n.d.) Work for the Dole Information for job seekers
PENALTY STRUCTURE
The most common penalty for CDP participants is a No Show No Pay penalty, which
results in a loss of 10% of their fortnightly income support, or about $56.
After three No Show No Pay penalties in a six month period, participants are
considered for a serious penalty: a suspension of income support for up to eight
weeks. The eight week penalty can be partially or wholly waived, or participants can
“work it off”.
A peculiar outcome of the extra work requirements for CDP participants is that to
“work off” your eight week penalty you can Work for the Dole for 25 hours a week.
That’s a significant penalty for those on Jobactive, who usually only work 15 hours a
week, but not a penalty for CDP participants who are already required to work 25
hours a week.18
18
Fowkes (2016) Update on impact of the Community Development Programme on social security
penalties, p 4
390
650
1,150
-
200
400
600
800
1,000
1,200
1,400
Jobactive (other) Jobactive (younger than30)
CPD
17 Remote control
CDP providers have a financial incentive to log non-attendance by participants (which
leads automatically to a financial penalty applied by Centrelink).19 Providers are
randomly checked to ensure they are applying the rules.
Under CDEP, providers had flexibility in terms of what qualified as “work” and how to
manage staff absences.20 In CDP, there is little room for discretion, with one provider
saying:
If we penalise someone under this model it impacts their housing, their ability
to pay their power – so there is really no safety net.21
The strictness of the penalty structure, and its administration by Centrelink far from
the coalface, leads to inflexibility despite the realities of life in remote Australia. These
include high demand for the few community phones available and language barriers
when calls do get through to Centrelink.22 The National Audit Office found lengthy wait
times for Centrelink calls, and that these times had worsened over the last few years,
although remote areas did have shorter wait times on average.23
COMPARING PENALTIES
Compared to Jobactive, CDP has far fewer participants, but far higher portions of
penalties, particularly serious penalties. More penalties are handed out to CDP
participants than to Jobactive participants, even though there are 20 times more
Jobactive participants than CDP participants.
In the quarter ending June 2017, CDP participants received 52,813 penalties, including
44,451 No Show No Pay penalties. In the same period, Jobactive participants received
44,593 penalties.24 This means that a CDP participant was more than 25 times more
likely to receive a penalty than a Jobactive participant.
19
Jordan and Fowkes (compilers) (2016) Job creation and income support in remote Indigenous
Australia: Moving forward with a better system, p 16 20
Jordan and Fowkes (compilers) (2016) Job creation and income support in remote Indigenous
Australia: Moving forward with a better system, p 1 21
Jordan and Fowkes (compilers) (2016) Job creation and income support in remote Indigenous
Australia: Moving forward with a better system, p 15 22
Jordan and Fowkes (compilers) (2016) Job creation and income support in remote Indigenous
Australia: Moving forward with a better system, p 3 23
ANAO (2017) Design and implementation of the Community Development Programme, p 47 24
Department of Employment (2017) Job seeker compliance data – June quarter 2017, p 25-26,
https://docs.employment.gov.au/documents/job-seeker-compliance-public-data-june-quarter-2017
18 Remote control
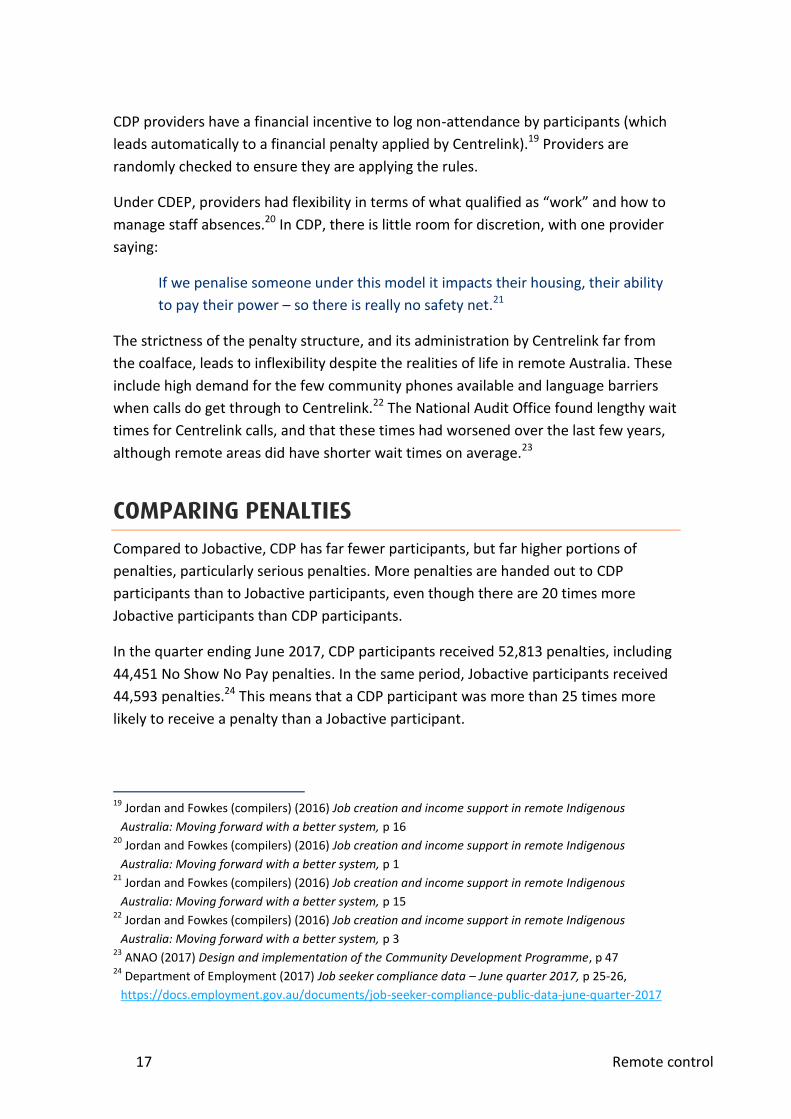
In the quarter ending June 2017, CDP participants received 7,868 serious penalties,
which result in up to eight weeks without income support. Fewer serious penalties
were applied to Jobactive participants, 3,215, meaning that CDP participants were 55
times more likely to receive a serious penalty than a Jobactive participant.25
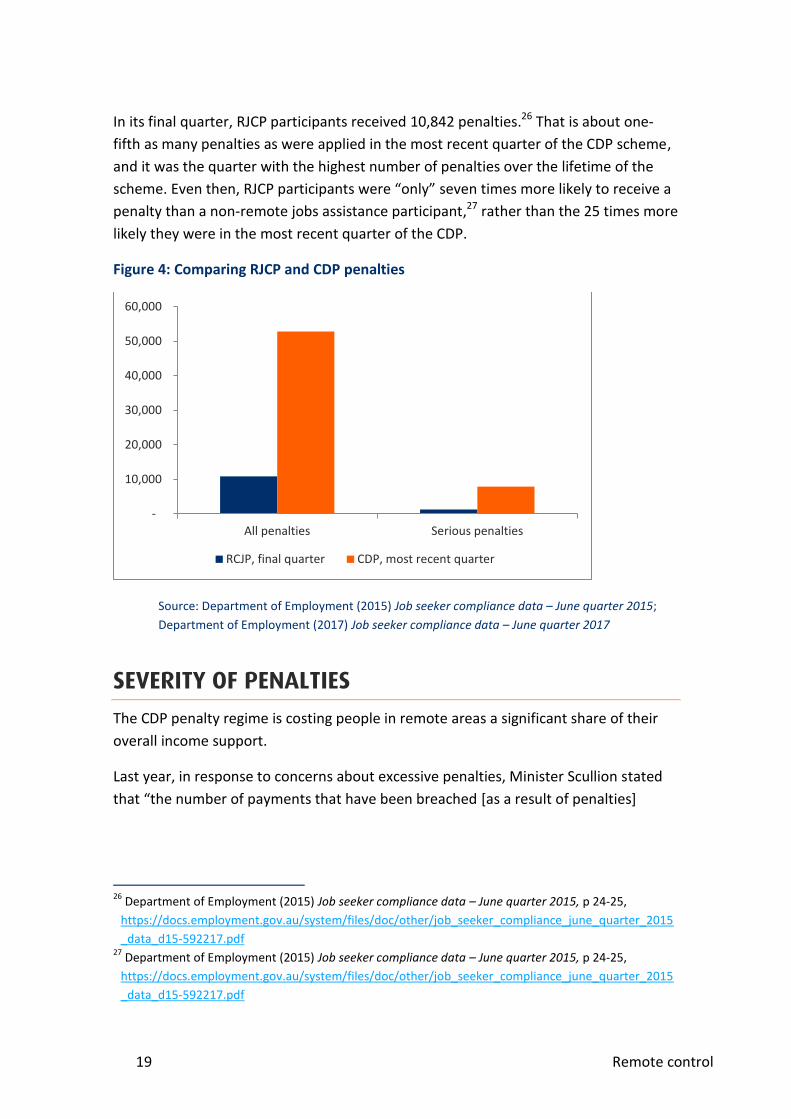
Figure 3 illustrates the two ways in which CDP participants are disproportionately
penalised. Per person, they receive many more penalties than Jobactive participants
do. The share of serious penalties is even more skewed against CDP participants.
Figure 3: CDP and Jobactive participants and penalties
Source: Department of Employment (2017) Job seeker compliance data – June quarter 2017, p
25-26
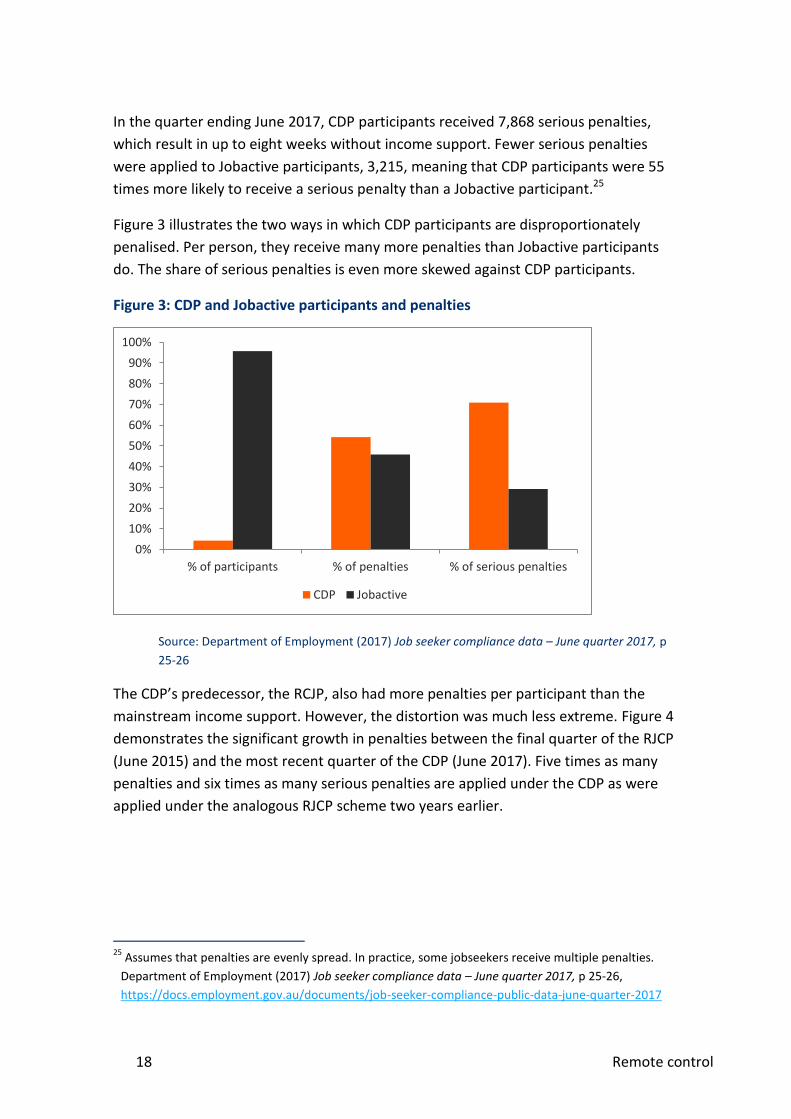
The CDP’s predecessor, the RCJP, also had more penalties per participant than the
mainstream income support. However, the distortion was much less extreme. Figure 4
demonstrates the significant growth in penalties between the final quarter of the RJCP
(June 2015) and the most recent quarter of the CDP (June 2017). Five times as many
penalties and six times as many serious penalties are applied under the CDP as were
applied under the analogous RJCP scheme two years earlier.
25
Assumes that penalties are evenly spread. In practice, some jobseekers receive multiple penalties.
Department of Employment (2017) Job seeker compliance data – June quarter 2017, p 25-26,
https://docs.employment.gov.au/documents/job-seeker-compliance-public-data-june-quarter-2017
0%
10%
20%
30%
40%
50%
60%
70%
80%
90%
100%
% of participants % of penalties % of serious penalties
CDP Jobactive
19 Remote control
In its final quarter, RJCP participants received 10,842 penalties.26 That is about one-
fifth as many penalties as were applied in the most recent quarter of the CDP scheme,
and it was the quarter with the highest number of penalties over the lifetime of the
scheme. Even then, RJCP participants were “only” seven times more likely to receive a
penalty than a non-remote jobs assistance participant,27 rather than the 25 times more
likely they were in the most recent quarter of the CDP.
Figure 4: Comparing RJCP and CDP penalties
Source: Department of Employment (2015) Job seeker compliance data – June quarter 2015;
Department of Employment (2017) Job seeker compliance data – June quarter 2017
SEVERITY OF PENALTIES
The CDP penalty regime is costing people in remote areas a significant share of their
overall income support.
Last year, in response to concerns about excessive penalties, Minister Scullion stated
that “the number of payments that have been breached [as a result of penalties]
26
Department of Employment (2015) Job seeker compliance data – June quarter 2015, p 24-25,
https://docs.employment.gov.au/system/files/doc/other/job_seeker_compliance_june_quarter_2015
_data_d15-592217.pdf 27
Department of Employment (2015) Job seeker compliance data – June quarter 2015, p 24-25,
https://docs.employment.gov.au/system/files/doc/other/job_seeker_compliance_june_quarter_2015
_data_d15-592217.pdf
-
10,000
20,000
30,000
40,000
50,000
60,000
All penalties Serious penalties
RCJP, final quarter CDP, most recent quarter
20 Remote control
represent less than 1% of the total welfare payments made to people not in work in
remote communities”.28
However, penalties now represent a much larger portion of the welfare payments of
some people in remote areas. CDP participants who receive a serious penalty are at
risk of losing up to 64% of their welfare payments in a quarter. In addition, the number
of penalties has increased dramatically. The most recent quarter saw 44% more
penalties, and 64% more serious penalties, than when Minister Scullion made his
remarks.
Since we know that a “penalty day” is worth 10% of a fortnight’s income support, or
about $56, we can calculate a rough figure for how much income support is lost
annually from penalties. Those on higher or lower levels of income support would
receive proportionally higher or lower penalties, but the portion of their overall
income that the penalty represents would stay the same.
Penalties greater for some participants
Some people are disproportionately penalised under the CDP, meaning that the effect
of penalties on their welfare payments is far greater than the overall numbers would
suggest.
CDP participants receive 1,641 partially waived and 441 not-waived eight week
penalties per quarter. That represents a loss of $2.1 million per quarter from serious
penalties. They also received 44,945 short term “penalty days” in the last quarter,
which represents a further $2.5m lost each quarter.
For the 1,641 CPD participants a quarter who receive a serious penalty with a part
waiver, the loss of an average of $746 represents 20.5% of their income support that
quarter.
For the 441 CDP participants each quarter who receive a serious penalty with no
waiver, the loss of $2,314 represents 63.6% of their income support that quarter.
Between them, these two groups represent 6% of all CDP participants.
This is calculated from the Department of Employment release of 2015-16 data for
what share of serious penalties are partially or fully waived, and the number of weeks
28
Davidson (2016) Nigel Scullion defends ‘harmful’ Indigenous work-for-the-dole program,
https://www.theguardian.com/australia-news/2016/oct/05/nigel-scullion-defends-harmful-
indigenous-work-for-the-dole-program
21 Remote control
of income support lost. 94% of serious penalties under the CDP were waived,29
although this includes penalties that are “worked off”.30 Four-fifths of these (78%)
were fully waived and the remaining fifth (22%) were partially waived (on average,
those receiving a partial waiver missed 2.4 weeks of income support).31 See Table 5
below for more details.
The overall burden of penalties is likely to be concentrated on the 18,000 CDP
participants who have Work for the Dole participants. Almost half of CDP participants,
about 16,000, are on “Basic Services”. While it is possible for them to receive
penalties,32 it is likely that a disproportionate number of penalties are applied to those
with daily Work for the Dole requirements.
If all penalties are accrued by the 18,000 participants with Work for the Dole
requirements, this represents 7.0% of their income support.
Penalties growing over time
Even if penalties are distributed across all CDP participants, and not limited to those
with Work for the Dole requirements, they still represent 3.7% of the income support
paid to CDP participants.
The dramatic increase in the number of CDP penalties means that Minister Scullion’s
figure of 1% is now out-of-date. In addition, Minister Scullion is comparing penalties,
which only apply to some people not in work, with welfare payments to all people not
in work in remote communities.
The June 2017 quarter had 44% more penalties for CDP recipients, including 64% more
serious penalties, than the average for the 2015-16 year.
29
Scullion (2016) Facts don’t back up ANU report on CDP,
http://www.nigelscullion.com/media+hub/Facts+don%E2%80%99t+back+up+ANU+report+on+CDP+;
Department of Prime Minister and Cabinet (2017) Questions on Notice, Estimates, Number 99 30
The waiver is described as “jobseekers choos[ing] to re-engage with the program”: Tomlin (2017)
Work-for-the-dole crime claim rejected by Indigenous Affairs Minister Nigel Scullion,
http://www.abc.net.au/news/2017-08-25/indigenous-affairs-minister-rejects-cdp-crime-
claims/8842190 31
Scullion (2016) Facts don’t back up ANU report on CDP,
http://www.nigelscullion.com/media+hub/Facts+don%E2%80%99t+back+up+ANU+report+on+CDP+;
Department of Prime Minister and Cabinet (2017) Questions on Notice, Estimates, Number 99
32 “Job seekers that do not have requirements to attend CDP activities may still have mutual obligations
(for example, attending appointments with their CDP provider and undertaking job search where
appropriate). Where these mutual obligations are not met, penalties may be applied in line with the
national Job Seeker Compliance Framework”: Department of the Prime Minister and Cabinet (2016)
Question on notice 202
22 Remote control
If current volumes of penalties continue, the penalty regime will cost welfare
recipients about $4.6 million a quarter, or $18.4 million per year. This is $135 a quarter
($542 a year) for each of the 34,000 CDP participants, or 3.7% of their total income
support.
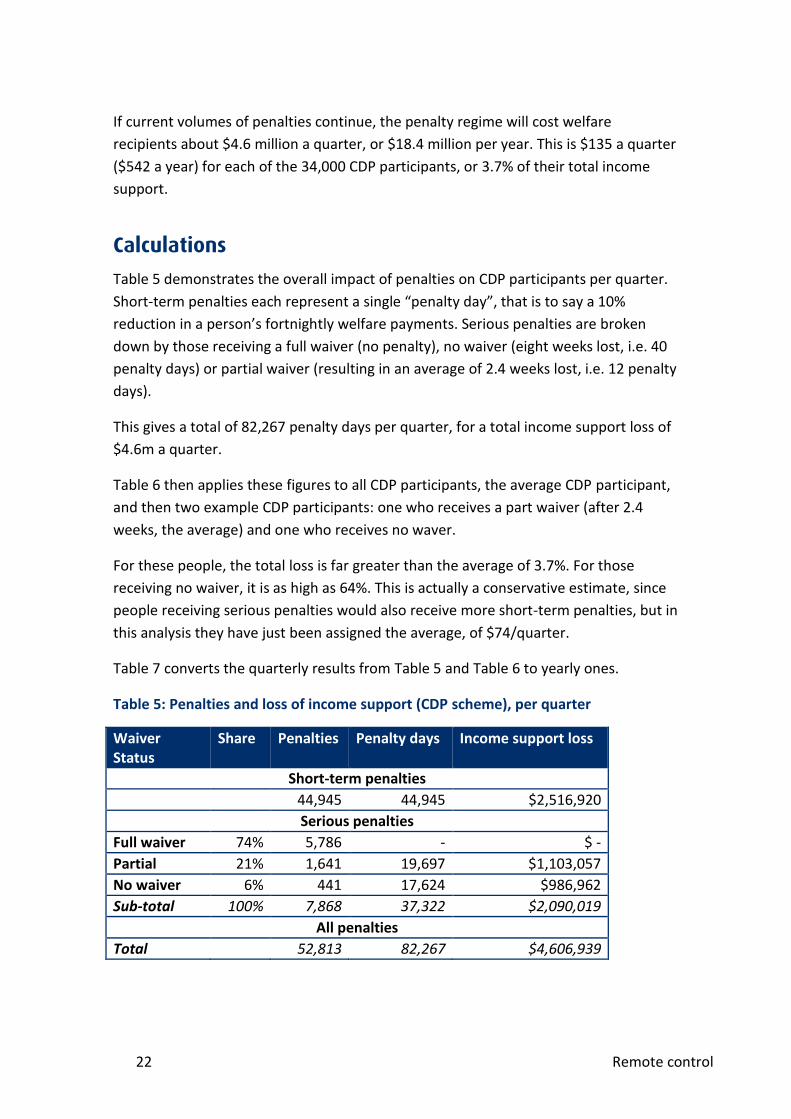
Calculations
Table 5 demonstrates the overall impact of penalties on CDP participants per quarter.
Short-term penalties each represent a single “penalty day”, that is to say a 10%
reduction in a person’s fortnightly welfare payments. Serious penalties are broken
down by those receiving a full waiver (no penalty), no waiver (eight weeks lost, i.e. 40
penalty days) or partial waiver (resulting in an average of 2.4 weeks lost, i.e. 12 penalty
days).
This gives a total of 82,267 penalty days per quarter, for a total income support loss of
$4.6m a quarter.
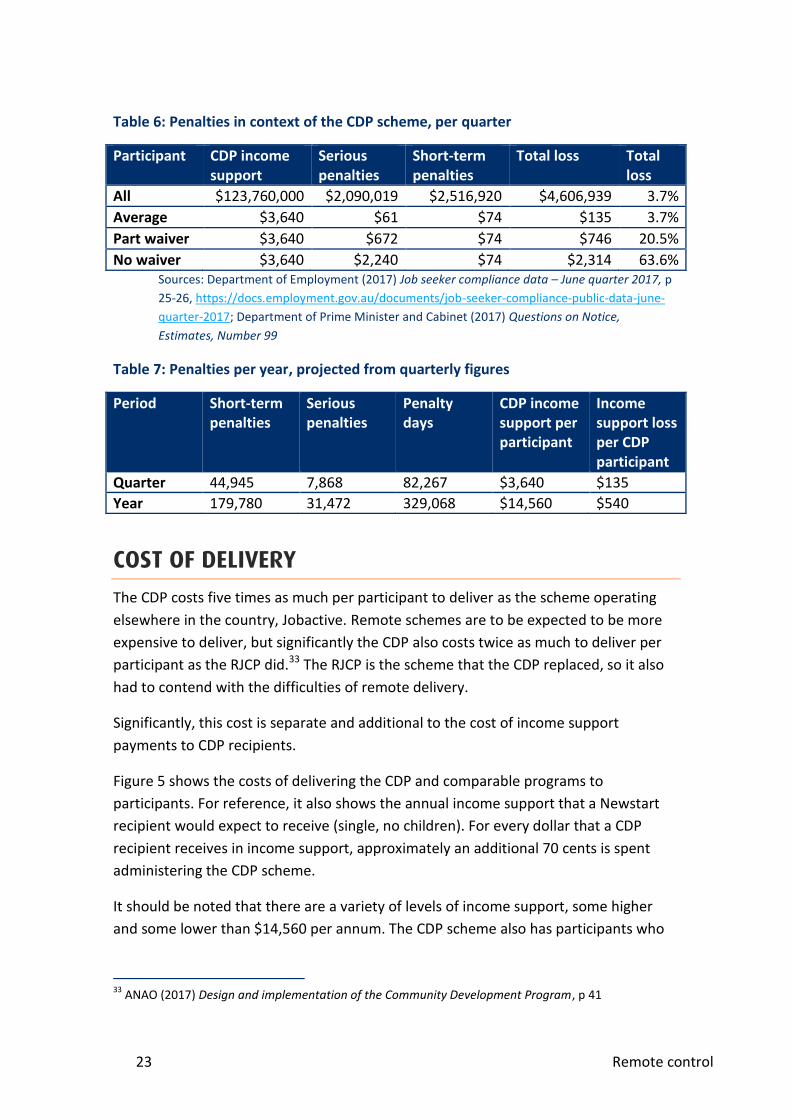
Table 6 then applies these figures to all CDP participants, the average CDP participant,
and then two example CDP participants: one who receives a part waiver (after 2.4
weeks, the average) and one who receives no waver.
For these people, the total loss is far greater than the average of 3.7%. For those
receiving no waiver, it is as high as 64%. This is actually a conservative estimate, since
people receiving serious penalties would also receive more short-term penalties, but in
this analysis they have just been assigned the average, of $74/quarter.
Table 7 converts the quarterly results from Table 5 and Table 6 to yearly ones.
Table 5: Penalties and loss of income support (CDP scheme), per quarter
Waiver Status
Share Penalties Penalty days Income support loss
Short-term penalties
44,945 44,945 $2,516,920
Serious penalties
Full waiver 74% 5,786 - $ -
Partial 21% 1,641 19,697 $1,103,057
No waiver 6% 441 17,624 $986,962
Sub-total 100% 7,868 37,322 $2,090,019
All penalties
Total 52,813 82,267 $4,606,939
23 Remote control
Table 6: Penalties in context of the CDP scheme, per quarter
Participant CDP income support
Serious penalties
Short-term penalties
Total loss Total loss
All $123,760,000 $2,090,019 $2,516,920 $4,606,939 3.7%
Average $3,640 $61 $74 $135 3.7%
Part waiver $3,640 $672 $74 $746 20.5%
No waiver $3,640 $2,240 $74 $2,314 63.6% Sources: Department of Employment (2017) Job seeker compliance data – June quarter 2017, p
25-26, https://docs.employment.gov.au/documents/job-seeker-compliance-public-data-june-
quarter-2017; Department of Prime Minister and Cabinet (2017) Questions on Notice,
Estimates, Number 99
Table 7: Penalties per year, projected from quarterly figures
Period Short-term penalties
Serious penalties
Penalty days
CDP income support per participant
Income support loss per CDP participant
Quarter 44,945 7,868 82,267 $3,640 $135
Year 179,780 31,472 329,068 $14,560 $540
COST OF DELIVERY
The CDP costs five times as much per participant to deliver as the scheme operating
elsewhere in the country, Jobactive. Remote schemes are to be expected to be more
expensive to deliver, but significantly the CDP also costs twice as much to deliver per
participant as the RJCP did.33 The RJCP is the scheme that the CDP replaced, so it also
had to contend with the difficulties of remote delivery.
Significantly, this cost is separate and additional to the cost of income support
payments to CDP recipients.
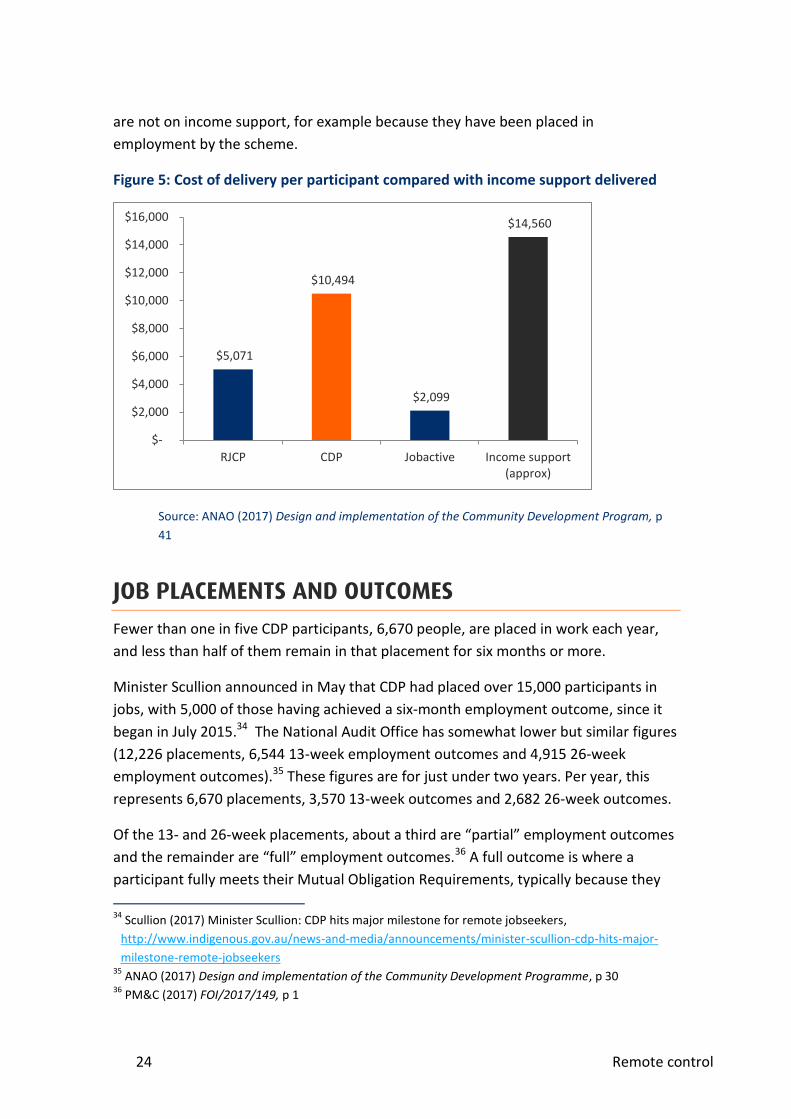
Figure 5 shows the costs of delivering the CDP and comparable programs to
participants. For reference, it also shows the annual income support that a Newstart
recipient would expect to receive (single, no children). For every dollar that a CDP
recipient receives in income support, approximately an additional 70 cents is spent
administering the CDP scheme.
It should be noted that there are a variety of levels of income support, some higher
and some lower than $14,560 per annum. The CDP scheme also has participants who
33
ANAO (2017) Design and implementation of the Community Development Program, p 41
24 Remote control
are not on income support, for example because they have been placed in
employment by the scheme.
Figure 5: Cost of delivery per participant compared with income support delivered
Source: ANAO (2017) Design and implementation of the Community Development Program, p
41
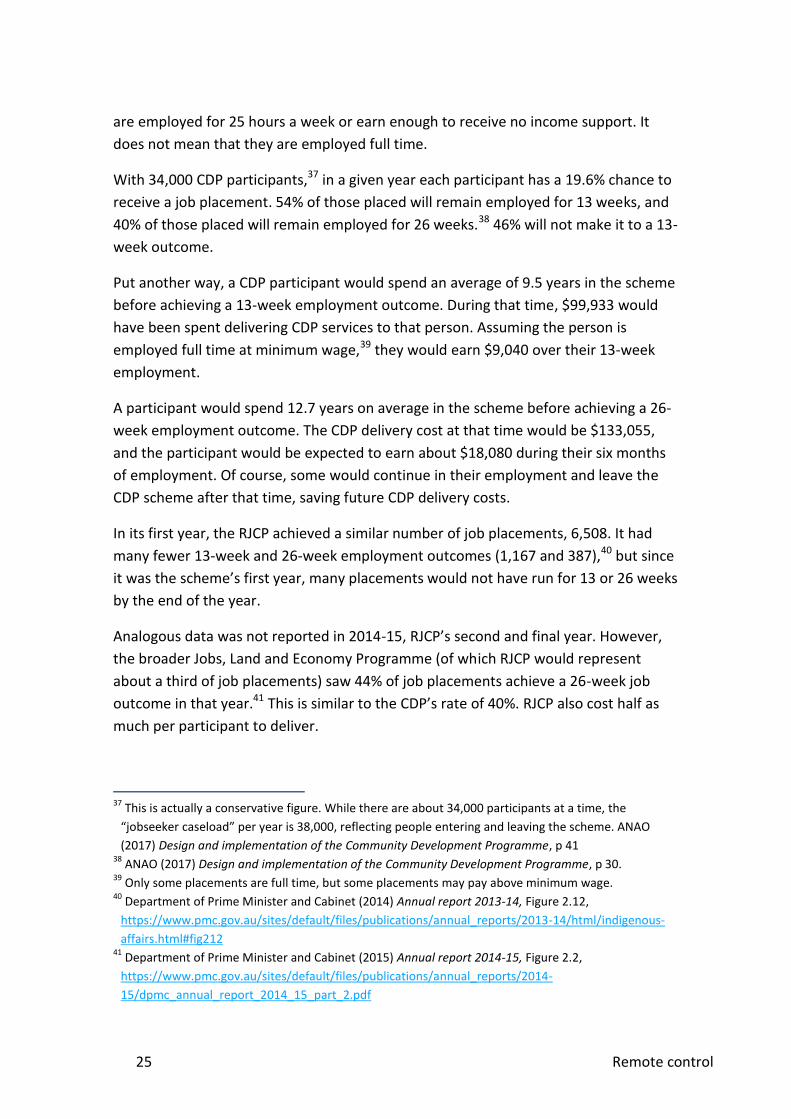
JOB PLACEMENTS AND OUTCOMES
Fewer than one in five CDP participants, 6,670 people, are placed in work each year,
and less than half of them remain in that placement for six months or more.
Minister Scullion announced in May that CDP had placed over 15,000 participants in
jobs, with 5,000 of those having achieved a six-month employment outcome, since it
began in July 2015.34 The National Audit Office has somewhat lower but similar figures
(12,226 placements, 6,544 13-week employment outcomes and 4,915 26-week
employment outcomes).35 These figures are for just under two years. Per year, this
represents 6,670 placements, 3,570 13-week outcomes and 2,682 26-week outcomes.
Of the 13- and 26-week placements, about a third are “partial” employment outcomes
and the remainder are “full” employment outcomes.36 A full outcome is where a
participant fully meets their Mutual Obligation Requirements, typically because they
34
Scullion (2017) Minister Scullion: CDP hits major milestone for remote jobseekers,
http://www.indigenous.gov.au/news-and-media/announcements/minister-scullion-cdp-hits-major-
milestone-remote-jobseekers 35
ANAO (2017) Design and implementation of the Community Development Programme, p 30 36
PM&C (2017) FOI/2017/149, p 1
$5,071
$10,494
$2,099
$14,560
$-
$2,000
$4,000
$6,000
$8,000
$10,000
$12,000
$14,000
$16,000
RJCP CDP Jobactive Income support(approx)
25 Remote control
are employed for 25 hours a week or earn enough to receive no income support. It
does not mean that they are employed full time.
With 34,000 CDP participants,37 in a given year each participant has a 19.6% chance to
receive a job placement. 54% of those placed will remain employed for 13 weeks, and
40% of those placed will remain employed for 26 weeks.38 46% will not make it to a 13-
week outcome.
Put another way, a CDP participant would spend an average of 9.5 years in the scheme
before achieving a 13-week employment outcome. During that time, $99,933 would
have been spent delivering CDP services to that person. Assuming the person is
employed full time at minimum wage,39 they would earn $9,040 over their 13-week
employment.
A participant would spend 12.7 years on average in the scheme before achieving a 26-
week employment outcome. The CDP delivery cost at that time would be $133,055,
and the participant would be expected to earn about $18,080 during their six months
of employment. Of course, some would continue in their employment and leave the
CDP scheme after that time, saving future CDP delivery costs.
In its first year, the RJCP achieved a similar number of job placements, 6,508. It had
many fewer 13-week and 26-week employment outcomes (1,167 and 387),40 but since
it was the scheme’s first year, many placements would not have run for 13 or 26 weeks
by the end of the year.
Analogous data was not reported in 2014-15, RJCP’s second and final year. However,
the broader Jobs, Land and Economy Programme (of which RJCP would represent
about a third of job placements) saw 44% of job placements achieve a 26-week job
outcome in that year.41 This is similar to the CDP’s rate of 40%. RJCP also cost half as
much per participant to deliver.
37
This is actually a conservative figure. While there are about 34,000 participants at a time, the
“jobseeker caseload” per year is 38,000, reflecting people entering and leaving the scheme. ANAO
(2017) Design and implementation of the Community Development Programme, p 41 38
ANAO (2017) Design and implementation of the Community Development Programme, p 30. 39
Only some placements are full time, but some placements may pay above minimum wage. 40
Department of Prime Minister and Cabinet (2014) Annual report 2013-14, Figure 2.12,
https://www.pmc.gov.au/sites/default/files/publications/annual_reports/2013-14/html/indigenous-
affairs.html#fig212 41
Department of Prime Minister and Cabinet (2015) Annual report 2014-15, Figure 2.2,
https://www.pmc.gov.au/sites/default/files/publications/annual_reports/2014-
15/dpmc_annual_report_2014_15_part_2.pdf
26 Remote control
The achievement of 2,682 part- and full-time 26-week employment outcomes each
year must be put in the context of the overall CDP scheme, which costs about $360
million per year to operate. That amount could directly employ 19,700 people for 26
weeks full-time,42 or it could employ 30,300 people for 26 weeks for 25 hours a week
(a “full employment outcome” as defined in the CDP). This is separate to the cost of
income support payments themselves.
Minister Scullion has described “getting people into jobs” as “the best part” of the CDP
scheme.43 In each year, less than 10% of CDP participants receive a job that lasts six
months or more.
Figure 6: Employment outcomes for scheme participants
Source: ANAO (2017) Design and implementation of the Community Development Programme,
p 30
42
Assuming minimum wage ($18.30) and a 38-hour work week. 43
Scullion (2017) Minister Scullion: CDP hits major milestone for remote jobseekers,
http://www.indigenous.gov.au/news-and-media/announcements/minister-scullion-cdp-hits-major-
milestone-remote-jobseekers
-
5,000
10,000
15,000
20,000
25,000
30,000
35,000
40,000
Participants Placements 13-weekoutcomes
26-weekoutcomes
27 Remote control
Conclusion
CDP participants live in remote areas with high unemployment and low incomes. These
are places that generally lack conventional job markets. Despite the limitations of
remote life, the CDP scheme has stricter requirements and harsher penalties than both
the schemes that it replaced and the schemes operating elsewhere in Australia.
There are 20 times as many non-remote welfare recipients as there are CDP
participants, but CDP participants receive more penalties. A penalty can cost up to
eight weeks in income support in a quarter, or 64% of the participant’s income.
Minister Scullion is correct that the participants in the CDP have been placed into
15,000 jobs. However, almost half do not remain in these jobs for 13 weeks, and more
than half do not remain in them for 26 weeks. Overall, less than one in 10 CDP
participants each year is placed in a job that they remain in for six months or more.
The harshness of the scheme has not achieved results. It is twice as expensive to
administer as the schemes that it replaced, and a participant can expect to spend over
12 years on average in the scheme before achieving six months of employment. That
employment may not even be full time.