Embed Size (px)
Citation preview

RESEARCH ARTICLE
Remote access protocols for Desktop-as-a-
Service solutions
Eduardo MagañaID1*, Iris Sesma1, Daniel MoratoID
2, Mikel Izal1
1 Public University of Navarre, Department of Electrical, Electronic and Communications Engineering,
Pamplona, Spain, 2 Institute of Smart Cities, Pamplona, Spain
Abstract
The use of remote desktop services on virtualized machines is a general trend to reduce the
cost of desktop seats. Instead of assigning a physical machine with its operating system
and software to each user, it is considerably easier to manage a light client machine that
connects to a server where the instance of the user’s desktop machine actually executes.
Citrix and VMware have been major suppliers of these systems in private clouds. Desktop-
as-a-Service solutions such as Amazon WorkSpaces offer a similar functionality, yet in a
public cloud environment. In this paper, we review the main offerings of remote desktop
protocols for a cloud deployment. We evaluate the necessary network resources using a
traffic model based on self-similar processes. We also evaluate the quality of experience
perceived by the user, in terms of image quality and interactivity, providing values of Mean
Opinion Score (MOS). The results confirm that the type of application running on the remote
servers and the mix of users must be considered to determine the bandwidth requirements.
Applications such as web browsing result in unexpectedly high traffic rates and long bursts,
more than the case of desktop video playing, because the on-page animations are rendered
on the server.
Introduction
Traditional desktop computers executing local productivity applications are evolving into
light local computers used as remote displays for centralized machines. This is the scenario of
Remote Desktop (RD) systems [1], where a host streams a computer desktop environment to
the user’s machine, where the user then browses this desktop as if it were local. This is a com-
mon deployment scenario in large and medium size enterprises owing to the reduction in cap-
ital and operational expenditures it provides [2].
The centralized computing resources are typically virtualized. A single host can offer inde-
pendent desktops to dozens of users in what is called a Virtual Desktop Infrastructure (VDI)
[3]. These remote desktops are accessed from thin clients: computers with reduced computa-
tional power and small disks that are used solely as remote displays and input devices (key-
board, mouse, sound, USB ports). The user employs a desktop operating system that behaves
PLOS ONE | https://doi.org/10.1371/journal.pone.0207512 January 4, 2019 1 / 28
a1111111111
a1111111111
a1111111111
a1111111111
a1111111111
OPEN ACCESS
Citation: Magaña E, Sesma I, Morato D, Izal M
(2019) Remote access protocols for Desktop-as-a-
Service solutions. PLoS ONE 14(1): e0207512.
https://doi.org/10.1371/journal.pone.0207512
Editor: Mehmet Hadi Gunes, University of Nevada,
UNITED STATES
Received: January 25, 2018
Accepted: October 27, 2018
Published: January 4, 2019
Copyright: © 2019 Magana et al. This is an open
access article distributed under the terms of the
Creative Commons Attribution License, which
permits unrestricted use, distribution, and
reproduction in any medium, provided the original
author and source are credited.
Data Availability Statement: All relevant data are
within the paper.
Funding: This work has been supported by the
Spanish Ministry of Economy and Competitiveness
and the European Regional Development Fund
under the project Procesado Inteligente de Trafico
(MINECO/FEDER TEC2015-69417-C2-2-R) to MI.
Competing interests: Author EM is founder of the
commercial company Naudit High Performance
Computing (https://www.naudit.es/en/). EM never
has been employed by Naudit High Performance
Computing and was not employed by this
company while this study was underway. This

as if local to his computer, yet is instead a network-streamed version of a virtualized and cen-
tralized desktop.
RD systems provide reduced computer management costs owing to centralized backups,
updates, security control, and other system functions. The capital expenditure in desktop hard-
ware is also reduced as it functions with inexpensive thin clients. New features can be easily
offered, such as access to the user’s desktop from any device, even mobile devices (from smart-
phones or tablets). The main disadvantages to these RD systems are the requirement for a cen-
tralized infrastructure that offers the real desktop and the requirement of high speed and low
latency network access from the users to the infrastructure.
The centralized infrastructure in a VDI is typically a private server farm, datacentre, or pri-
vate cloud, for the exclusive use of the company employees. However, a VDI is complex and
hence is difficult to manage and maintain. The consequence of these challenges has been the
increase of Virtual Desktop Clouds (VDCs) and Desktop-as-a-Service (DaaS) solutions. They
offer the capability to outsource the infrastructure and its management to a public cloud. How-
ever, VDC usability imposes more severe requirements on the minimum network speed and
maximum latency for the company Internet access links and the path from the local network
to the closest DaaS cloud [4]. Some providers even recommend dedicated links to their cloud
[5]. The minimum required bandwidth and maximum delay for a population of VDC users
depends on the specific RD system used, because of the different compression algorithms, pro-
tocol behaviours, and user profiles [6].
There is a significant diversity in RD solutions. Remote FrameBuffer protocol (RFB) [7]
and Remote Desktop Protocol (RDP) [8] are two of the oldest RD protocols. They are imple-
mented in commercial and open source packages for the majority of operating systems, from
any X Window system to Android, macOS, and the different Microsoft Windows versions.
Virtual Network Computing (VNC) is a desktop sharing solution that implements RFB.
RDP is included in Windows operating systems. Another popular multi-platform RD solution
used for controlling remote physical hosts is TeamViewer [9]. However, TeamViewer is not
designed for a VDI environment; rather, it is used for remote assistance support [10].
PCoIP [11] is a protocol used in several RD systems (for example, VMware View [12]). It is
particularly popular since its adoption for Amazon WorkSpaces in 2015 [13], which is a DaaS
that offers remote desktop seats according to requirements, with pay-per-use plans and no
requirement to administer the management of the server infrastructure. This new proposal
from Amazon opens an interesting question on the evaluation of the different solutions of
VDI, both at the level of network resources required and the quality of experience (QoE) per-
ceived by the users.
Owing to the popularity of Microsoft Windows as a desktop operating system, large RD
deployments are based on Windows desktops and use RD services optimised for Windows.
Citrix is based on the Independent Computing Architecture (ICA) protocol and represents
more than 50% market share within the RD space, mainly for Windows desktops [2]. It is fol-
lowed by VMware (that uses PCoIP as the protocol), with approximately a 30% share, and
RDP with less than a 5%. Other offerings such as Dell/Quest vWorkspace, Virtual Bridges,
Oracle/Sun VDI, and Red Hat Enterprise Virtualization have less than a 5% market share.
In this paper, we compare the most important Remote Desktop protocols and software
implementations, including the effects of WAN access and public cloud sharing for a DaaS
scenario. We deploy the setups in the Amazon cloud environment (Amazon Web Services,
AWS). We present a novel comparison of the most representative Remote Desktop protocols
using virtualized hosts in an Amazon datacentre accessed by clients from a campus LAN. We
deploy server software for ICA HDX (used in VDI Citrix systems [14]), RFB (VNC), RDP
(used in Windows Azure [15]), and TeamViewer protocols, and compare these to the PCoIP
Remote access protocols for Desktop-as-a-Service solutions
PLOS ONE | https://doi.org/10.1371/journal.pone.0207512 January 4, 2019 2 / 28
does not alter our adherence to PLOS ONE policies
on sharing data and materials.

protocol as provided by Amazon WorkSpaces [16] (the DaaS provided by Amazon). We define
three user profiles: the first centred on an office productivity suite, the second based on Inter-
net browsing, and finally a multimedia video consumer. We compare video quality, interactiv-
ity, and link bandwidth requirements for the aforementioned protocols. We also model the
network traffic they produce using long-range dependent processes. This model is used to
evaluate the different degree of burstiness due to the different user profiles or characteristics in
the remote desktop protocols.
The results demonstrate the trade-offs among the different RD systems, between quality
and bandwidth consumption. The different approaches in system design result in specific
protocols being more adequate for specific desktop user tasks. For example, the Amazon
WorkSpaces solution (based on PCoIP) presents a reasonable quality, however its network
bandwidth usage is high. Conversely, TeamViewer sacrifices video quality and interactivity to
contain network usage.
This paper is organised as follows. The next section compares this work with previous
related papers in the literature. The section “Methodology and experimental setup” describes
the experimental environment including the hardware and software installations, user profiles,
and evaluation metrics. Section “Evaluation of PCoIP” presents the measurements and perfor-
mance results for the PCoIP protocol (Amazon WorkSpaces DaaS), followed by a section that
compares the results from PCoIP to the other RD protocols. The section “Recommendations
for remote desktop protocol design” provides suggestions to improve the user experience in
these scenarios. Finally, conclusions are presented.
Related work
There are works in the literature that compare RD protocols using different metrics, however
none of these offer traffic models or QoE measurements with virtualized hosts in a public
cloud. In [17] the authors present a comparison of RD solutions in a WAN environment,
focusing on latency, bandwidth, and video quality. The quality is estimated from the amount
of traffic in the network, without evaluating the real experience perceived by the user. Further,
PCoIP was not popular when this research was conducted, therefore it was not included in the
comparison. In [18] they include PCoIP in a virtualized environment and emulate a WAN sce-
nario adding delay and losses to the traffic. However, in both [17] and [18] the authors evaluate
video quality based on the transfer size, where a smaller size is assumed to be related to a lower
quality. Conversely, we compare the video stream at the source and destination and from a
Peak Signal-to-Noise Ratio (PSNR) measurement, we conclude a Mean Opinion Score (MOS)
value. The MOS is a popular metric for QoE in video streaming scenarios [19].
Suzbjevic et al. [20] conducted QoE measurements for a population of RDP users working
with different applications (document editing, audio and video streaming, and web browsing).
In [21] the authors conducted a similar QoE study, however for the ICA protocol. Although
both papers provide MOS values, they focus exclusively on a single RD protocol, whereas in
this paper we compare RDP to VNC, ICA, and particularly PCoIP in the Amazon WorkSpaces
cloud.
In [22] Schlosser et al. evaluated QoE by measuring the time to complete a user task (typing,
scrolling). They were interested in the effects of several optimisation mechanisms in Citrix
ICA. They did not compare to other RD solutions and did not evaluate the change in quality
in the video stream. In a previous work [23], the same authors did compare RDP to ICA; how-
ever, they used the same QoE metrics and did not include PCoIP in any of the cases.
More recent papers have compared PCoIP to RDP [24] [25]; however, they neither offer
QoE measurements nor perform the experiments in a real cloud environment. Further, in the
Remote access protocols for Desktop-as-a-Service solutions
PLOS ONE | https://doi.org/10.1371/journal.pone.0207512 January 4, 2019 3 / 28

majority of the above mentioned papers, the evaluation only included the effect of network
losses and delay in an emulated environment based on tools such as NetEm [21].
Methodology and experimental setup
In this paper, we compare the remote desktop protocols RDP, ICA, PCoIP, RFB, and Team-
Viewer. RDP is used in Microsoft Azure VDI [15], Amazon EC2 [26], and VMware [27]. ICA
is the protocol used in Citrix VDI [14]. PCoIP is used in VDI systems such as Amazon Work-
Spaces [16] and VMware [12]. RFB is the protocol under VNC [7].
In this section, we first highlight the characteristics in each protocol that are relevant for
this comparison. We then present the hardware and software tools used for the evaluation,
describe the user profiles, define the measurement metrics, and finally introduce the character-
istics of self-similar arrival processes that are used for user traffic modelling.
Protocols for remote desktop
ICA (1989) is a proprietary solution by Citrix Systems. It was developed for remote access to
Microsoft Windows desktops; today, it also offers access to Linux hosts. It uses mainly TCP as
a transport protocol [28], however audio streams can be sent using UDP [29]. It transports
graphic interface function calls. It offers different priorities for different flows and it transports
originally compressed multimedia streams employing separate virtual communication chan-
nels [30] [31].
VNC (1998) implements the RFB protocol, specified today in [7]. There exist client and
server implementations for the majority of operating systems including Microsoft Windows,
Linux, macOS, and Android. As an open standard, there are commercial and free software
packages such as RealVNC [32], TightVNC [33], UltraVNC [34], and TurboVNC [35]. As its
name implies (Remote FrameBuffer protocol), it functions at the framebuffer level, capturing
the stream sent to the video output. Using TCP, the client asks the server for updates on differ-
ent parts of the screen [7] [36]. The reply can be raw pixmaps (or other content such as audio)
with different types of compression and quality depending on network conditions.
RDP (1998) is a protocol developed by Microsoft for Windows systems based on the T.120
family of protocols from the International Telecommunication Union, with third party client
and server implementations for other platforms (including Linux, macOS, and Android). It
uses TCP as the transport protocol and supports multiple parallel channels for the transmis-
sion of different flows of data [8]. It reduces the amount of traffic by transporting graphic
interface function calls instead of bitmaps when possible. Originally compressed multimedia
streams can be redirected from the server to the client for local client playback (without
decompressing in the server), reducing CPU load on the server and network traffic [37].
TeamViewer (2005) uses its own intermediate servers to provide the service in a manner
that facilitates the connection with remote desktop servers that are behind a Network Address
Translator (NAT). Authentication is performed from the client and remote desktop server
against the TeamViewer servers. When the identity is verified, the intermediate servers control
connecting the client to the remote desktop server. The control communication is imple-
mented over TCP [38] and the actual communication of the remote desktop service with the
server uses UDP. The screen is updated as a pixel map in a similar manner to VNC, however
in this case, over the UDP transport protocol. The type of information to be displayed on the
screen is automatically detected and compressed accordingly, considering also the network
conditions. Initially the different areas of the screen are loaded with low resolution; in the
event that the content requires higher resolution (high quality images or videos), it is resent
with a higher quality layer.
Remote access protocols for Desktop-as-a-Service solutions
PLOS ONE | https://doi.org/10.1371/journal.pone.0207512 January 4, 2019 4 / 28

The PCoIP (2008) protocol was developed by Teradici Corporation. It is today offered by
VMware View installations [12] and the Amazon WorkSpaces virtual desktop cloud [16].
There are Windows and Linux installers available for the server and client for the majority of
platforms including Android and iOS tablets. PCoIP streams an on-the-fly compressed video
from the screen output, using dynamic compression based on the type of content (text, image,
video). It transports the compressed pixmap data over UDP [39].
The characteristics of these RD protocols are summarised in Table 1.
Hardware and software infrastructure
The scenario of remote desktop solutions in a real cloud environment, accessed from users
through the public Internet, has not been studied in the literature. To address this deficiency,
we deploy different remote desktop servers in the Amazon public cloud (Amazon EC2). We
selected the Amazon datacentre in Ireland owing to its close location to our remote desktop
clients in Spain.
We created two similar virtual servers in the cloud. For the PCoIP evaluation, we selected
the “value package” template in Amazon WorkSpaces. This is a Windows 7 installation on one
CPU core running at 2.4 GHz and using 2 GB of RAM. The second virtual server was created
to evaluate RDP, RFB, and TeamViewer. To achieve a fair comparison, we selected the most
similar offering in the same datacentre. It was an EC2 instance using Windows Server 2012 on
one CPU core at 2.4 GHz and 2 GB of RAM. On this virtual server, we evaluated RDP8 (from
Table 1. Characteristics of RD protocols.
RD protocols VNC RDP ICA TeamViewer PCoIP
VDI using
protocol
- Windows Azure
Amazon EC2
VMware
Citrix - WorkSpaces
VMware
Transport
protocol/ports
TCP/5900 TCP/3389 TCP/1494,
2598
TCP/5938,
80, 445
UDP/dynam.
UDP/4172
Update submission
strategy
pixel map graphic interface
function calls
graphic interface
function calls
pixel map pixel map
Compression adapted
to network conditions
no yes yes yes yes
Compression adapted
to content
no yes yes yes yes
Screen refresh
controlled by
client server server server server
Server operating
system
Windows
macOS
Linux
Windows
Linux
Windows
Linux
Windows
macOS
Linux
Windows
Client operating
system
Windows
macOS
Linux
iOS
Android
Windows
macOS
Linux
iOS
Android
Windows
macOS
Linux
iOS
Android
Blackberry
Windows
macOS
Linux
Chrome OS
iOS
Android
Blackberry
Windows
macOS
Chrome OS
iOS
Android
Fire
Open source yes (depending on
implementation)
no no no no
Computing resources
at server
medium low medium medium-low medium-high
Computing resources
at client
medium-high medium-low low medium very low
https://doi.org/10.1371/journal.pone.0207512.t001
Remote access protocols for Desktop-as-a-Service solutions
PLOS ONE | https://doi.org/10.1371/journal.pone.0207512 January 4, 2019 5 / 28

the Windows installation), RFB (RealVNC 5.3.2), and TeamViewer v11. For ICA HDX (Citrix
XenDesktop 7.5), we created a local installation on a server with one CPU core at 2.4 GHz and
4 GB RAM.
All the tests were performed using the same desktop PC as the client in our local network at
the Public University of Navarre in Spain. For each remote desktop service, the most recent cli-
ent version was selected. The Amazon WorkSpaces client v.2.1 was used to control the first vir-
tual server (the one in the Amazon cloud). The client for RDP was the one from the Windows
10 installation, using RDP8 as the maximum common version between the client and server.
The VNC client was Real VNC Viewer v5.3, and for the ICA protocol, the client from the
Citrix XenDesktop 7.5 installation was selected. The local video resolution was 1280×1024 pix-
els. The setup is displayed in Fig 1.
The access link to our Internet Service Provider (ISP) was recently updated to full-duplex
10 Gb/s. During the experiments, we conducted network bandwidth and delay tests between
our local network and the Amazon datacentre in Ireland, achieving average rates of approxi-
mately 60 Mb/s downstream and 90 Mb/s upstream. The average measured round-trip time
(RTT) was 53 ms. This is an average delay well below the maximum recommended value for
interactive applications (150 ms one-way, from ITU-T G.114 recommendation). Based on
these measurements, we did not expect any limitation due to the access link.
User profiles
To measure the performance of remote desktop services, we defined three user profiles similar
to those in [40] [41]: office, web browsing, and video user profiles. They present different
degrees of interactivity with the desktop and result in varying frequency changes to the desktop
output.
We recorded user actions (keyboard presses and mouse movement events) using the Macro
Recorder tool [42]. The actions recorded were replayed for each remote desktop environment
and each experiment. In this manner, we guaranteed the same user actions for all experiments,
with the same timing. The experimental data captured from the user interactions with real
remote desktop services was obtained by the authors of this paper acting as the users.
For the office user profile, we recorded the actions of a LibreOffice Writer user. He
launched the text editor, wrote text, changed text styles, added images, and saved the docu-
ment. All these steps required text selections, interaction with menus, and pop-up windows.
For the “web browsing” profile, a user wrote a URL in a web browser and a rich content
webpage was loaded. He scrolled around the page and clicked on hyperlinks. Three different
webpages were loaded during the recorded test, including a newspaper landing page, a
Fig 1. Experimental scenario for evaluation of RD protocols.
https://doi.org/10.1371/journal.pone.0207512.g001
Remote access protocols for Desktop-as-a-Service solutions
PLOS ONE | https://doi.org/10.1371/journal.pone.0207512 January 4, 2019 6 / 28

university homepage, and a web containing online courses. These were considerably differ-
ent in the amount of multimedia content (videos, flash content, animations, and images)
included.
The “video” user profile was based on a user viewing several video files. The same video
files were reproduced at low and high resolution (from 144p to 1080p) using YouTube video
qualities, including scenarios using full-screen mode. Some RD systems use a channel to trans-
fer the multimedia file from the server to the client, whereas others send an on-the-fly com-
pressed version of the video screen, extracted directly from the framebuffer. We expected large
differences in video quality from one RD solution to another, especially for the 1080p resolu-
tion. Previous published works have used lower resolution video files [17]; today, desktop
users require viewing video presentations or video collaboration where high-resolution videos
are streamed.
Experimental setup and performance metrics
We selected metrics for the evaluation of the network usage and QoE. These were based on
the network traffic and video streams at both the server and client. A network usage profile is
required for any link dimensioning to determine the minimum available capacity required in
the path between a set of clients and servers in a VDC scenario. As the network path was not
congested during the conducted experiments, we provide a measurement of maximum band-
width required. The RTT was considered approximately constant for all the experiments as
all the servers were co-located in the same datacentre and there was a common client. We
attempted to correlate the user perceived quality with network usage, as these were expected to
be tightly coupled. The downstream throughput was the principal component, as the upstream
flow contained mainly user input (keyboard and mouse), protocol “keepalives”, and acknowl-
edgements. We used tcpdump [43] at the client for the traffic capture and tcpstat [44] for the
network traffic analysis.
The service quality experienced by the user of an RD system depends on the video quality
and interactivity. A system can apply high compression techniques and produce a low band-
width stream. The result is a lower video quality due to the high compression rate and a
reduced interactivity due to the increased compression delay. Conversely, a system that applies
low compression techniques produces higher video quality and lower delays; however, this is
realised at the expense of higher traffic bitrates.
The QoE is measured based on the difference between the video stream directly at the
video output in the source desktop server and at the destination RD client. We use the PSNR
[19] as an objective metric of the difference between both video sources. A large degree of
compression results in a reduced PSNR because of the difference between both streams.
Large delays result in temporal desynchronization between the flows, again with the result of
a reduced PSNR. The PSNR has been used in previous studies on quality in streamed video
[45] [46].
The video streams at the RD server and client are recorded simultaneously using Badicam
software [47]. Both video streams are compared using EvalVid [19]. EvalVid is a well-known
tool for video evaluation in the research community [45] [48] [49] [50]. This tool offers a
PSNR measurement designed for the evaluation of video transmission over a network path
with losses. For its operation, we were required to synchronize both video streams to compare
them. We did this on a frame level by starting the video comparison from the timestamp when
a small rectangle in the screen was modified owing to a mouse click. The small rectangle was
the only change in the screen and therefore a small compression delay was expected. This
delay and the one-way-delay were eliminated owing to this synchronization.
Remote access protocols for Desktop-as-a-Service solutions
PLOS ONE | https://doi.org/10.1371/journal.pone.0207512 January 4, 2019 7 / 28

A reduced PSNR between both video streams could be the consequence of a loss of video
quality due to a high compression rate at the server. The majority of remote desktop services
use TCP at the transport layer and therefore network losses do not introduce video quality
degradation. However, network losses (due to their recovery time), network one-way delay
variations, and slower compression result in greater delays between the video at the RD server
and the client. The result is a stream desynchronization that also produces reduced PSNR val-
ues. The remote desktop systems recover quickly from the desynchronization; however, the
PSNR has already been locally impacted. EvalVid offers a relation between the measured values
of the PSNR and an estimated MOS [19]. The MOS is the standard QoE metric. Table 2 dis-
plays this relation, extracted from [19].
For every combination of RD system and user profile, the above-mentioned metrics were
recorded. For each experiment, the procedure was: launch traffic capture at the client, launch
desktop video capture at the server and the client, and finally, play the recorded user events
(using a macro) for the selected user profile. After an experiment completed, both video
streams were collected at the same machine, re-synchronized, and EvalVid was executed,
obtaining the PSNR and MOS results. Based on the capture of network traffic, a network traffic
profile was obtained.
Statistical model for remote desktop traffic
For scenarios with cloud deployment of remote desktops, the traffic from this service uses the
company’s Internet access link. Sizing the required capacity for the access link and its packet
buffers is vital for an adequate QoE. This dimensioning requires characterising the statistical
behaviour of the remote desktop traffic.
It has been reported for two decades that, contrary to traditional teletraffic theory, Internet
traffic cannot be adequately modelled by processes with independent or short-range depen-
dent random variables. High-resolution traffic measurements in LAN and WAN scenarios
[51] [52] [53] have indicated that network traffic exhibits Long Range Dependence (LRD),
which is a property of self-similar or fractal random processes. Measurements from applica-
tions such as the World Wide Web [54] and Variable Bit Rate Video [55] have indicated that
they generate traffic that is consistent with self-similarity.
Self-similarity in a random process can be defined based on the autocorrelation function of
the aggregated process. Let Z(t), t 2 R be the continuous process of the number of bytes arriv-
ing in time interval [0, t). Consider the stationary discrete-time process X of the number of
bytes per time interval δ as:
X ¼ fXkg ¼ fZðkdÞ � Zððk � 1ÞdÞ; k 2 N; k � 1g ð1Þ
The process defined as XðnÞ ¼ fXðnÞi g is an aggregated process where:
XðnÞi ¼1
n
Xni
k¼nði� 1Þþ1
Xk; n > 1; i � 1 ð2Þ
Table 2. PSNR to MOS mapping and ITU-R quality and impairment scales [19].
PSNR[dB] MOS Quality Impairment
>37 5 Excellent Imperceptible
32–37 4 Good Perceptible, yet not annoying
26–31 3 Fair Slightly annoying
21–25 2 Poor Annoying
<20 1 Bad Extremely annoying
https://doi.org/10.1371/journal.pone.0207512.t002
Remote access protocols for Desktop-as-a-Service solutions
PLOS ONE | https://doi.org/10.1371/journal.pone.0207512 January 4, 2019 8 / 28

Let ρ(n)(j) with j> 1 be the autocorrelation function of X(n). The process X is asymptotically
second-order self-similar if the following limit for its autocorrelation function is true:
limn!1rðnÞðjÞ ¼
1
2ððjþ 1Þ
2H� 2j2H þ ðj � 1Þ
2HÞ ð3Þ
whereH is the Hust parameter. For 1/2 <H< 1 the autocorrelation function decays slowly,
being not summable, and we say that X presents long-range dependence.
This is a definition of self-similarity as an asymptotic property (it only occurs when n!1).
There is a timescale (δ) beyond which the traffic behaves as a stationary Gaussian self-similar
process with constantH parameter, whereas at short scales it is better described with complex
multi-fractal models [56] [57]. For large traffic aggregation levels, parsimonious modeling
based on fractals suck as Fractional Brownian Motion (FBM) are predominant [58] [59] [60].
A FBM FH(t) is a Gaussian process that satisfies:
E½FHðsÞFHðtÞ� ¼1
2ðjtj2H þ jsj2H� jt � sj2HÞ ð4Þ
An Fractional Gaussian Noise (FGN) is defined as the increments of an FBM. An FBM is
used as a model for the cumulative arrival process Z(t) where the FGN models the arrival pro-
cess X of bytes per interval.
For a process with independent increments whose marginal distribution has variance σ2,
the aggregated process with level δ presents a variance δσ2. However, for an FBM the variance
in the aggregated process s2d
is [61]:
s2d¼ d
2Hs2 ð5Þ
ForH> 0.5 the result is larger variability in the arrival process of traffic to a network link,
longer delays waiting in queue and larger packet loss probabilities [58].
In this paper, we study the long-range dependence in remote desktop traffic based on esti-
mations of the Hurst parameter. We evaluate its value for different protocols and user profiles
and its influence for large user aggregation levels.
In the following sections, we first evaluate Amazon WorkSpaces in terms of transfer rate
and QoE. Then, this is compared with the other remote desktop protocols.
Evaluation of PCoIP (Amazon WorkSpaces)
This section presents the evaluation results for the PCoIP protocol as deployed in Amazon
WorkSpaces DaaS. It is a novel scenario, offering a massive deployment for the provision of
virtualized desktops in the cloud. We identify the network and server requirements for each
user profile as defined in a previous section and evaluate the resulting QoE. We model the user
traffic as a self-similar arrival process, with different parameters for each user profile, which
influence network link dimensioning. In a later section, we compare the results from PCoIP
(Amazon WorkSpaces) to RDP, VNC, ICA, and TeamViewer.
Transfer rate
The access-link available bandwidth and link usage are fundamental characteristics as they
limit the number of users for which remote desktop services can be deployed. Peak bitrate and
its average are strongly dependent on user behaviour.
Fig 2 displays the time series of link bandwidth usage for an experiment with a user with an
office profile. Principal events are marked in the time axis. As detailed in section 3 the user per-
forms several tasks, opening and editing a document. The user performed several tasks while
Remote access protocols for Desktop-as-a-Service solutions
PLOS ONE | https://doi.org/10.1371/journal.pone.0207512 January 4, 2019 9 / 28

opening and editing a document. The main events are marked in the time axis. As expected,
the upstream requirements are low compared to the downstream requirements. For 99% of
the time, the upstream link rate usage was less than 100 Kb/s, whereas the downstream link
rate approached 900 Kb/s when large changes occurred on the screen, for example, when a
new document window was opened or a large image was inserted.
Traffic behaviour was consistent with Amazon recommendations for Amazon WorkSpaces
[62], where it states that “the network connection should provide at least 300 Kb/s, with capabil-ity to provide over 1 Mb/s when viewing video or using graphic-intensive applications”. We must
note that text editing is typically not a graphic-intensive application; however, it presents
spikes in network usage consistent with this recommendation. It is demonstrated later that for
video playback, the network requirements are considerably greater than those recommended.
Fig 3 displays the traffic profile for a case of a web browsing user. The principal events are
marked in the time axis. The first site visited was a web page containing online courses. The
user logged in, located a course, and viewed a PDF document in the browser window. The
actions of receiving the screen containing the PDF and scrolling through this screen are clearly
marked with spikes reaching 8 Mb/s.
The second visited web site was a university landing page. The user browsed through the
news and information regarding the academic degrees offered. There were moving banners
and automatic slideshows in the web page that resulted in continuous screen changes and
therefore sustained traffic rates greater than 6 Mb/s. This is a clear indication of how rich con-
tent in a web page based on JavaScript, harmless in a local desktop environment, can result in
high bandwidth requirements in a remote desktop deployment. The changing images on the
screen were not large files, yet because of the animations, they became a video stream.
The third visited web page was the landing page of a news site. The user scrolled the news
headers and visited some of these. The page did not contain moving banners and hence did
not result in sustained high bitrates. However, the multimedia linked files (images) were large,
surpassing more than 9 Mb/s for some of the screen updates. The main insight from Fig 3 is
how apparently low profile web pages can become traffic intensive in a RD deployment owing
to remotely rendered animations.
Fig 2. Transfer rate for the office profile in Amazon WorkSpaces.
https://doi.org/10.1371/journal.pone.0207512.g002
Remote access protocols for Desktop-as-a-Service solutions
PLOS ONE | https://doi.org/10.1371/journal.pone.0207512 January 4, 2019 10 / 28

Fig 4 displays the traffic rate for one experiment with the video user profile. The same video
file was viewed at different resolutions from the YouTube webpage. The x-axis in Fig 4 displays
the approximate time when the user changed the resolution. PCoIP did not transfer the video
file for local playback at the client. Starting from a 144p video resolution using more than 2
Mb/s, the link usage reached 10 Mb/s for the 720p version owing to the larger screen surface
experiencing quick changes. These results are in contrast to the Amazon recommendations of
between 300 Kb/s and 1 Mb/s for video intensive applications [62].
Fig 3. Transfer rate for the web profile in Amazon WorkSpaces.
https://doi.org/10.1371/journal.pone.0207512.g003
Fig 4. Transfer rate for the video profile in Amazon WorkSpaces with different video sizes.
https://doi.org/10.1371/journal.pone.0207512.g004
Remote access protocols for Desktop-as-a-Service solutions
PLOS ONE | https://doi.org/10.1371/journal.pone.0207512 January 4, 2019 11 / 28

If the user presents the video in full screen mode, the transfer rate is similar for every video
file resolution. The video playback program uses interpolation techniques to produce a higher
resolution video stream that fills the screen, instead of presenting a simple scaled version of the
video. Therefore, changes occur everywhere in the screen and, as indicated in Fig 5, the com-
pressed flow to the client presents a similar transfer rate, independent of the original video
resolution.
A parameter related to the transfer rates is the packet size. Fig 6 displays the cumulative dis-
tribution function of packet sizes for the three user profiles in the Amazon WorkSpaces sce-
nario. For the web browsing and video profiles, 70% of the packets had the maximum size,
that being 1156 bytes, considerably less than the Ethernet Maximum Transmission Unit
Fig 5. Transfer rate for video profile in Amazon WorkSpaces with full screen.
https://doi.org/10.1371/journal.pone.0207512.g005
Fig 6. Packet size cumulative distribution function for three user profiles in Amazon WorkSpaces.
https://doi.org/10.1371/journal.pone.0207512.g006
Remote access protocols for Desktop-as-a-Service solutions
PLOS ONE | https://doi.org/10.1371/journal.pone.0207512 January 4, 2019 12 / 28

(MTU) of 1500 bytes. This maximum size avoids fragmentation of packets passing through
VPNs or tunnels. It is preferable to avoid fragmentation as fragmentation results in a higher
impact of the losses on performance. Because web browsing and video profiles have higher
transfer rates, maximum-sized packets are used. In the office profile, the packet sizes were
more variable, with a greater percentage of small packets because the information sent corre-
sponded to refreshments of smaller screen zones.
In conclusion, the transfer rates identified for Amazon WorkSpaces differ substantially
from the rates that Amazon itself recommends for the deployment of its services [62], with a
transfer rate approximately 300–1000 Kb/s. This recommendation is valid for an office profile;
however, for the web browsing and multimedia profiles it is clearly insufficient because these
profiles frequently approached rates of 5–10 Mb/s. Even in the case of visualisation of low-res-
olution small videos, 1 Mb/s would not be sufficient; it would require 2–3 Mb/s. A short avail-
able bandwidth could automatically mean a loss of interactivity in the service (it is not possible
to send the screen in real time) and a loss of quality of image (using stronger compression
schemes with losses).
Quality of experience
We compared the desktop video stream recorded at the server (sent) and the client (received).
Highly lossy compression and delay variations result in changes between both video streams.
We obtained a PSNR time series of these changes using EvalVid. From this PSNR, a corre-
sponding MOS value was obtained from Table 2.
Fig 7 displays an example of 600 frames (20 s) of PSNR time series for the video user profile
while the user was viewing a 480p video file. The minimum PSNR values are due to transitions
between scenes where large changes in the screen occur frequently. In these situations, the
amount of data to be sent is greater and hence it arrives at the client with a greater delay. Even
without loss of video quality, there is a higher delay (worse perceived quality) that is measured
by the desynchronization between both streams and hence, a lower PSNR; Frame 99 in Fig 7
presents the lowest PSNR value. This is a result of the scene transition. Similar situations occur
for other user profiles when large changes in the screen are required (i.e., a large window
appears, the user performs a rapid scroll, or a new web page is rendered).
Fig 7. PSNR time series for video profile in Amazon WorkSpaces.
https://doi.org/10.1371/journal.pone.0207512.g007
Remote access protocols for Desktop-as-a-Service solutions
PLOS ONE | https://doi.org/10.1371/journal.pone.0207512 January 4, 2019 13 / 28

However, in this scenario without bandwidth limitations, image quality is, in general,
“Good” or “Excellent”. Even though there are differences between the source and destination
streams, there are no noticeable compression artefacts. The differences could be noticeable
through a heatmap, however not directly by the eye of a user.
We summarise the PSNR time series for each user profile using the first, second (the
median), and third quartiles. We display these values in Fig 8, with the maximum and mini-
mum values of PSNR in a boxplot [63] and their corresponding MOS values in the right verti-
cal axis. The office user profile (leftmost boxplot in Fig 8) obtained a first quartile greater than
40 dB, which means that more than 75% of the time the quality was considerably greater than
MOS 5 (“Excellent” quality). The video user profile (rightmost boxplot in Fig 8) presents a
higher variability, however it maintains “Excellent”quality for 75% of the time. Finally, the web
browsing profile achieved the poorest MOS, less than “3” (“Fair”) for more than 25% of the
time.
Surprisingly, the PSNR values were less in the web browsing profile compared to the video
profile. Moreover, the web browsing profile resulted in a higher data rate than the video pro-
file. The web browsing profile using images, animations, and advertisements was more
demanding in PCoIP DaaS than video streaming.
Long-range dependence in PCoIP traffic
Applications such as the web or variable bit rate video generate self-similar traffic. Therefore,
it was expected that remote desktop traffic would exhibit this property. We evaluated the pres-
ence of this property by estimating the Hurst parameter for the traffic arrival process. Many of
the proposed algorithms for the Hurst parameter estimation are based on the variance aggre-
gation plot, R/S (rescaled range) statistic [54], periodogram or decomposition of the random
process based on the wavelet transform [64], among others. In this paper, we use the variance
aggregation plot, similar to many previous works [54] [58].
Fig 9 displays the variance aggregation plots for PCoIP traffic and the three different user
profiles. In a pure (non-asymptotic) self-similar process, the plot in a logarithmic scale is a
straight line. The Hurst parameter is therefore estimated from the slope of this line. We use
least squares regression to compute the slope α for each data set. The resulting Hurst
Fig 8. Boxplot of PSNR for three user profiles in Amazon WorkSpaces.
https://doi.org/10.1371/journal.pone.0207512.g008
Remote access protocols for Desktop-as-a-Service solutions
PLOS ONE | https://doi.org/10.1371/journal.pone.0207512 January 4, 2019 14 / 28

parameter is computed asH = (1 + α/2). Table 3 presents the estimated values ofH and the
coefficient of determination in the regression (r2), measuring the quality of the fit.
The linear fit is acceptable for the office and web users, which indicate clear long-range
dependence (H> 0.5). For the video user, the scaling changes and is not as well fit by a strictly
self-similar process (FBM). It continues to provide an estimation of H greater than 0.5 for the
scales of interest and indicates that the model is sufficiently accurate.
We can model PCoIP traffic for the office and video profiles using an FBM process with the
Hurst parameter close to 0.75, and with parameter 0.85 for the web browsing profile. In com-
parison to a process with independent increments, a self-similar process presents a lower
decay of the variance in its marginal distribution with the aggregation level. From [65], we also
know that the queue length in a network link that receives a packet arrival process modelled by
an FBM strongly depends on H. Let L be the queue length, then the probability of queue occu-
pancy presents an asymptotic lower bound:
PðL > xÞ � e� cx2� 2Hð6Þ
Fig 9. Variance aggregation plot for PCoIP traffic.
https://doi.org/10.1371/journal.pone.0207512.g009
Table 3. Estimation of Hurst parameter for PCoIP traffic.
User profile Estimated H r2
Office 0.750 0.996
Video 0.760 0.829
Web browsing 0.846 0.981
https://doi.org/10.1371/journal.pone.0207512.t003
Remote access protocols for Desktop-as-a-Service solutions
PLOS ONE | https://doi.org/10.1371/journal.pone.0207512 January 4, 2019 15 / 28

where c is defined in Eq 7, ρ is the link utilisation factor, and m is the mean input traffic.
c ¼m2H� 1 1� r
r
� �2H
2a1 � HH
� �H
þH
1 � H
� �1� H" #2
ð7Þ
Compared to a traffic arrival process with short-range dependence, a self-similar arrival
process modelling the remote desktop traffic results in a slower decay in the tail of the survival
function of the queueing delay in the routers (Eq 6). Larger buffers or higher speed links are
required to obtain similar results of losses and delay and therefore provide a similar quality
owing to network transport.
Comparison of performance metrics for remote desktop protocols
In this section, we compare the PCoIP protocol and its implementation in Amazon Work-
Spaces to RDP, TeamViewer, VNC (RFB), and Citrix ICA protocols. We follow the same pro-
cedure used in the previous section and present the results for network bandwidth usage, self-
similarity, and QoE for each of the three user profiles.
Transfer rate
Fig 10 displays the downstream rate for each remote desktop system and each user profile.
We have used boxplots representing the minimum, maximum, and quartiles for the bitrate
obtained from each experiment. The leftmost plots in Fig 10 correspond to the results pre-
sented in Figs 2, 3 and 4 for the PCoIP case.
The results are consistent among the five remote desktop systems. The user profiles with
larger and more frequent screen changes require more link capacity (web and video profiles);
however, the rates vary substantially among the different systems. Attention must be addressed
to the logarithmic scale employed for the downstream rate in Fig 10, as small steps in the figure
represent large changes in link capacity requirements. For example, the median traffic rate for
the web browsing profile using TeamViewer is 100 Kb/s whereas using VNC it is close to 700
Kb/s. VNC and PCoIP present the highest bitrates. These RD systems transfer bitmaps from
the server to the client. In comparison, RDP and ICA transfer system graphics commands,
Fig 10. Comparison of downstream rate per user profile and remote desktop protocol.
https://doi.org/10.1371/journal.pone.0207512.g010
Remote access protocols for Desktop-as-a-Service solutions
PLOS ONE | https://doi.org/10.1371/journal.pone.0207512 January 4, 2019 16 / 28

which result in lower bandwidth requirements when direct video playback is not involved. In
these cases, when video is viewed, RDP and ICA can transfer the file for local playback at the
client. TeamViewer achieves one of the lowest rates, especially for the video user profile, how-
ever, as will be demonstrated later, this is a consequence of higher video compression, includ-
ing loss of video quality and reduced QoE
Table 4 displays the average transfer rates for the upstream direction. The rates are low
compared to the downstream rates, as was the case for PCoIP. VNC should be observed,
attaining an average upstream rate of 320 Kb/s in the video profile, which must be compared
to a median of 20 Mb/s downstream. A 20 Mb/s TCP flow in one direction requires a consider-
able amount of traffic in the opposite direction for TCP acknowledgements, hence this
upstream rate is not due to application level traffic in the upstream direction; rather, it is due
to transport layer control traffic.
Regarding packet sizes, Fig 11 displays the cumulative distribution function of downstream
packet sizes for all user profiles and each remote desktop protocol. The most notable aspect is
that the remote desktop protocols that use UDP as a transport protocol (PCoIP and Team-
Viewer) do not reach the maximum packet size that the path MTU allows. This could be
related to an interest in avoiding fragmentation in the event of traffic that must traverse VPNs
or tunnels between the client and server. For systems that use the TCP transport protocol
(RDP, ICA, and VNC), the application has no control over how data is packetized. TCP sends
packets of the maximum size allowed by the path MTU. Note also that VNC has a higher
Table 4. Average upstream rate per remote desktop protocol.
Protocol\Profile Office profile Web profile Video profile
PCoIP 32.18 Kb/s 45.48 Kb/s 83.46 Kb/s
RDP 14.10 Kb/s 32.74 Kb/s 149.01 Kb/s
ICA 13.51 Kb/s 40.12 Kb/s 171.63 Kb/s
TeamViewer 12.05 Kb/s 10.90 Kb/s 14.12 Kb/s
VNC 14.56 Kb/s 111.26 Kb/s 320.85 Kb/s
https://doi.org/10.1371/journal.pone.0207512.t004
Fig 11. Packet size cumulative distribution function for all remote desktop protocols.
https://doi.org/10.1371/journal.pone.0207512.g011
Remote access protocols for Desktop-as-a-Service solutions
PLOS ONE | https://doi.org/10.1371/journal.pone.0207512 January 4, 2019 17 / 28

percentage of large packets, which is consistent with the fact that it consumes more bandwidth
than the others.
Quality of experience
Fig 12 displays the PSNR and corresponding MOS value for each RD system and the three
user profiles. The leftmost part of the figure corresponds to the values presented in Fig 8 for
the PCoIP scenario. Values of PSNR above 37 dB correspond to the maximum MOS value of
“5” (“Excellent” quality).
TeamViewer consistently provided lower values of MOS than the other RD systems. This is
because of the lossy compression it applies. For the office user profile, the other RD systems
analysed offered excellent quality (MOS “5”) for at least 75% of the frames, whereas Team-
Viewer never achieved this quality and its median value was in MOS “3” (“Fair” or “Slightly
annoying”).
The web browsing user profile demonstrated the highest variability in quality for those pro-
tocols that send bitmaps from the server to the client (VNC, PCoIP, and TeamViewer). Team-
Viewer and VNC provided median MOS values of “2” and “3” for this profile, whereas PCoIP,
RDP, and ICA remained above MOS “5” at least 50% of the time.
For the video user profile, fast screen changes have an important influence on QoE because
of the additional delay they introduce. VNC and TeamViewer offered the lowest qualities
whereas PCoIP maintained an MOS greater than “4” more than 75% of the time, even though
they all employ bitmap transfers.
TeamViewer demonstrated a reduced MOS because it increases the compression degree
when there are rapid changes in the image. It prioritises a fast screen update at the client, at the
cost of a lower image quality. The comparison of the video feed at the server and the client in
these situations results in a reduced PSNR and hence, a lower MOS value.
VNC not only suffers delays due to a greater amount of data to transfer on fast screen
changes but also renders the screen as it receives the data for different sections. The result is
that a part of the screen could be displaying a previous video frame and the remainder display-
ing the new frame. The resulting PSNR of comparing the video feed at the server and the client
is seriously hampered in these situations, providing a reduced MOS value.
Fig 12. Comparison of PSNR per user profile and remote desktop protocol.
https://doi.org/10.1371/journal.pone.0207512.g012
Remote access protocols for Desktop-as-a-Service solutions
PLOS ONE | https://doi.org/10.1371/journal.pone.0207512 January 4, 2019 18 / 28

Self-similarity and link provisioning
Table 5 and Fig 13 display the Hurst parameter for the different remote desktop protocols and
user profiles (apart from PCoIP, which was presented in Table 3). In Table 5, they are sorted
by user profile; Fig 13 presents them grouped by protocol.
The office profile creates the traffic process with an H value closest to 0.5 or closest to inde-
pendent increments, except for PCoIP traffic (Table 3,H = 0.75). Conversely, the web user
Table 5. Estimation of Hurst parameter for different remote desktop protocols and user profiles.
Protocol User profile H r2
RDP Office 0.640 0.992
ICA Office 0.553 0.992
TeamViewer Office 0.693 0.918
VNC Office 0.689 0.975
RDP Web browsing 0.790 0.976
ICA Web browsing 0.781 0.972
TeamViewer Web browsing 0.946 0.870
VNC Web browsing 0.848 0.981
RDP Video 0.787 0.971
ICA Video 0.748 0.971
TeamViewer Video 0.733 0.979
VNC Video 0.801 0.929
https://doi.org/10.1371/journal.pone.0207512.t005
Fig 13. Values of H for different remote desktop protocols and user profiles.
https://doi.org/10.1371/journal.pone.0207512.g013
Remote access protocols for Desktop-as-a-Service solutions
PLOS ONE | https://doi.org/10.1371/journal.pone.0207512 January 4, 2019 19 / 28

profile creates the traffic with the greatest value of H or the strongest long-range dependence.
This consistent behaviour implies that the reason for the LRD is not related as much to the
characteristics of the remote desktop protocol as it is to the user actions. For any of these pro-
tocols, the web users are those who create the traffic with the strongest LRD and therefore, the
poorest behaviour in router queues. Although the video users present the highest average bit
rates (Fig 10), their traffic is less bursty than the remote desktop traffic for the web users, there-
fore link buffers require less over-provisioning for video users.
These results apply to the traffic from a single remote desktop user. In a scenario where all
the employees in a company are using remote desktop services, the Internet link must support
the multiplex of traffic from all these users. The amount of link capacity or the size of packet
buffers in the access router must be determined based on the aggregated traffic.
For a network link that aggregates the traffic from a large population of remote desktop
users, we can estimate the Hurst parameter for the aggregated traffic from the FBM model for
each user traffic process. We consider two different cases to evaluate the self-similarity in the
aggregated traffic. In the first scenario, the remote desktop users are modelled with the same
user profile (all are considered office users, video users, or web users). In the second scenario,
we consider a mixture of users from the three different profiles.
We computed the average traffic, variance, and Hurst parameter for every combination of
protocol and user profile. From these parameters, we can generate synthetic FBM traffic traces
using one of the existing FBM generation techniques. For this paper, we used the Random
Midpoint Displacement (RMD) method, a fast and efficient generation method adequate for
qualitative studies [66]. For every combination of remote desktop protocol and user profile,
we created 90 FBM traces. We multiplexed all the traces from the same protocol scenario and
user profile. The resulting traffic models the situation where a medium-sized company with
90 users simultaneously use cloud remote desktop services where all users are from the same
profile.
Table 6 displays the estimated Hurst value (using the variance aggregation plot method) for
each scenario. As expected, if all the users are from the same profile, the resulting processes
tend to the same value of H [67] [68]. Fig 14 compares the value of H for a single user and
aggregation of 90 independent users from the same profile and protocol. The reduction in H is
Table 6. Estimation of Hurst parameter for aggregation of 90 users.
Protocol User profile H r2
PCoIP Office 0.730 0.9996
PCoIP Web browsing 0.819 0.9998
PCoIP Video 0.732 0.9999
RDP Office 0.613 0.9997
RDP Web browsing 0.764 0.9997
RDP Video 0.764 0.9995
ICA Office 0.542 0.9998
ICA Web browsing 0.745 0.9977
ICA Video 0.733 0.9987
TeamViewer Office 0.674 0.9998
TeamViewer Web browsing 0.920 0.9995
TeamViewer Video 0.620 0.9993
VNC Office 0.649 0.9999
VNC Web browsing 0.779 0.9925
VNC Video 0.770 0.9995
https://doi.org/10.1371/journal.pone.0207512.t006
Remote access protocols for Desktop-as-a-Service solutions
PLOS ONE | https://doi.org/10.1371/journal.pone.0207512 January 4, 2019 20 / 28

minimal for every scenario. Of course, there is also a reduction in variance owing to the aggre-
gation process; however, as indicated in Eq 5, the reduction is less, the higher the value of H.
In the case of a mixture of processes with different values of H (different user profiles), it
has been demonstrated that the resulting process is dominated by the largest value of H in the
mix [58]. However, as this is an asymptotic property and each user profile presents different
bit rates and variabilities, it is not a simple task to predict the expected reduction in long-range
dependence depending on the mixture and number of users.
To compare to the previous homogeneous case, we again multiplexed 90 users for each pro-
tocol; 30 users from each of the users profiles. This means that, for example, we created 30
FBM traffic traces using the parameters from ICA office users and multiplexed them to 30
FBM traffic traces from ICA video users and 30 FBM traces from ICA web users. Table 7 dis-
plays the estimated value of H from the resulting traffic trace for each protocol.
The values of H in the multiplex are not always near the largest H in the mixed set; however,
they are always in the range of values in the mixture (see Fig 15). For example, for the ICA
Fig 14. Values of H comparing one user and multiplex of 90 users.
https://doi.org/10.1371/journal.pone.0207512.g014
Table 7. Estimation of Hurst parameter for mixture of 30 users from each profile.
Protocol H r2
PCoIP 0.755 0.9992
RDP 0.759 0.9992
ICA 0.642 0.9981
TeamViewer 0.836 0.9817
VNC 0.785 0.9997
https://doi.org/10.1371/journal.pone.0207512.t007
Remote access protocols for Desktop-as-a-Service solutions
PLOS ONE | https://doi.org/10.1371/journal.pone.0207512 January 4, 2019 21 / 28

protocol, the values for the office, video, and web profiles are 0.542, 0.733 and 0.745, respec-
tively; the traffic mix presents H approximately equal to 0.642, which is not as high as the value
of 0.745 for the web profile. For VNC traffic, the values of H in the mix are 0.649, 0.77 and
0.779; the resulting traffic process presents H approximately equal to 0.785, which is similar to
the largest value in the mix.
Quality of experience vs. traffic characteristics
The final evaluation considers the opposing metrics of bandwidth usage and QoE. Typically, a
higher quality requires greater bitrates; hence, the tradeoff of achieving the best quality with
the lowest bitrate is important.
Fig 16 displays the average PSNR and average downstream bitrate for each remote desktop
protocol and user profile. The downstream rate is in a logarithmic scale to accommodate the
wide range of values.
In the lower left corner, TeamViewer presents the lowest PSNR; however, it also consumes
the least amount of bandwidth. Other protocols requiring less than 1 Mb/s do not sustain this
rate for all user profiles. For example, RDP requires less than 1 Mb/s for the office and web
browsing user profiles, yet requires an average of 3 Mb/s for the video user.
TeamViewer simplifies link bandwidth dimensioning when measuring only average bit
rates. However, different user profiles present significant differences in the traffic long-range
dependence, which influence packet buffer dimensioning. TeamViewer is an extreme case of
this situation as it indicates a Hurst parameter as low as 0.693 for an office user and as high as
0.946 for a web user (Table 5). It does this at the expense of important losses on quality for
Fig 15. Comparison of values of Hurst parameter for each user profile and mixture of 30 users from each one.
https://doi.org/10.1371/journal.pone.0207512.g015
Remote access protocols for Desktop-as-a-Service solutions
PLOS ONE | https://doi.org/10.1371/journal.pone.0207512 January 4, 2019 22 / 28
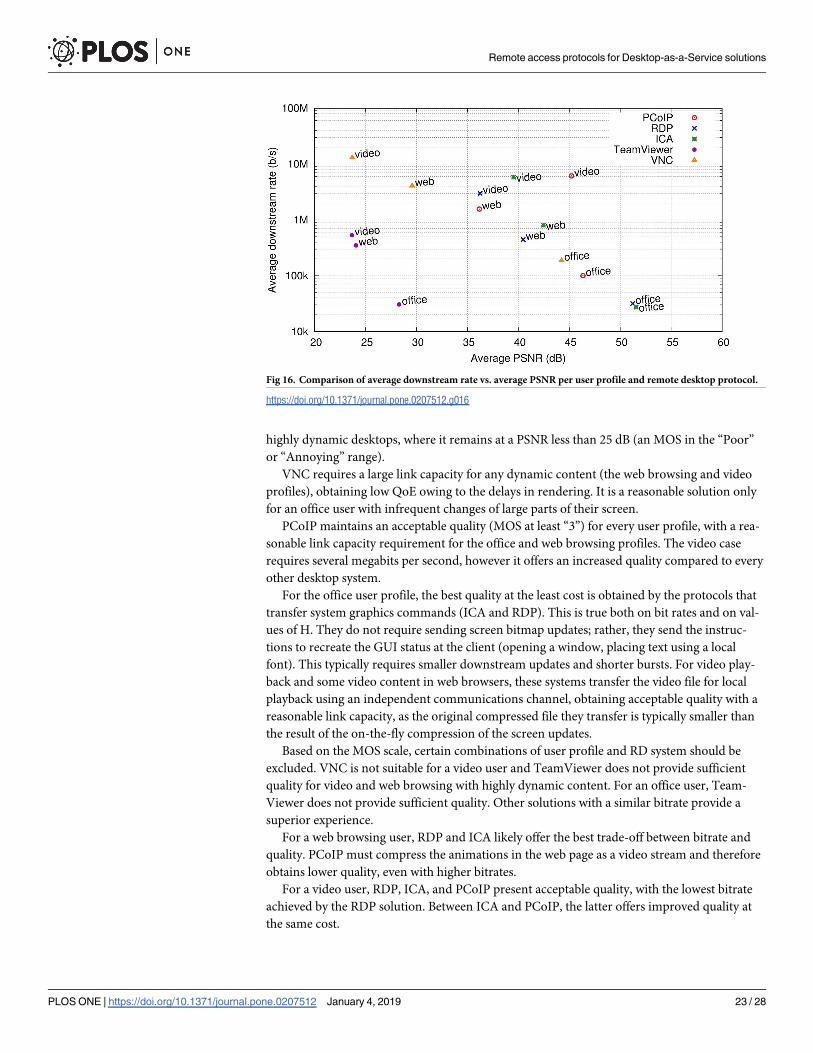
highly dynamic desktops, where it remains at a PSNR less than 25 dB (an MOS in the “Poor”
or “Annoying” range).
VNC requires a large link capacity for any dynamic content (the web browsing and video
profiles), obtaining low QoE owing to the delays in rendering. It is a reasonable solution only
for an office user with infrequent changes of large parts of their screen.
PCoIP maintains an acceptable quality (MOS at least “3”) for every user profile, with a rea-
sonable link capacity requirement for the office and web browsing profiles. The video case
requires several megabits per second, however it offers an increased quality compared to every
other desktop system.
For the office user profile, the best quality at the least cost is obtained by the protocols that
transfer system graphics commands (ICA and RDP). This is true both on bit rates and on val-
ues of H. They do not require sending screen bitmap updates; rather, they send the instruc-
tions to recreate the GUI status at the client (opening a window, placing text using a local
font). This typically requires smaller downstream updates and shorter bursts. For video play-
back and some video content in web browsers, these systems transfer the video file for local
playback using an independent communications channel, obtaining acceptable quality with a
reasonable link capacity, as the original compressed file they transfer is typically smaller than
the result of the on-the-fly compression of the screen updates.
Based on the MOS scale, certain combinations of user profile and RD system should be
excluded. VNC is not suitable for a video user and TeamViewer does not provide sufficient
quality for video and web browsing with highly dynamic content. For an office user, Team-
Viewer does not provide sufficient quality. Other solutions with a similar bitrate provide a
superior experience.
For a web browsing user, RDP and ICA likely offer the best trade-off between bitrate and
quality. PCoIP must compress the animations in the web page as a video stream and therefore
obtains lower quality, even with higher bitrates.
For a video user, RDP, ICA, and PCoIP present acceptable quality, with the lowest bitrate
achieved by the RDP solution. Between ICA and PCoIP, the latter offers improved quality at
the same cost.
Fig 16. Comparison of average downstream rate vs. average PSNR per user profile and remote desktop protocol.
https://doi.org/10.1371/journal.pone.0207512.g016
Remote access protocols for Desktop-as-a-Service solutions
PLOS ONE | https://doi.org/10.1371/journal.pone.0207512 January 4, 2019 23 / 28

Optimum link capacity cannot be determined based only on the average expected traffic.
The self-similar nature of remote desktop traffic is clear and it is not alleviated with reasonable
degrees of traffic multiplexing. For a mixture of users, the worst profile (the web profile) domi-
nates in the resulting traffic. Depending on the number of users and the number from each
profile in the traffic mix, the result will be closer to the behaviour of the strongest long-range
dependent traffic.
Recommendations for remote desktop protocol design
The most important suggestions that can be extracted to improve user experience in DaaS
solutions are:
• Protocols that transfer system graphics commands (ICA and RDP) are better suited to office
user profiles because functions such as the frequent opening and closing of system windows,
menu scrolling, and text inputs are not transferred as screen image updates through the net-
work. They avoid streaming the user screen as video, as they transmit system graphics com-
mands. This means lower traffic bit rates with high image quality, achieving low response
times, and therefore the best QoE.
• Protocols that transfer system graphics commands (ICA and RDP) also achieve acceptable
results in web browsing and video profiles because they use specific channels to transfer the
content (H.264 video, Adobe flash, audio, DirectX). Each content is coded according to its
nature and, if possible, is transmitted without further compression, using the original source
data that is already compressed and adapted to be streamed over the network (for example, a
YouTube video). RDP and ICA offer the best trade-off between bitrate and quality. However,
the client PCs must be more powerful (computationally speaking) because they must process
content from the specific channels, sometimes using complex codecs.
• Multiplexing hundreds of users with an office profile provides less long-range dependence
(lower Hurst parameter) for ICA and RDP, as they use system graphics commands instead
of streaming a video from the full screen as in other protocols. Even with the web and video
profiles, the resulting H value for multiplexed users is better than for the other protocols.
This means that the required bandwidth in the Internet link will increase smoothly with the
number of simultaneous users.
• In some protocols (PCoIP, VNC, TeamViewer), all content is streamed as screen bitmap
updates. Therefore, the differences among office, web, and video profiles are related to the
size and speed of the changes in the screen images. In this case, the web profile has, surpris-
ingly, the highest H value and larger link data rate requirements than the video profile for
the same MOS. This is because of the full screen updates required when scrolling a web page
or the embedded advertisements.
• Protocols can offer low bit rates using complex codecs with lossy compression (TeamViewer
is an example). However, they accomplish this at the expense of a reduced MOS and in some
situations, they result in a greater degree of self-similarity in the traffic. This makes link
capacity dimensioning more complex and packet buffers less effective to reduce losses, as the
traffic contains larger bursts.
Conclusions
We compared five of the most popular remote desktop protocols and offered models for their
traffic arrival based on self-similar processes. They were deployed in a public virtual cloud as a
Remote access protocols for Desktop-as-a-Service solutions
PLOS ONE | https://doi.org/10.1371/journal.pone.0207512 January 4, 2019 24 / 28

DaaS solution. The protocols were: PCoIP as used in the Amazon WorkSpaces, Microsoft
RDP, TeamViewer, VNC (RFB), and Citrix ICA. We evaluated the network transfer rate and
its relation to the quality experienced by the DaaS user. We compared three different user
behaviours based on productivity: an office software suite, web browsing to modern and
dynamic websites, and a video user accessing low and high quality video streams.
The QoE measurement was accomplished by comparing the desktop video stream at the
source (the server in the cloud) and the destination (the user client). An objective PSNR time
series was obtained from the comparison and from this, we produced subjective MOS values.
This evaluation considered not only image degradation due to lossy compression but also loss
of interactivity from an increased delay, as resulted in video stream desynchronization.
The results demonstrate that the Amazon WorkSpaces solution (based on PCoIP) presents
a reasonable quality for the three user profiles, although its network bandwidth usage for a
video user is considerably greater than the recommended values suggested by Amazon. We
confirmed that the recommended traffic rates of 300–1000 Kb/s are reasonable for the office
profile. However, for the web browsing and video profiles, we determined that sustained rates
up to 10 Mb/s are common. Moreover, the degree of self-similarity in network traffic is greater
for web users than for the other user profiles, including video consumers. A network adminis-
trator must consider this when dimensioning an access link for a population of Amazon
WorkSpaces users.
Protocols based on the transfer of graphics primitives (such as RDP and ICA) offer high
quality with a low traffic bit rate for a normal productivity desktop user. For multimedia play-
back, they include parallel channels for the transfer of video files instead of streaming an on-
the-fly compressed video extracted from the screen.
Solutions such as VNC and TeamViewer are less suited for a DaaS deployment and a better
fit for remote control of physical desktops during short tasks. TeamViewer primes a low net-
work bandwidth usage at the expense of the quality, hence it is an acceptable solution in
remote assistance scenarios where the interaction is short and high quality is not required.
VNC is the simplest system; hence, it offers minimal optimisation compared to the other ana-
lysed solutions. The result is high traffic bitrates and less than proportional quality as the com-
pression task introduces delays that degrade the interactivity.
Author Contributions
Conceptualization: Eduardo Magaña.
Data curation: Eduardo Magaña, Iris Sesma.
Formal analysis: Eduardo Magaña, Iris Sesma, Daniel Morato, Mikel Izal.
Funding acquisition: Eduardo Magaña, Mikel Izal.
Investigation: Eduardo Magaña, Iris Sesma, Daniel Morato, Mikel Izal.
Methodology: Eduardo Magaña.
Project administration: Mikel Izal.
Resources: Eduardo Magaña.
Software: Eduardo Magaña, Iris Sesma.
Supervision: Eduardo Magaña.
Validation: Eduardo Magaña, Daniel Morato, Mikel Izal.
Visualization: Eduardo Magaña.
Remote access protocols for Desktop-as-a-Service solutions
PLOS ONE | https://doi.org/10.1371/journal.pone.0207512 January 4, 2019 25 / 28
Writing – original draft: Eduardo Magaña, Daniel Morato.
Writing – review & editing: Eduardo Magaña, Daniel Morato, Mikel Izal.
References1. Kaur D, Bhathal GS. Thin Client Cloud Computing: An Overview. International Journal for Multi Disci-
plinary Engineering and Business Management. 2014; 2(1):8–10.
2. Kamp JV, Spruijt R. State of the VDI and SBC union 2015. Project Virtual Reality Check, LogIn consul-
tants. 2015 Mar.
3. Adamczyk B, Chydzinski A. Achieving High Resolution Timer Events in Virtualized Environment. PLoS
ONE. 2015; 10(7): e0130887. https://doi.org/10.1371/journal.pone.0130887 PMID: 26177366
4. Calyam P, Rajagopalan S, Seethatam S, Selvadhurai A, Salah K, Ramnath R. VDC-Analyst: Design
and verification of virtual desktop cloud resource allocations. Computer Networks. 2014 Aug; 68
(5):110–122. https://doi.org/10.1016/j.comnet.2014.02.022
5. Microsoft Express Route. [cited 2018 Nov 14] Available from: https://azure.microsoft.com/en-us/
services/expressroute/
6. Vankeirsbilck B, Verslype D, Staelens N, Simoens P, Develder C, Dhoedt B, et al. Automatic fine-
grained area detection for thin client systems. Journal of Network and Computer Applications. 2012; 35
(5):1620–1632. https://doi.org/10.1016/j.jnca.2012.03.007
7. Richardson T, Levine J. The Remote Framebuffer Protocol. RFC 6143. 2011 Mar.
8. Remote Desktop Protocol, architecture and features. Microsoft Developer Network. [cited 2018 Nov 14]
Available from: https://msdn.microsoft.com/en-us/library/aa383015(v=vs.85).aspx
9. TeamViewer. [cited 2018 Nov 14] Available from: https://www.teamviewer.com/en/company
10. Brothers R. Worldwide Clientless Remote Support Software Market Shares, 2014: Top 6 Market Share
Leaders. IDC Report #258599. 2015 Sep.
11. About Teradici. [cited 2018 Nov 14] Available from: http://www.teradici.com/about-us
12. VMware View 5 with PCoIP. Networks Optimization Guide. 2011. [cited 2018 Nov 14] Available from:
http://www.vmware.com/content/dam/digitalmarketing/vmware/en/pdf/whitepaper/view/vmware-view-
5-pcoip-network-optimization-guide-white-paper.pdf
13. Amazon WorkSpaces. [cited 2018 Nov 14] Available from: https://clients.amazonworkspaces.com/
14. Citrix VDI. [cited 2018 Nov 14] Available from: https://www.citrix.com
15. Detailed troubleshooting steps for remote desktop connection issues to Windows VMs in Azure. [cited
2018 Nov 14] Available from: https://azure.microsoft.com/en-us/documentation/articles/virtual-
machines-windows-detailed-troubleshoot-rdp/
16. PCoIP Connection Manager User Guide. [cited 2018 Nov 14] Available from: http://www.teradici.com/
web-help/Connecting_ZC_AWS_HTML5/TER1408002_Connecting_ZC_AWS.htm
17. Lai AM, Nieh J. On the performance of wide-area thin-client computing. ACM Transactions on Com-
puter Systems (TOCS). 2006; 24(2):175–209. https://doi.org/10.1145/1132026.1132029
18. Berryman A, Calyam P, Lai A, Honigford M. Vdbench: A benchmarking toolkit for thin-client based vir-
tual desktop environments. IEEE Second International Conference on Cloud Computing Technology
and Science (CloudCom). 2010:480–487.
19. Klaue J, Rathke B, Wolisz A. Evalvid: A framework for video transmission and quality evaluation. Inter-
national Conference on Modelling Techniques and Tools for Computer Performance Evaluation.
Springer. Berlin Heidelberg. 2003.
20. Suznjevic M, Skorin-Kapov L, Humar I. Statistical User Behavior Detection and QoE Evaluation for Thin
Client Services. Computer Science and Information Systems. 2015 Jul; 12(2):587–605. https://doi.org/
10.2298/CSIS140810018S
21. Casas P, Seufert M, Egger S, Schatz R. Quality of experience in remote virtual desktop services. In
2013 IFIP/IEEE International Symposium on Integrated Network Management. Ghent. 2013 May:
1352–1357.
22. CasasSchlosser D, Staehlt B, Binzenhofer A, Boder B. Improving the QoE of Citrix Thin Client Users.
Proceedings of the IEEE International Conference on Communications (ICC 2010). 2010 May.
23. Schlosser D, Binzenhofer A, Staehlt B. Performance comparison of windows-based thin-client architec-
tures. Telecommunication Networks and Applications Conference. 2007: 197–202.
Remote access protocols for Desktop-as-a-Service solutions
PLOS ONE | https://doi.org/10.1371/journal.pone.0207512 January 4, 2019 26 / 28

24. Makarov M, Calyam P, Sukhov A, Samykin V. Time-based criteria for performance comparison of
resource intensive user tasks in virtual desktops. International Conference on Computing, Networking
and Communications (ICNC). 2014.
25. Kouril J, Lambertova P. Performance analysis and comparison of virtualization protocols, RDP and
PCoIP. Proceedings of the 14th WSEAS international conference on Computers. 2010:782–787.
26. Connecting to Your Windows Instance Using RDP. Amazon Web Services Documentation. [cited 2018
Nov 14] Available from: http://docs.aws.amazon.com/AWSEC2/latest/WindowsGuide/connecting_to_
windows_instance.html
27. VMware choosing a display protocol: Microsoft RDP. [cited 2018 Nov 14] Available from: https://pubs.
vmware.com/view-50/index.jsp?topic=%2Fcom.vmware.view.planning.doc%2FGUID-02D75182-
CAAC-43ED-8119-539E0841EA1F.html
28. Gundarev D. Citrix Internals: ICA Connectivity. April 2014. BriForum, London. 2014.
29. Desai N. Introducing UDP transport in HDX. September 2011. [cited 2018 Nov 14] Available from:
https://www.citrix.com/blogs/2011/09/07/introducing-udp-transport-in-hdx/
30. Citrix ICA Virtual Channels Overview. June 2016. [cited 2018 Nov 14] Available from: http://support.
citrix.com/article/CTX116890
31. Golebiowski A. Citrix Multistream ICA explained. December 2013. [cited 2018 Nov 14] Available from:
http://blog.citrix24.com/citrix-multistream-ica-explained/
32. RealVNC. [cited 2018 Nov 14] Available from: https://www.realvnc.com/products/vnc/
33. TightVNC tool. [cited 2018 Nov 14] Available from: http://www.tightvnc.com/
34. UltraVNC tool. [cited 2018 Nov 14] Available from: http://www.uvnc.com/
35. A Brief Introduction to TurboVNC. [cited 2018 Nov 14] Available from: http://www.turbovnc.org/About/
Introduction
36. Vankeirsbilck B, Simoens P, De Turck F, Demeester P, Dhoedt B. Network latency hiding in thin client
systems through server-centric speculative display updating. Journal of Network and Computer Appli-
cations. 2014; 41:228–239. https://doi.org/10.1016/j.jnca.2013.12.003
37. Posey B. Top three Windows 8 RemoteFX enhancements http://searchvirtualdesktop.techtarget.com/
tip/Top-three-Windows-8-RemoteFX-enhancements
38. TeamViewer GmbH. TeamViewer Security statement. May 2017. [cited 2018 Nov 14] Available from:
https://download.teamviewer.com/docs/en/TeamViewer-Security-Statement-en.pdf
39. Madden B. The Layer 4 protocols behind PCoIP and HDX: Which is better for VDI?. TechTarget. Janu-
ary 2011. [cited 2018 Nov 14] Available from: http://searchvirtualdesktop.techtarget.com/feature/The-
Layer-4-protocols-behind-PCoIP-and-HDX-which-is-better-for-VDI
40. Casas P, Schatz R. Quality of experience in cloud services: Survey and measurements. Computer Net-
works. 2015; 68:149–165. https://doi.org/10.1016/j.comnet.2014.01.008
41. Nieh J, Yang SJ, Novik N. Measuring thin-client performance using slow-motion benchmarking. ACM
Transactions on Computer Systems. 2003 Feb; 21(1):87–115. https://doi.org/10.1145/592637.592640
42. JitBit, macro recorder tool. [cited 2018 Nov 14] Available from: https://www.jitbit.com/macro-recorder
43. tcpdump, network sniffer tool. [cited 2018 Nov 14] Available from: http://www.tcpdump.org/
44. tcpstat, traffic network analysis tool. [cited 2018 Nov 14] Available from: https://www.frenchfries.net/
paul/tcpstat/
45. Niu W, Li G, Tong E, Yang X, Chang L, Shi Z, et al. Interaction relationships of caches in agent-based
HD video surveillance: Discovery and utilization. Journal of Network and Computer Applications. 2014;
37:155–169. https://doi.org/10.1016/j.jnca.2013.01.008
46. Afzal MK, Kim BS, Kim SW. Efficient and Reliable MPEG-4 Multicast MAC Protocol for Wireless Net-
works. IEEE Transactions on Vehicular Technology. 2015 Mar; 64(3):1026–1035. https://doi.org/10.
1109/TVT.2014.2327755
47. Badicam, screen recorder tool. [cited 2018 Nov 14] Available from: https://www.bandicam.com/
48. Habib A, Chuang J. Service differentiated peer selection: an incentive mechanism for peer-to-peer
media streaming. IEEE Transactions on Multimedia. 2006; 8(3):610–621. https://doi.org/10.1109/TMM.
2006.870724
49. Khan MA, Hamidou T, Athanasios VV. Game dynamics and cost of learning in heterogeneous 4G net-
works. IEEE Journal on Selected Areas in Communications. 2012; 30(1):198–213. https://doi.org/10.
1109/JSAC.2012.120118
50. Palopoli L, Fontanelli D, Abeni L, Frias BV. An Analytical Solution for Probabilistic Guarantees of Reser-
vation Based Soft Real-Time Systems. IEEE Transactions on Parallel and Distributed Systems. 2016;
27(3):640–653. https://doi.org/10.1109/TPDS.2015.2416732
Remote access protocols for Desktop-as-a-Service solutions
PLOS ONE | https://doi.org/10.1371/journal.pone.0207512 January 4, 2019 27 / 28
51. Leland W.E, Taqqu M.S, Willinger W, Wilson D.V. On the Self-Similar Nature of Ethernet Traffic
(Extended version). IEEE / ACM Transactions on Networking. 1994; 2(1):1–15. https://doi.org/10.1109/
90.282603
52. Paxson V, Floyd S. Wide Area Traffic: The Failure of Poisson Modeling. IEEE/ACM Transactions on
Networking. 1995; 3(3):226–244. https://doi.org/10.1109/90.392383
53. Fontugne R, Abry P, Fukuda K, Veitch D, et al. Scaling in Internet Traffic: A 14 Year and 3 Day Longitu-
dinal Study, With Multiscale Analyses and Random Projections. IEEE/ACM Transactions on Network-
ing. 2017; 25(4):2152–2165. https://doi.org/10.1109/TNET.2017.2675450
54. Crovella M, Bestavros A. Self-Similarity in World Wide Web traffic: evidence and possible causes.
IEEE/ ACM Transactions on Networking. 1997; 5(6):835–846. https://doi.org/10.1109/90.650143
55. Garrett M.W, Willinger W. Analysis, Modeling and Generation of Self-Similar VBR Video Traffic. Pro-
ceedings of SIGCOMM. 1994:269–280.
56. Liangxiu H, Zhiwei C, Chunbo C, Chuanshan G. A new multifractal network traffic model. Chaos, Soli-
tons and Fractals. 2002; 13(7):1507–1513. https://doi.org/10.1016/S0960-0779(01)00159-X
57. Atzori L, Aste N, Isola M. Estimation of multifractal parameters in traffic measurement: an accuracy-
based real-time approach. Proceeding of IEEE International Conference on Communications (ICC).
2005;1:21–25.
58. Erramilli A, Narayan O, Willinger W. Experimental Queueing Analysis with Long-Range Dependent
Packet Traffic. IEEE/ACM Transactions on Networking. 1996; 4(2):209–223. https://doi.org/10.1109/
90.491008
59. Xia Z, Lu S, Tang J. Note on Studying Change Point of LRD Traffic Based on Li’s Detection of DDoS
Flood Attacking. Mathematical Problems in Engineering. 2010, art. id 962435.
60. Ren Y, Jin D, Zheng D, Liu L, Wei X. An Analytical Model of Data Plane Performance Subject to Priori-
tized Service. Proceedings of IEEE Trustcom/BigDataSE/ISPA. 2016: 1537–1542.
61. Izal M, Aracil J. On the influence of self similarity on Optical Burst Switching traffic. Proceedings of Glo-
becom. 2002;3: 2308–2312.
62. Troubleshooting Amazon WorkSpaces Client Issues. [cited 2018 Nov 14] Available from: http://docs.
aws.amazon.com/workspaces/latest/adminguide/client_troubleshooting.html#latency_warning
63. Hubert M, Vandervieren E. An adjusted boxplot for skewed distributions. Computational Statistics and
Data Analysis. 2008; 52(12):5186–5201. https://doi.org/10.1016/j.csda.2007.11.008
64. Abry P, Flandrin P, Taqqu M.S, Veitch D. Wavelets for the Analysis, Estimation, and Synthesis of Scal-
ing Data. Chapter 2 in Self-Similar Network Traffic and Performance Evaluation, Editors Park Kihong
and Willinger Walter. 2002.
65. Norros I. On the use of Fractional Brownian Motion in the theory of connectionless networks. IEEE Jour-
nal on Selected Areas in Communications 1995; 13(6):953–962. https://doi.org/10.1109/49.400651
66. Lau W, Erramilli A, Wang J.L, Willinger W. Self-similar traffic generation: the random midpoint displace-
ment algorithm and its properties. Proceedings of International Conference on Communications (ICC).
1995;1:466–472.
67. Norros I. A storage model with self-similar input. Queueing Systems. 2004; 16(3-4):387–396. https://
doi.org/10.1007/BF01158964
68. Yan Y. Statistical Multiplexing of Homogeneous Fractional Brownian Streams. Queueing Systems.
2004; 47(4):379–388. https://doi.org/10.1023/B:QUES.0000036398.96119.9b
Remote access protocols for Desktop-as-a-Service solutions
PLOS ONE | https://doi.org/10.1371/journal.pone.0207512 January 4, 2019 28 / 28
![[MS-RDPBCGR-Diff]: Remote Desktop Protocol: Basic ... · Remote Desktop Protocol: Basic Connectivity and Graphics ... Remote Desktop Protocol: Basic Connectivity and Graphics](https://img.dokumen.tips/doc/110x75/5b01eafa7f8b9ab9598d0cac/ms-rdpbcgr-diff-remote-desktop-protocol-basic-desktop-protocol-basic-connectivity.jpg)


![winprotocoldoc.blob.core.windows.netMS-R… · Web view[MS-RDSOD]: Remote Desktop Services Protocols Overview. Intellectual Property Rights Notice for Open Specifications Documentation](https://img.dokumen.tips/doc/110x75/5f52282310cbc7190125a87b/ms-r-web-view-ms-rdsod-remote-desktop-services-protocols-overview-intellectual.jpg)


![[MS-RDSOD]: Remote Desktop Services Protocols Overview...RDPEMT], [MS-RDPEECO], [MS-RDPEVOR], [MS-RDPEI], and [MS-RDPEDISP]. Using the Remote Using the Remote Desktop protocols, a](https://img.dokumen.tips/doc/110x75/610462fe17458d05996f0ce0/ms-rdsod-remote-desktop-services-protocols-overview-rdpemt-ms-rdpeeco.jpg)


