Embed Size (px)
Citation preview

Engineering Geology 141-142 (2012) 84–91
Contents lists available at SciVerse ScienceDirect
Engineering Geology
j ourna l homepage: www.e lsev ie r .com/ locate /enggeo
Reliability assessment of CPTU-based pile capacity predictions in soft clay deposits
Guojun Cai a, Songyu Liu a,⁎, Anand J. Puppala b
a Institute of Geotechnical Engineering, Southeast University, Nanjing, Jiangsu 210096, Chinab Department of Civil Engineering, The University of Texas at Arlington, Arlington, Texas 76019, USA
⁎ Corresponding author. Tel./fax: +86 25 83795086.E-mail addresses: [email protected] (G. Cai), liusy@
[email protected] (A.J. Puppala).
0013-7952/$ – see front matter © 2012 Elsevier B.V. Alldoi:10.1016/j.enggeo.2012.05.006
a b s t r a c t
a r t i c l e i n f oArticle history:Received 30 September 2011Received in revised form 14 March 2012Accepted 9 May 2012Available online 16 May 2012
Keywords:Pile capacityPiezoconeClayPore pressureReliability analysis
This paper focuses on the piezocone (CPTU) test results and the related interpretation procedures to predictultimate pile load capacities of driven and jacked piles for the Jiangsu soft soil deposits in China. The pilefoundation data including pile load tests on twenty six piles from several field sites are compiled and pres-ented. A comparison was made to explain the advantages and fallacies of various CPT based interpretationmethods. A modified CPTU-based method has been proposed, which was used to predict the ultimate capac-ity from effective cone tip resistance and excess pore water pressure. Comparison of the calculated pile capac-ities to the measured pile capacities showed that the modified CPTU method's predictions showed a betteragreement with the ultimate load capacities determined from static loading tests. Also, there was less scatterin this method's predictions than other CPTU methods for deep foundations of soft clay deposits, indicating ahigher reliability in the proposed methodology.
© 2012 Elsevier B.V. All rights reserved.
1. Introduction
The estimation of the pile bearing capacity utilizing cone penetra-tion test (CPT) is one of the earliest direct applications of CPT data. Infact, the CPT was developed in the Netherlands over 70 years ago forestimation of static axial pile capacity (Delft Laboratory of SoilMechanics (Delft), 1936). Over the years, a number of empiricalmethods have been developed to estimate the base and shaft capacityof piles utilizing tip resistance (qc) values. These methods includeSchemertmann method (Schmertmann, 1978), European or Dutchmethod (De Ruiter and Beringen, 1979), LCPC or French method(Bustamante and Gianeselli, 1982), Tumay and Fakhroo method(Tumay and Fakhroo, 1982) and Meyerhof method (Meyerhof,1983). All these empirical designmethods rely on calibration with da-tabase of static load tests, and employ a direct relationship betweenpile base resistance (qp) and the average cone tip resistance in the vi-cinity of the pile base (qc,ave).
The piezocone penetration test (CPTU) originates from the CPTmethod, with an additional capability of measuring pore water pres-sures at various locations on a cone penetrometer (Lunne et al.,1997). The advent of the CPTU has provided the means for an im-proved interpretation method by accounting for cone tip resistancecorrections due to pore water pressure developments near the cone.A few of these new methods based on CPTU measurements includeAlmeida et al. (1996) and Eslami and Fellenius (1997), which utilize
seu.edu.cn (S. Liu),
rights reserved.
the net corrected cone resistance, qnet, and effective cone resistance,qe, respectively.
With increased demand for driven or jacked piles in both onshoreand offshore projects, a few of the above pile capacity interpretationmethods have been assessed using pile load tests (Briaud andTucker, 1988; Robertson et al., 1988; Sharp et al., 1988; Tand andFundgard, 1989; Almeida et al., 1996; Eslami and Fellenius, 1997;Abu-Farsakh et al., 1999; Rollins et al., 1999; Brown, 2001; Puppalaet al., 2002; Abu-Farsakh and Titi, 2004; Schneider et al., 2008; Xuet al., 2008; Cai et al., 2009, 2011).
A continued work on the existing pile load test database wasattempted here to extend further evaluation of analyzing ultimateload capacities of single piles utilizing the digital CPTU tests. Also, themethod was extended to interpret capacities of jacked piles, whichare often used to support multistory structures in China. Hence, thispapermainly focuses on the piezocone test results and the related inter-pretation procedures aswell as analyses to predict ultimate pile load ca-pacities of driven and jacked piles for the Jiangsu soft clay deposits.
Based on the understanding from this interpretation analysis, anattempt is made to introduce a new CPTU-based interpretation meth-od to predict the ultimate capacity using effective cone tip resistanceand excess pore water pressure. Evaluation of this method along withthe existing interpretation methods for the better prediction of ulti-mate load capacities of pile foundations was attempted and presentedin this paper. In the case of the proposed method, new correlationswere introduced to further improve the prediction abilities. In addi-tion, reliability analyses based on ultimate limit state (ULS) and ser-viceability limit state (SLS) criteria, and system reliability criteriacombining both ULS and SLS criteria were conducted to determinethe reliability indices (β) for different design methods.
85G. Cai et al. / Engineering Geology 141-142 (2012) 84–91
2. Current CPTU interpretation methods
The ultimate axial pile capacity (Qu) of a deep pile foundation iscomposed of the end‐bearing capacity (Qb) and the shaft friction ca-pacity (Qs) of the pile. The end‐bearing Qb is calculated as the productbetween the pile base area, Ap and the unit end‐bearing capacity qp.The friction capacity, Qs is the product between the outer pile shaftarea, As, and the unit skin friction fp. The general equation describedin the literature is given by the following:
Qu ¼ Qb þ Qs ¼ qpAp þXni¼1
f piAsi ð1Þ
Where qp is unit end‐bearing capacity; Ap is cross-section area ofthe pile tip; fpi is average unit skin friction of the soil layer i; Asi ispile shaft area interfacing with layer i; and n is number of soil layersalong the pile shaft. The allowable or design pile load, Qall is thengiven by the total ultimate axial capacity divided by a factor of safety.Sometimes separate factors of safety values are applied to Qb and Qs,respectively.
Approaches for calculating the pile capacity from CPT/CPTU datacan be grouped into both direct and indirect methods. In the caseof direct methods, the unit end‐bearing capacity of the pile (qp) isevaluated from the cone tip resistance (qc), and the unit skin fric-tion of the pile fp is evaluated from either the sleeve friction (fs)profile or the qc profile. In the indirect methods, the cone testdata (qc and fs) are first used to evaluate the soil strength parame-ters such as undrained shear strength (Su) and angle of internalfriction (φ). These parameters are then used to evaluate the unitend‐bearing capacity of the pile (qp) and the unit skin friction ofthe pile (fp) using bearing capacity models and semi-empirical/theoretical methods.
Direct methods offer several advantages including simple in ap-proach, provide quick assessments, eliminate the need for soilsampling and laboratory testing tasks. Direct methods are general-ly developed by using analytical and empirical models on the realcase studies of pile load tests. Direct methods are hence consid-ered in the present research evaluations. Several pile capacity in-terpretation methods are available in the literature and asummary of them can be found in Mayne and Zavala (2004).With the development of the CPTU, three methods were usedhere to predict pile capacity since these methods have accountedfor the pore water pressure measurements. The measurements ofpore water pressures for soft clays are critical for better assess-ments of this material behavior. A brief overview of the three cur-rent methods and their prediction approaches are presented in thefollowing sections.
2.1. Almeida et al. (1996) method
Almeida et al. (1996) reviewed test results from 43 pile loadtests on driven and jacked steel piles at eight clay sites using CPTor CPTU data. The sites varied from soft to hard clays and thepiles from 0.102 m to 0.812 m in diameter. Most of the tests werecarried out in tension to evaluate the side friction component.The pile weight was ignored and was negligible compared to thetotal load. Most of the piles had a length to diameter ratio (L/D)of from 27 to 66. A method to evaluate the axial capacity of pileshas been developed in which the pile unit skin friction and theunit end‐bearing resistance are computed from the net correctedcone resistance, qnet:
f p ¼ qt−σv0ð Þ=k1 ¼ qnet=k1 ð2Þ
qp ¼ qt−σv0ð Þ=k2 ¼ qnet=k2 ð3Þ
where k1 and k2 are constants. The average relationship can beexpressed as:
k1 ¼ 12þ 14:9 log qt−σv0ð Þ=σ ′v0
� �ð4Þ
The recommended value of k2 is as follows:
k2 ¼ Nkt=9 ð5Þ
where Nkt is the cone factor for undrained shear strength and variesfrom 10 to 30. Few test results were available to fully evaluate thisk2 relationship. Almeida et al. (1996) recommend that the above rela-tionship should be used to estimate the side friction of driven orjacked steel pipe piles in clay.
2.2. Eslami and Fellenius (1997) method
Eslami and Fellenius (1997) presented and compared six methodsto determine axial pile capacity directly from both CPT and CPTU data.The six methods were applied to 102 case histories combining CPTUdata and capacities obtained in static loading tests in compressionand tension. The pile capacities range from 80 to 8000 kN. The soilprofiles range from soft to stiff clay, medium to dense sand, and mix-tures of clay, silt, and sand. The pile embedment lengths range from 5to 67 m and the pile diameters range from 200 to 900 mm. A new di-rect CPTU method, that considers pore water pressure and applies anunfiltered geometric average of cone resistance, was developed andthis method was referred to as Eslami and Fellenius (1997) method.The relationship is given as:
qp ¼ CtqEg ð6Þ
where Ct is the toe correlation coefficient; and qEg is the geometric av-erage of the cone point resistance over the influence zone after cor-rection for pore pressure on shoulder and adjustment to effectivestress. Current literature indicates that the toe correlation coefficientis equal to unity.
The pile unit shaft resistance is correlated to the average effectivecone point resistance with a modification according to soil type.
f p ¼ CsqE ð7Þ
where qE is the cone point resistance after correction for porepressure on cone shoulder and adjustment to effective stress, Cs isthe shaft correlation coefficient.
2.3. Takesue et al. (1998) method
In the CPTU method of Takesue et al. (1998), the unit side friction(fp) of the pile is estimated from the measured cone sleeve friction fsthat is scaled up or down depending upon the measured excess porepressures during penetration (Δu). In clays, the unit end‐bearing re-sistance can be obtained directly from the effective cone tip resistance(Eslami and Fellenius, 1997). Alternatively, Powell et al. (2001) rec-ommend unit end-bearing in terms of net cone resistance, with qpon the order of one-half to one-third (qt−σvo). In sands, the full mo-bilization of bearing capacity beneath the base will not be realized be-cause of the very large displacements required. Therefore only afraction of the available resistance will be available. A recent casestudy involving an axial drilled shaft for the Georgia DOT showedthat the Takesue et al. (1998) method was useful in obtaining axialside shear in Piedmont residual soils (Mayne and Schneider, 2001).

86 G. Cai et al. / Engineering Geology 141-142 (2012) 84–91
2.4. Comments on the current methods
The above mentioned CPTU interpretation methods were devel-oped a decade ago, therefore, their calibration approaches have notmade use of the accurate measurements currently available withthe new and modern piezocone penetrometers. Also, these CPTUmethods are locally developed and hence they still need to be evalu-ated and addressed for interpreting of pile capacities for other soilconditions elsewhere.
In the case of Eslami and Fellenius (1997) method, the soil profilegoverning the pile capacity coefficients rely on the information fromconventional boring and soil sampling, and laboratory testing. Also,some of thesemethods disregard the development of excess pore pres-sures, dilatancy effects, and effective stresses. Effective stress governsthe long-term pile capacity behavior; therefore, the CPTU methodsshould use effective stress values to evaluate the pile capacity.
3. New methodology
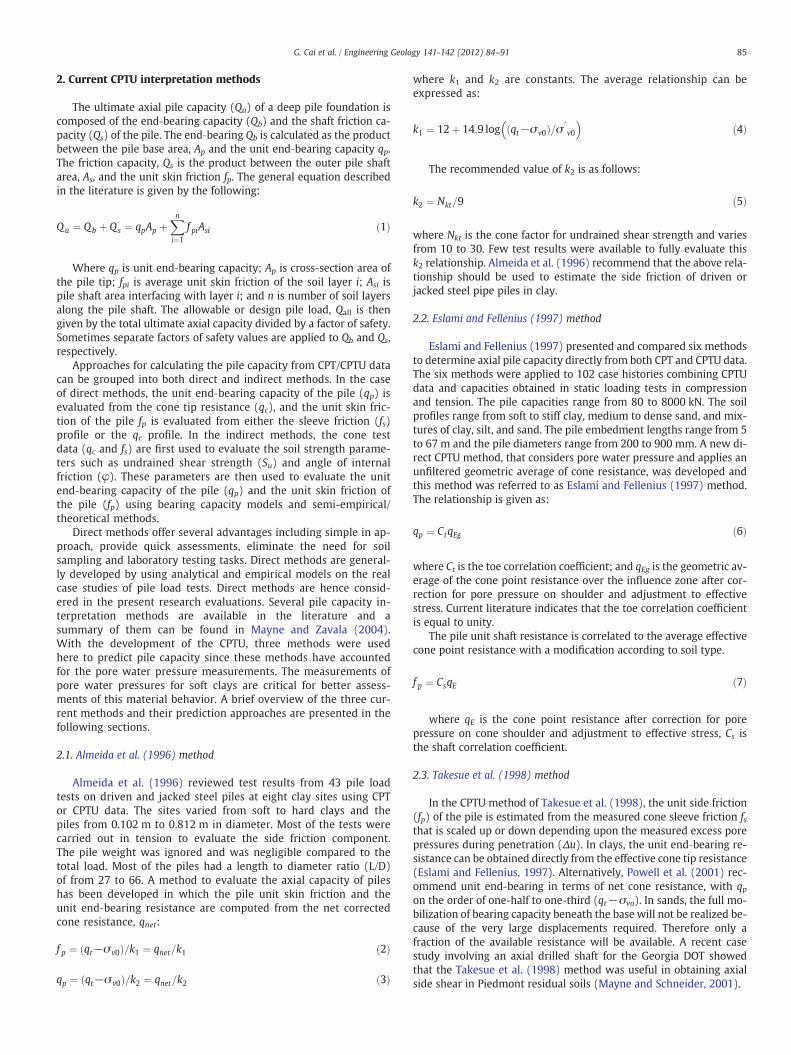
Three types of deep foundations, pre-stressed concrete thin-wallcaisson (PTC), cement fly-ash grave pile (CFG) and pre-stressed
Fig. 1. Three pile types: (a) pre-stressed concrete thin-wall caisson (PTC); (b) cementfly-ash grave pile (CFG); (c) pre-stressed concrete high-strength caisson (PHC).
concrete high-strength caisson (PHC) piles were used in Jiangsu prov-ince for supporting bridge and embankments projects. Among thethree type piles, the PTC and CFG piles were driven into clayey soilswhile the PHC piles were driven into layered silty sand and claysoils. The photos of all three piles are presented in Fig. 1. All the inves-tigated piles in this study were failed under loading before reachingthe maximum load. The pile ultimate capacity was determined fromthe load–settlement curve measured at the pile head using the But-ler–Hoy tangent method. In Fig. 2, the load–displacement curve forthe compression on PHC pile at Changzhou site along with the ulti-mate pile load capacity.
A new piezocone based methodology to predict pile capacity is in-troduced here which primarily uses the corrected cone tip resistanceby for the effects of pore pressures measured during cone penetra-tion, i. e. using qe=qt−u2. The unit toe or tip resistance, qp, is deter-mined from the effective cone resistance using the followingequation:
qp ¼ Cqqe ð8Þ
where Cq is the constant for pile unit tip resistance. The Cq factor issimilar to the bearing capacity factor, Nc, and empirical cone factorNke. The unit side resistance (fp) of the pile can be estimated fromthe measured friction sleeve, fs, and excess pore water pressure Δu2.From Fig. 3, the correlations are as follows:
For Δu2b200 kPa : f p ¼ Δu2 þ 324250
� �f s R2 ¼ 0:91
� �ð9Þ
For 200bΔu2b1000 kPa : f p ¼ Δu2 þ 100125
� �f s R2 ¼ 0:82
� �ð10Þ
where Δu=u2−u0.
4. Reliability analysis
In general, pile foundations are designed so that the probability ofunserviceable behavior is small. A pile foundation is considered to besatisfactory if the applied load is lower than its ultimate capacity andthe settlement of the pile does not exceed the serviceable limit. Theultimate pile capacities for the same pile by using different methodsshow certain variation related to its reliability. Consequently, the
0 1000 2000 3000 4000 5000
40
35
30
25
20
15
10
5
0
Settl
emen
t (m
m)
Measured (Max.3600kN)
Load (kN)
1kN
0.14mm
Fig. 2. Interpretation of the load–settlement curve to determine the measured pile ca-pacity (Qm) by using Butler–Hoy method (after Abu-Farsakh et al., 1999).

-200 0 200 400 600 800 10000
2
4
6
8
10Pi
le-C
PTU
fri
ctio
nrat
io, f
p/fs
Marine clay
Clay
Silty clay
Silty sand
R2=0.82
(ufp
Excess pore pressure, Δu2 (kPa)
R2=0.91
/fs)=0.008(Δu2)+0.79
( /fs)=0.004(Δu2)+1.30 fp
Fig. 3. Relationship between fp/fs and excess pore pressure based on the CPTU data.
87G. Cai et al. / Engineering Geology 141-142 (2012) 84–91
reliability index (β) value associated with different predictionmethods should reflect its accuracy in predicting the ultimate bearingcapacity of piles. In this research, the reliability index (β) are deter-mined for the proposed design method and three current CPTUmethods considering three failure criteria.
4.1. Ultimate limit state
A general performance function for the ultimate limit state can beexpressed as
Z ¼ R−Q ¼ 0 ð11Þ
Where Z is a performance function and R and Q are resistance andload effects factors, respectively. Both R and Q are considered to berandom variables that can be described by their respective probabilitydensity functions. As long as R is greater than Q, there exists safety forthe limit state under consideration (Zhang et al., 2005). When the ap-plied load exceeds the resistance, reliability can be expressed usingthe safety margin, M=R−Q, and the probability of failure Pf can becalculated by
Pf 1 ¼ P Q≥Rð Þ ¼ P M≤0ð Þ ð12Þ
The safety of the pile foundation is represented by a reliabilityindex β, which is the ratio of the mean of M to the standard deviationof M. The probability of failure is uniquely related to β as
Pf 1 ¼ Φ −βULSð Þ ð13Þ
where Φ() is the standard normal cumulative function. The followingbasic equation is recommended to represent limit states design byAashto (1998):
ϕRn≥∑ηγiQ i ð14Þ
where φ is resistance factor; Rn is calculate (nominal) resistance; η isfactor to account for effects of ductility, redundancy, and operationalimportance (the value of η usually is 1.00); Qi is nominal load effect;and γi is load factor.
Consider the load combination of dead load and live load, the per-formance limit equation is as follows (Zhang et al., 2001):
ϕRn ¼ γDQD þ γLQL ð15Þ
where QD and QL are dead load and live load, respectively, and γD andγL are the load factors for dead load and live load, respectively.
If both resistance and load effects are log‐normal distribution and theonly load effects to be considered are dead and live loads, the reliabilityindex associated with the linear performance function can be calculatedusing the mean value first-order, second moment method (MVFOSM)(Whitman, 1984; Barker et al., 1991; Becker, 1996; Withiam et al., 1997;Zhang et al., 2005; Abu-Farsakh and Titi, 2007; Yoon et al., 2008)
βULS ¼ln
λRFSQDQL
þ1
� �λQD
QDQL
þλQL
ffiffiffiffiffiffiffiffiffiffiffiffiffiffiffiffiffiffiffiffiffiffiffiffiffiffi1þCOV2
QDþCOV2QL
1þCOV2R
r0@
1A
ffiffiffiffiffiffiffiffiffiffiffiffiffiffiffiffiffiffiffiffiffiffiffiffiffiffiffiffiffiffiffiffiffiffiffiffiffiffiffiffiffiffiffiffiffiffiffiffiffiffiffiffiffiffiffiffiffiffiffiffiffiffiffiffiffiffiffiffiffiffiffiffiffiffiffiffiffiffiffiffiffiln 1þ COV2
R
� �1þ COV2
QD þ COV2QL
� �h ir ð16Þ
where QD and QL are nominal values of dead and live loads, respectively;λR, λQD, and λQL are bias factors for resistance, dead load, and live load, re-spectively; COVR, COVQD, and COVQL are coefficients of variation for resis-tance, dead load, and live load, respectively; and FS are factor of safety inthe traditional allowable stress design (ASD).
For comparison, the following values of factors and COVs for loadeffects are adopted in all reliability analysis (Yoon et al., 2008):
γD ¼ 1:25 λQD ¼ 1:08 COVQD ¼ 0:13γL ¼ 1:75 λQL ¼ 1:15 COVQL ¼ 0:18
TheQD/QL is the ratio of dead load to live load, which is a function of abridge's span length. Investigations by Barker et al. (1991) andMcVay etal. (2000) show that β is relatively insensitive to the span length. In thisresearch, six values of QD/QL=1.5, 2.0, 2.5, 3.0, 3.5, and 4.0 are used foranalysis to show the influence of the ratio of dead load to live load.
4.2. Serviceability limit state
When the settlement of single piles is greater than or equal to theserviceable limit (SSER), the probability of failure due to the service-ability criterion is estimated for an applied load Q:
Pf2 ¼ P S≥SSERð Þ ð17Þ
Realizations of SSER are generated from themean and COV values ofthe serviceable-allowable settlement (SSER), and the realizations of theallowable loads are obtained from the realizations of simulated load–settlement curves (Haldar and Babu, 2008). For an applied load Q, thenumber of sample realizations that exceeds the allowable load is esti-mated and divided by the total number of samples, which gives theprobability of failure due to SLS. The reliability index correspondingto serviceability criteria is determined by
βSLS ¼ Φ−1 1−Pf2
� �ð18Þ
4.3. Combined reliability
The failure probability that either the applied load is greater thanthe pile capacity or the pile is subjected to a greater settlement thanthe serviceable limit is described (Haldar and Babu, 2008):
Pf Q≥R∪S≥SSERð Þ ¼ Pf Q≥Rð Þ þ Pf S≥SSERð Þ−Pf Q≥R∩S≥SSERð Þ¼ Pf Q≥Rð Þ þ Pf S≥SSERð Þ−Pf Q≥R S≥SSERj ÞPf S≥SSERð Þ
�ð19Þ

0.0 0.2 0.4 0.6 0.8 1.0 1.2 1.4 1.6 1.8 2.00
5
10
15
20
25
30
35
40
a
b
c
d
Normal distribution Log-Normal distribution
Prob
abili
ty (
%)
Qp/Qm
0.0 0.2 0.4 0.6 0.8 1.0 1.2 1.4 1.6 1.8 2.00
5
10
15
20
25
30
35
40
Prob
abili
ty (
%)
Qp/Qm
Normal distribution Log-Normal distribution
0.0 0.2 0.4 0.6 0.8 1.0 1.2 1.4 1.6 1.8 2.00
5
10
15
20
25
30
35
40
Normal distribution Log-Normal distribution
Prob
abili
ty (
%)
Qp/Qm
5
10
15
20
25
30
35
40
Normal distribution Log-Normal distribution
Prob
abili
ty (
%)
88 G. Cai et al. / Engineering Geology 141-142 (2012) 84–91
where Pf(Q≥R∪S≥SSER) is the failure probability of the pile whenapplied load is greater than or equal to its ultimate capacity orwhen settlement is greater than or equal to its serviceable Pf(Q≥R)is the failure probability due to the applied load is greater than orequal to its ultimate capacity; Pf(S≥SSER) is the failure probabilitydue to excessive settlement. The conditional probability Pf(Q≥R|S≥SSER) is obtained by determining the number of samples exceedingthe ultimate capacity of the pile whose load is less than the service-able settlement, and then dividing that by the total number of sam-ples. It should be noted that the first and second criteria representthe component probability of failure and the third criteria representthe probability of system failure (Haldar and Babu, 2008). The systemreliability index is thus determined as
βSYS ¼ Φ−1 1−Pf Q≥R∪S≥SSERð Þh i
ð20Þ
5. Analysis and evaluation of results
Fig. 4a through d shows the histogram and the normal and log‐normal distribution of the measured to predicted pile capacity (Qp/Qm) of the four CPTU methods. Also As shown in the figure, generallythe log-normal distribution better matches the histogram than thenormal distribution, especially in the lower tail region. In this study,the log-normal distribution was used to evaluate the differentmethods on the basis of their prediction accuracy.
For log-normally distributed resistance and load effect, the Pf at agiven reliability index β can be calculated using the standard normaldistribution function (Ang and Tang, 1975)
pf ¼ 1− ∫β
−∞
1ffiffiffiffiffiffi2π
p e−x22 dx ð21Þ
The values of β at Pf of 10−1, 10−2, 10−3, and 10−4 are 1.28, 2.33,3.09, and 3.72, respectively.
Reliability analyses are conducted for the case of driven pile withthree different diameters (0.4, 0.5, and 0.6 m) at QD/QL=1.5, 2.0,2.5, 3.0, 3.5, and 4.0. The variations of the calculated reliability indexwith the dead load–live load ratio for each of the four pile designmethods are shown in Figs. 5–7. Figs. 5–7 also demonstrate the influ-ence of ULS, SLS, and the system reliability, respectively, in terms ofthe variation in reliability index. System criterion indicates the prob-ability of failure-reliability with respect to both criteria (ULS, SLScriteria). The reliability index (βSYS), based on system criterion, canbe considered to be system reliability. The results are presented forthree different mean allowable settlement limits (0.015, 0.025, and0.03 m). The FHWA failure criterion (Reese and O'Neill, 1988) isused for determining ultimate loads (Qu) corresponding to settlementof 5%D from load–settlement curves. Fig. 5 shows that the reliabilityindices βULS are higher than βSLS and βSYS, as the ultimate settlement(5%D) is greater than the allowable settlement considered, and henceultimate load always has greater values than the allowable service-able load. It can be found that βULS>βSYS>βSLS.
It can be seen that failure criterion alone has a tremendous effecton the calculated reliability level. It can be further seen that the reli-ability index is insensitive to the dead load–live load ratio, which isconsistent with other research in this area (Zhang et al., 2005). Thereliability index for the four methods decrease with the increase of(QD/QL), and the reliability index converge for QD/QL exceeding 3. Ba-sically, this is due to the fact that QD has lower uncertainty and COVthan QL. As can be seen in Figs. 5–7, the proposed CPTU method has
0.0 0.2 0.4 0.6 0.8 1.0 1.2 1.4 1.6 1.8 2.00
Qp/Qm
Fig. 4. Histogram and probability density function of Qp/Qm (a) Almeida et al. (1996)method, (b) Eslami and Fellenius (1997) method, (c) Takesue et al. (1998) method,(d) proposed CPTU method.

1 1.5 2 2.5 3 3.5 4 4.5QD/QL
0
0.5
1
1.5
2
2.5
3R
elia
bilit
y in
dex
Proposed method
Eslami method
Takesue method
Almeida method
ULS criterion
System criterion
SLS criterion
SSER=0.015m
1 1.5 2 2.5 3 3.5 4 4.5QD/QL
0
0.5
1
1.5
2
2.5
3
Rel
iabi
lity
inde
x
Proposed method
Eslami method
Takesue method
Almeida method
ULS criterion
System criterion
SLS criterion
SSER
=0.025m
1 1.5 2 2.5 3 3.5 4 4.5QD/QL
0
0.5
1
1.5
2
2.5
3
Rel
iabi
lity
inde
x
Proposed method
Eslami method
Takesue method
Almeida method
ULS criterion
System criterion
SLS criterion
SSER=0.030m
Fig. 5. Reliability index versus QD/QL for pile diameter 0.4 m and pile length 24.0 m.
1 1.5 2 2.5 3 3.5 4 4.5QD/QL
0
0.5
1
1.5
2
2.5
3
Rel
iabi
lity
inde
x
Proposed method
Eslami method
Takesue method
Almeida method
ULS criterion
System criterion
SLS criterion
SSER=0.015m
1 1.5 2 2.5 3 3.5 4 4.5QD/QL
0
0.5
1
1.5
2
2.5
3
Rel
iabi
lity
inde
x
Proposed method
Eslami method
Takesue method
Almeida method
ULS criterion
System criterion
SLS criterion
SSER=0.025m
1 1.5 2 2.5 3 3.5 4 4.5QD/QL
0
0.5
1
1.5
2
2.5
3
Rel
iabi
lity
inde
x
Proposed method
Eslami method
Takesue method
Almeida method
ULS criterion
System criterion
SLS criterion
SSER=0.030m
Fig. 6. Reliability index versus QD/QL for pile diameter 0.5 m and pile length 14.5 m.
89G. Cai et al. / Engineering Geology 141-142 (2012) 84–91
1 1.5 2 2.5 3 3.5 4 4.5QD/QL
0
0.5
1
1.5
2
2.5
3R
elia
bilit
y in
dex
Rel
iabi
lity
inde
x
Proposed method
Eslami method
Takesue method
Almeida method
ULS criterion
System criterion
SLS criterion
SSER=0.015m
1 1.5 2 2.5 3 3.5 4 4.5QD/QL
0
0.5
1
1.5
2
2.5
3
SSER=0.025m
1 1.5 2 2.5 3 3.5 4 4.5QD/QL
0
0.5
1
1.5
2
2.5
3
SSER=0.030m
Proposed method
Eslami method
Takesue method
Almeida method
ULS criterion
System criterion
SLS criterion
Rel
iabi
lity
inde
x
Proposed method
Eslami method
Takesue method
Almeida method
ULS criterion
System criterion
SLS criterion
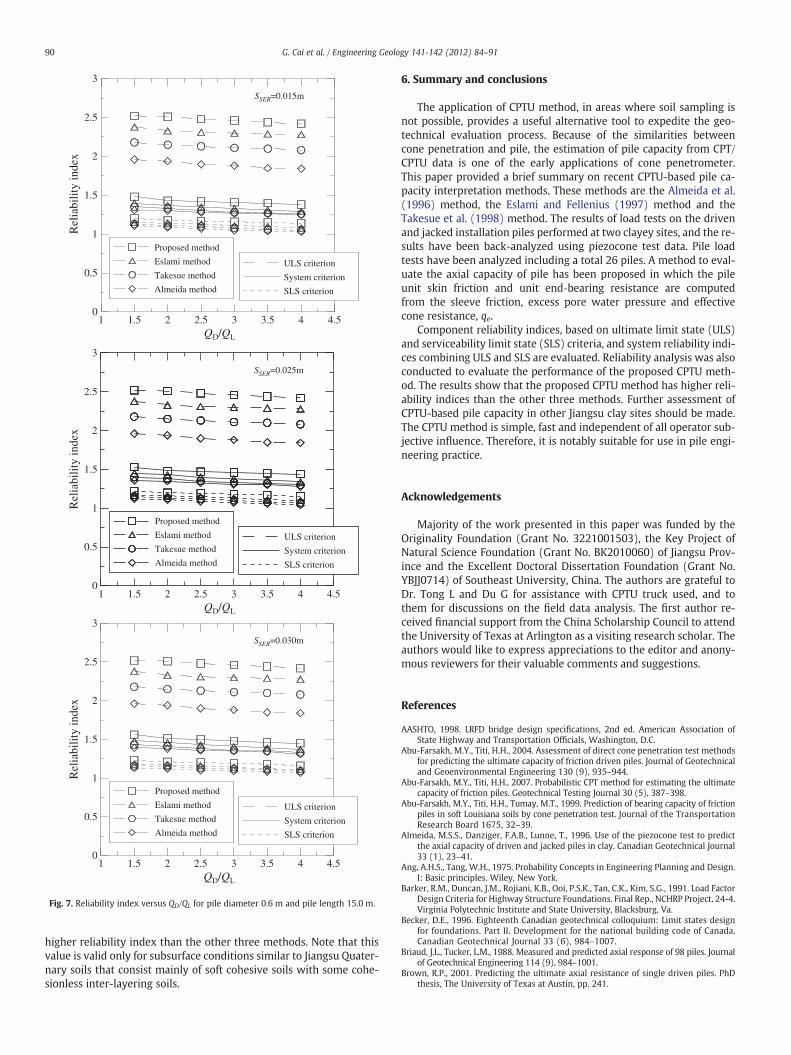
Fig. 7. Reliability index versus QD/QL for pile diameter 0.6 m and pile length 15.0 m.
90 G. Cai et al. / Engineering Geology 141-142 (2012) 84–91
higher reliability index than the other three methods. Note that thisvalue is valid only for subsurface conditions similar to Jiangsu Quater-nary soils that consist mainly of soft cohesive soils with some cohe-sionless inter-layering soils.
6. Summary and conclusions
The application of CPTU method, in areas where soil sampling isnot possible, provides a useful alternative tool to expedite the geo-technical evaluation process. Because of the similarities betweencone penetration and pile, the estimation of pile capacity from CPT/CPTU data is one of the early applications of cone penetrometer.This paper provided a brief summary on recent CPTU-based pile ca-pacity interpretation methods. These methods are the Almeida et al.(1996) method, the Eslami and Fellenius (1997) method and theTakesue et al. (1998) method. The results of load tests on the drivenand jacked installation piles performed at two clayey sites, and the re-sults have been back-analyzed using piezocone test data. Pile loadtests have been analyzed including a total 26 piles. A method to eval-uate the axial capacity of pile has been proposed in which the pileunit skin friction and unit end‐bearing resistance are computedfrom the sleeve friction, excess pore water pressure and effectivecone resistance, qe.
Component reliability indices, based on ultimate limit state (ULS)and serviceability limit state (SLS) criteria, and system reliability indi-ces combining ULS and SLS are evaluated. Reliability analysis was alsoconducted to evaluate the performance of the proposed CPTU meth-od. The results show that the proposed CPTU method has higher reli-ability indices than the other three methods. Further assessment ofCPTU-based pile capacity in other Jiangsu clay sites should be made.The CPTU method is simple, fast and independent of all operator sub-jective influence. Therefore, it is notably suitable for use in pile engi-neering practice.
Acknowledgements
Majority of the work presented in this paper was funded by theOriginality Foundation (Grant No. 3221001503), the Key Project ofNatural Science Foundation (Grant No. BK2010060) of Jiangsu Prov-ince and the Excellent Doctoral Dissertation Foundation (Grant No.YBJJ0714) of Southeast University, China. The authors are grateful toDr. Tong L and Du G for assistance with CPTU truck used, and tothem for discussions on the field data analysis. The first author re-ceived financial support from the China Scholarship Council to attendthe University of Texas at Arlington as a visiting research scholar. Theauthors would like to express appreciations to the editor and anony-mous reviewers for their valuable comments and suggestions.
References
AASHTO, 1998. LRFD bridge design specifications, 2nd ed. American Association ofState Highway and Transportation Officials, Washington, D.C.
Abu-Farsakh, M.Y., Titi, H.H., 2004. Assessment of direct cone penetration test methodsfor predicting the ultimate capacity of friction driven piles. Journal of Geotechnicaland Geoenvironmental Engineering 130 (9), 935–944.
Abu-Farsakh, M.Y., Titi, H.H., 2007. Probabilistic CPT method for estimating the ultimatecapacity of friction piles. Geotechnical Testing Journal 30 (5), 387–398.
Abu-Farsakh, M.Y., Titi, H.H., Tumay, M.T., 1999. Prediction of bearing capacity of frictionpiles in soft Louisiana soils by cone penetration test. Journal of the TransportationResearch Board 1675, 32–39.
Almeida, M.S.S., Danziger, F.A.B., Lunne, T., 1996. Use of the piezocone test to predictthe axial capacity of driven and jacked piles in clay. Canadian Geotechnical Journal33 (1), 23–41.
Ang, A.H.S., Tang, W.H., 1975. Probability Concepts in Engineering Planning and Design.I: Basic principles. Wiley, New York.
Barker, R.M., Duncan, J.M., Rojiani, K.B., Ooi, P.S.K., Tan, C.K., Kim, S.G., 1991. Load FactorDesign Criteria for Highway Structure Foundations. Final Rep., NCHRP Project. 24-4.Virginia Polytechnic Institute and State University, Blacksburg, Va.
Becker, D.E., 1996. Eighteenth Canadian geotechnical colloquium: Limit states designfor foundations. Part II. Development for the national building code of Canada.Canadian Geotechnical Journal 33 (6), 984–1007.
Briaud, J.L., Tucker, L.M., 1988. Measured and predicted axial response of 98 piles. Journalof Geotechnical Engineering 114 (9), 984–1001.
Brown, R.P., 2001. Predicting the ultimate axial resistance of single driven piles. PhDthesis, The University of Texas at Austin, pp. 241.

91G. Cai et al. / Engineering Geology 141-142 (2012) 84–91
Bustamante, M., Gianeselli, L., 1982. Pile Bearing Capacity Predictions byMeans of StaticPenetrometer CPT. Proceedings of the Second European Symposium on PenetrationTesting, ESOPT-II, Amsterdam, The Netherlands, vol. 2, pp. 493–500.
Cai, G., Liu, S., Tong, L., Du, G., 2009. Assessment of direct CPT and CPTU methods forpredicting the ultimate bearing capacity of single piles. Engineering Geology 104(1–2), 211–222.
Cai, G., Liu, S., Puppala, A.J., 2011. Evaluation of pile bearing capacity from piezoconepenetration test data in soft Jiangsu Quaternary clay deposits. Marine Georesources& Geotechnology 29 (3), 177–201.
De Ruiter, J., Beringen, F.L., 1979. Pile foundations for large North Sea structures. MarineGeotechnology 3 (3), 267–314.
Delft Laboratory of Soil Mechanics (Delft), 1936. The Predetermination of the RequiredLength and the Prediction of the toe Resistance of Piles. Proc., 1st Int. Conf. on SoilMechanics and Foundation Engineering, Harvad Univ., Boston, pp. 181–184.
Eslami, A., Fellenius, B.H., 1997. Pile capacity by direct CPT and CPTU methods appliedto 102 case histories. Canadian Geotechnical Journal 34, 886–904.
Haldar, S., Babu, G.L.S., 2008. Reliability measures for pile foundations based on conepenetration test data. Canadian Geotechnical Journal 45 (12), 1699–1714.
Lunne, T., Robertson, P.K., Powell, J.J.M., 1997. Cone penetration testing in geotechnicalpractice. Blackie Academic & Professional, Chapman & Hall, London.
Mayne, P.W., Schneider, J.A., 2001. Evaluating Axial Drilled Shaft Response by SeismicCone. Foundations and Ground Improvement. : GSP, No. 113. ASCE, Reston, Virginia,pp. 655–669.
Mayne, P.W., Zavala, G., 2004. Axial Shaft Response from Seismic Piezocone Tests.Drilled shaft, Micropiling, Deep mixing, Remedial methods, and speciality founda-tion systems. : GSP, No. 124. ASCE, pp. 1–12.
McVay, M.C., Birgisson, B., Zhang, L.M., Perez, A., Putcha, S., 2000. Load and resistancefactor design (LRFD) for driven piles using dynamicmethods—a Florida perspective.Geotechnical Testing Journal 23 (1), 55–66.
Meyerhof, G.G., 1983. Scale Effects of Pile Capacity. Journal of Geotechnical Engineering108 (GT3), 195–228.
Powell, J.J.M., Lunne, T., Frank, R., 2001. Semi-empirical Design for Axial Pile Capacity inClays. Proceedings of the 15th International Conference on Soil Mechanics andGeotechnical Engineering, vol. 2, pp. 991–994.
Puppala, A.J., Wattanasanticharoen, E., Hoyos, L.R., Satyanarayana, R., 2002. Use of ConePenetration Test (CPT) Results for Accurate Assessments of Pile Capacities. Proc 9thInternational Conference on Piling and Deep Foundations, Nice, France, June 3/4/5,pp. 575–580.
Reese, L.C., O'Neill, M.W., 1988. Field Load Test of Drilled Shafts. Proceedings of the 1stInternational Conference Deep Foundations on Bored and Auger Piles, Ghent.
Robertson, P.K., Campanella, R.G., Davies, M.P., Sy, A., 1988. Axial Capacity of DrivenPiles in Deltaic Soils using CPT. Proceedings of the First International Symposiumon Penetration Testing, ISOPT-1, Orlando, vol. 2, pp. 919–928.
Rollins, K.M., Miller, N.P., Hemenway, D., 1999. Evaluation of pile capacity predictionmethods based on cone penetration test using results from I-15 load tests. Journalof the Transportation Research Board 1675, 40–50.
Schmertmann, J.H., 1978. Guidelines for cone penetration test, performance and design.Rep. No. FHWA-TS-78-209. U.S. Department of Transportation, Washington, D.C.,p. 145.
Schneider, J.A., Xu, X., Lehane, B.M., 2008. Database assessment of CPT-based designmethods for axial capacity of driven piles in siliceous sand. Journal of Geotechnicaland Geoenvironmental Engineering 134 (9), 1227–1244.
Sharp, M.R., McVay, M.C., Townsend, F.C., Basnett, C.R., 1988. Evaluation of pile capacityfrom in situ tests. Proceedings, Symposium on Soil Properties—Evaluation fromCentrifugal Models and Field Performance at ASCE National Convention, Nashville,Tenn, pp. 134–156.
Takesue, K., Sasao, H., Matsumoto, T., 1998. Correlation Between Ultimate Pile SkinFriction and CPT Data. Geotechnical Site Characterization, 2. Balkema, Rotterdam,pp. 1177–1182.
Tand, K.E., Fundgard, E.G., 1989. Piles capacity in stiff clays—CPT method. Proceedingsof Twelfth International Conference on Soil Mechanics and Foundation Engineering.Rio de Janeiro, vol. 1, pp. 349–352.
Tumay, M.T., Fakhroo, M., 1982. Friction Pile Capacity Prediction in Cohesive Soils UsingElectric Quasi-static Penetration Tests. Interim Research Rep. No. 1. LouisianaDepartment of Transportation and Development, Research and DevelopmentSection, Baton Rouge, La.
Whitman, R.V., 1984. Evaluating calculated risk in geotechnical engineering. Journal ofGeotechnical Engineering 110 (2), 143–188.
Withiam, J.L., Voytko, E.P., Barker, R.M., Duncan, J.M., Kelly, B.C.,Musser, S.C., Elias, V., 1997.Load and Resistance Factor Design (LRFD) for Highway Bridge Substructures. FHWARep. DTFH61-94-C-00098. Federal Highway Administration, Washington, D.C.
Xu, X., Schneider, J.A., Lehane, B.M., 2008. Cone penetration test (CPT) methods forend-bearing assessment of open- and closed-ended driven piles in siliceous sand.Canadian Geotechnical Journal 45 (8), 1130–1141.
Yoon, S., Abu-Farsakh, M.Y., Tsai, C., Zhang, Z., 2008. Calibration of resistance factors foraxially loaded concrete piles driven into soft soils. Journal of the TransportationResearch Board 2045, 39–50.
Zhang, L.M., Tang, W.H., Ng, C.W.W., 2001. Reliability of axially loaded driven pilegroups. Journal of Geotechnical and Geoenvironmental Engineering 127 (12),1051–1060.
Zhang, L.M., Li, D.Q., Tang, W.H., 2005. Reliability of bored pile foundations consideringbias in failure criteria. Canadian Geotechnical Journal 42 (4), 1086–1093.