Embed Size (px)
Citation preview

EDUCATIONAL AND PSYCHOLOGICAL MEASUREMENT 1980.40
RELIABILITY AND VALIDITY OF A STATISTICS ATTITUDE SURVEY
D E N N I S M . ROBERTS ' • ^ '
The Pennsylvania Slate University
E D W A R D W. B I L D E R B A C K
The Moberly Junior College
A 34 item scale entitled Sutistics Attitude Survey (SAS) was developed and administered to three samples of students taking a beginning statistics course. Analyses showed that the scale was highly homogeneous and that total scale scores had moderate correlations with statistics grades.
A I K E N (1970, 1976) has presented comprehensive reviews of studies on attitudes toward mathematics and on the relationships of attitu-dinal variables to mathematics and related concerns. One point Aiken (1976) made was that contributors to some of the more current literature have appeared to be unaware of earlier efforts (Aiken and Dreger, 1961; Dutton, 1951) to produce affective instruments that are capable of augmenting the usual cognitive measures designed to predict mathematics achievement.
One outcome from using these scales that was concerned with attitudes toward mathematics to predict general mathematics performance has been the use of such scales in more specialized settings. For example, Feinberg and Halperin (1978) reported on some affective and cognitive correlates of achievement in a beginning college level statistics course. Affective measures included both a state-trait anxiety measure and a modified Dutton-type scale to measure attitudes toward quantitative concepts. Findings indicated that the measure of attitudes toward quantitative concepts was the most valid affective predictor of statistics performance (r = .35), even though a cognitive
Copyright © 1980 by Educational and Psychological Measurement
235

236 E D U C A T I O N A L A N D P S Y C H O L O G I C A L M E A S U R E M E N T
measure predicted the outcome (/• = .40) with slightly higher accuracy than that afforded by the affective measure. Thus, it was found that a general measure of attitudes toward mathematics did, in fact, offer reasonable predictability in a more specialized quantitative situation.
The purpose of the present paper was to report on the development and validation of an affective measure that was designed to be more relevant than other affective measures in the prediction of performance in statistics, currently a widely studied academic area. Given the fact that most students who take statistics (especially introductory level courses) are quite anxious when doing so, an improvement in prediction was thought to be possible with an affective scale that was couched in statistical jargon. The data to be presented represent an initial effort to provide reliability and vaUdity information for such an affective scale.
Scale Development -
An initial pool of approximately 50 Likert-type items was constructed following the general content domain as was presented in the Dutton scale (1951). (Note: Some of the items are similar to those from an unpublished scale by W. R. Rabinowitz of The Pennsylvania State University.) After a small initial tryout, some items were revised and some were deleted because of the presence of low point-biserial correlation coefficients in relation to total scores. The final version of the Statistics Attitude Survey (SAS) contains 34 highly homogeneous items. (A copy of the SAS is available from the first author.) Several sample items are as follows: (8) I make a lot of errors when I calculate statistics problems, (18) The thought of taking another statistics course makes me feel sick, and (20) I find statistics to be very logical and clear. A 5-choice Likert scale was adopted for the responses to each item—ranging from strongly agree to strongly disagree. A mixture of positively and negatively worded items was included.
Data Samples
All data were collected by one or both of the authors in 3 separate terms (Spring 1978, Winter 1978-79, Spring 1979) of an introductory graduate level statistics course at The Peimsylvania State University. Coming from a broad spectrum of programs, students represent both undergraduates and graduates with widely varying abiUties and interests. For many students, this course represents the only exposure to statistics that they would receive.

ROBERTS A N D B I L D E R B A C K 237
Results
The range of possible SAS scores was 170 to 34 with a mid-range score of 102 considered to be an overall neutral position. Data were analyzed with the LIKRT program developed by Kohr (1973). This program does internal consistency analyses for scales of the Likert type. Table 1 presents the several descriptive measures on the three data samples. All three samples provided similar data with the exception of the correlations. Proportions of variance accounted for by the SAS in predicting course grades ranged from about 10% (Spring 1978) to 30% (Spring 1979). The consistently high estimates of reUa-bility indicated that items measure the same construct. Only Item 33—"statistics teachers are probably no better or worse than other teachers,"—had point biserial correlations with total SAS scores consistently near zero. Other items had point biserials in the range from .50 to .70. Across the samples, the Spearman-Brown prophecy formula indicated that a scale of approximately 19 items would have achieved a reliabihty of .90. Relevant to the correlational data, it is interesting to note that—contrary to general expectations—the smaller the SAS standard deviation, the higher the vahdity coefficient. That same pattern of ordered values for the standard deviation also held for the total number of course points—the criterion measure.
As a final note, the mean scores indicated a somewhat positive attitude towards statistics. This outcome also might be contrary to general opinion. It would be interesting to compare pretest versus posttest scores on the SAS over the duration of such a statistics course to see whether any general change occurs. In summary, results indicate that the SAS is a highly homogeneous scale that does predict statistics course performance quite well.
T A B L E I Descriptive Data on SA S from Three Samples
Sample Spring 1978 Winter 1978-79 Spring 1979
N = n N = »\ ,V = 65
X 109.40 110.00 108.69 a 22.21 19.66 18.73
.95 .93 .94 PPM*" . 3 3 " .«•• .S4»«
* Reliability eslimaicd by coefficient alpha Correlation between SAS scores and uual poinu earned in the statistics course. Point totals include several mul*
tiple-choice tests and a take home problem test. ' * Statistically Mgniticant at .01 level.

238 E D U C A T I O N A L A N D P S Y C H O L O G I C A L M E A S U R E M E N T
Brief Discussion - s
One common problem that instructors in the area of statistics face is that many, if not most, of the students are frightened of taking such courses. It is not unusual for students to delay taking statistics in their programs as long as possible; many wait until their last term when it then becomes a "do or die" situation. In some ways, it is unbelievable how fearful students become when faced with the reality of finally having to take "stat." The affective component presents a real barrier to a potentially successful experience with such content material. Hopefully, the SAS can assist in detecting those individuals possessing chronic pre-course fears. With such information, instructors can help ease students over the initial shock by positive steps such as making sure that students can use calculators efficiently or immediately providing them with a tutor.
REFERENCES
Aiken, L. R. Attitudes toward mathematics. Review of Educational Research. 1970, 40, 551-596.
Aiken, L. R. Update on attitudes and other affective variables in learning mathematics. Review of Educational Research. 1976, 46, 293-311.
Aiken, L. R. and Dreger, R. .M. The effect of attitudes on performance in mathematics. Journal of Educational Psychology. 1961, 52, 19-24.
Dutton, W. H. Attitudes of prospective teachers toward mathematics. Elementary School Journal, 1951, 52, 84-90.
Feinberg, L. B. and Halperin S. Affective and cognitive correlates of course performance in introductory statistics. Journal of Experimental Education, 1978,46, 11-18.
Kohr, R. L. Program LIKRT-version 4. State University: The Pennsylvania State University Computation Center, 1973.

STATISTICS ATTITUDE SURVEY^
D i r e c t i o n s ; Each o f the statements below i s fo l l owed by a r a t i n g * scale which ranges from S t rong ly Agree to S t rong ly • : ^ Disagree. Rate each statement i n terms o f how you f e e l . Make a check mark under the app rop r i a t e r a t i n g .
S t rong ly S t rong ly Agree Agree N e u t r a l Disagree Disagree
1 . S t a t i s t i c s w i l l be use fu l t o me i n my profess ion when I evaluate other people.
2. I t takes me a long t ime to understand a s t a t i s t i c a l concept.
3. I get a great deal o f s a t i s f a c t i o n out o f s o l v i n g a s t a t i s t i c s problem.
4. S t a t i s t i c s w i l l be use fu l t o me to t e s t the s u p e r i o r i t y o f one method over another .
5. I normally am able to so lve s t a t i s t i c s problems w i t h o u t too much d i f f i c u l t y .
6. I might use s t a t i s t i c s a t my j o b but wou ldn ' t l i k e doing i t .
7. S t a t i s t i c s w i l l be use fu l to me i n eva lua t ing the e f f e c t i v e ness of my p ro f e s s iona l pe r formance.
8. I make a l o t o f e r r o r s when I ca l cu l a t e s t a t i s t i c s problems.
9. Even before I begin a new s t a t i s t i c s t o p i c , I f e e l r e l a t i v e l y conf ident t h a t I can master i t .
10. S t a t i s t i c s w i l l be u se fu l t o me when I describe my p r o f e s s i o n a l a c t i v i t i e s to o ther people .
2
St rong ly - ' S t rongly Agree Agree N e u t r a l Disagree Disagree
1 1 . I am able to f i g u r e out most of the equations I need to solve a s t a t i s t i c s problem.
12. I would l i k e to study advanced s t a t i s t i c s .
13. S t a t i s t i c s w i l l be a u se fu l t o o l tha t I can use to improve the r e l i a b i l i t y and v a l i d i t y of measures t ha t I have developed.
14. There are so many s t a t i s t i c a l concepts to l e a r n t ha t I get confused.
15. The average p r o f e s s i o n a l would f i n d s t a t i s t i c s a b o r i n g subjec t .
16. S t a t i s t i c s w i l l be a u se fu l way to help me improve the q u a l i t y of my p r o f e s s i o n a l performance.
17. I must cons t an t l y rev iew s t a t i s t i c s o r I f o r g e t i t .
18. The thought o f t a k i n g another s t a t i s t i c s course makes me f e e l s i c k : I
19. S t a t i s t i c s i s so u se fu l t h a t i t should be a r equ i r ed p a r t of my p ro f e s s ion ' s s k i l l s .
20. I f i n d s t a t i s t i c s to be very l o g i c a l and c l e a r .
2 1 . Given the o p p o r t u n i t y , I would take another s t a t i s t i c s course even though i t wasn ' t r e q u i r e d .
22. When I so lve a s t a t i s t i c s problem, I am o f t e n not sure how to i n t e r p r e t the r e s u l t s .

3
St rongly S t rongly Agree Agree N e u t r a l Disagree Disagree
23. S t a t i s t i c s won ' t be u s e f u l to me i n my profess ion because i t takes too much time to use.
24. When I solve a s t a t i s t i c s problem, I am o f t e n unsure i f ' I have a c o r r e c t or n e a r l y correc t answer.
25. I t i s unreasonable to expect ' the average p r o f e s s i o n a l to master and apply s t a t i s t i c s .
26. You should be good at math before a t t empt ing s t a t i s t i c s .
27. S t a t i s t i c s may be use fu l to someone who plans to pursue a career i n research, but not very u s e f u l to the average p r o f e s s i o n a l .
28. S t a t i s t i c s i s the most d i f f i c u l t course I have taken .
29. The pace o f a s t a t i s t i c s course i s so f a s t t ha t i t i s impossible f o r the average student to l e a r n the subj e c t matter t ho rough ly .
30. Homework i n s t a t i s t i c s i s harder than homework i n non-math s u b j e c t s .
31 . S t a t i s t i c s i s too t h e o r e t i c a l to be o f much p r a c t i c a l use to the average p r o f e s s i o n a l .
32. I f i n d i t easy to e x p l a i n a s t a t i s t i c s t o p i c to someone e l s e .
33. An average s tudent can expect a good grade i n s t a t i s t i c s i f he/she s t u d i e s .

EDUCATIONAL A N D PSYCHOLOGICAL MEASUREMENT 1982. 42
! VALIDITY OF A STATISTICS ATTITUDE SURVEY: A FOLLOW-UP STUDY
D E N N I S M . ROBERTS A N D JOSEPH E. S A X E
The Pennsylvania State University
The validity of the Statistics Attitude Survey (SAS) was further examined in the present study. Students were assessed on a number of pretest and posttest cognitive and non-cognitive variables, including the SAS. SAS scores were found to be significantly related to such cognitive variables as basic mathematics skills, statistics preknowledge, and course grades. Non-cognitive factors with which SAS was significantly correlated were sex, the degree to which students indicated that they had wanted to take the course and that they were glad they had taken the course, number of previous mathematics courses completed, the status of a course being required or elective, calculator attitudes, and course and instructor evaluations. In addition, SAS scores showed a significant positive change from the beginning to the end of the course.
R E C E N T L Y , Roberts and Bilderback (1980) presented data on the development of a Likert-type Statistics Attitude Survey (SAS).' The SAS was developed to assess various components of statistical attitudes such as perceptions held by students of how competent they are with statistics and of how useful statistical analysis itself is. Analyses of several different data sets indicated that the SAS is a highly homogeneous scale and that total SAS scores are correlated moderately and positively with grades earned in a basic statistics course. The purpose of the present study was to examine specifically the validity of the SAS in terms of the correlations between SAS scores and numerous other variables. The data to be described are
' Reprints o f the present article, the previous article on the development o f the SAS, and the SAS scale itself are available from the first-listed author at 308 Cedar Building, University Park, PA 16802.
Copyright O 1982 Educational and Psychological Measurement . ; « U
m

908 E D U C A T I O N A L A N D P S Y C H O L O G I C A L M E A S U R E M E N T
part of a larger investigation concerned more generally with the identification of useful measures for prediction of performance in a basic statistics course.
Methods
Subjects c ^>
Subjects were 132 students from an introductory statistics course at The Pennsylvania State University. In the initial pool of 132 subjects, 98 were females and 34 were males. In some analyses, however, sample size was smaller because of attrition. The course is made up of both advanced undergraduates and graduates—in the present case, 36 and 96, respectively. Of the graduates, 69 were first-year students. All students received bonus course credit for participation. * - ^
Variables
As most variables are self-explanatory, they are only described, as needed, in the Results section. However, some variates represent scores on instruments that are described here.
1. Basic Mathematics Test: A multiple-choice measure consisting of 36 items (two of which were not scored for present purposes), the Basic Mathematics Test, is routinely used as the basic skills mathematics examination at The Pennsylvania State University. Skills sampled include those involving whole numbers, fractions, decimals, ratio/proportions, and tables and graphs.
2. Basic Statistics Test: A multiple-choice measure containing 20 items, the Basic Statistics Test, was constructed by the authors. Items cover basic descriptive statistics from frequency distributions to correlation. Approximately one-half of the items requires simple calculations.
3. Statistics Attitude Scale: The Statistics Attitude Scale is a Likert-type instrument consisting of 33 items. Items tap such areas as usefulness of statistics and anxieties of students who must take statistics. More information on the development of this homogeneous scale can be found in Roberts and Bilderback (1980).
4. Calculator Attitude Scale: Also of the Likert-type, the 20 item Calculator Attitude Scale is reported on in more detail by Geisinger and Roberts (1978). This reasonably homogeneous measure of attitudes about calculators assesses such components as the educational value of calculators and the trustworthiness of calculators themselves.

ROBERTS A N D S A X E
General Procedures
Basic information about the students (e.g., sex and age) plus attitude survey responses were gathered during the first week of a ten-week term. Data on the statistics and mathematics tests were collected at an evening session several days later. At the end of the term, posttest data were obtained on the attitude surveys, statistics measure, course and instructor evaluations, and course grades. All data gathering was done by the authors.
Results
Reliabilities
Table 1 presents coefficient alpha reliability estimates on the test score variables as mentioned in the section on Variables. With the exception of the Basic Statistics Test, which was not piloted, all internal-consistency reliability estimates were judged as quite satisfactory.
Correlations
Table 2 presents the correlations between pretest SAS scores and the other variables used in the study and between posttest scores and the same other variables. Males did tend to have higher SAS scores than did females. In a cluster of similar variables, higher SAS scores were associated with having had more previous mathematics courses, higher basic mathematics skills, more previous statistical knowledge, and higher grades in the present statistics course. For these measures, correlations betwen SAS and each variable tended to average about .08 higher for posttest SAS scores than for pretest SAS scores. This outcome might have been simply due to the larger posttest SAS standard deviation (SD) in the bivariate sample (pretest SD = 14.86, posttest SD = 16.36). Students who elected to
T A B L E 1 Reliability and Standard Errors of Measurement for Scale Score Data
Pretest Posttest
Measure Alpha SE Meas. Alpha SE Meas.
Basic Mathematics Test* .89 2.42 Basic Statistics Test .63 1.89 .55 1.81 Statistical Atti tudes .92 4.49 .93 4.68 Calculator Attitudes .82 3.65 .85 3.53
' Basic Mathematics Test was given only during pretesting.

9 M E D U C A T I O N A L A N D P S Y C H O L O G I C A L M E A S U R E M E N T
T A B L E 2 Correlations of SAS Scores with Other Student Variables
SAS Time
Variable Pre" Post"
Sex ,26** .I9» Age .15 .02 N u m b e r o f Math Courses .30** .34** Required/Elective - . 25** - . 17 Student Status A4^. . .03 Bir th Order .02 - .05 Wanted Course .66»* • T-̂ .52«» Basic Math . 2 7 " . 3 7 " Basic Stat Pre .27** .25» Basic Stat Post .32** .42*» Calculator Atti tude Pre .15 Calculator Att i tude Post » - j « | v , . - > - . 0 4 Course Evaluation Atf . 25 ' » Instructor Evaluation " .13 .21* Grade • 2 6 " '• . 4 1 " Glad Took course .43 '* .32**
* For bivariate comparisons. ATs ranged from 127 to 95. ^ For bivariate comparisons. ATs ranged from 101 to S3.
• Correlation different from 0 at p < .05 level. Correlation different from 0 at p < .05 level.
take the statistics course had higher SAS scores than did those students taking it as a requirement. In this context, it was no surprise then that students saying they were more positive about wanting to take the course—and subsequently glad they took the course—also had higher SAS scores. In a similar vein, students who rated both the course and instructor more positively also exhibited higher SAS scores. It should be noted that the course and instructor evaluation measures were only single items requiring the student to give a verbal rating (on a 7-point scale) of the course and instructor. Students who exhibited more positive attitudes about calculators (pretest only) tended to have higher SAS scores. However, this relationship appeared to be low at best. Age of the student and status (term standing) were unrelated to SAS scores just as was birth order. In summary, SAS scores were clearly related to a variety of cognitive and non-cognitive measures.
Gain Scores
As one final analysis, pretest and posttest SAS scores were compared to determine whether that was a significant change. Pretest mean SAS score was 105.28 [SD = 14.86) compared to a
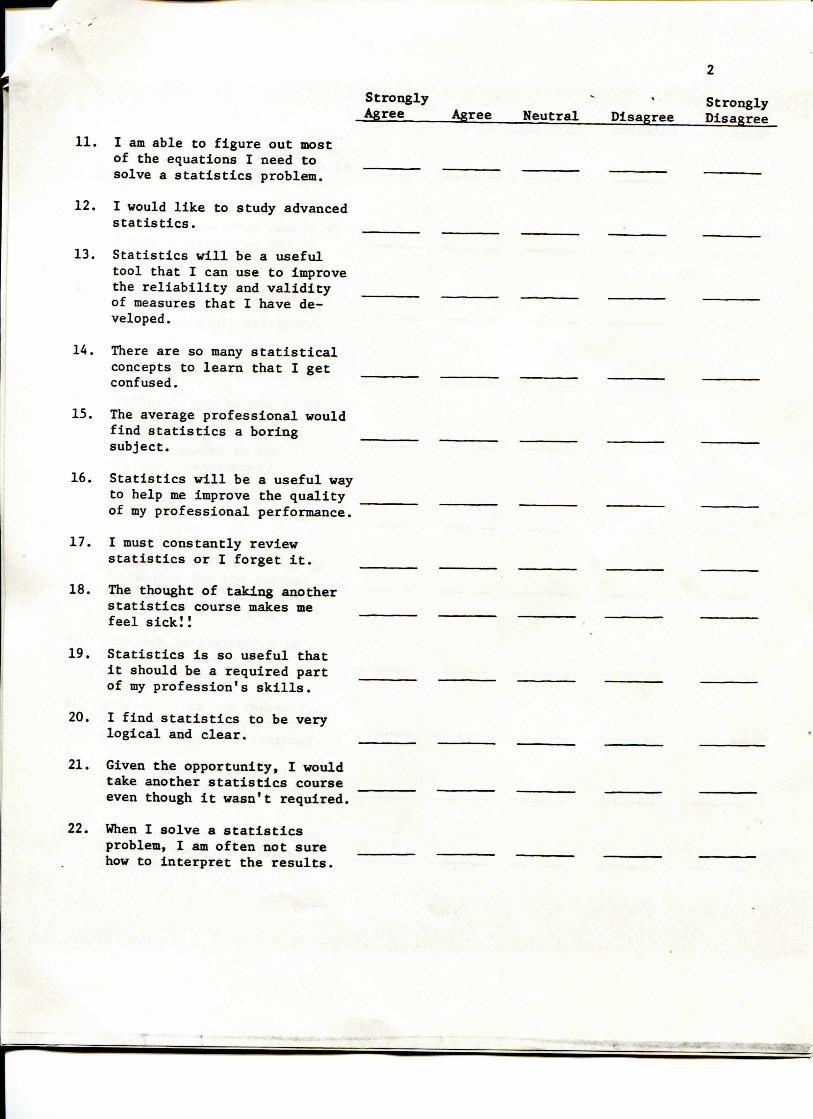
ROBERTS A N D S A X E 911
posttest mean of 109.94 (SD = 16.36). The resulting diflference was statistically significant {t = 3.448, df = 95, p < .01).
Brief Discussion
The present data again provided some support for the notion that too much anxiety can interfere with cognitive functioning. Certainly in the area of statistics (and mathematics in general), many students arrive at their first or second exposure to course work with fears and anxieties about mathematics greatly exaggerated in relation to the true difficulty of the subject matter. Students seem to feel that if they make mistakes statistics is going to "bite" them. Obviously, many of these anxieties are the result of erroneous perceptions about how sophisticated mathematics proficiencies have to be in order to achieve reasonable competence in elementary statistical procedures.
One of the ways to approach the "anxiety attacks" situation is to deal directly with negative attitudes about statistics. The present data indicate that more positive attitudes are associated with higher levels of performance. Thus, it may be helpful at the beginning of statistics courses to run routine SAS checks on students. It may be that precourse identification of students who have low SAS scores will allow an instructor to discuss with them the realities of the skills needed to perform satisfactorily. In addition, the instructor may be able to outline strategies that will enable the student to organize his/ her study time to utilize it with increasing effectiveness.
Of special interest was the fact that SAS scores changed significantly in a positive direction from the beginning to the end of the course. Although one may not infer that the experience in the course "caused" the change, it is not unreasonable to include such an explanation. Students who enter the statistics course and who are generally "mathematics anxious" (as they are) and who later find that a statistics course is not so terrifying as they envisioned may develop more positive attitudes about statistics. However, an alternative explanation may be that initial student anxiety has produced depressed SAS scores at the beginning of the course. When students find out later that the course was not so distressing as they had feared, their "true" SAS scores may exert an impact. In either case though, reducing the unnecessary negative perceptions about either the students' abilities to handle statistics or the usefulness of learning statistical procedures would probably allow the student to be more productive in his/her statistical training.

912 E D U C A T I O N A L A N D P S Y C H O L O G I C A L M E A S U R E M E N T
REFERENCES
Geisinger, K. F. and Roberts, D. M . Individual diflFerences in calculator attitudes and performance in a statistics course. Paper presented at .American Educational Research Association, Toronto, 1978.
Roberts, D. M . and Bilderback, E. Reliability and validity of a statistics attitude survey. EDUCATIONAL AND PSYCHOLOGICAL MEASUREMENT , 1980, 40, 235-238.