Embed Size (px)
Citation preview

i
Reliability Analysis of Lunar Rover Wheel
Designs - Methodology and Visual Inspection
Technique
by
Karim Kamal Parbatani
Department of Mechanical Engineering
McGill University
Montreal
December, 2011
A Thesis submitted to the Faculty of Graduate Studies in partial
fulfillment of the degree of Master of Engineering
© Karim Kamal Parbatani, 2011

ii
ABSTRACT
This thesis presents a methodology for prediction of reliability for a lunar rover
and a technique to evaluate reliability where data for operation in the lunar
environment are not available in order to conduct traditional reliability analysis.
This technique was applied to lunar rover wheel designs.
The maximum distance travelled by the Lunar Roving Vehicle (LRV)
during the Apollo 17 mission was approximately 35.9 km. Presently, McGill
University, Neptec and the Canadian Space Agency are collaborating to develop a
wheel set for an LRV, which is targeted to have a five-year operational service.
This underlines the importance of the reliability of an LRV, which will be
required to travel thousands of kilometres.
The Neptec Design Group has developed a methodology to estimate the
reliability of a lunar rover, i.e., the Lunar Rover Reliability Prediction (LRRP)
where the project was divided into two phases. Phase 1 consisted of three
milestones which included background research of the various reliability models
currently available, the specific software tools that execute these models, and the
ability to adapt these tools to account for lunar environmental factors (e.g.,
temperature, regolith, low gravity). Results demonstrated that Relex provided a
strong package of fully integrated software tools to execute a group of reliability
models (FMEA [Failure Modes and Effects Analysis], Fault Tree, Standards
Prediction, ALT [Accelerated Life Testing]). Mission simulation software was
identified to be a worthwhile addition and GoldSim was considered to be the best
choice to provide mission simulation analysis.
Phase 2 outlined the process for estimating the reliability of a lunar rover
for a 5-year operational life on the moon based on the recommendations detailed
in Phase 1. LRRP has been a success, but Neptec was only able to obtain earth
bound data for use in the methodology.

iii
Hence, research on cryogenic wear was explored and the summary of
relevant findings is as follows: the wear rate of steel and titanium at 293K and
77K are about the same below a sliding speed of 1m/s; the wear rate at 77K above
1m/s is higher for most materials and the coefficient of friction for steel on steel at
77K and 273 K is about the same. The information present in the literature is
insufficient to evaluate LRV reliability under lunar environmental conditions.
This underlines the necessity for an alternative methodology, for instance, the
visual inspection technique, to evaluate reliability of systems (e.g., a lunar rover),
where useful data are not available.
The visual inspection technique is described and an analysis of five
historical wheels and four new wheels designed by McGill University is given.
The wheel designs were visually analysed according to specific criteria with
respect to potential failure under lunar conditions (temperature, vacuum, regolith)
considering wear resistance, thermal compatibility, excess loading, torque, etc.
Potential wheel performance was quantified using a numerical scale with respect
to potential failure due to events, such as temperature fluctuation, wheel-rock
impact, excess payload and abrasive wear.
The best designs were the Apollo 17 wire mesh wheel (historical) and the
iRing wheel (McGill). A reliability checklist for lunar wheel designs is given to
serve as a guideline to avoid unreliable design features.
The visual inspection technique was successful and can be applied to other
complex systems where experimental testing under actual conditions is not
possible, although background knowledge and expert opinion are necessary to
perform an evaluation.

iv
RÉSUMÉ
Cette thèse présente une méthodologie pour la prédiction de la fiabilité des
roues lunaires, et une technique pour évaluer la fiabilité de la conception de ces
roues, pour lesquelles les données d‘opération dans l‘environnement lunaire ne
sont pas disponibles, afin que nous puissions effectuer une analyse de fiabilité
traditionnelle.
La distance maximale traversée par le Rover Lunaire durant la mission
Apollo 17 était d‘environ 35.9 km. Aujourd‘hui, l‘Université de McGill, le groupe
Neptec Design et l‘Agence Spatiale Canadienne travaillent ensemble afin de
développer une roue de Rover Lunaire pouvant être opérationnelle pendant 5 ans.
Cela souligne l‘importance de la fiabilité des roues, qui auront à traverser des
milliers de kilomètres.
Le groupe Neptec Design a réussi à développer une méthodologie afin
d‘estimer la fiabilité d‘un rover lunaire, comme nous le montre le document
Prédiction de Fiabilité de Rover Lunaire (PFRL) qui a été publié par l‘entreprise.
Cette méthodologie comprend deux phases. Phase 1 contient trois étapes incluant
les recherches approfondies concernant les différents modèles de fiabilité
disponibles, les outils logiciels spécifiques qui permettent la mise en place de ces
modèles, et l‘habilité à adapter ces outils à l‘environnement lunaire (par exemple,
la température, la présence de régolite, les radiations, l‘apesanteur). Les résultats
ont démontré que Relex fourni une série d‘outils logiciels fortement intégrés afin
d‘exécuter un groupe de modèles de fiabilité (AMDEC [analyses des modes de
défaillance , de leurs effets et de leur criticité], AAP [analyses par arbres de
pannes], la prévisions de standards, TVA [tests de vieillissement accéléré]). Le
logiciel de simulation de mission s‘est avéré être un ajout intéressant, et GoldSim
est apparu comme le meilleur choix pour fournir une analyse de simulation de
mission.

v
La Phase 2 décrit le processus d‘estimation de la fiabilité du rover lunaire pour
une durée de 5 ans sur la Lune, basé sur les recommandations détaillées dans la
Phase 1. Le PFRL a été un succès mais Neptec est seulement capable d‘utiliser
des données earthbound pour la méthodologie, ce qui est insuffisant.
Donc, le domaine de l‘usure à la cryogénie à été exploré à travers la
littérature et les bases de données, et le résumé des éléments qui ont été relevés
intéressants est le suivant : le taux d‘usure de l‘acier et du titane à 293K et 77K
sont à peu près les mêmes, en dessous de 1m/s ; le taux d‘usure à 77K en dessous
de 1m/s est plus haut pour la plupart des matériaux et le coefficient de frottements
pour l‘acier sur l‘acier à 77K et 273K est à peu près le même. Les informations
mentionnées ne sont pas suffisantes pour estimer la fiabilité de la conception des
roues de rover lunaire sous les conditions environnementales lunaires. Cela
souligne la nécessité d‘une méthodologie alternative, par exemple, la technique
d‘inspection visuelle, pour évaluer la fiabilité d‘un système quand des données
utiles ne sont pas disponible.
La technique d‘inspection visuelle est décrite et une analyse de 9
conceptions de roues (cinq anciennes roues et quatre nouvelles roues conçues par
l‘Université de McGill) est démontrée. Les conceptions des roues sont analysées
visuellement en fonction de critères spécifiques, sans négliger les risques d‘échec
potentiels si l‘on transpose aux conditions lunaires (température, aspiration, et
régolites), la fiabilité mécanique, sans oublier les obstacles à la performance, la
résistance à l‘usure, la compatibilité thermale, la vitesse de chargement, la torsion,
etc. Une échelle numérique a été créée et la performance potentielle de la roue a
été quantifiée en prenant compte des évènements pouvant causer un échec comme
les fluctuations de températures, le soudage à froid, les impacts de rochers, un
excès de charge et une usure abrasive.
Les résultats ont indiqué que la meilleure conception historique était la
roue à treillis métallique d‘Apollo 17 et que la meilleure conception
contemporaine est la roue iRing. L‘exposé donne aussi une ―liste de conception

vi
pour la fiabilité‖, qui peut potentiellement servir de guide afin d‘éviter les traits de
conceptions avec des failles.
La technique d‘inspection visuelle a été un succès et peut être appliquée à
d‘autres systèmes complexes où les tests expérimentaux dans les conditions
actuelles ne sont pas possibles. Cependant, des connaissances préliminaires et
une expertise sont nécessaires afin de mettre en place l‘évaluation.

vii
ACKNOWLEDGEMENTS
This research would not have been feasible without the help and constant support
of many people. First, I would like to thank my research supervisor, Professor
Vincent Thomson for providing me this amazing opportunity to work on such an
interesting subject that was related to the planetary exploration rovers. His
constant guidance, support and positive attitude throughout the course of this
project were invaluable and helped me to gain knowledge of the research.
A special thanks to my co-supervisor, Professor Peter Radziszewski for his
support and guidance throughout my Master studies.
I gratefully acknowledge Chris Bell from the Neptec Design Group for
sharing Neptec‘s work on the reliability methodology for a lunar rover, Mohamad
Farhat and Alan Robins from the Canadian Space Agency for their constant
guidance throughout my research work, and Professor Helmi Attia for his
guidance and expert opinion on cryogenic wear.
I am indebted to the help and assistance of my colleagues: Nima Gharib,
Michele Faragalli and Daniel Oyama for their assistance and feedback.
I would also like to express my love to my family and friends for the
unconditional support and endless love and encouragement.

viii
TABLE OF CONTENTS
ABSTRACT ........................................................................................................... ii
RÉSUMÉ .............................................................................................................. iv
ACKNOWLEDGEMENTS ............................................................................... vii
LIST OF FIGURES .............................................................................................. x
LIST OF TABLES .............................................................................................. xii
1. INTRODUCTION ............................................................................................. 1
1.1 Purpose of the Thesis ................................................................................................... 1
1.2 Objective and Thesis Outline..................................................................................... 2
2. RELIABILITY METHODOLOGY ................................................................ 5
2.1 Background Research and Literature Review .................................................... 5
2.1.1 Reliability Techniques ....................................................................................................... 6
2.2 Introduction .................................................................................................................... 9
2.3 LRRP – Phase 1 ............................................................................................................... 9
2.4 LRRP – Phase 2 ............................................................................................................ 13
2.4.1 Introduction........................................................................................................................ 13
2.4.2 Lunar Rover Reliability Process ................................................................................. 13
2.4.2.1 Conceptual Phase ...................................................................................................................... 14
2.4.2.1.1Procedure ............................................................................................................................. 15
2.4.2.2 Preliminary Phase ..................................................................................................................... 21
2.4.2.2.1 Procedure ............................................................................................................................ 21
2.4.2.3 Critical Phase ............................................................................................................................... 25
2.4.2.3.1 Procedure ............................................................................................................................ 25
3. CRYOGENIC WEAR .................................................................................... 29
4.VISUAL INSPECTION TECHNIQUE ......................................................... 33
4.1 Introduction ................................................................................................................. 33
4.2 Design feature failure analysis .............................................................................. 34
4.2.1 Wheel 1 ................................................................................................................................. 35
4.2.2 Wheel 2 ................................................................................................................................. 38
4.2.3 Brushed Wheel .................................................................................................................. 39
4.2.4 iRing Wheel ......................................................................................................................... 41
4.3 Detailed Analysis ........................................................................................................ 43

ix
4.4 Comparative Evaluation of Different Wheel Designs .................................... 61
5. DISCUSSION .................................................................................................. 63
6. CONCLUSION AND RECOMMENDATIONS .......................................... 65
REFERENCES .................................................................................................... 67

x
LIST OF FIGURES
Figure 2.1 ‐ Design Stages Versus Reliability Model Usage ............................. 11
Figure 2.2 – Reliability flow diagram legend ....................................................... 14
Figure 2.3 - Conceptual Design and Reliability Flow Chart................................. 15
Figure 2.4 - Conceptual design system tree .......................................................... 16
Figure 2.5 - Conceptual design expert failure rate ................................................ 16
Figure 2.6 - Conceptual design heritage failure rate sources ................................ 17
Figure 2.7 - Conceptual design base failure rate ................................................... 17
Figure 2.8 - Conceptual design factor classification ............................................. 19
Figure 2.9 - Conceptual design material properties .............................................. 19
Figure 2.10 - Conceptual design BFR Adjustment ............................................... 20
Figure 2.11 - Preliminary design and reliability flow chart .................................. 22
Figure 2.12 - Preliminary design vendor/manufacturer information .................... 23
Figure 2.13 - Critical design and reliability flow chart ......................................... 26
Figure 3.1 – Wear rate of a 45 steel pin (a) and microhardness at the pin friction
surface (b) versus sliding velocity in vacuum at 293K and 77K [Ostrovskaya et
al., 2001] ............................................................................................................... 31
Figure 3.2 – Coefficient of friction versus the number of cycles for SUS316L-
SUS316L. [Iwabuchi et al., 1989]........................................................................ 32
Figure 4.1 - Wheel 1 images showing (a) complete wheel, (b) metal overlap, (c)
bolted edge, (d) welds, (e) grouser ........................................................................ 36
Figure 4.2 - Wheel 2 images showing (a) complete wheel, (b) spring edges, (c)
bolted edge ............................................................................................................ 38
Figure 4.3 – Brushed wheel images showing (a) complete wheel, (b) bristles, (c)
Deformed plastic rim with pin .............................................................................. 40
Figure 4.4 – iRing wheel images showing (a) complete wheel, (b) different
materials bolted, (c) broken chainmail, (d) bolts in the carbon fibre rim, (e) torn
sandwiched chainmail ........................................................................................... 41

xi
Figure 4.5 - Early LRV wheels. (a) Lunokhod wheel, (b) Pneumatic MET wheel,
(c) Grumman wheel, (d) Apollo wire mesh wheel, (e) Bendix hoop spring wheel.
............................................................................................................................... 44

xii
LIST OF TABLES
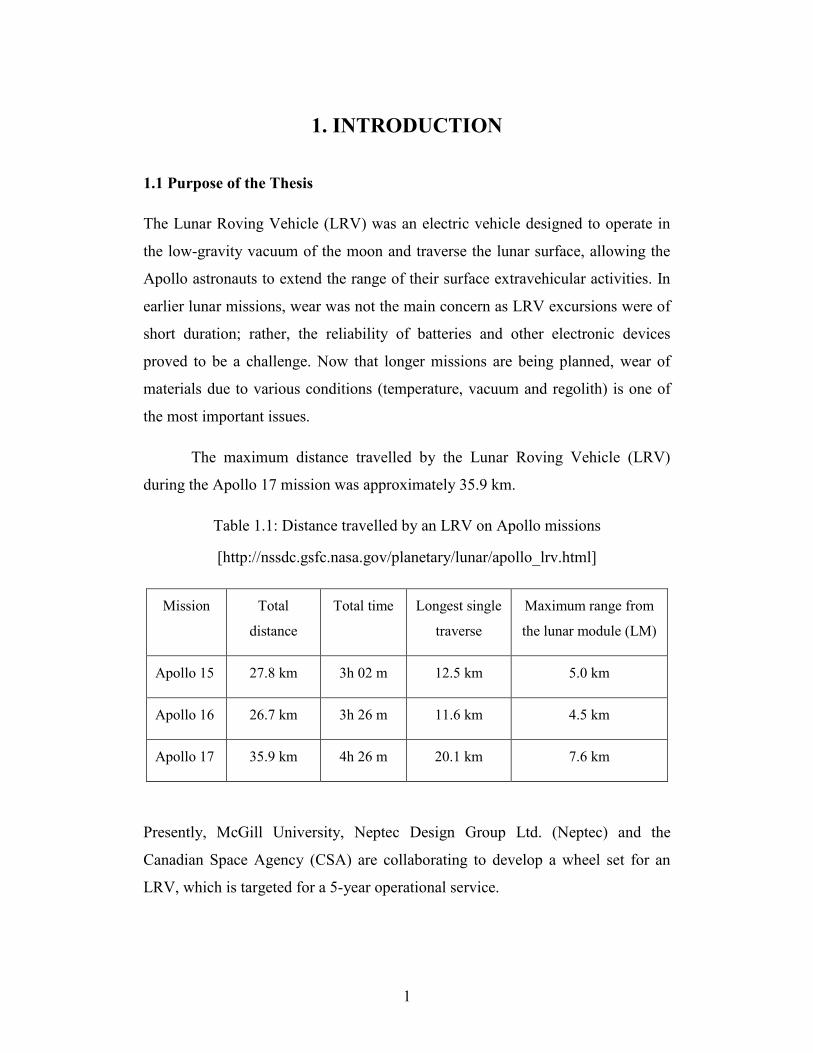
Table 1.1: Distance travelled by an LRV on Apollo missions................................ 1
Table 2.1 Matrix for Reliability Techniques ........................................................... 9
Table 2.2: Software Selection Matrix‐Overview ............................................... 12
Table 3.1: Friction coefficient under different cooling conditions ....................... 30
Table 4.1: Wheel failure modes and conditions causing failure ........................... 35
Table 4.2: Ratings for different wheels according to the events considered ........ 43
Table 4.3: Wheel comparison ............................................................................... 62
1
1. INTRODUCTION
1.1 Purpose of the Thesis
The Lunar Roving Vehicle (LRV) was an electric vehicle designed to operate in
the low-gravity vacuum of the moon and traverse the lunar surface, allowing the
Apollo astronauts to extend the range of their surface extravehicular activities. In
earlier lunar missions, wear was not the main concern as LRV excursions were of
short duration; rather, the reliability of batteries and other electronic devices
proved to be a challenge. Now that longer missions are being planned, wear of
materials due to various conditions (temperature, vacuum and regolith) is one of
the most important issues.
The maximum distance travelled by the Lunar Roving Vehicle (LRV)
during the Apollo 17 mission was approximately 35.9 km.
Table 1.1: Distance travelled by an LRV on Apollo missions
[http://nssdc.gsfc.nasa.gov/planetary/lunar/apollo_lrv.html]
Mission Total
distance
Total time Longest single
traverse
Maximum range from
the lunar module (LM)
Apollo 15 27.8 km 3h 02 m 12.5 km 5.0 km
Apollo 16 26.7 km 3h 26 m 11.6 km 4.5 km
Apollo 17 35.9 km 4h 26 m 20.1 km 7.6 km
Presently, McGill University, Neptec Design Group Ltd. (Neptec) and the
Canadian Space Agency (CSA) are collaborating to develop a wheel set for an
LRV, which is targeted for a 5-year operational service.

2
The LRV will be used to set up a lunar research station, for which it will
have to carry the materials to and from the landing site to the place where the
station will be set up. It will also be used to collect samples and to allow the
survey of the area near the station. As seen from earlier missions, the LRV had to
travel a total maximum distance of 36 km (approx.) within a span of few days.
Hence, we can imagine how much it will have to travel in a span of 5 years. This
underlines the importance of the reliability of the LRV and in turn the reliability
of the wheels, which will be required to travel thousands of kilometres.
1.2 Objective and Thesis Outline
The thesis objectives include
a background study on the prediction of reliability,
choosing the best methods for estimating reliability given the specific task
at hand, and
estimating the reliability of several wheel designs (determining key design
parameters and obtaining the best estimates of reliability from various
sources).
We believe that the greatest reliability problem faced by a lunar rover is to survive
the wear from the many kilometers of travel on the moon. This wear is due to
metal rubbing on metal or most likely, metal wearing against lunar regolith, where
metal is preferable to plastics or composites in high wear situations and where the
survivability of wheels is the greatest problem.
Neptec Design Group has developed a methodology to estimate the
reliability of a lunar rover, i.e., Lunar Rover Reliability Prediction (LRRP), where
the project was divided into two phases.
The LRRP Phase 1 was divided into three distinct milestones, which
included, background research of the various reliability models currently
available, the specific software tools that execute these models, and the ability to

3
adapt these tools to account for lunar environmental factors, e.g., temperature,
regolith, vacuum, radiation, and low gravity. Phase 2 outlined the process for
estimating the reliability of a lunar rover for a 5-year operational life on the Moon
based on the recommendations detailed in Phase 1.
Design consists of a conceptual, a preliminary and a detailed phase. The
conceptual phase consists of developing the description of the lunar rover and its
expected operating environment, and then creating competing conceptual designs
based on the desired features. The preliminary phase focuses on breaking down
systems into their specific components and gathering data about these
components. The critical phase involves, implementing the final design changes
to optimize for design considerations, such as weight, strength, power, as part of
meeting the overall mission objectives. The reliability methodology that was
developed in phase 2 was tailored for use with each design phase.
The reliability methodology requires data to estimate the reliability. This
means that the experimental conditions need to be similar to those on the lunar
surface such as perfect vacuum, temperature at 40K and in the presence of
regolith. Hence, the area of cryogenic wear was explored, literature and databases
were reviewed, and some useful results were found, but still the available
information in the literature is not enough to estimate the reliability of wheel
designs.
Hence, to have a comparison of different lunar rover wheel designs and
evaluate their reliability, a ―visual inspection technique‖ was developed. It is an
alternative technique that can be used when data for operation in the lunar
environment are not available in order to conduct traditional reliability analysis.
The technique is demonstrated using five historical wheels and four new
wheels designed by students at McGill University. The wheel designs were
visually analyzed according to specific criteria with respect to potential failure
under lunar conditions (temperature, vacuum and regolith) considering
mechanical reliability, obstacle avoidance; wear resistance, thermal compatibility,

4
excess loading and torque. A numerical scale was created and potential wheel
performance was quantified with respect to potential failure causing events, such
as temperature fluctuation, cold welding, wheel-rock impact, excess payload and
abrasive wear.
The outcome of the visual inspection technique is a reliability checklist for
wheel designs, which can potentially serve as a guide to avoid unreliable design
features.
This thesis consists of six chapters. This chapter serves as an introduction
and presents the objective and outline of the thesis. Chapter 2 covers the
reliability methodology. Chapter 3 presents the literature review on cryogenic
wear. Chapter 4 presents the visual inspection technique. Then, Chapter 5
discusses the reliability checklist for design of lunar rover wheels. Chapter 6
concludes the thesis and gives recommendations for future work.

5
2. RELIABILITY METHODOLOGY
2.1 Background Research and Literature Review
One of the objectives of this thesis is to develop a methodology to estimate the
reliability of lunar rover wheel designs. Hence, literature and databases were
reviewed for available techniques to estimate reliability. The following
observations were found.
There is some generic information available about important aspects to be
considered for a detailed reliability study of structures for the moon [Benaroya,
1994]. This gives an idea of how any lunar structure can be designed and built
with the following prime considerations: gravity, dust, vacuum, etc.
The paper by Durmaz et al. [2011] contains some relevant information on
detailed considerations for reliability, which have to be taken into account during
design lifecycle of space systems. Two different approaches were used for the
reliability program. One of these approaches was based on qualitative techniques,
which required deep knowledge about the potential failure mechanisms and
modes of the current design. Some qualitative techniques included Failure Modes
Effects and Criticality Analysis (FMECA) and Fault Tree Analysis (FTA) [also
mentioned by (O‘Connor, 1991)]. The second approach was quantitative and
based on part failure rates, reliability prediction techniques and Reliability Block
Diagrams (RBD‘s). Quantitative techniques included the use of reliability
databases, like the Military Handbook [MIL‐ HDBK‐ 217F, 1991], Electronic
Parts Reliability Data (EPRD) [EPRD, 1997] and Non Electronic Parts Reliability
Data (NPRD) [NPRD, 1995] to estimate base failure rates of standard components
[O‘Connor, 1991]. After obtaining the failure rates for each component, a
system‘s overall probability for a specified mission performance in a given
mission time was determined by constructing RBD‘s.

6
There are different approaches used for parametric reliability models, for
example, historical data, operational life testing, burn-in testing, accelerated life
testing (ALT). Moreover, statistical distributions are used for mechanical
reliability, for example, Exponential, Rayleigh, Weibull, Lognormal, Gamma
distribution. [Elsayed, 1996]
A different approach is used for reliability modeling, which is done in
three steps: model selection, parameter estimation, and validation. The initial
stages of a reliability modeling process begins with a qualitative model, for
example, a block diagram that displays the structure of the product as a system
(parts and components and their interconnection). Next, probabilities are assigned
to the blocks. Finally, evaluating the assigned probabilities validates the model.
This can be done in various ways depending on the stage in the product life cycle
and the information available. Different tools can be used in the design stage to
identify failures and their consequences, for example, failure modes and effects
analysis (FMEA), failure modes and effects and criticality analysis (FMECA) and
fault tree analysis (FTA). [Blischke et al., 2003]
2.1.1 Reliability Techniques
The definitions of the reliability techniques referred to in this thesis are given in
this section.
Accelerated Life Testing (ALT) – It is a method to predict reliability by
conducting real life experiments to observe the failure of components in a
controlled environment. Often the testing is "accelerated" by increasing the
severity of one or more factors to induce failures more quickly and then
extrapolate the results back to the conditions in the actual environment.
[Jacques et al., 2009]
Bayesian method - It is a statistical approach in which all forms of uncertainty are
expressed in terms of probability. The premise of Bayesian statistics is to
incorporate prior knowledge, along with a given set of current observations, in
order to make statistical inferences. It is an iterative approach and provides a

7
framework for combining prior information with sample data. For each
iteration, the initial distribution is called the prior probability, whereas the
modified distribution is called the posterior probability.
[http://www.cs.toronto.edu/~radford/res-bayes-ex.html,
http://www.weibull.com/LifeDataWeb/bayesian_statistics.htm]
Bottom Up - This method uses the concept of establishing the life distribution for
the reliability of each component and builds up the reliability for components
that are in series/parallel with each other to arrive at a single node that
represents the entire system with one reliability value. [Jacques et al., 2009]
Change Point Analysis (CPA) - It is used to examine changes, if any, that have
taken place in a series of time ordered data. The purpose is to identify and
prioritize the key reliability risk items and their corresponding risk reduction
strategy. [http://www.reliasoft.com/newsletter/v8i2/reliability.htm]
Event Tree – This analysis uses a forward logic to provide an inductive approach
to reliability assessment. It is a graphical representation of the logic model that
identifies and quantifies the possible outcomes following an initiating
event. [http://www.eventtreeanalysis.com]
Failure Mode and Effects Analysis (FMEA) – It examines the effects of lower
level failures to facilitate the identification of potential problems in the design
or process. [http://www.fmea-fmeca.com]
Failure Modes and Effects Criticality Analysis (FMECA) – It is an extension of
FMEA, focusing on the quantitative parameters to assign a criticality to each
probable failure mode. [http://www.mtain.com/relia/relfmeca.htm]
Fault Tree Diagram (FTD) – It is a graphical design technique used to visually
display and evaluate failure paths in a system. It uses logic block diagrams to
display the state of a system (top event) in terms of the states of its components
(basic events). [http://www.weibull.com/basics/fault-tree/index.htm]

8
Finite Element Analysis (FEA) – It is used to analyze a design for not only stress
from applied loads, but also thermal induced loads, vibration, shock, fatigue.
[Jacques et al., 2009]
Markov Method - It builds a network of components and systems with
interactions and takes into account the time-based reliability of the system.
[Jacques et al., 2009]
Naval Surface Warfare Center (NSWC) – It is a handbook that includes equations
for standard mechanical components (springs, pumps, cylinders, bearings). It
uses a base laboratory failure rate (established under controlled conditions) and
modifies it based on different environmental factors (e.g., corrosion rate,
temperature, pressure, shock, etc.). It is used to estimate the failure rate of
mechanical components. [Jacques et al., 2009]
Reliability Block Diagram (RBD) - This performs a system reliability and
availability analysis on large and complex systems using block diagrams to
show network relationships. The structure of a RBD defines the logical
interaction of failures within a system that are required to sustain system
operation. [http://www.reliabilityeducation.com/rbd.pdf]
Reliability Growth Analysis (RGA) – It is used to generate the improvements in
product reliability by assessing the actual field data being gathered through
failures. [Jacques et al., 2009]
Tree model - It is used to structure a design into functional blocks that can be
studied for interactions/relationships and how different failure modes can affect
the overall reliability, e.g., Fault Tree, Event Tree, and Reliability Block
Diagrams (RBD‘s). [Jacques et al., 2009]

9
Table 2.1 Matrix for Reliability Techniques
Criteria Physical
Testing
Failure
Analysis
Graphical
Representation
Data
Handbook Reliability
Techniques ALT
Bayesian
Bottom Up
CPA
Event Tree
FMEA
FMECA
FTD
FEA
Markov
NSWC
RBD
RGA
Tree Model
2.2 Introduction
After conducting a literature survey and reviewing databases, it was decided that
developing a new technique to estimate reliability was not necessary since there
were plenty of very good methods readily available.
As part of the collaborative project with CSA and Neptec,1 the work on
reliability by Neptec design group was closely followed. The methodology they
developed was very rigorous and detailed, and is presented below.
2.3 LRRP – Phase 1
MacLean Engineering and Marketing Co. Ltd (MacLean) was sub‐ contracted by
Neptec to complete Phase 1 [Jacques et al., 2009] of the Lunar Rover Reliability
Prediction (LRRP) project as part of the overall contract provided through CSA.
1 As part of the collaboration between McGill University, Neptec and CSA to
develop a wheel set for an LRV, reliability of wheel designs was my
responsibility.

10
The objectives of phase 1 included identification of industry trends to
estimate reliability and development of a list of the methods that offer the
combination of qualitative and quantitative assessments needed to evaluate
proposed designs and to assess the adaptability of the methods to the lunar rover
environment (temperature, dust, etc.).
Phase 1 was divided into three distinct milestones:
‐ Milestone 1 outlined the identification of suitable reliability models used in the
industry and a high-level baseline methodology based on that research.
‐ Milestone 2 outlined the comparison and selection of specific software used to
execute the reliability models identified in milestone 1 and further evolved the
reliability methodology.
‐ Milestone 3 outlined the opportunities to directly or indirectly adapt the
software for lunar environment factors.
Several existing reliability models were identified at milestone 1. They are
Bayesian Method
Failure Modes and Effects
Analysis
Finite Element Analysis
Fault Tree Diagram
Reliability Block Diagram
Bottom Up Analysis
Accelerated Life Testing
Reliability Growth Analysis
Milestone 1 results were presented within the context of three distinct lunar rover
development stages (concept, preliminary, critical). Each potential model was
compared against a set of common criteria that were each weighted according to
their relative importance at a given development stage. Some reliability models
were appropriate for all stages, some only for specific stages, and others that did
not fit well for any stage. Also, a flow diagram depicting the three development

11
stages and the corresponding reliability models for each was prepared (see Figure
2.1).
Model scored above average for a given design stage. It should be considered as a
primary tool.
Model scored about average for a given design stage. It should be considered as a
secondary tool.
Model scored below average for a given design stage. It should not be considered.
(Legend for Fig. 2.1 and Table 2.1)
Figure 2.1 ‐ Design Stages Versus Reliability Model Usage
At milestone 2, each software package was broken up into separate modules and
was compared to its peers against a set of common criteria where each criterion
was weighted based on its level of importance. The result is shown in table 2.1.

12
The best score is identified in green while the second best score is
identified by yellow for each model. A score of "0" indicated that the software
package did not contain a module that covered the given reliability model being
evaluated.
Milestone 2 results demonstrated that Relex provided a strong package of
fully integrated software tools to execute a group of reliability models (FMEA
[Failure Modes and Effects Analysis], Fault Tree, standards prediction, ALT
[Accelerated Life Testing]). GoldSim was considered to be the best choice to
provide mission simulation analysis, which was identified to be a worthwhile
addition to the models identified at Milestone 1. GoldSim provided greater
flexibility and power to model both the lunar rover and its surrounding
environment in the pursuit of establishing the 5-year operating life behaviour.
At milestone 3, each of the software modules identified at milestone 2 was
reviewed with respect to how/where it could be adapted to account for lunar
environment factors (e.g. temperature, regolith, radiation, low gravity).
Table 2.2: Software Selection Matrix‐ Overview
Model Weight Relex Reliasoft Isograph Item Reliass GoldSim Winbugs
Bayesian
2 32 0 0 0 0 0 40
Standards
Prediction
3 63 46 49 58 57 0 0
FMEA
1 44 38 44 29 26 0 0
Fault Tree
2 53 46 52 47 43 0 0
Mission
Simulation
3 52 45 45 50 0 59 0
ALT 3 46 49 31 0 0 0 0
Sum Product Total 697 550 523 447 283 177 80

13
2.4 LRRP – Phase 2
2.4.1 Introduction
Phase 2 [Bell at al., 2010] outlined the process to estimate the reliability of a lunar
rover for a 5-year operational life on the Moon.
This phase included the use of the reliability models recommended in
Phase 1, i.e., identification and adaptation of specific lunar and operational
environment factors in the methodology to define an overall process for
evaluating reliability.
The procedure and associated tools to carry out the reliability prediction
for each of the three phases (conceptual, preliminary, and critical) is presented. A
spreadsheet tool assists with entering much of the raw data that are required when
using the tools recommended in Phase 1.
2.4.2 Lunar Rover Reliability Process
The legend below identifies each symbol found in the flow diagrams.

14
Figure 2.2 – Reliability flow diagram legend
2.4.2.1 Conceptual Phase
During the conceptual phase the earliest portrait of the lunar rover and its
expected operating environment are developed. In terms of design, competing
conceptual designs based on desired features/performance criteria are created.
This starts by breaking the lunar rover into its basic systems or modules, each of
which has their own role to play in the overall design and may have unique
reliability expectations.
Qualitative and estimation based tools are used to arrive at an early
prediction result during the conceptual phase. As per Phase 1, the most applicable
tools during this development phase are FMECA [Failure modes, effects and
criticality analysis], Fault Tree, and Standards Prediction (all within the Relex
suite of tools). FMECA results can be used to identify the most probable failure
modes that need consideration when selecting a prediction model in later stages of
the process. Fault Tree can assist in developing the GoldSim model to reflect how
the systems/components are connected and affect one another. Standards
Prediction can provide a coarse failure rate estimate using peer group databases or
default value parameters.
Secondary tools include Bayesian, ALT, and Simulation. Bayesian can be
used with WinBUGS (statistical software for Bayesian analysis) to aid in
predicting overall failure rates using available data. ALT is a means of conducting
tests to obtain further data to refine predictions, but is often found to be cost
prohibitive at the Concept phase. GoldSim can be used to conduct simulation.

15
2.4.2.1.1Procedure
Figure 2.3 - Conceptual Design and Reliability Flow Chart
Create System Tree
This activity should be carried out during the conceptual stage; however, it is
ultimately uploaded into Relex to carry out subsequent analysis. Within the
system tree the basic parameters, e.g., part number, quantity, category, etc. of the
system or component are defined. The green headings in the System Tree section
are common with Relex and are uploaded directly into the corresponding field

16
within that program. A snapshot of the System Tree section of the spreadsheet is
shown below.
Figure 2.4 - Conceptual design system tree
Current State of Knowledge
This section is used to determine the level of knowledge already available about
the system or component including vendor/manufacturer information, expert
knowledge, and any heritage design knowledge. With sufficient information, it is
possible to define a Base Failure Rate (BFR) for the system or component at the
conclusion of this section.
The Expert Failure Rate section allows the reliability team to enter any
available failure rate data and assign an error factor representing the uncertainty in
the data. An overall mean failure rate is calculated based on this data following a
WinBUGS script found within section 4.11.2 of the NASA Probabilistic Risk and
Reliability Analysis report (hereafter referred to as the NASA PRRA report)
[http://www.hq.nasa.gov/office/codeq/doctree/SP2009569.pdf]. A snapshot of this
section of the spreadsheet is shown below.
Figure 2.5 - Conceptual design expert failure rate

17
The Heritage Failure Rate section allows the reliability team to enter any available
data from past missions and assign a degree of applicability to the lunar rover
application. The overall failure rate is calculated using a WinBUGS script found
within Section 4.11.3 of the NASA PRRA report. A snapshot of this section of the
spreadsheet is shown below.
Figure 2.6 - Conceptual design heritage failure rate sources
At the conclusion of this section the reliability team has assessed the currently
available knowledge for the system/component being considered. During the
conceptual phase the lunar rover design takes on numerous configurations; thus,
this section may need to be repeated several times to compare results.
Base Failure Rate and Overall Failure Rate
After assessing the existing knowledge about the lunar rover systems/components,
the reliability team must consider the available models and techniques to gain
further insight and determine the BFR that is assigned for subsequent reliability
analysis. A snapshot of this section is shown below.
Figure 2.7 - Conceptual design base failure rate

18
The two forms of existing failure rate and error factor data that may have been
available from the Current State of Knowledge section are copied across into this
section.
The next section requires the reliability team to select the primary and
secondary models to make a prediction of the failure rate. This can include any of
the available Relex calculation models along with ALT or Bayesian. There is an
associated error factor that needs to be estimated to go along with the predicted
failure rate.
The overall BFR is calculated using the same WinBUGS script as found in
the NASA PRRA report. From this script the mean failure rate along with the
5th/95th percentile values and error factors can be calculated, which define the
probability distribution for the failure rate.
At the conclusion of this section the reliability team has established a BFR
value for each system/component and for each configuration being considered.
They also have the probability distribution surrounding this failure rate, which
establishes the range of error associated with the BFR. This result after lunar and
operational factor adaptation is used in subsequent analysis using Relex (mean
failure rate) and GoldSim (failure rate distribution).
Lunar and Operational Factor Adaptation
This section is used to identify and quantify the adjustment value of the factors for
both lunar and operational environments.
At first, the factors and the associated failure modes need to be classified.
Also, care should be taken not to include factors that have already been accounted
for in some other manner (e.g., BFR may have been based on data already heavily
dominated by the factor, thus making adaptation unnecessary). The team must
decide if the factor is being considered as a constant or is based on a distribution
of values. 5th and 95th percentile values for the factor have to be estimated so that

19
a probability distribution can be created later in GoldSim. A snapshot of this
section is shown in Figure 2.8.
Figure 2.8 - Conceptual design factor classification
Based on the factors being considered, their associated component material
properties are reviewed. Maximum and minimum ratings, the error factor for the
ratings, and any data/curves that relate the property to the factor can be entered. A
snapshot of this section is shown in Figure 2.9.
Figure 2.9 - Conceptual design material properties
The final step to be taken by the reliability team is to perform the analysis
required to estimate the adjustment that needs to be made to the BFR as it relates
to the selected factor. A snapshot of this section is shown in Figure 2.10.
The degree of error associated with that value should also be considered.
Using the same WinBUGS script used earlier, the overall BFR adjustment value
along with its 5th and 95th percentile values to define probability distribution for
use in GoldSim can be calculated.
The result from this exercise is a value greater than 1 if the BFR needs to
be increased while being exposed to the factor, and less than 1 if the BFR needs to

20
be decreased. If the distribution is wide enough to represent the adjustment value,
GoldSim can be programmed to select a value from that distribution instead of the
mean value.
Figure 2.10 - Conceptual design BFR Adjustment
At the conclusion of this section, the reliability team has determined the
adjustment value required to adapt the BFR to compensate for the effects of the
lunar/operational factor(s) that need to be considered. This adaptation is required
during subsequent GoldSim simulations.
Conceptual Results
Upon completion of this stage the reliability team has the elements needed to
carry out further analysis using the Relex and GoldSim programs.
Relex permits the lunar rover to be analyzed by either the base failure rates
only or by the adjusted failure rates based on a single mission profile. It can allow
the reliability team to observe the overall failure rate for the lunar rover and the
failure rates of the underlying subsystems and components as defined in the
system tree. The team can also use the allocation feature in Relex to choose a
desired reliability and allocation across the subsystems/components and to
observe the required failure rate compared to the calculated failure rate. This is
useful during this phase more than the later phases.
GoldSim places the lunar rover into the modeled lunar environment along
with multiple mission profiles for tasks, durations, and frequencies. As it proceeds
through 5 years of life it switches between different mission profiles and the
corresponding lunar/operational conditions, and automatically draws upon the
21
adjustment value to modify the BFR of a system/component. The results from this
analysis include the reliability prediction to survive the 5-year life along with root
cause charts that isolate the systems/components exhibiting the highest degree of
failure.
Analysis using Relex and GoldSim yields the first prediction of the lunar
rover reliability during its 5-year operational life. It may prove useful to conduct a
Strengths, Weaknesses, Opportunities, Threats (SWOT) analysis on the results
obtained thus far in order to observe where the lunar rover exhibits reliability
strength, weakness, opportunities, and threats.
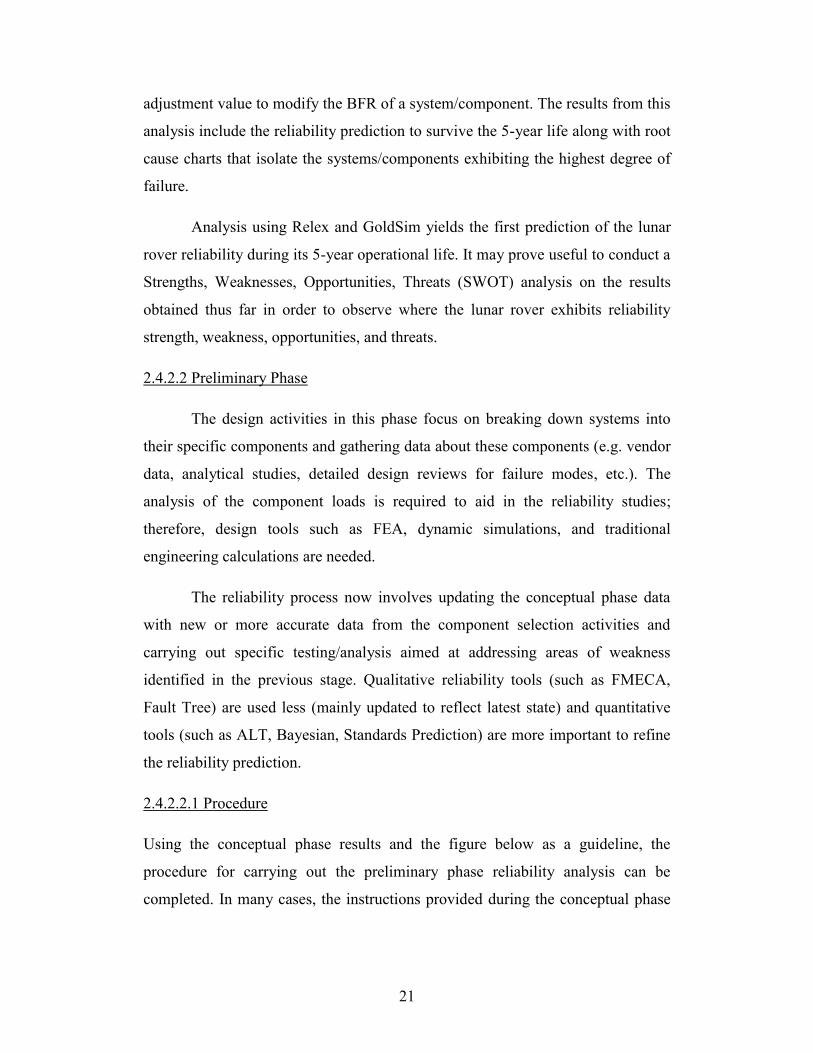
2.4.2.2 Preliminary Phase
The design activities in this phase focus on breaking down systems into
their specific components and gathering data about these components (e.g. vendor
data, analytical studies, detailed design reviews for failure modes, etc.). The
analysis of the component loads is required to aid in the reliability studies;
therefore, design tools such as FEA, dynamic simulations, and traditional
engineering calculations are needed.
The reliability process now involves updating the conceptual phase data
with new or more accurate data from the component selection activities and
carrying out specific testing/analysis aimed at addressing areas of weakness
identified in the previous stage. Qualitative reliability tools (such as FMECA,
Fault Tree) are used less (mainly updated to reflect latest state) and quantitative
tools (such as ALT, Bayesian, Standards Prediction) are more important to refine
the reliability prediction.
2.4.2.2.1 Procedure
Using the conceptual phase results and the figure below as a guideline, the
procedure for carrying out the preliminary phase reliability analysis can be
completed. In many cases, the instructions provided during the conceptual phase

22
are the same for this phase and are not repeated in detail. New instructions or
changes in the approach are noted.
Figure 2.11 - Preliminary design and reliability flow chart
Update System Tree
Returning to the original spreadsheet, the system tree parameters are updated to
reflect any decisions made during the conceptual phase for the systems or
components. There may be a need for additional levels to be structured into the
spreadsheet as systems are now replaced with a more defined set of components
(e.g., A gearbox system is now replaced by housings, bearings, shafts, gears.).
Current State of Knowledge
Preliminary Design Flow Diagram Preliminary Reliability Flow Diagram
Outputs
Part Derating Curves
Redundancy Needs
Worst Offenders
Uncertainty Analysis
Prelim Design Review
Outputs
Material Selection
FMECA
(Update Failure
Modes)
Fault Tree
(Updated)
Failure Rate Model
Selection (Confirm)
Bayesian
(New Data)
Simulation
(Refined)
Standards
Prediction
(Refined)
Update System
Tree
ALT
(New Data)
Affirm
Preliminary
Design &
Calculate loads versus ratings
Perform FEA analysis
Gather available vendor life data
List Possible
Components
and Data
List Mission
Phases and
Tasks
Determine duty cycle per tasks
Determine exposure to factors
Determine failure criteria
Team review of
design and
operating specs
Affirm
Preliminary
Reliability Specs
Team review
of reliability
specs
Update
Reliability
Specs
See MIL-HDBK-
338B Section 7.2.2

23
This vendor/manufacturer section of the spreadsheet now has more merit as the
specific components and corresponding vendors/manufacturers are more clearly
known. A snapshot of this section is shown in Figure 2.12.
Figure 2.12 - Preliminary design vendor/manufacturer information
The resulting error factor represents the degree of confidence in the
vendor/manufacturer regarding accuracy in any potential failure rate data they
may have provided. This is used in subsequent estimation of the BFR for the
component. An error factor of 5 represents an average degree of confidence, while
higher values represent less confidence and lower values represent more
confidence.
Expert and Heritage Failure Rate data may or may not become more
abundant. Base failure rates of systems may now be replaced by the underlying
component failure rates if they are available. With new data potentially available
from the vendor/manufacturer (at least in the form of an updated error factor), the
WinBUGS script calculation for the Expert Failure Rate needs to be repeated.
Base Failure Rate Models and Overall Failure Rate
This section of the spreadsheet is updated to reflect the updated system tree
content. As specific components take the place of systems, the exercise of
selecting the best-fit prediction models may become more direct, e.g., Naval
Surface Warfare Center (NSWC) Mechanical Calculation Model [NSWC, 2009]
is available to analyze a wide variety of mechanical components although it is not
tailored towards complete systems. As updated information is entered, the

24
WinBUGS script is re-implemented to establish the updated mean failure rate
along with its probability distribution.
Lunar and Operational Factor Adaptation
The adaptation section for the updated system tree content and operating/exposure
profiles is carried out.
The previous adaptation is expected to include the need for a fairly wide
range of error on systems/components due to an absence of firm definition for the
components, materials, and loads. In this phase, the conceptual results from
GoldSim are reviewed to determine where the greatest sources of reliability
concerns arose. The team can proceed with gathering more firm data to either
reduce the range of error, and thus, improve the reliability prediction, or make
other changes to the component selection to reduce the nominal failure rate or
both.
Preliminary Results
Upon completion of this phase another round of analysis using the Relex and
GoldSim programs can be conducted. The design and reliability teams need to
engage in a series of iterations to try and improve the results as best they can with
the data available.
In terms of design, the lunar rover is refined past the realm of functional
systems/components into the realm of specifically selected components that are
expected to fulfill the performance and design goals. Detailed design features
such as material selection, structural analysis, and dynamic simulations of the
lunar rover movements compliment the reliability results.
In terms of reliability, the results from Relex and GoldSim are more
comprehensive and based on a greater level of knowledge. This may not result in
an improvement in the reliability prediction, especially if the conceptual reliability
phase was based on a tendency to overestimate the performance of the
25
components. It should however be a more realistic result that can further direct the
team towards the primary sources of unreliability and uncertainty.
2.4.2.3 Critical Phase
The design activities in the critical phase focus on implementing the final
design changes to the lunar rover to optimize for design considerations, such as
weight, strength, power, as part of meeting the overall mission objectives. For
this, sources of unreliability have to be removed and redundancy added where
required or both. Final selection of components and close relations with suppliers
is also important during this phase.
The reliability activities continue based on the Relex and GoldSim results
from the previous phase and further collection of failure data from all available
sources has to be undertaken. It is expected that ALT will play a larger role in this
phase as the component selection becomes more certain and the need for final
data tailored to these components increases. GoldSim is expected to be the more
dominant program over Relex when it comes to making the final reliability
calculations, since it is critical to model the full mission profiles and lunar
environment in a dynamic manner over the 5-year operating life. Relex remains
an important model when it comes to using its prediction tools for calculating
component failure rates.
2.4.2.3.1 Procedure
Using the preliminary phase results and the figure below as a guideline, the
procedure for carrying out the critical phase reliability analysis can be completed.
Once again, only new or differences in past instructions are provided in this
phase.
26
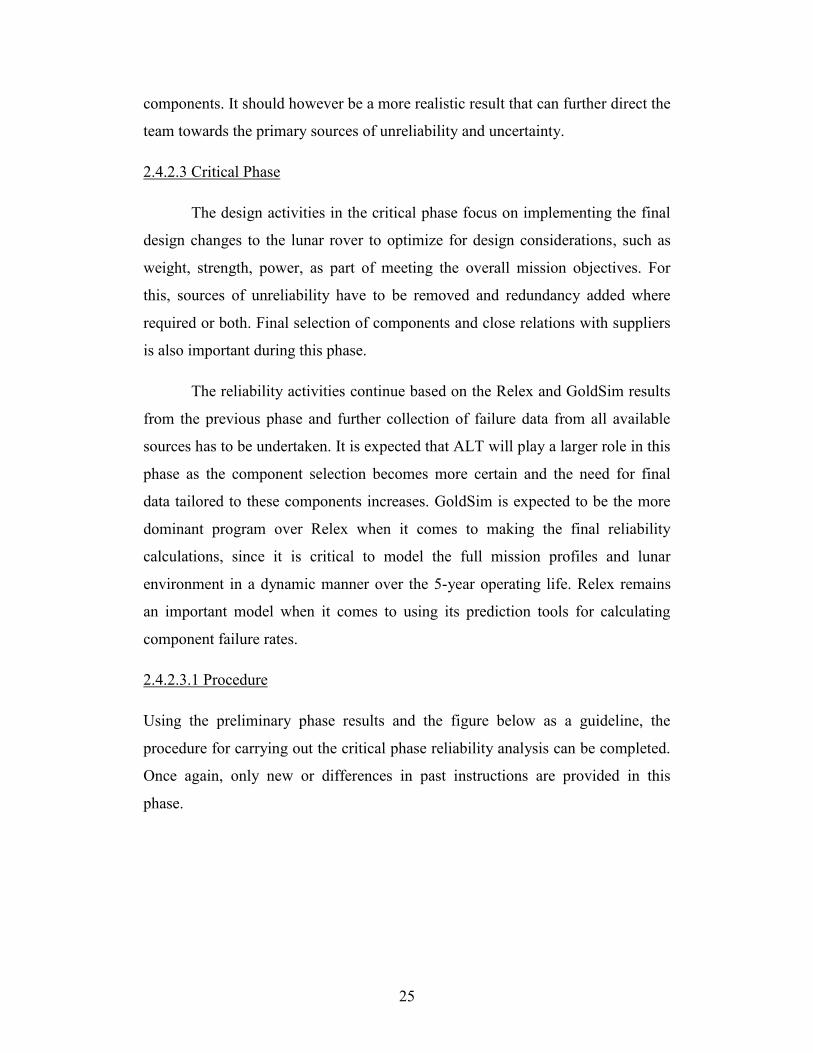
Figure 2.13 - Critical design and reliability flow chart
Update System Tree
The system tree parameters are updated to reflect any decisions made during the
preliminary phase for the systems or components. Final component parameters,
redundancy, and any other design changes must be updated.
Current State of Knowledge
Critical Design Flow Diagram Critical Reliability Diagram
Vibration Protection
NDE Inspection
Dust Protection
Production Reliability
Burn In Testing Plan
Critical Design Review
Outputs Outputs
Source Final
Components FMECA
(Update Failure
Modes)
Fault Tree
(Updated)
Failure Rate
Model Selection
(Confirm)
Bayesian
(New Data)
Simulation
(Refined)
Standards
Prediction
(Refined)
Update System
Tree
ALT
(New Data)
Choose Final
Design &
Operation Specs
Check loads versus ratings
Check FEA analysis
Finalize vendor life data
Final Mission
Phases and
Tasks
Determine duty cycle per tasks
Determine exposure to factors
Determine failure criteria
Team review of
design and
operating specs
Choose Final
Reliability Specs
Team review
of reliability
specs
Update
Reliability
Specs

27
This section of the spreadsheet is updated to reflect the latest state of knowledge
of the system/components. Expert and heritage data may or may not become more
abundant. Final selections and audits of vendors/manufacturers may result in a
change in the assessed error factor. The overall mean failure rate and its
associated probability distribution should be re-calculated with any newly
acquired information.
Base Failure Rate and Overall Failure Rate
This section of the spreadsheet is updated to reflect the system tree content. The
latest state of knowledge of the system/component is considered alongside any
further data determined through updates to the failure rate models or new data
collected via models such as ALT or Bayesian. The final BFR value and
distribution is calculated and used in the Critical Phase application of Relex and
GoldSim.
Lunar and Operational Factor Adaptation
The adaptation section for the updated system tree content and operating/exposure
profiles is carried out. The latest data from vendors, testing, and other sources
have to be used to make the most accurate adjustments to adapt to lunar factors.
The range of error approach should still be used to represent the degree of
confidence in the adaptation.
Critical Results
Upon completion of the updates to the spreadsheet, the final analysis using the
Relex and GoldSim programs is carried out. After the first set of results are
obtained the design and reliability teams have to engage in a series of iterations to
try and make those final few improvements until the desired reliability goal is
reached.
In terms of design, the final lunar rover product can be produced on paper
to release for prototype build. The components order can be placed to the
suppliers best able to meet both the design and reliability objectives.

28
In terms of reliability, a prediction of the lunar rover reliability over the 5-
year operational life can be made with the confidence level of that prediction.
Overall, the presented reliability methodology represents a step-by-step
sequence of reliability activities with relation to the corresponding design tasks.
There is no silver bullet solution to the challenge of predicting the reliability of
the lunar rover. It requires an iterative process, exhaustive search for available
data, detailed calculations and testing, and use of many tools to examine the
failure rates and resulting reliability.

29
3. CRYOGENIC WEAR
The greatest reliability problem faced by a lunar rover is to survive the wear from
the many kilometers of travel on the moon. This wear is due to metal rubbing on
metal or most likely, metal wearing against lunar regolith, where metal is
preferable to plastics or composites in high wear situations and wheel reliability is
the greatest problem.
The reliability methodology as explained in section 2 requires data to
estimate wheel reliability. This means that experimental conditions need to be
similar to those on the lunar surface, such as perfect vacuum, temperature at 40K
and in the presence of regolith. Hence, previous research on cryogenic wear was
explored, and literature and databases were reviewed. The observations are as
follows:
Wear depends on:
material characteristics (crystal structure, surface conditions) which are a
function of temperature, and
the environment (humidity, vacuum).
The former determines material hardness, whereas with the latter care must be
taken when doing experiments on earth to correctly replicate lunar environments;
for example, a 2% relative humidity (very, very low) acts as a significant lubricant
and can lead to incorrect interpretation of results [Burris, 2008]. Thus, vacuum
conditions, which are usually replicated on earth by a helium environment, are
important due to the possible presence of humidity.
The following areas of research were found.
1. Hardening of cutting tool steel by quenching at 77K, i.e., metal placed into
liquid nitrogen for many hours after hardening and before tempering [Das et
al., 2008].

30
▫ This treatment significantly hardens some metals.
▫ Most research has been done on high-speed tool steel; however, similar
results have found for stainless steel and magnesium, but not carbide steel.
▫ No work on aluminum was found.
▫ The quenching process creates finer material microstructure in metal, and
results in higher surface hardness and better wear properties.
▫ Although not directly of interest for the present project, it may be of interest
in building a more wear resistant lunar rover.
2. A jet spray of liquid nitrogen between the work piece and cutting tools is an
effective lubricant. Although of no direct interest to this project, it is one area
of cryogenic research, and is a caution against employing testing methods done
in a bath of liquid gas (nitrogen, helium) that may compromise results due to a
lubricating effect. [Hong, S., (2006)]
Table 3.1: Friction coefficient under different cooling conditions

31
3. There are adhesives that work very well at cryogenic temperatures [Roseland,
1967].
4. There is not much published research on the wear of materials (mostly metallic)
at cryogenic temperatures before 1994. (The fall of Berlin wall was in 1989.
Most research at cryogenic temperatures is due to space programs in the USA
and USSR (Russia)). Nevertheless, even after 1994 there are few publications.
5. Summary of relevant findings: The wear rate of steel and titanium at 293K and
77K are about the same below 1m/s; the wear rate at 77K above 1m/s is lower
for most materials. The figure below is typical of many materials.
Figure 3.1 – Wear rate of a 45 steel pin (a) and microhardness at the pin friction
surface (b) versus sliding velocity in vacuum at 293K and 77K [Ostrovskaya et
al., 2001]
6. There has been a great deal of research on the wear of coatings to improve the
wear of metals. The reason for this is the use of metals subject to wear in
rockets, which use both liquid hydrogen and liquid oxygen as fuel. In general,
coatings help, where some are better than others. Note that coatings should

32
have the same coefficient of expansion as the base material; otherwise, at low
temperature, wear mechanisms tear off the coating. Coatings do not survive
well at wear speeds of 2 m/s or higher. [Hubner et al., (1997)]
7. Coefficient of friction for steel on steel at 77K and 273 K is about the same.
Figure 3.2 – Coefficient of friction versus the number of cycles for SUS316L-
SUS316L. [Iwabuchi et al., 1989]
The information available in the literature provided some interesting results as
well as precautions to be taken while conducting experiments, but was insufficient
to evaluate wear rate of materials at lunar conditions. Also, there was not enough
information to be used in the reliability methodology to evaluate LRV reliability
under lunar environmental conditions. This underlines the necessity for an
alternative methodology, for instance, the visual inspection technique that is
described in the next section.

33
4.VISUAL INSPECTION TECHNIQUE
4.1 Introduction
Visual inspection is a common method of quality control, which, when used in
maintenance of facilities, means inspection of equipment and structures using
one/or all of human senses such as vision, hearing, touch and smell
[http://en.wikipedia.org/wiki/Visual_inspection]. Automated visual inspection is
widely used in different industries, for example, sub-sea inspection techniques are
used for offshore steel structures [Baker et al., 1999], inspection of electric lamp
caps [Thomas et al., 1994], visual inspection of printed circuit boards, IC chips,
semiconductor photomasks, automobile parts, fabric and other electrical
assemblies, and inspection in the metal processing industry, lumber industry and
food processing industry. [Chin, 1982].
Automated visual inspection techniques need a large investment and are
specific to the task performed. Non-automated techniques need less investment,
but still require high expertise.
A new visual inspection technique was developed to estimate the
reliability of lunar wheel designs since test data under lunar conditions were not
available. The objective of visual inspection is to identify weak design features,
which have a high potential for failure when subjected to a particular
environment. The technique consists of two steps: design feature failure analysis
and quantitative estimation of reliability using the detailed analysis. These steps
setup the basis for a comparative evaluation of all wheels, presented in section
4.4.
For the evaluation of wheels for an LRV, four wheels designed by students
at McGill University, namely, Wheel 1, Wheel 2, Brush Wheel and iRing Wheel,
were inspected according to their design features for potential failure under lunar
conditions, such as terrain, temperature, vacuum, regolith, excess loading, and

34
torque. Specific design features of each wheel were evaluated. Results for the
design feature failure analysis are given in Table 4.1, followed by an explanation
of the analysis.
Five historical wheels were also analyzed in addition to the four wheels
designed by McGill University in the second step, i.e., detailed analysis. The
historical wheels included, Lunokhod Rigid Rim Wheel, Pneumatic Wheel,
Grumman Spiral Spring Wheel, Apollo Wire Mesh Wheel and the Bendix Hoop
Spring Wheel. These wheels could not be analyzed using design feature failure
analysis due to a lack of design data.
A quantitative estimation of reliability was done for all nine wheels with
regard to events like temperature fluctuation, cold welding, wheel-rock impact,
abrasive wear, etc., each of which has the potential to cause wheel failure.
The final step is the comparative evaluation, where all wheel designs were
rated relatively on a scale of 0 to 10 with 0 being the least reliable and 10 being
the most reliable. Design feature failure analysis and detailed analysis helped to
form a basis for the ratings presented in this section.
4.2 Design feature failure analysis
Table 4.1 summarizes the design feature failure analysis. The analysis is
demonstrated using the 4 wheels designed by students at McGill University.

35
Table 4.1: Wheel failure modes and conditions causing failure
Wheel 1 Wheel 2 Brush Wheel iRing Wheel
Parts
Al grousers
Al rim (centre)
Spring steel wheel
Bolts/nuts
Al rim
Spring steel springs
(V-shaped)
Machined steel
tracks
Pins/bolts
Al rim (centre)
Plastic rim
Nylon bristles
Screws/pins
SS chain mail filled
with polypropylene
balls
Carbon fibre/SS rim
Bolts/nuts
External
Conditions Failure Modes
Temper-
ature and
Vacuum
Cold welding
CTE mismatch
Expansion of Al
CTE mismatch
Expansion of rim:
failure of bristles
CTE mismatch: rim
deformation
Cold welding of
chainmail links
CTE mismatch:
failure of bolts/nuts
& cracks in the rim
Regolith Abrasive wear at
particular spots
Abrasive wear on
springs and
bolts/nuts
Bristle wear
Abrasive wear may
loosen pin
Abrasive wear of
chain mail
Lunar
Terrain
Grouser and side
wall edge
deformation
Spring wall/edge
deformation ----------
Sandwiched chain
mail rings can
break.
Internal
Conditions Failure Modes
Excess
Loading
Crack initiation in
springs
Grouser distortion
Crack initiation in
springs ---------- ----------
Downward
Force
Crack initiation in
springs
Grouser distortion
Crack initiation in
springs ---------- ----------
Side Force
(inclined
surface)
Traction problems
Failure: bolts/nuts
Stress on welds
Traction problem:
(no grousers), the
wheel can slip
Traction problem:
wheel can slip
Chain mail corner
links can break.
Axle
Torque
Stress on welds
Failure: bolts/nuts ----------
Cracks
Deformation: rim
Stress on
sandwiched
chainmail links
Al- Aluminium; S.S- Stainless Steel; CTE- Coefficient of Thermal Expansion
4.2.1 Wheel 1
Components
Aluminium Grousers
Aluminium rim
Spring steel wheel
Aluminium Bolts and nuts

36
(a) (b) (c) (d) (e)
Figure 4.1 - Wheel 1 images showing (a) complete wheel, (b) metal overlap, (c)
bolted edge, (d) welds, (e) grouser
External Conditions
Temperature and Vacuum
1. Cold Welding is a phenomenon where, two clean, flat surfaces of
similar metal can strongly adhere if brought into contact under vacuum.
[http://en.wikipedia.org/wiki/Cold_welding#In_space].
The overlapped spring steel as shown in Figure 4.1(b) can become cold-
welded causing brittleness and decreasing the springiness of steel. The load
bearing capacity of the wheel can also be reduced which can cause crack
initiation.
2. Coefficient of Thermal Expansion (CTE) Mismatch: recurring temperature
fluctuations cause continuous expansion and contraction, and because of
different CTE (aluminium and spring steel), the fasteners (bolts/nuts) can over
tighten or loosen causing fatigue failure (Figure 4.1(c)).
3. Thermal Expansion of Aluminium: temperature fluctuations cause the rim to
expand and contract in both linear and radial directions. The spot welds at the
centre of the rim as shown in Figure 4.1(d) can be broken causing the inner
ring to wobble resulting in wheel failure.
As shown in Figure 4.1(e), relative thermal expansion of aluminium
grousers in the linear direction can cause welds to crack and grousers to break
resulting in decreased traction and wheel failure.

37
Regolith
4. Abrasive wear: the surface of the wheel that is in contact with the regolith
during rotation (Figure 4.1(a)) undergoes more abrasive wear than the other
areas of the wheel. The surface material of Wheel 1 is spring steel, and Wheel
1 has a large ‗footprint‘, both of which enhance durability. The grousers can
wear out decreasing traction. Regolith can easily get into the gap between the
metal sheets shown in Figure 4.1(b) causing high levels of abrasive wear.
Lunar Terrain
5. Grouser and side wall edge deformation: the rover has to travel through uneven
lunar terrain, which can cause grousers to deform. The sidewall edges of the
wheel and the edges of the inner springs can be deformed when the wheel hits
rocks. The presence of regolith between the outer surface of the wheel and the
inner surface of the grousers can accelerate abrasive wear.
Internal Conditions
Excess loading
6. Excess loads beyond the designed loading condition can initiate cracks in the
springs. Excess loading may also cause grouser deformation.
Forces on the wheel
7. Force on the axle (downward or Z-direction force): the force due to the load on
the wheel (weight of the vehicle + added load) can create cracks in the springs
if the force exceeds the design value, causing wheel failure. This force can also
cause the grousers to deform or flatten out which can reduce traction.
8. Lateral force (on an inclined surface): when the rover is moving on an inclined
surface, there can be traction problems (gripping) since the grousers are
perpendicular to the wheel direction. Further, the lateral force acts upon the
aluminium rim and the spring, causing failure of bolts and nuts and resulting in

38
welds at the centre of the rim to break. A lateral force can have the same effect
on the welds that join the grousers to the outer surface of the wheel.
9. Torque from the axle (produces longitudinal force): the axle attached to the
centre of the rim moves the wheel forward/backward while rolling; this creates
a force which can cause failure of the welds. This can also cause failure of the
bolts and nuts joining the springs to the rim.
4.2.2 Wheel 2
Components
Aluminium rim
Spring steel springs (V shape)
Machined steel tracks
Al pins/bolts
(a) (b) (c)
Figure 4.2 - Wheel 2 images showing (a) complete wheel, (b) spring edges, (c)
bolted edge
External Conditions
Temperature
1. CTE Mismatch: recurring temperature fluctuations can cause the fasteners
(bolts) to over tighten or loosen because of the different CTE‘s (aluminium and
spring steel), causing fatigue failure.
Regolith

39
2. Abrasive wear: regolith can get into particluar spots (see fig. 4.2 (b&c))
between the two springs and also between the outer surface of the aluminium
rim and the lower part of the spring causing abrasive wear. This can decrease
the load carrying capacity of the springs and loosen the fasteners.
Lunar Terrain
3. Spring wall/Edge deformation: while traveling through the uneven lunar
terrain, the curved wall or the edges of spring steel springs can be deformed
due to impact with rocks. If a rock gets trapped between the two springs or
inside the springs (see fig. 4.2 (c)), cracks can initiate causing a reduction in the
load carrying capacity of the springs.
Internal Conditions
Excess loading condition
4. Excess loads beyond the designed loading condition can initiate cracks in the
springs decreasing the load carrying capacity of the wheel.
Forces on the wheel
5. Force on the axle (downward or Z-direction force): the force due to the load on
the wheel (weight of the vehicle + added load) can create cracks in the springs
if the force exceeds the design value, causing wheel failure. This force can also
cause a reduction in the load carrying capacity of the wheel.
4.2.3 Brushed Wheel
Components
Al rim (centre)
Plastic rim
Nylon bristles
Aluminium Screws/Pins

40
(a) (b) (c)
Figure 4.3 – Brushed wheel images showing (a) complete wheel, (b) bristles, (c)
Deformed plastic rim with pin
External Conditions
Temperature
1. Thermal Expansion of plastic rim: recurring temperature fluctuations cause the
plastic rim to expand and contract causing the nylon bristles to loosen, which
can fall out causing traction problems (see fig. 4.3 (b)).
2. CTE Mismatch: continuous temperature fluctuations cause continual expansion
and contraction causing plastic deformation of plastic trim due to different
CTE‘s (aluminium pin and plastic rim (see Figure 4.3 (c)). This can also make
the pin loose causing it to fall out.
Regolith
3. Abrasive wear: the nylon bristles are always covered in regolith and regolith
can get into the space where the bristles are attached to the outer plastic rim
(see fig. 4.3 (b)), causing slow, but continuous wear. This can cause them to
loosen and fall out which can reduce traction.
Due to the differential expansion and contraction of the aluminium pin and
the plastic rim, space can be created for regolith to settle in and cause
continuous abrasive wear. This can reduce the pin thickness causing it to
loosen and fall out.
Internal Conditions

41
Forces on the wheel
4. Lateral force (on an inclined surface): when the rover is moving on an inclined
surface, traction will be less due to the bristles, which are in a single direction
only.
5. Torque from the axle (produces longitudinal force): the axle attached to the
centre of the rim forces the wheel to move forward/backward while rolling.
This force can displace the pin in case it becomes loose, and may even fall out.
This force can also cause cracks or even plastic deformation of the rim (see fig.
4.3 (c)).
4.2.4 iRing Wheel
Components
Stainless steel chain mail
Polypropylene plastic balls
Aluminium Nuts/bolts
Carbon fibre/Stainless steel
rim
(a) (b) (c) (d) (e)
Figure 4.4 – iRing wheel images showing (a) complete wheel, (b) different
materials bolted, (c) broken chainmail, (d) bolts in the carbon fibre rim, (e) torn
sandwiched chainmail
External Conditions
Temperature and Vacuum
1. Cold welding: the chainmail links have the potential to get cold welded to each
other causing them to become brittle and break which can cause the balls to fall
out.

42
2. CTE Mismatch: continuous temperature fluctuations cause continual expansion
and contraction (in radial direction), which can cause fatigue failure of
fasteners (nuts/bolts) due to over tightening or loosening, because of different
CTE‘s (carbon fibre and stainless steel) (see fig. 4.4 (b)).
3. Thermal Expansion of Aluminium (nuts/bolts): differential expansion and
contraction of aluminium bolts and nuts and carbon fibre rim (see fig. 4.4 (d))
can initiate cracks, which may propagate throughout the rim.
Regolith
4. Abrasive wear: the area inside the chain mail is always filled with regolith,
which means that the polypropylene plastic balls as well as the chain mail are
always in contact with regolith, which can cause slow, but continuous abrasive
wear of the links. This can break the links creating a hole (as shown in fig. 4.4
(c)) through which the balls can fall out.
Lunar Terrain
5. While travelling through the uneven lunar terrain if a rock hits the corner where
the chainmail is sandwiched between the outer red rim (as shown in fig. 4.4
(b)) the chain mail can break.
Internal Conditions
Forces on the wheel
6. Lateral force (on an inclined surface): when the rover is moving across an
inclined surface, the inclined force acting downwards can increase the stress at
the sandwiched chainmail links which can break (see fig. 4.4 (e)).
7. Torque from the axle (produces longitudinal force): the axle attached to the
centre of the rim moves the wheel forward/backward while rolling; this creates
a force which can increase stress on the sandwiched chainmail links which can
break causing the balls to fall out (see fig. 4.4 (e)).

43
4.3 Detailed Analysis
This analysis serves to compare the four McGill wheels and the five historical
wheels. Different events related to the external environment and the mechanical
design have been considered and a relative comparison is done to quantify the
behaviour of the wheels under each possible event using sound engineering
judgement. I considered the seriousness of possible failure modes and gave a
rationale for all wheels for every event considered, which is noted in the
following pages.
The analysis is summarized in Table 2, where relative reliability is on a
scale of 0-5 with 0 indicating the least chance of failure and 5 the most.
Table 4.2: Ratings for different wheels according to the events considered
Chance (probability) of wheel failure Relative Reliability Scale: 0 – 5; 0 – Min
probability; 5- Max probability.
Events Wheel
1
Wheel
2
Brushed
Wheel
iRing
Wheel
Lunokhod
Wheel
Pneumatic
Wheel
Spiral
Spring
Wire Mesh
Wheel
Hoop
Spring
Temp.
fluctuation 3.5 1 2 1.5 2.5 4 2 1 1.5
Cold
welding 2 0 0 0.5 0 0 1 0.5 1
Wheel-
rock
impact
3 2 0 1.5 2.5 4.5 2.5 0 1.5
Excess
payload 2.5 2 0 0 2 4.5 2 0 1
Abrasive
wear 3.5 2 2 3 2 4 2.5 1.5 2.5

44
Historical Lunar Roving Vehicle (LRV) Wheels
(a) (b) (c) (d) (e)
Figure 4.5 - Early LRV wheels. (a) Lunokhod wheel, (b) Pneumatic MET wheel,
(c) Grumman wheel, (d) Apollo wire mesh wheel, (e) Bendix hoop spring wheel.
Lunokhod Rigid Rim Wheel (Luna 17, Nov 1970; Luna 21, Jan 1973) (see fig. 4.5
(a))
Rigid, wire carcass connected by spokes [Asnani et al, 2009a].
Pneumatic Modularized Equipment Transporter (MET) Wheel (Apollo 14, Feb
1971) (see fig. 4.5 (b))
Rubber carcass supported by nitrogen filled inner tube (10.3 KPa) [Asnani et
al, 2009a].
Grumman Mobile lunar Laboratory (MOLAB-1964) Spiral Spring Wheel
[Radziszewski et al, 2010] (see fig. 4.5 (c)).
Wire Mesh Wheel (Apollo 15, 16 and 17) [Asnani et al, 2009b] (see fig. 4.5 (d))
Standard music spring wires woven into an elastic mesh.
Titanium inner frame attached to a spun aluminium hub and Titanium
chevrons riveted on the tyre to aid traction.
A 25.5 inch diameter bump stop, between the wire mesh and the hub, to
protect the hub in case the wire mesh was to deform excessively.
Bendix Hoop Spring Wheel [Asnani et al, 2009b] (see fig. 4.5 (e))

45
Titanium outer band and hoop spring elements pinned (riveted) to the inner
aluminium hub.
A bump stop to limit the deflection of the hoop springs.
Rigid aluminium hub with spokes and a sand paper like grit to increase
thrust.
Events
1. Cyclic temperature fluctuation between 100 K and 400 K
Possible failures to look for
Coefficient of thermal expansion (CTE) mismatch.
Failure of bolts, nuts, rivets (fasteners) and/or welds due to expansion and
contraction.
Plastic deformation of the metal or plastic because different materials are
involved.
Crack initiation and propagation.
Grouser failure.
Chance of wheel failure Relative Reliability Scale: 0 – 5; 0 – Min.; 5- Max.
Wheel 1 Wheel 2 Brushed Wheel iRing Wheel
Chance of failure 3.5 1 2 1.5
Lunokhod
Wheel
Pneumatic
Wheel
Spiral Spring
Wheel
Wire Mesh
Wheel
Hoop Spring
Wheel
Chance of
failure
2.5 4 2 1 1.5

46
Wheel 1
Nuts/Bolts can fail due to different CTE‘s (aluminium and spring steel).
Welds at the centre of the rim can break due to expansion and contraction of
aluminium rim in radial and linear direction.
Grouser welds can break due to differential expansion and contraction of
aluminium and spring steel.
Seriousness
Failure of nuts/bolts can result in a decrease in load carrying capacity of the
springs.
Failure of welds at the centre of the rim can result in power loss from the axle
to the rim.
Failure of grousers can result in a decrease in traction.
Wheel 2
Bolts can fail due to different CTE‘s (Aluminium and Spring Steel).
Seriousness
Failure of nuts/bolts can result in a decrease in load carrying capacity of the
springs.
Brushed Wheel
Nylon bristles can fall out due to the expansion and contraction of plastic rim.
Plastic deformation of plastic rim due to different CTE‘s (aluminium pin and
plastic rim).
Seriousness
47
Failure of nylon bristles can result in a decrease in traction especially when
the rover is moving on an inclined surface.
Plastic deformation of the rim can make the pin loose and it may fall out
creating problems in transmission of torque from the axle to the rim.
iRing Wheel
Nuts/bolts can fail due to different CTE‘s (carbon fibre and stainless steel
rim/plate).
Crack initiation and propagation in the carbon fibre rim due to different
CTE‘s (carbon fibre and steel rim (or aluminium) nuts/bolts).
Seriousness
Since there are many nuts/bolts, failure of one or two may not cause a major
effect, but failure of many can cause a decrease in power transmission from
the axle to the wheel and/or wheel failure.
Once cracks start to initiate in the carbon fibre rim, they can propagate
throughout the rim causing the rim to fail completely.
Lunokhod Rigid Rim Wheel
The screws connecting the grouser and spokes to the outer rim can become
loose because of CTE mismatch.
Seriousness
Failure of screws can cause the grousers to loosen which can cause traction
problems.
Failure of spokes can result in a decrease in the load carrying capacity of the
wheel.
Pneumatic (MET) Wheel

48
The rubber tube can be displaced from the rim due to continuous differential
expansion and contraction of the rim and the rubber.
Seriousness
Once the rubber tube is displaced from the rim, it can become flat and the
wheel can no longer work.
Grumman Spiral Spring Wheel
Failure of the thin curved metallic spokes.
Seriousness
If the curved spokes become loose or are displaced from their position, there
can be a decrease in the load carrying capacity of the wheel.
Wire Mesh Wheel
Rivets can become loose because of CTE mismatch between the aluminium
hub and the titanium chevrons.
Seriousness
Loosening of rivets results in loosening of titanium chevrons. This can cause
a reduction in the load carrying capacity of the wheel due to the reduction in
springiness of the inner titanium frame.
Bendix Hoop Spring Wheel
Pins (rivets) can become loose due to CTE mismatch between the aluminium
hub and the titanium hoop springs.
Seriousness
If the rivets fail, the hoop springs can become loose which can decrease the
load carrying capacity of the wheel.
2. Cold welding

49
Possible failures to look for
Cold welding of all/any mating similar metal surfaces.
Chance of wheel failure Relative Reliability Scale: 0 – 5; 0 – Min.; 5- Max.
Wheel 1 Wheel 2 Brushed Wheel iRing Wheel
Chance of failure 2 0 0 0.5
Lunokhod
Wheel
Pneumatic
Wheel
Spiral Spring
Wheel
Wire Mesh
Wheel
Hoop Spring
Wheel
Chance of
failure
0 0 1 0.5 1
Wheel 1
Overlapped spring steel sheet on the outer surface can become cold-welded.
Seriousness
This can make the spot brittle which can decrease the springiness of the
spring steel springs. Also the load carrying capacity of the wheel can
decrease resulting in crack initiation.
Wheel 2
No problem with cold welding.
Seriousness
--------------
Brushed Wheel
No problem with cold welding.
Seriousness

50
--------------
iRing Wheel
Chainmail links can become cold-welded.
Seriousness
Once the links get cold-welded, there is no free movement of the links. This
will make them brittle and the links can break easily causing the balls to fall
out.
Lunokhod Rigid Rim Wheel
No problem with cold welding.
Seriousness
-----------
Pneumatic (MET) Wheel
No problem with cold welding.
Seriousness
-----------
Grumman Spiral Spring Wheel
If the curved spokes and the outer shell are made of the same material, they
can become cold-welded.
Seriousness
If the spokes become cold-welded, cracks can initiate and propagate
throughout the width of the spoke, which can also reduce the load carrying
capacity of the wheel.
Wire Mesh Wheel

51
Overlapped titanium riveted chevrons (on the tire) can become cold-welded.
Seriousness
This can cause the chevrons to crack or break which can result in a minor
reduction in traction.
Bendix Hoop Spring Wheel
The point where the titanium hoop spring connects with the titanium outer
band can become cold-welded.
Seriousness
The welded point can become brittle and cracks can initiate in the hoop
springs.
3. Obstacle Performance - The wheel hitting a rock 100 times
Possible failures to look for
Grouser deformation
Spring, spokes, side wall/edge deformation
Broken links (chain mail)
Chance of wheel failure Relative Reliability Scale: 0 – 5; 0 – Min.; 5- Max.
Wheel 1 Wheel 2 Brushed Wheel iRing Wheel
Chance of failure 3 2 0 1.5
Lunokhod
Wheel
Pneumatic
Wheel
Spiral Spring
Wheel
Wire Mesh
Wheel
Hoop Spring
Wheel
Chance of
failure
2.5 4.5 2.5 0 1.5

52
Wheel 1
Edges of the inner springs and outer wheel made of spring steel can be
deformed.
Grousers can be deformed or may even flatten out.
Seriousness
Deformation of inner springs and/or the outer wheel can result in crack
initiation, which can propagate throughout the width of the spring. This can
reduce the load carrying capacity of the wheel.
Grouser deformation can result in decreased traction. This can cause
problems in gripping the surface especially when the rover is moving on an
inclined surface because the grousers are in a single direction.
Wheel 2
Deformation of the inner spring wall/edge.
Seriousness
Deformation of the spring edge can cause cracks to initiate. These cracks can
propagate throughout the width of the spring resulting in a decrease in load
carrying capacity of the wheel.
Brushed Wheel
No problem with obstacles.
Seriousness
---------------------------------
iRing Wheel
Sandwiched chain mail links can break.

53
Seriousness
Since there are many links at the chain mail rim interface, breakage of a few
links/springs may not matter much, but, if many links close to each other
break, the balls inside the wheel can fall out causing problems with the
normal functioning of the wheel.
Lunokhod Rigid Rim Wheel
Grousers can deform or crack.
Spokes can bend or break.
Seriousness
Deformation of grousers can result in a decrease in traction.
Bending or breakage of spokes can result in a decrease in load carrying
capacity of the wheel.
Pneumatic (MET) Wheel
The rubber tire can be punctured.
Seriousness
Once the rubber is punctured the entire wheel can fail.
Grumman Spiral Spring Wheel
Curved spokes can bend or break.
Seriousness
Bending or breakage of spokes can result in a decrease in load carrying
capacity of the wheel.
Wire Mesh Wheel
No problem with obstacles.

54
Seriousness
-------------
Bendix Hoop Spring Wheel
Hoop springs and/or the outer titanium band can be deformed.
Small pieces of rocks can get stuck in between the hoop springs.
Seriousness
Deformation of the side wall/edge of the hoop springs or the outer band can
result in crack initiation. This can propagate throughout the width of the
springs/band causing a decrease in load carrying capacity of the wheel.
If small pieces of rock get trapped in between the hoop springs, the
springiness can decrease which can also cause cracks to initiate.
4. Wheel with excess payload
Possible failures to look for
Crack initiation and propagation in the springs/rim/outer part of the wheel
Grouser deformation
Bending of spokes or spoke breakage
Chance of wheel failure Relative Reliability Scale: 0 – 5; 0 – Min.; 5- Max.
Wheel 1 Wheel 2 Brushed Wheel iRing Wheel
Chance of failure 2.5 2 0 0
Lunokhod
Wheel
Pneumatic
Wheel
Spiral Spring
Wheel
Wire Mesh
Wheel
Hoop Spring
Wheel
Chance of
failure
2 4.5 2 0 1

55
Wheel 1
Crack initiation in the springs.
Grouser deformation.
Seriousness
Excess loads can cause cracks to initate resulting in a decrease in load
carrying capacity of the spring. Failure of a majority of the springs can cause
complete wheel failure.
Excess loads can also cause grouser deformation resulting in reduced
traction.
Wheel 2
Crack initiation in the springs.
Seriousness
Excess loads can cause cracks to initate resulting in a decrease in load
carrying capacity of the spring. Failure of a majority of the springs can cause
complete wheel failure.
Brushed Wheel
No effect.
Seriousness
-------------
iRing Wheel
No problem with excess loads.
Seriousness

56
------------
Lunokhod Rigid Rim Wheel
Spokes can bend, crack or break.
Seriousness
Bending, cracking or breakage of spokes can result in a decrease in load
carrying capacity of the wheel.
Pneumatic (MET) Wheel
Rubber tire can tear.
Seriousness
Tearing or puncture of the rubber tire can cause the nitrogen gas leakage
resulting in complete wheel failure.
Grumman Spiral Spring Wheel
Curved spokes can crack, bend or break.
Seriousness
Bending, cracking or breakage of spokes can result in a decrease in load
carrying capacity of the wheel. Failure of a majority of them can result in
complete wheel failure.
Wire Mesh Wheel
No problem with excess payload.
Seriousness
----------------
Bendix Hoop Spring Wheel

57
Hoop springs can bend beyond their elastic limit.
Seriousness
Bending beyond the elastic limit can cause cracks to initiate, which can result
in decreased springiness of the springs. Failure of a majority of the springs
can cause wheel failure.
5. Abrasive wear – Wheel in constant contact with regolith
Possible failures to look for
Abrasive wear of metal/plastic (all/any materials used for the wheel)
Abrasive wear of spokes, grousers, chainmail, etc.
Chance of wheel failure Relative Reliability Scale: 0 – 5; 0 – Min.; 5- Max.
Wheel 1 Wheel 2 Brushed Wheel iRing Wheel
Chance of failure 3.5 2 2 3
Lunokhod
Wheel
Pneumatic
Wheel
Spiral Spring
Wheel
Wire Mesh
Wheel
Hoop Spring
Wheel
Chance of
failure
2 4 2.5 1.5 2.5
Wheel 1
Abrasive wear of the outer surface of wheel.
Abrasive wear of grousers.
Abrasive wear of the overlapping outer spring steel wheel.
Seriousness

58
Wear of the outer surface can cause a decrease in thickness of the metal sheet
resulting in a decrease in load carrying capacity of the wheel.
Wearing of grousers can cause a decrease in thickness resulting in reduced
traction. If the grouser flattens out and regolith gets trapped in between the
outer surface of the wheel and the grouser, it can accelerate wear.
Wear of the overlapping metal can make it thinner causing a reduction in
load carrying capacity of the wheel which can in turn cause cracks to initiate
and propagate throughout the width of the wheel.
Wheel 2
Regolith can get settled into the gap where the spring is attached to the
aluminium rim and the thin space between two springs causing abrasive
wear.
Seriousness
Wear of spring causes a decrease in thickness that can result in crack
initiation and a decrease in load carrying capacity of the wheel.
Brushed Wheel
Abrasive wear of the nylon bristles.
Regolith can get trapped in the small holes where the bristles are attached to
the outer rim and cause small, but continuous wear.
Seriousness
Wearing of nylon bristles in both cases mentioned above can make them
become loose. Due to this, they can fall out, decreasing traction.
iRing Wheel
Wear of chainmail links and polypropylene plastic balls as the chain mail is
always in constant contact with regolith.

59
Regolith can get into the interface where the chain mail is sandwiched inside
the rim, causing small, but continuous wear.
Seriousness
Once the chain mail links start to wear, they can break, and if links close to
each other break creating a hole, the balls within the wheel can fall out
causing problems with the normal functioning of the wheel.
If regolith gets into the chain mail rim interface, continuous wear can break
the links at the edge of the interface causing the chain mail to open up,
allowing balls to fall out.
Lunokhod Rigid Rim Wheel
Abrasive wear of spokes and/or the outer meshed surface of the wheel.
Abrasive wear of 90º angled brackets connecting the grousers to the outer
meshed rim.
Seriousness
Wearing of the outer meshed surface and/or spokes can cause a decrease in
load carrying capacity of the wheel. Failure of a majority of the spokes can
cause the complete wheel to fail.
Wearing of the angled brackets can make the grousers become loose,
resulting in reduced traction.
Pneumatic (MET) Wheel
Rubber tire can wear and get punctured.
Seriousness
Failure of the rubber tire can make the nitrogen gas to leak, resulting in wheel
failure.

60
Grumman Spiral Spring Wheel
Abrasive wear of the outer surface and/or the curved spokes.
Seriousness
Wear of the outer surface and/or the spokes can decrease their thickness. This
can result in crack initiation, which can propagate throughout the width
causing wheel failure.
Wire Mesh Wheel
Abrasive wear of rivets and aluminium hub.
Seriousness
Once regolith gets inside the area where the titanium inner frame is attached
to the aluminium hub via rivets, the hub and the rivets can start to wear. The
rivets can wear causing the chevrons to loosen, decreasing springiness and
the load carrying capacity of the wheel.
Bendix Hoop Spring Wheel
Abrasive wear of hoop springs, aluminium rim and spokes, outer grit (which
acts like a grouser), pins or rivets and the outer band (inner and outer
surfaces).
Seriousness
Since the hoop springs are very thin, they can wear out completely which can
result in a decrease in load carrying capacity of the wheel.
Wearing of aluminium rim and spokes can reduce its strength.
Wearing of the outer grit can reduce the traction performance of the wheel.
61
Once regolith gets in between the rivets and the spring surface, it can cause
small, but continuous wear. This can loosen the springs in turn decreasing the
load carrying capacity of the wheel.
4.4 Comparative Evaluation of Different Wheel Designs
The evaluation of wheels according to reliability criteria is shown in Table 4.3.
The wheels are rated on a scale of 0 to 10 with 0 being the least reliable and 10
being the most reliable. The ―Relative Value Factors‖ are weighted using a
―Paired Comparison‖ method [Kaufman, 1999]. This method is used to determine
the relative importance of the selected attributes and assign a percentage (weight)
value to the attributes.
In the Paired Comparison process, attributes are evaluated in pairs. The
question asked is, ―given a snapshot of the mission profile for the project, which
is more important, e.g., mechanical reliability or obstacle performance? ‖. One of
the options is selected. The next question asked is, ―Is the degree of importance
separating the two options, a high difference (3), medium difference (2) or low
difference (1)‖. Likewise, every attribute is compared to the other and the score is
determined by adding the numeric value of the attributes. The score is then
converted to percentage, which standardizes the assigning of numerical values to
the attributes.
The ratings are relative and all the numbers are based on my engineering
judgement. Detailed analysis presented in section 4.3 helped to form a basis for
the ratings. The values for each wheel for all criteria are added at the bottom of
the table. The Apollo Wheel had the highest total score with the iRing Wheel
being second.

62
Table 4.3: Wheel comparison
Earlier LRV Wheels McGill University Wheels
Wheel
Lunokhod
Wheel
MET
Wheel
Apollo
Wheel
Spiral
Spring
Hoop
Spring
Wheel
1
Wheel
2
Brushed
Wheel
iRing
Wheel Criteria
Relative
Value
Factor
Mechanical
reliability 0.31 6.2 4.8 5.4 4.4 4.5 4.0 4.2 4.5 5.2
Obstacle
Performance 0.11 4.0 2.2 7.8 4.0 6.7 3.3 5.0 7.8 6.7
Wear
Resistance 0.22 6.2 3.0 8.5 5.0 5.0 3.5 6.2 6.2 4.0
Thermal
Compatibility 0.26 5.0 2.8 8.7 4.3 5.0 4.0 8.9 3.8 8.7
Stability 0.04 7.0 6.2 6.2 3.4 5.7 7.0 5.2 7.0 6.0
Ride Comfort 0.04 4.0 8.0 8.5 4.6 5.0 5.0 4.5 6.0 7.6
Development
Cost 0.02 5.4 9.0 4.0 8 6.0 7.2 6.6 8.5 4.8
Total 1.0 5.6 3.9 7.3 4.5 5.1 4.0 6.0 5.3 6.1
63
5. DISCUSSION
Reliability analysis by visual inspection proved to be effective in determining a
relative comparison of wheel designs. The use of design feature failure and the
detailed analysis was effective in being able to analyze wheel designs and rate
them. Including more failure causing conditions and events is possible. This
would extend the comparative evaluation of the different wheels; however, the
major criteria are covered in the present analysis and it was thought that further
extension of criteria would not improve the evaluation.
A reliability checklist for evaluation of wheels used in a lunar environment
by visual inspection is given below. The checklist is the outcome of the visual
inspection reliability process undertaken in this study and the lessons learned from
it. The list gives an indication of how such a list can be used to analyze the
reliability of any design, and thus, to indicate areas for improvement.
Reliability check for the design of wheels for a lunar rover
Avoid overlapping similar, flat metal surfaces so as to avoid cold welding.
Use fasteners of the same material as the surfaces being fastened to avoid
failure due to different CTE coefficients.
Check the strength of welds. Experimental testing in simulated lunar
environment is the best option.
Grouser design should be such that it provides grip in both forward and
lateral directions so that the rover does not slip on an inclined surface.
Avoid any small openings, which would allow regolith or rock penetration,
thereby causing abrasive wear and problems to normal functioning of the
wheel.

64
The exterior surface of the wheel (e.g., grousers, side wall, etc.) should not
have sharp edges to avoid sidewall edge deformation/failure due to impact
with rocks on the lunar terrain.
Spokes (curved or straight) and springs or spring material in any form should
be designed to handle excess loading condition.
Spokes should have a covering to protect them from the impact of rocks to
avoid cracking, bending or deformation.

65
6. CONCLUSION AND RECOMMENDATIONS
Thesis objectives followed by thesis outcomes are given below:
a background study on the prediction of reliability.
Various available techniques (software and models) to estimate reliability
were reviewed and compared to their peers. The area of cryogenic wear was
also researched to find available data.
choosing the best methods for estimating reliability given the specific task
at hand.
The methodology for determining reliability of a lunar rover developed by
Neptec is rigorous and the best available.
estimating the reliability of several wheel designs by determining key
design parameters and obtaining the best estimates of reliability from
various sources.
A new technique, i.e., a visual inspection technique was developed which
pointed out key design features, which had the potential to cause wheel
failure. This technique also helped to compare and estimate the reliability of
several wheel designs.
The bottom line is that some of the research to date gives an indication of the
conditions for best wear at cryogenic temperatures, but for best prediction of
wear, tests need to be done on the actual rover at lunar conditions; such testing is
presently not possible. It is recommended that a facility, which is able to test a
full scale, lunar rover at lunar conditions be built in order to determine the
parameters necessary for good reliability calculation.
66
The Visual Inspection Technique was shown to be a good method for
evaluating the reliability of different designs, and the lunar rover wheels chosen
for the purpose of the study were successfully compared using the methodology.
The analysis indicated that the best historical design was the Apollo Wire
Mesh Wheel and the best contemporary design was the iRing Wheel. A reliability
checklist for design analysis was given. The list can serve as a guideline to avoid
unreliable design features for lunar rover wheels.
The Visual Inspection Technique can be applied to other complex systems
where experimental testing under actual conditions is not possible; however,
background knowledge and expert opinion are necessary to perform an
evaluation.
The study is not an exhaustive one for estimating reliability, and it may be
insufficient on its own towards achieving all the objectives of a lunar mission.
Nevertheless, the findings derived from this study contribute to the development
of a reliable wheel design for lunar mobility.

67
REFERENCES
Asnani, V., Delap, D. and Creager, C. (2009a). ―The development of wheels for
the Lunar Roving Vehicle.‖ Journal of Terramechanics, 46, 89–103
Asnani, V., Delap, D. and Creager, C. (2009b). ―The development of wheels for
the Lunar Roving Vehicle.‖ NASA/TM—215798
Baker, M.J. and Deschamps, B. (1999). ―Reliability-based methods in the
inspection planning of fixed offshore steel structures.‖ Journal of
Constructional Steel Research, 52, 117–131
Bell, C., Bottomley, J., Brule, D., Hudson, R., Jacques, D., Kearns, M., (2010).
―Lunar Rover Reliability Project (LRRP), Reliability Prediction Process
Document‖. NDG009797.
Benaroya, H., (1994), ―Reliability of structures for the moon‖, Structural Safety,
15, 67-84.
Blischke, W.R., Murthy, D.N.P., (2003), ―Case Studies In Reliability and
Maintenance‖, Wiley Series In Probability and Statistics, chapter 1, page 14-
18.
Burris, D.L., (2008). ―Investigation of the Tribological Behavior of
Polytetrafluoroethylene at Cryogenic Temperatures‖, Tribology Transactions,
51: 1, 92-100.
Chin, R.T., (1982). ―Automated visual inspection techniques and applications: a
bibliography‖, Pattern Recognition, Vol. 15, No. 4, pp.343- 357.
Das, D., Dutta, A. K., and Ray, K. K., (2008), ―On the enhancement of wear
resistance of tool steels by cryogenic treatment‖, Philosophical Magazine
Letters, 88: 11, 801 — 811.

68
Durmaz, B., Demirkaya, B.O., (2011), ―Reliability Considerations for Design of
Space Systems‖, IEEE, 978-1-4244-9616-7/11- 424-429.
Elsayed, A.E., (1996), ―Reliability Engineering‖, Addison Wesley Longman, Inc.
EPRD, (1997), Electronic parts reliability data, Reliability Information Analysis
Center (RIAC).
Hong, S., (2006), ―Lubrication mechanisms of LN2 in ecological cryogenic
machining‖, Machining Science and Technology, 10: 1, 133 — 155.
http://www.cs.toronto.edu/~radford/res-bayes-ex.html
http://www.eventtreeanalysis.com/
http://www.fmea-fmeca.com
http://www.hq.nasa.gov/office/codeq/doctree/SP2009569.pdf
http://www.mtain.com/relia/relfmeca.htm
http://www.reliabilityeducation.com/rbd.pdf
http://www.reliasoft.com/newsletter/v8i2/reliability.htm
http://www.weibull.com/basics/fault-tree/index.htm
http://www.weibull.com/LifeDataWeb/bayesian_statistics.htm
http://www.weibull.com/mil_std/mil_hdbk_338b.pdf
Hubner, W., Gradt, T., Schneider, T., Borner, H., (1997), ―Tribological behaviour
of materials at cryogenic temperatures‖, Wear 216, 150-159.
Iwabuchi, A., Honda, T., Tani, J., (1989) ―Tribological properties at temperatures
of 293, 77 and 4 K in fretting‖, Cryogenics, vol. 29 February.
Jacques, D., Brule, D., Bell, C., Hudson, R., Thomson, V., (2009), ―Lunar Rover
Reliability Prediction- Phase 1 report‖, MacLean Engineering and Marketing
Co. Ltd., 1000 Raglan Street Collingwood, Ontario, Canada, L9Y 3Z1

69
Kaufman, J., (1999), ―Preparing for a successful value management workshop‖,
value management workshop, Canadian Society for Value Analysis, vol. 6(1),
3-12.
Kaveh-M, N., (2011), ―Experimental Investigation of Lunar Prototype Wheel
Traction Performance on Deformable Terrain‖, MEng thesis, McGill
University.
MIL-HDBK-217F, (1991), Reliability prediction for electronic systems. Available
from the National Technical Information Service, Springfield, Virginia.
Nasa: http://nssdc.gsfc.nasa.gov/planetary/lunar /apollo_lrv.html
NPRD, (1995), Non-electronic parts reliability data, Reliability Information
Analysis Center (RIAC).
NSWC, (2009), ―Handbook of reliability prediction procedures for mechanical
equipment‖, Naval Surface Warfare Center, Carderock division, West
Bethesda, Maryland, 20817-5700.
O‘Connor, P.D.T, (1991), ―Practical Reliability Engineering‖, 3rd
edition, John
Wiley & Sons Ltd.
Ostrovskaya, Ye. L., Yukhno, T.P., Gamulya, G.D., Vvedenskij, Yu. V., Kuleba,
V.I., (2001). ―Low temperature tribology at the B. Verkin Institute for Low
Temperature Physics & Engineering (historical review)‖, Tribology
International 34, 265–276.
Radziszewski, P., Martins, S., Faragalli, M., Kaveh, M.N., Oyama, D., Briend, R.,
Gharib, N., Prahacs, C., Ouellette, S., Pasini, D., Thomson, V., Lowther, D.,
Farhat, M., and Jones, B. (2010). ―iRings – Development of a wheel prototype
concept for lunar mobility.‖ CASI Astro conference.
Roseland, L. M., (1967), ―Adhesives for cryogenic applications‖, Journal of
Macromolecular Science, Part B, 1: 4, 639 — 650.

70
Thomas A.D.H., (1994). ―Knowledge-based Inspection of Electric Lamp Caps‖,
Engg. Applic. Artif. Intell., Vol. 7, No. I. pp. 31-37.
Wikipedia 1: http://en.wikipedia.org/wiki/Visual_inspection
Wikipedia 2: http://en.wikipedia.org/wiki/Cold_welding#In_space