Embed Size (px)
Citation preview

© 2019 QUANTA TECHNOLOGY, LLC | CONFIDENTIAL & PROPRIETARY
QUANTA TECHNOLOGY, LLC 4020 WESTCHASE BOULEVARD, SUITE 300, RALEIGH, NC 27607 USA
Toronto | Oakland | Chicago | Boston | San Clemente
Report
www.Quanta-Technology.com
Quanta Technology, LLC is a wholly-owned subsidiary of Quanta Services, Inc. (NYSE: PWR)
QUANTA TECHNOLOGY, LLC 4020 WESTCHASE BOULEVARD, SUITE 300, RALEIGH, NC 27607 USA
Toronto | Oakland | Chicago | San Clemente
PREPARED FOR
Southern California Edison (SCE)
DATE
December 20, 2019 (Version 1)
CONTACT:
Ali Daneshpooy, PhD, PE [email protected] (510) 272-2790
Reliability Analysis of Alberhill System Project

REPORT
RELIABILITY ANALYSIS OF ALBERHILL SYSTEM PROJECT | SCE
CONFIDENTIAL/PROPRIETARY © 2019 QUANTA TECHNOLOGY, LLC II
CONFIDENTIAL/PROPRIETARY: This document contains trade secrets and/or proprietary, commercial, or financial information not generally available to the public. It is considered privileged and proprietary to Quanta Technology LLC and is submitted with the understanding that its contents are specifically exempted from disclosure under the Freedom of Information Act [5 USC Section 552 (b) (4)] and shall not be disclosed by the recipient (whether it be Government [local, state, federal, or foreign], private industry, or non-profit organization) and shall not be duplicated, used, or disclosed, in whole or in part, for any purpose except to the extent provided in the contract.
VERSION HISTORY:
Version Date Description
0.1 11/8/2019 Initial draft
0.2 12/5/2019 Final draft
1 12/20/2019 Final
The following individuals participated and contributed to this study (alphabetical order):
• Rahul Anilkumar • Ali Daneshpooy • Hisham Othman

REPORT
RELIABILITY ANALYSIS OF ALBERHILL SYSTEM PROJECT | SCE
CONFIDENTIAL/PROPRIETARY © 2019 QUANTA TECHNOLOGY, LLC III
EXECUTIVE SUMMARY
Southern California Edison (SCE) retained Quanta Technology to supplement the existing record in the California Public Utilities Commission (CPUC) proceedings for the Alberhill System Project (ASP) with additional analyses to meet the capacity and reliability needs of the Valley South 500/115 kV system. The overall objective of this report is to quantitatively assess the reliability benefits of the Alberhill System Project.
A comprehensive framework was developed in coordination with SCE to evaluate the performance of ASP. This evaluation is complemented by the development of load forecasts for the Valley North and Valley South system planning areas. Industry-accepted forecast methodologies to project load growth and to incorporate load-reduction programs (energy efficiency, demand response, and behind-the-meter generation) were implemented. The developed load forecast covers the horizon of 30 years (until year 2048).
The benefits were calculated using power-flow studies that evaluate the impact of the load forecast on the Valley South System both without and with ASP in service. Each of the reliability, capacity, flexibility and resiliency objectives of project performance is quantified by service reliability metrics over a 10-year and 30-year planning horizon. Benefits are quantified as the relative performance of ASP to the baseline for each of the metrics.
The key findings of this study are summarized as follows:
• The peak load forecast identifies a transformer capacity need in the Valley South system by the year 2022, as the load exceeds Valley South 500/115 kV transformer capacity of 1,120 MVA. The peak demand within Valley South service territory is projected to grow from 1,132 MVA in year 2022 to 1,378 MVA in year 2048.
• An evaluation of the quantitative metrics demonstrates the benefits of the ASP project in meeting overall needs in the Valley South service area. Key highlights from the ASP project performance across the 10-year (2028) and 30-year (2048) horizons are discussed. Without ASP in service and under normal operating conditions (N-0 or all facilities in service), the
load at risk increases from 250 MWh to 6,300 MWh between the years 2028 and 2048. With the ASP in service, the amount of load at risk is reduced to 3 MWh in 2048.
The periods wherein the system observes a shortage in capacity increases from 7 hours by the year 2028 to 77 hours by the year 2048 under normal operating conditions (N-0). With the ASP in service, this is reduced to 2 hours in the year 2048.
Without ASP in service, maintaining system adequate N-1 capacity becomes increasingly challenging at higher load levels. ASP reduces the N-1 capacity risk from 2,800 MWh to 200 MWh by the year 2048.
For emergency, unplanned or planned maintenance events involving the simultaneous outage of two or more subtransmission circuits in the Valley South System, the unavailability of system tie-lines results in approximately 52,000 MWh of load at risk by the year 2048. This is reduced to zero with the ASP in service.

REPORT
RELIABILITY ANALYSIS OF ALBERHILL SYSTEM PROJECT | SCE
CONFIDENTIAL/PROPRIETARY © 2019 QUANTA TECHNOLOGY, LLC IV
ASP provides measurable operational flexibility improvement to address system needs under high impact low probability (HILP) events in the Valley System. The current system configuration does not provide any benefit in this regard due to unavailable system ties.
ASP reduces the losses in the system from 52 GWh to 42 GWh in the year 2028 and from 61 GWh to 49 GWh in the year 2048.
Overall, ASP demonstrated robustness to address the needs identified in the Valley service territory. The project by design provides an alternative source of supply into the original Valley South service territory while effectively separating the system with tie-lines. This offers several advantages that can also overcome the variability and uncertainty associated with the forecast peak load. The available flexibility through system tie-lines provides relief to system operations under both normal system conditions (increasing flexibility for planned maintenance outages) and for abnormal system conditions (unplanned outages) such as N-1, N-2, and HILP events that affect the region.
Findings and results reported in this document are based on publicly available information and the information furnished by the client at the time of the study. Quanta Technology reserves the right to amend results and conclusions should additional information be provided or become available.

REPORT
RELIABILITY ANALYSIS OF ALBERHILL SYSTEM PROJECT | SCE
CONFIDENTIAL/PROPRIETARY © 2019 QUANTA TECHNOLOGY, LLC V
TABLE OF CONTENTS
EXECUTIVE SUMMARY ...................................................................................................................... iii
1 INTRODUCTION ........................................................................................................................... 1 1.1 Project Background ............................................................................................................................. 1 1.2 Report Organization............................................................................................................................ 3
2 RELIABILITY ASSESSMENT FRAMEWORK AND RESULTS............................................................. 4 2.1 Introduction ........................................................................................................................................ 4 2.2 Study Methodology ............................................................................................................................ 5
2.2.1 Study Inputs .............................................................................................................................. 5
2.2.2 Study Criteria .......................................................................................................................... 10
2.2.3 Reliability Study Tools and Application .................................................................................. 10
2.2.4 Reliability Metrics ................................................................................................................... 15
2.3 Reliability Analysis of the Baseline System ....................................................................................... 17 2.3.1 System Performance under Normal Conditions (N-0) ........................................................... 17
2.3.2 System Performance under Normal Conditions (N-1) ........................................................... 17
2.3.3 Flexibility Metrics .................................................................................................................... 18
2.3.4 System Losses ......................................................................................................................... 19
2.3.5 Key Highlights of System Performance .................................................................................. 19
2.4 Reliability Analysis of the Alberhill System Project .......................................................................... 20 2.4.1 Description of Project Solution ............................................................................................... 20
2.4.2 System Performance under Normal Conditions (N-0) ........................................................... 21
2.4.3 System Performance under Normal Conditions (N-1) ........................................................... 22
2.4.4 Flexibility Metrics .................................................................................................................... 23
2.4.5 System Losses ......................................................................................................................... 23
2.4.6 Key Highlights of System Performance .................................................................................. 24
2.5 Evaluation of Quantitative Metrics .................................................................................................. 24
3 CONCLUSIONS ........................................................................................................................... 27
APPENDIX A: GLOSSARY ................................................................................................................... 29
APPENDIX B: REFERENCES................................................................................................................ 30
APPENDIX C: RELIABILITY PERFORMANCE ADDITIONAL DETAILS ................................................... 31

REPORT
RELIABILITY ANALYSIS OF ALBERHILL SYSTEM PROJECT | SCE
CONFIDENTIAL/PROPRIETARY © 2019 QUANTA TECHNOLOGY, LLC VI
List of Figures
Figure 1-1. Valley Service Areas ....................................................................................................................... 2 Figure 2-1. Valley South Load Forecast (Peak MVA) ....................................................................................... 6 Figure 2-2. Valley South System Configuration (2018) .................................................................................... 7 Figure 2-3. Valley South System Configuration (2021) .................................................................................... 8 Figure 2-4. Valley South System Configuration (2022 with ASP in service) .................................................... 9 Figure 2-5. Load Shape of the Valley South Substation .................................................................................. 9 Figure 2-6. Scaled Valley South Load Shape Representative of Study Years ................................................ 11 Figure 2-7. Flowchart of Reliability Assessment Process .............................................................................. 12 Figure 2-8. Flowchart of Flex-1 Calculation Process ...................................................................................... 14 Figure 2-9. Service territory configuration after proposed Alberhill System Project ................................... 21 Figure 2-10 : N-0 EENS over the study horizon and its PV ............................................................................ 25
List of Tables
Table 2-1. Distribution Substation Load Buses .............................................................................................. 11 Table 2-2. Baseline N-0 System Performance ............................................................................................... 17 Table 2-3. Baseline N-1 System Performance ............................................................................................... 17 Table 2-4. List of Baseline System Thermal Constraints ................................................................................ 18 Table 2-5. Flexibility and Resiliency Metrics for Baseline System ................................................................. 18 Table 2-6. Losses in Baseline System ............................................................................................................. 19 Table 2-7. Alberhill N-0 System Performance ............................................................................................... 21 Table 2-8. Alberhill N-1 System Performance ............................................................................................... 22 Table 2-9. List of Baseline System Thermal Constraints ................................................................................ 23 Table 2-10. Flexibility and Resiliency Metrics for ASP ................................................................................... 23 Table 2-11. Losses in ASP ............................................................................................................................... 23 Table 2-12. Cumulative Benefits between Baseline and ASP (10-year and 30-year) ................................... 25 Table 2-13: Present Worth of Benefits between Baseline and ASP (10-year and 30-year) .......................... 26 Table C-1 : Cumulative Reliability Performance and Benefits with and without the ASP (10-year) ............. 31 Table C-2: Cumulative Reliability Performance and Benefits with and without the ASP (30-year) ............. 31 Table C-3 : Present Worth of Benefits with and without the ASP (10-year) ................................................. 32 Table C-4: Present Worth Reliability Performance and Benefits with and without the ASP (30-year) ........ 33

REPORT
RELIABILITY ANALYSIS OF ALBERHILL SYSTEM PROJECT | SCE
CONFIDENTIAL/PROPRIETARY © 2019 QUANTA TECHNOLOGY, LLC 1
1 INTRODUCTION
Southern California Edison (SCE) retained Quanta Technology to supplement the existing record in the California Public Utilities Commission (CPUC) proceedings for the Alberhill System Project (ASP) with additional analyses of the capacity and reliability needs in the Valley South 500/115 kV system. The objective of this analysis is to evaluate the forecasted impacts of ASP on service reliability performance utilizing a combination of power flow simulations and service reliability metrics where applicable.
In this section of the report the project background, scope of work, study objective (including task breakdown), and study process have been outlined.
1.1 Project Background Valley Substation is a 500/115 kV substation that serves electric demand in southwestern Riverside County. Valley Substation is split into two distinct 500/115 kV electrical systems: Valley North and Valley South. Each is served by two 500/115 kV, 560 MVA, three-phase transformers. The Valley South system is not supplied by any alternative means or tie-line. In other words, this portion of the system is radially served by a single point of interconnection with the bulk electric system under jurisdiction of the California Independent System Operator (CAISO). This imposes unique challenges to the reliability, capacity, operational flexibility, and resiliency needs of the Valley South system.
The Valley South 115 kV system electrical needs area (ENA) consists of 15 distribution level 115/12 kV substations.
During the most recent forecast developed for peak demand, SCE identified an overload of the Valley South 500/115 kV transformer capacity by the year 2022 under normal operating conditions (N-0). This forecast was developed for extreme weather conditions (1-in-5-year heat storm)1. SCE has additionally identified the need to provide system ties to improve reliability, resiliency, and operational flexibility2. To address these needs the ASP was proposed. Figure 1-1 provides an overview of the project area. Key features of this project are outlined below:
• Construction of a 1,120 MVA 500/115 kV substation (Alberhill Substation). • Construction of two 500 kV transmission line segments to connect the proposed Alberhill Substation
by looping into the existing Serrano-Valley 500 kV transmission line.
1 1-in-5-year peak demand adjusted for extreme weather conditions are typically utilized for system planning involving the sub-transmission system. 2 Flexibility or Operational Flexibility are used interchangeably in the context of this study. It is considered as the capability of the power system to absorb disturbances to maintain a secure operating state. It is used to bridge the gap between reliability and resiliency needs in the system and overall planning objectives. Typically, system tie-lines allow for the operational flexibility to maintain service during unplanned equipment outages, during planned maintenance and construction activities, and to pre-emptively transfer load to avoid loss of service to affected. customers. System tie-lines can effectively supplement transformation capacity by allowing the transfer of load to adjacent systems.

REPORT
RELIABILITY ANALYSIS OF ALBERHILL SYSTEM PROJECT | SCE
CONFIDENTIAL/PROPRIETARY © 2019 QUANTA TECHNOLOGY, LLC 2
• Construction of approximately 20 miles of 115 kV sub-transmission lines to modify the configuration of the existing Valley South System to allow for the transfer of five 115/12 kV distribution substations from the Valley South System to the new Alberhill System, and to create 115 kV system tie-lines between the two systems.
Figure 1-1. Valley Service Areas3
3 Valley-Ivyglen and VSSP 115 kV line projects included.

REPORT
RELIABILITY ANALYSIS OF ALBERHILL SYSTEM PROJECT | SCE
CONFIDENTIAL/PROPRIETARY © 2019 QUANTA TECHNOLOGY, LLC 3
SCE subsequently submitted an application to the CPUC seeking a Certificate of Public Convenience and Necessity (CPCN). During the proceedings for the ASP, the CPUC requested additional analyses to justify the peak demand forecasts and reliability cases for the project. The CPUC also requested a comparison of the proposed ASP to other potential system alternatives that may satisfy the stated project needs; the alternatives include but are not limited to energy storage, demand response, and distributed energy resources (DERs).
Quanta Technology supported SCE’s intent to supplement the existing record in the CPUC proceeding for the ASP utilizing a comprehensive reliability assessment framework. The scope of this assessment included:
1. Quantifying the needs in the Valley South 500/115 kV System using applicable load forecast. 2. Using power-flow simulations and quantitative review of project data to evaluate the forecasted
impact of proposed ASP on the Valley South System needs. 3. Applying the load forecast to analyze service reliability performance benefits provided by the ASP in
the Valley South System.
1.2 Report Organization In order to provide a comprehensive view of the study methodology, findings and conclusions; the report has been separated into three sections.
Section 2 of the report introduces the reliability assessment framework, while describing the tools, formulation and overall methodology. The proposed performance metrics are introduced, and their applicability has been described. Section 3 of the report presents the forecasted performance of Alberhill System Project utilizing the metrics. Section 4 serves as conclusion.
REPORT
RELIABILITY ANALYSIS OF ALBERHILL SYSTEM PROJECT | SCE
CONFIDENTIAL/PROPRIETARY © 2019 QUANTA TECHNOLOGY, LLC 4
2 RELIABILITY ASSESSMENT FRAMEWORK AND RESULTS
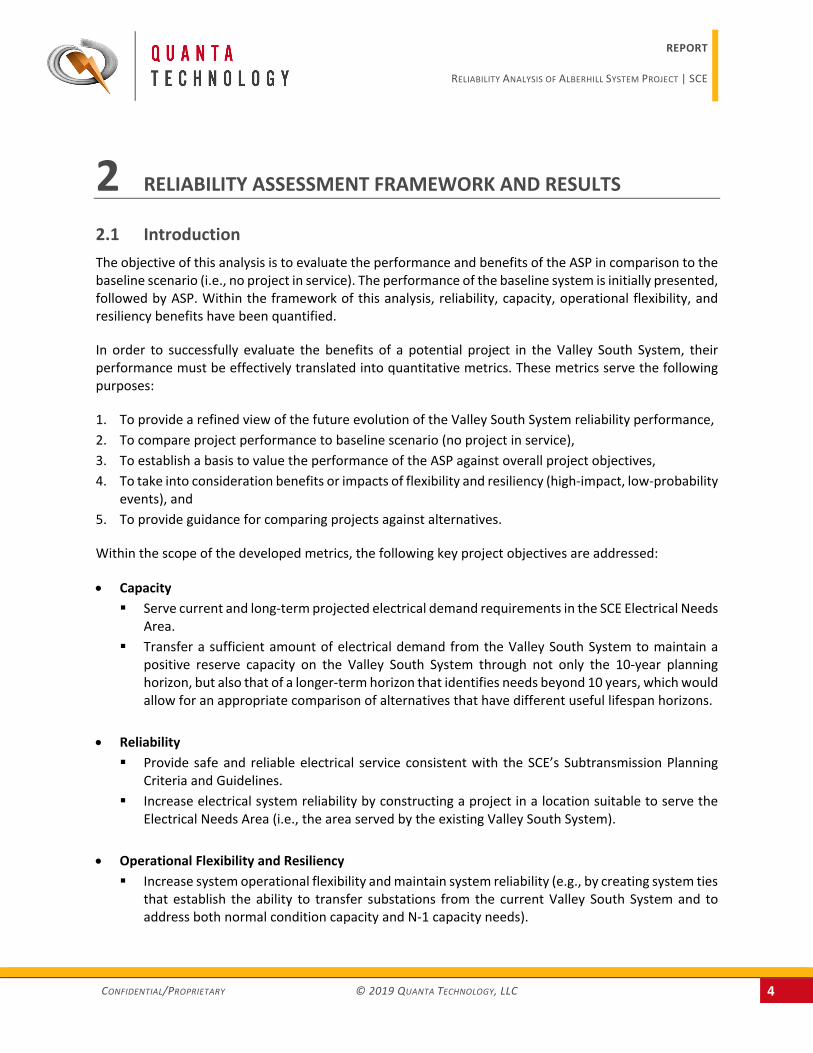
2.1 Introduction The objective of this analysis is to evaluate the performance and benefits of the ASP in comparison to the baseline scenario (i.e., no project in service). The performance of the baseline system is initially presented, followed by ASP. Within the framework of this analysis, reliability, capacity, operational flexibility, and resiliency benefits have been quantified.
In order to successfully evaluate the benefits of a potential project in the Valley South System, their performance must be effectively translated into quantitative metrics. These metrics serve the following purposes:
1. To provide a refined view of the future evolution of the Valley South System reliability performance, 2. To compare project performance to baseline scenario (no project in service), 3. To establish a basis to value the performance of the ASP against overall project objectives, 4. To take into consideration benefits or impacts of flexibility and resiliency (high-impact, low-probability
events), and 5. To provide guidance for comparing projects against alternatives.
Within the scope of the developed metrics, the following key project objectives are addressed:
• Capacity Serve current and long-term projected electrical demand requirements in the SCE Electrical Needs
Area. Transfer a sufficient amount of electrical demand from the Valley South System to maintain a
positive reserve capacity on the Valley South System through not only the 10-year planning horizon, but also that of a longer-term horizon that identifies needs beyond 10 years, which would allow for an appropriate comparison of alternatives that have different useful lifespan horizons.
• Reliability Provide safe and reliable electrical service consistent with the SCE’s Subtransmission Planning
Criteria and Guidelines. Increase electrical system reliability by constructing a project in a location suitable to serve the
Electrical Needs Area (i.e., the area served by the existing Valley South System).
• Operational Flexibility and Resiliency Increase system operational flexibility and maintain system reliability (e.g., by creating system ties
that establish the ability to transfer substations from the current Valley South System and to address both normal condition capacity and N-1 capacity needs).

REPORT
RELIABILITY ANALYSIS OF ALBERHILL SYSTEM PROJECT | SCE
CONFIDENTIAL/PROPRIETARY © 2019 QUANTA TECHNOLOGY, LLC 5
2.2 Study Methodology In order to develop a framework to effectively evaluate the performance of a project, the overall study methodology was broken down into the following elements:
1. Develop metrics to establish project performance. 2. Quantify the project performance using commercial power flow software. Each of the above areas are further detailed throughout this chapter. Since the focus of this analysis is the Valley South System, all discussions are pertinent to this study area.
2.2.1 Study Inputs
SCE provided Quanta Technology with information pertinent to the Valley South, Valley North, and ASP Systems. This information encompassed the following data:
1. GE PSLF power flow models for Valley South and North Systems. a. 2018 system configuration (current system). b. 2021 system configuration (Valley-Ivyglen4 and VSSP5 projects modeled and included). c. 2022 system configuration (with ASP in service).
2. Substation layout diagrams representing the Valley Substation. 3. Impedance drawings for the Valley South and Valley North Systems depicting the line ratings and
configurations. 4. Single-line diagram of the Valley South and Valley North Systems. 5. Contingency processor tools to develop relevant study contingencies to be considered for each system
configuration 6. 8,760 load shape of the Valley South System. 7. Metered customer information per substation (customer count).
The reliability assessment utilizes the Spatial Load Forecast developed for Valley South and Valley North service territories to evaluate the performance of the system for future planning horizons. The developed forecast includes the effects of future developments on Photovoltaic, Electric Vehicles, Energy Efficiency, Energy storage, and Load Modifying Demand Response as defined in the IEPR 2018 forecast6. The representative load forecast is presented in Figure 2-1, which demonstrates system deficiency in year 2022, where the loading on the Valley South System transformers exceeds maximum operating limits (1,120 MVA).
Benefits begin to accrue coincident with the project need year of 2022. For purpose of this assessment, it is assumed that ASP will be in service by this year, and benefits accrue from 2022 to the end of the 10-year horizon (2028) and the 30-year horizon (2048).
4 Valley-Ivyglen project CPUC Decision 18-08-026 (issued August 31, 2018). 5 VSSP (Valley South 115 kV Sub-transmission Project) CPUC Decision 16-12-001 (issued December 1, 2016). 6 California Energy Commission, "2018 Integrated Energy Policy Report," 2018.

REPORT
RELIABILITY ANALYSIS OF ALBERHILL SYSTEM PROJECT | SCE
CONFIDENTIAL/PROPRIETARY © 2019 QUANTA TECHNOLOGY, LLC 6
Figure 2-1. Valley South Load Forecast (Peak MVA)
System configuration for the years 2018, 2021, and 2022 are depicted in Figure 2-2 through Figure 2-4.
The load shape of the year 2016 was selected for this study. This selection was made because it demonstrates the largest variability among available records7. This load shape is presented in Figure 2-5.
7 Note that the load shapes of years 2017 and 2018 were skewed due to the use of the AA-bank spare transformers as overload mitigation. Therefore, the load shape for year 2016 was adopted. Its shape is representative only and does not change among years.
800
900
1000
1100
1200
1300
1400
1500
2018
2019
2020
2021
2022
2023
2024
2025
2026
2027
2028
2029
2030
2031
2032
2033
2034
2035
2036
2037
2038
2039
2040
2041
2042
2043
2044
2045
2046
2047
2048
Peak
Dem
and
(MVA
)
Year
SCE Spatial Load Forecast with Effective PV (1-in-5 Year Heat Storm)Valley South
SCE Effective PV Total Max Operating Limit

REPORT
RELIABILITY ANALYSIS OF ALBERHILL SYSTEM PROJECT | SCE
CONFIDENTIAL/PROPRIETARY © 2019 QUANTA TECHNOLOGY, LLC 7
Figure 2-2. Valley South System Configuration (2018)

REPORT
RELIABILITY ANALYSIS OF ALBERHILL SYSTEM PROJECT | SCE
CONFIDENTIAL/PROPRIETARY © 2019 QUANTA TECHNOLOGY, LLC 8
Figure 2-3. Valley South System Configuration (2021)

REPORT
RELIABILITY ANALYSIS OF ALBERHILL SYSTEM PROJECT | SCE
CONFIDENTIAL/PROPRIETARY © 2019 QUANTA TECHNOLOGY, LLC 9
Figure 2-4. Valley South System Configuration (2022 with ASP in service)
Figure 2-5. Load Shape of the Valley South Substation

REPORT
RELIABILITY ANALYSIS OF ALBERHILL SYSTEM PROJECT | SCE
CONFIDENTIAL/PROPRIETARY © 2019 QUANTA TECHNOLOGY, LLC 10
2.2.2 Study Criteria
The following guidelines have been used through the course of this analysis to ensure consistency with SCE planning practices:
• The study and planning of projects adhered to SCE’s Subtransmission Planning Criteria and Guidelines. Where applicable, North American Electric Reliability (NERC) and Western Electricity Coordinating Council (WECC) standards have been used, especially while taking into consideration the impact on the bulk electric system (BES) and the non-radial parts of the system under CAISO control.
• Transformer overload criteria established per SCE Subtransmission Planning Criteria and Guidelines for AA banks have been utilized.
• Thermal limits (i.e., ampacity) of conductors are maintained for N-0 (normal) and N-1 (emergency) operating conditions.
• Voltage limits of 0.95–1.05 per unit under N-0 and N-1 operating configurations. • Voltage deviation within established limits of ±5% post contingency.
2.2.3 Reliability Study Tools and Application
A combination of power flow simulation tools has been utilized for this analysis, such as GE PSLF and PowerGem TARA. GE PSLF has been used for base-case model development, conditioning, contingency development, and drawing capabilities. TARA has been used to perform time-series power-flow analysis.
Time-series power-flow analysis is traditionally used in distribution system analysis to assess variation of various quantities over time with changes in load, generation, transmission-line status, etc. It is now finding common application even in transmission system analysis, especially when the system under study is not heavily meshed (radial in nature).
In this analysis, the peak load MVA of the load shape has been adjusted (scaled) to reflect the peak demand for each future year under study. This is represented by Figure 2-6 for the Valley South System as an example. The MW peak load is then distributed amongst the various load models in the Valley Substation in proportion to their MW-to-peak-load ratio in the base case. Load centers under consideration in this analysis of the Valley South and Valley North Systems are listed in Table 2-1.

REPORT
RELIABILITY ANALYSIS OF ALBERHILL SYSTEM PROJECT | SCE
CONFIDENTIAL/PROPRIETARY © 2019 QUANTA TECHNOLOGY, LLC 11
Figure 2-6. Scaled Valley South Load Shape Representative of Study Years
Table 2-1. Distribution Substation Load Buses
Valley South Valley North
Auld Alessandro
Elsinore Bunker
Fogarty Cajalco
Ivyglen ESRP_MWD
Moraga Karma
Newcomb Lakeview
Pechanga Mayberry
Pauba Moreno
Skylark Moval
Stadler Nelson
Stent Stetson
Sun City
Tenaja
Triton
The hourly study was conducted in selected years (5-year periods from 2022 including 2027,2032,2037,2-42 and 2048); i.e. 8,760 simulations per year. The results for years in between were interpolated. At each

REPORT
RELIABILITY ANALYSIS OF ALBERHILL SYSTEM PROJECT | SCE
CONFIDENTIAL/PROPRIETARY © 2019 QUANTA TECHNOLOGY, LLC 12
simulation, the AC power-flow solution is solved, relevant equipment is monitored under N-0 conditions (normal) and N-1 analysis (emergency), potential reliability violations are recorded, and performance reliability metrics (as described in Section 2.2.4) are calculated. A flowchart of the overall study process is presented in Figure 2-7.
The N-1 contingency has been evaluated for every hour of the 8,760 simulation, and all outages are considered to occur with an equal probability. The contingencies were generated using the SCE contingency processor tool for Valley South System. This tool generates single circuit outages for all sub-transmission lines within the system. Whenever an overload or voltage violation was observed, the binding constraint was applied to the computation of the relevant reliability metric. When the project under evaluation has system tie-lines that can be leveraged, they are engaged to minimize system impacts. The list of binding constraints is provided for demonstration purposes in this section of the report.
Figure 2-7. Flowchart of Reliability Assessment Process
Several flexibility metrics were developed to evaluate the incremental benefits of system tie-lines under emergency or planned/unplanned outages and High Impact, Low Probability (HILP) events in the Valley South System.
Flexibility metric 1 evaluates the system under N-2 (double line outages) representative of combinations of lines switched out for service. The contingencies were generated using the SCE contingency processor tool for Valley South System. This tool generates double-circuit outages for all sub-transmission lines within the system. The objective of this metric is to gauge the incremental benefits that projects provide

REPORT
RELIABILITY ANALYSIS OF ALBERHILL SYSTEM PROJECT | SCE
CONFIDENTIAL/PROPRIETARY © 2019 QUANTA TECHNOLOGY, LLC 13
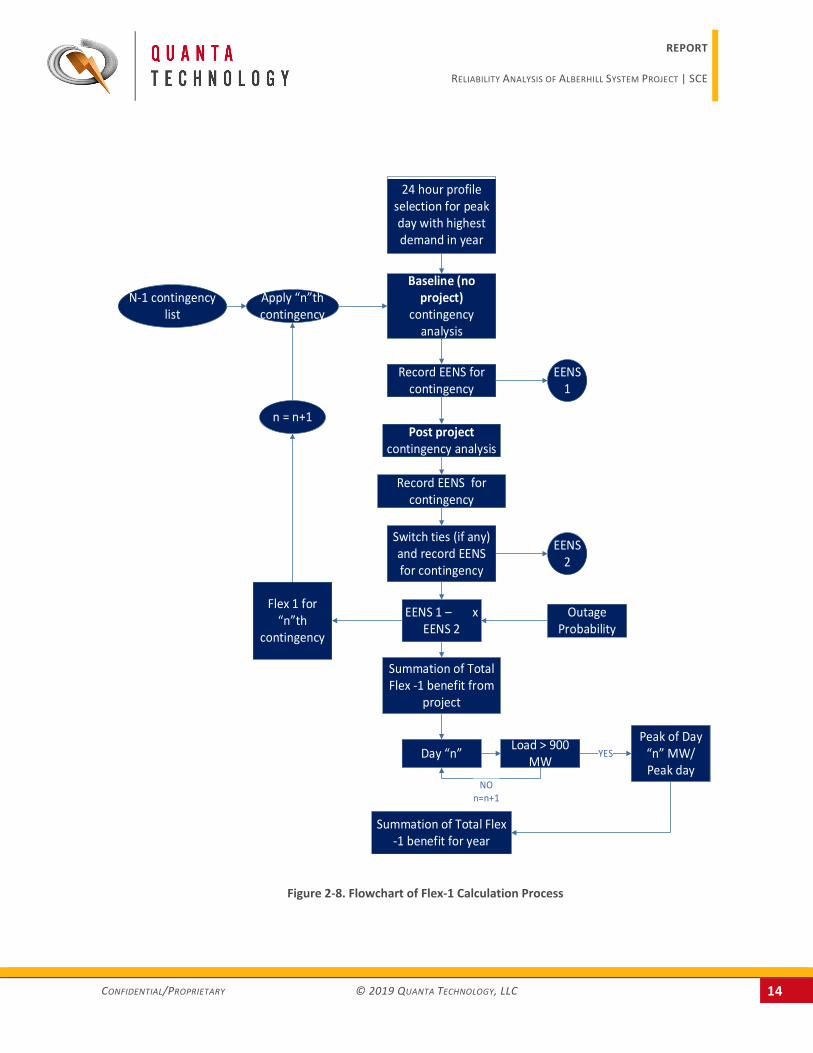
for events that would traditionally result in unserved energy in the Valley South System. The flow chart in Figure 2-8 presents the overall process. The analysis is initiated taking into consideration the peak loading day (24-hour duration) and applying the N-2 contingencies at each hour. Whenever an overload or voltage violation was observed, the binding constraint is used to determine the MWh load at risk and weighted using associated contingency probability. The results were compared against the baseline system and utilized as the common denominator to scale other days of the year for aggregation into the flexibility metric. When the project under evaluation has tie-lines, they are considered to minimize system impacts.
Flexibility metric 2 evaluates the project performance under HILP events in the Valley South System. This has been broken down into two components that consider different events impacting Valley South ENA. Both components utilize a combination of power flow and load profile analysis to determine the amount of load at risk.
• Flexibility metric 2-1 evaluates the impact of entire Valley substation out of service, wherein all the load served by Valley substation is at risk. Considering a two-week event (assumed average substation outage duration to fully recover from an event of this magnitude) around the peak loading day in the system, the amount of load at risk is determined. Utilizing power-flow simulations to evaluate the maximum load that can be transferred by projects using system ties, the amount of load that can be recovered is estimated.
• Flexibility metric 2-2 evaluates a condition wherein Valley South ENA is served by a single transformer (i.e., the second transformer is out of service with no spare available). Utilizing the 8,760-load shape and the transformer Short-Term Emergency Loading Limits (STELL) and Long-Term Emergency Loading Limits (LTELL), the amount of MWh load at risk is estimated and aggregated for the year. The analysis accounts for the incremental relief offered by solutions with permanent and temporary load transfer using system ties.
REPORT
RELIABILITY ANALYSIS OF ALBERHILL SYSTEM PROJECT | SCE
CONFIDENTIAL/PROPRIETARY © 2019 QUANTA TECHNOLOGY, LLC 14
24 hour profile selection for peak day with highest demand in year
Baseline (no project)
contingency analysis
Apply “n”th contingency
Record EENS for contingency
N-1 contingency list
EENS 1
n = n+1Post project
contingency analysis
Record EENS for contingency
EENS 2
Switch ties (if any) and record EENS for contingency
EENS 1 – x EENS 2
Outage Probability
Summation of Total Flex -1 benefit from
project
Flex 1 for “n”th
contingency
Day “n” Load > 900 MW
Total Flex-1 x Peak of Day
“n” MW/ Peak day
MW
Summation of Total Flex -1 benefit for year
YES
NO n=n+1
Figure 2-8. Flowchart of Flex-1 Calculation Process

REPORT
RELIABILITY ANALYSIS OF ALBERHILL SYSTEM PROJECT | SCE
CONFIDENTIAL/PROPRIETARY © 2019 QUANTA TECHNOLOGY, LLC 15
2.2.4 Reliability Metrics
Prior to introducing reliability metrics, key elements of the overall project objectives must be outlined to provide direction and to guide further analysis. The treatment of the following is consistent with applicable NERC guidelines and standards for Bulk Electric System (BES).
• Reliability has been measured with reference to equipment rating (thermal overload) and voltage magnitude (low voltages).
• Capacity represents the need to have adequate resources to ensure that the demand for electricity can be met without service outages. Capacity is evaluated under normal and emergency system conditions, and normal and heat storm weather conditions (included in load forecast).
• Operational Flexibility is considered as adequate electrical connections to adjacent electrical systems to address emergency, maintenance, and planned outage conditions. Therefore, it is expected to operate the system radially and accommodate flexibility by employing normally open tie(s) and connection(s).
• Resiliency has been viewed as an extension of the Flexibility benefits, wherein ties and connections are leveraged to recover load under High Impact Low probability events in the system.
Building on the overall project objectives, the following reliability metrics have been established.
2.2.4.1 Quantitative Metrics
The following quantitative metrics have been proposed to address reliability, capacity, flexibility, and resiliency needs of the system.
• Expected Energy not served (EENS) a. This is quantified by the amount of MWh at risk from each of the following elements:
i. For each thermal overload, the MW amount to be curtailed to reduce loading below ratings multiplied by the number of hours of overload. This includes both, transformers and lines serving the Valley South System.
ii. For voltage violations, the MW amount of load to be dropped based on voltage sensitivity of the bus to bring voltage within limits. The sensitivity study established ranges of load shed associated with varying levels of post contingency voltage. For deviation of 1 pu of voltage from 0.95 pu limit, 0.5 MW of load shed was identified. This is multiplied by the number of hours of violations.
b. Computed for N-0 events and N-1 events. c. For N-1 events, tie-lines are used where applicable to minimize the amount of MWh at risk.
• Maximum Interrupted Power (IP) a. This is quantified as the maximum amount of load in MW dropped to address thermal overloads
and voltage violations. In other words, it is representative of the peak MW overload observed among all overloaded elements.
b. Computed for N-0 events and N-1 events.
REPORT
RELIABILITY ANALYSIS OF ALBERHILL SYSTEM PROJECT | SCE
CONFIDENTIAL/PROPRIETARY © 2019 QUANTA TECHNOLOGY, LLC 16
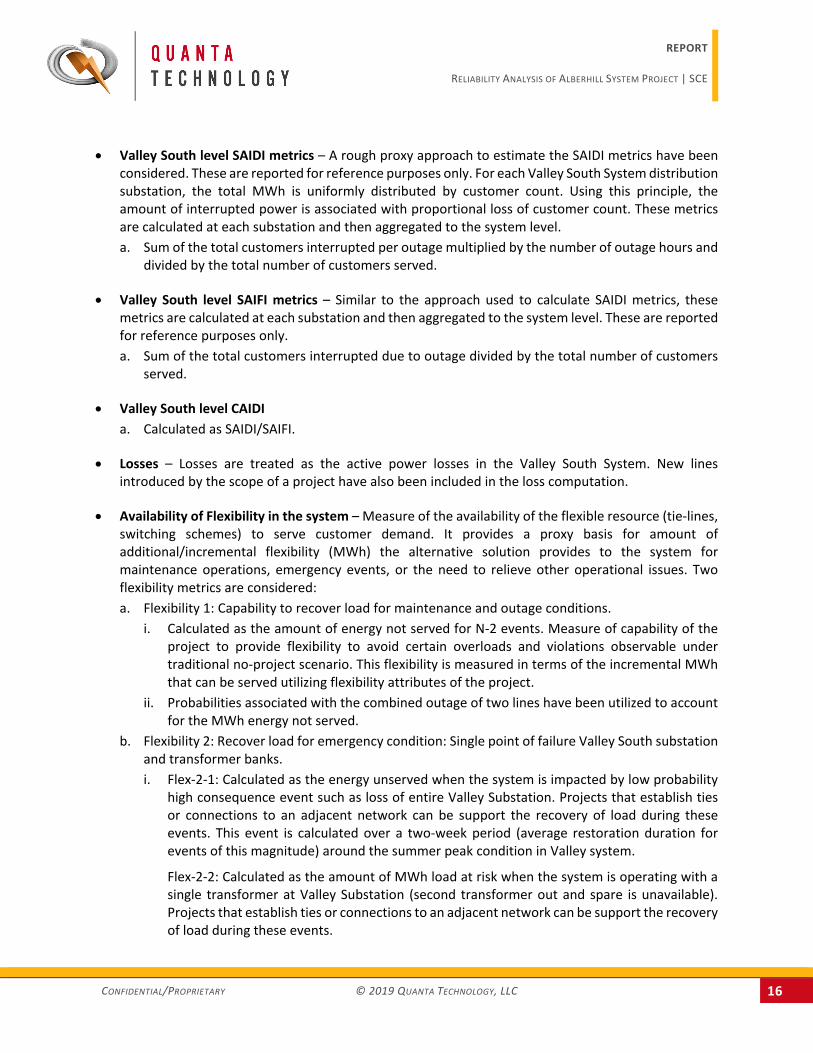
• Valley South level SAIDI metrics – A rough proxy approach to estimate the SAIDI metrics have been considered. These are reported for reference purposes only. For each Valley South System distribution substation, the total MWh is uniformly distributed by customer count. Using this principle, the amount of interrupted power is associated with proportional loss of customer count. These metrics are calculated at each substation and then aggregated to the system level. a. Sum of the total customers interrupted per outage multiplied by the number of outage hours and
divided by the total number of customers served.
• Valley South level SAIFI metrics – Similar to the approach used to calculate SAIDI metrics, these metrics are calculated at each substation and then aggregated to the system level. These are reported for reference purposes only. a. Sum of the total customers interrupted due to outage divided by the total number of customers
served.
• Valley South level CAIDI a. Calculated as SAIDI/SAIFI.
• Losses – Losses are treated as the active power losses in the Valley South System. New lines introduced by the scope of a project have also been included in the loss computation.
• Availability of Flexibility in the system – Measure of the availability of the flexible resource (tie-lines, switching schemes) to serve customer demand. It provides a proxy basis for amount of additional/incremental flexibility (MWh) the alternative solution provides to the system for maintenance operations, emergency events, or the need to relieve other operational issues. Two flexibility metrics are considered: a. Flexibility 1: Capability to recover load for maintenance and outage conditions.
i. Calculated as the amount of energy not served for N-2 events. Measure of capability of the project to provide flexibility to avoid certain overloads and violations observable under traditional no-project scenario. This flexibility is measured in terms of the incremental MWh that can be served utilizing flexibility attributes of the project.
ii. Probabilities associated with the combined outage of two lines have been utilized to account for the MWh energy not served.
b. Flexibility 2: Recover load for emergency condition: Single point of failure Valley South substation and transformer banks. i. Flex-2-1: Calculated as the energy unserved when the system is impacted by low probability
high consequence event such as loss of entire Valley Substation. Projects that establish ties or connections to an adjacent network can be support the recovery of load during these events. This event is calculated over a two-week period (average restoration duration for events of this magnitude) around the summer peak condition in Valley system.
Flex-2-2: Calculated as the amount of MWh load at risk when the system is operating with a single transformer at Valley Substation (second transformer out and spare is unavailable). Projects that establish ties or connections to an adjacent network can be support the recovery of load during these events.

REPORT
RELIABILITY ANALYSIS OF ALBERHILL SYSTEM PROJECT | SCE
CONFIDENTIAL/PROPRIETARY © 2019 QUANTA TECHNOLOGY, LLC 17
• Period of Flexibility Deficit – The PFD is a measure of the total number of periods (hours) when the available flexible capacity (from system tie-lines) were less than required resulting in energy being unserved for a given time horizon and direction.
The above list has been iteratively developed to successfully translate the objectives into quantifiable metrics that provide a basis for project performance evaluation.
2.3 Reliability Analysis of the Baseline System The baseline system is the no-project scenario within this analysis. It depicts a condition wherein the load grows to levels established by the forecast under study, without any project in service to address the short falls in transformer rated capacity. This scenario forms the primary basis for comparison against ASP performance to evaluate the benefits associated with the project.
The baseline system has been evaluated under study years 2022 (project need year), 2028, 2033, 2038, 2043, and 2048. Each of the reliability metrics established by Section 2.2.4 have been calculated using the study methodology outlined by Section 2.2.3.
2.3.1 System Performance under Normal Conditions (N-0)
Table 2-2 present the findings from system analysis under N-0 conditions in the system.
Table 2-2. Baseline N-0 System Performance
Year EENS (MWh)
IP (MW)
SAIDI (hr) SAIFI PFD
(hr) CAIDI (hr)
No
Proj
ect
2022 22.20 13.00 0.05 0.02 2.00 2.00
2028 250.40 64.60 1.87 0.27 7.00 7.00
2033 904.92 120.25 22.51 0.96 17.83 23.37
2038 2212.00 190.00 87.10 2.35 37.00 37.00
2043 4184.40 246.00 236.03 4.45 53.00 53.00
2048 6309.60 288.40 517.06 6.72 77.00 77.00
2.3.2 System Performance under Normal Conditions (N-1)
Table 2-3 presents the findings from system analysis under N-1 conditions.
Table 2-3. Baseline N-1 System Performance
Year EENS (MWh)
IP (MW)
SAIDI (hr) SAIFI PFD
(hr) CAIDI (hr)
No
Proj
ect 2022 10.00 2.00 0.08 0.01 14.00 14.00
2028 67.40 11.40 0.73 0.05 32.00 13.50

REPORT
RELIABILITY ANALYSIS OF ALBERHILL SYSTEM PROJECT | SCE
CONFIDENTIAL/PROPRIETARY © 2019 QUANTA TECHNOLOGY, LLC 18
Year EENS (MWh)
IP (MW)
SAIDI (hr) SAIFI PFD
(hr) CAIDI (hr)
2033 249.47 21.35 6.12 0.21 54.00 29.22
2038 678.80 35.10 24.37 0.59 88.00 41.13
2043 1595.60 45.30 93.41 1.41 120.00 66.14
2048 2823.00 68.40 253.88 2.53 153.00 100.16
In the baseline system analysis, the following constraints were found to be binding under N-0 and N-1 conditions. These are the key elements that contribute to the EENS among other reliability metrics under study (reported for 2022 and beyond). In Table 2-4 below, only the thermal violations associated with each constraint are reported.
Table 2-4. List of Baseline System Thermal Constraints
Overloaded Element Outage Category Outage Definition Year of Overload
Valley South Transformer N-0 Base case 2022
Auld to Moraga #1 N-0 Base case 2047
Auld to Moraga #2 N-1 Auld-Moraga #1 2038
Auld to Moraga #1 N-1 Auld-Moraga #2 2022
Valley EFG to Tap 39 N-1 Valley EFG-Newcomb-Skylark 2043
Tap 39 to Elsinore N-1 Valley EFG-Newcomb-Skylark 2038
Auld to Moraga #1 N-1 Skylark-Tenaja 2048
Skylark to Tap 22 #1 N-1 Valley EFG-Elsinore-Fogarty 2033
Valley EFG to Sun City N-1 Valley EFG-Auld #1 2043
Valley EFG to Auld #1 N-1 Valley EFG-Sun City 2048
Valley EFG to Tap 22 N-1 Valley EFG-Newcomb 2043
Valley EFG to Auld #1 N-1 Valley EFG-Auld #2 2048
Valley EFG to Sun City N-1 Valley EFG-Auld #2 2043
Auld to Moraga #1 N-1 Valley EFG - Triton 2043
Moraga-Pechanga N-1 Valley EFG - Triton 2038
2.3.3 Flexibility Metrics
Table 2-5 presents the findings from system analysis for Flex 1 and Flex 2 metrics.
Table 2-5. Flexibility and Resiliency Metrics for Baseline System

REPORT
RELIABILITY ANALYSIS OF ALBERHILL SYSTEM PROJECT | SCE
CONFIDENTIAL/PROPRIETARY © 2019 QUANTA TECHNOLOGY, LLC 19
Year Flex-1
EENS (MWh) Flex-2-1
EENS (MWh) Flex-2-2
EENS (MWh)
No
Proj
ect
2022 5,446 192,865 57,814
2028 16,219 201,538 74,821
2033 25,196 210,603 94,913
2038 34,173 220,085 118,576
2043 43,151 228,568 141,697
2048 52,128 234,771 159,823
2.3.4 System Losses
Table 2-6 presents the aggregated losses from 8,760 assessment of Valley South System.
Table 2-6. Losses in Baseline System
Year Losses (MWh)
No
Proj
ect
2022 49,667
2028 52,288
2033 54,472
2038 56,656
2043 58,840
2048 61,024
2.3.5 Key Highlights of System Performance
The key highlights of system performance for baseline system are as follows:
1. Without any project in service, the Valley South transformers are overload by year 2022 (above maximum transformer ratings).
2. By year 2028, 250 MWh of EENS is observable in the system under N-0 conditions. This extends to 6,309 MWh by 2048 with no project in service.
3. Between 2028 and 2048, the flexibility deficit in the system increases from 7 hours to 77 hours under N-0 condition.
4. With the system operating at load levels greater than 1,120 MVA, it becomes increasing challenging to maintain the system N-1 secure.

REPORT
RELIABILITY ANALYSIS OF ALBERHILL SYSTEM PROJECT | SCE
CONFIDENTIAL/PROPRIETARY © 2019 QUANTA TECHNOLOGY, LLC 20
2.4 Reliability Analysis of the Alberhill System Project The Alberhill system project has been evaluated under study years 2022, 2028, 2033, 2038, 2043 and 2048 consistent with the baseline system. Each of the reliability metrics established by Section 2.2.4 have been calculated using the study methodology outlined by Section 2.2.3.
2.4.1 Description of Project Solution
The Alberhill System Project would be constructed in Riverside County and includes the following components:
1. Construction of a new 1,120 MVA 500/115 kV substation to increase the electrical service capacity to the area presently served by the Valley South 115 kV system.
2. Construction of two new 500 kV transmission line segments to connect the new substation to SCE’s existing Serrano-Valley 500 kV transmission line. Total length of 3.3 miles.
3. Construction of a new 115 kV subtransmission line and modifications to existing 115 kV subtransmission lines to transfer five existing 115/12 kV substations (Ivyglen, Fogarty, Elsinore, Skylark, and Newcomb) presently served by the Valley South 115 kV system to the new 500/115 kV substation. Total length of approximately 20.4 miles.
4. Installation of telecommunications improvements to connect the new facilities to SCE’s telecommunications network. Total length of approximately 8.7 miles.
Figure 2-9 presents an overview of the project layout and schematic.

REPORT
RELIABILITY ANALYSIS OF ALBERHILL SYSTEM PROJECT | SCE
CONFIDENTIAL/PROPRIETARY © 2019 QUANTA TECHNOLOGY, LLC 21
Figure 2-9. Service territory configuration after proposed Alberhill System Project
2.4.2 System Performance under Normal Conditions (N-0)
Table 2-7 present the findings from system analysis under N-0 conditions.
Table 2-7. Alberhill N-0 System Performance
Year EENS IP SAIDI SAIFI PFD CAIDI

REPORT
RELIABILITY ANALYSIS OF ALBERHILL SYSTEM PROJECT | SCE
CONFIDENTIAL/PROPRIETARY © 2019 QUANTA TECHNOLOGY, LLC 22
(MWh) (MW) (hr) (hr) (hr)
ASP
2022 0.00 0.00 0.00 0.00 0.00 0.00
2028 0.00 0.00 0.00 0.00 0.00 0.00
2033 0.00 0.00 0.00 0.00 0.00 0.00
2038 0.00 0.00 0.00 0.00 0.00 0.00
2043 0.00 0.00 0.00 0.00 0.00 0.00
2048 3.00 1.90 0.02 0.01 2.00 2.00
2.4.3 System Performance under Normal Conditions (N-1)
Table 2-8 present the findings from system analysis under N-1 conditions.
Table 2-8. Alberhill N-1 System Performance
Year EENS
(MWh) IP
(MW) SAIDI (hr)
SAIFI PFD (hr)
CAIDI (hr)
ASP
2022 0.00 0.00 0.00 0.00 0.00 0.00
2028 0.00 0.00 0.00 0.00 0.00 0.00
2033 0.00 0.00 0.00 0.00 0.00 0.00
2038 20.70 7.70 0.21 0.05 4.00 4.00
2043 84.10 16.50 2.34 0.21 8.00 11.00
2048 202.20 24.00 9.06 0.51 14.00 17.64
In analyzing the ASP, the following constraints were found to be binding under N-0 and N-1 conditions. These are the key elements that contribute to the EENS among other reliability metrics under study (reported for 2022 and beyond).

REPORT
RELIABILITY ANALYSIS OF ALBERHILL SYSTEM PROJECT | SCE
CONFIDENTIAL/PROPRIETARY © 2019 QUANTA TECHNOLOGY, LLC 23
In Table 2-9 below, only the thermal violations associated with each constraint are reported.
Table 2-9. List of Baseline System Thermal Constraints
Overloaded Element Outage Category Outage Definition Year of Overload
Alberhill to Fogarty N-0 Basecase 2046
Alberhill to Fogarty N-1 Alberhill-Skylark 2038
Alberhill to Skylark N-1 Alberhill – Fogarty 2043
Auld to Moraga #1 N-1 Valley EFG-Newcomb-Tenaja 2048
2.4.4 Flexibility Metrics
Table 2-10 present the findings from system analysis for Flex 1 and Flex 2 metrics.
Table 2-10. Flexibility and Resiliency Metrics for ASP
Year Flex-1
EENS (MWh) Flex-2-1
EENS (MWh) Flex-2-2
EENS (MWh)
ASP
2022 0.00 7,809.90 0.00
2028 0.00 9,813.72 0.00
2033 0.00 12,149.00 0.00
2038 0.00 14,803.43 0.00
2043 0.00 17,351.06 44.31
2048 0.00 19,302.12 137.89
2.4.5 System Losses
Table 2-11 presents the aggregated losses from 8760 assessment of Valley South and ASP system.
Table 2-11. Losses in ASP
Year Losses (MWh)
ASP
2022 40,620.81
2028 42,671.28
2033 44,380.00
2038 46,088.73
2043 47,797.45
2048 49,506.18

REPORT
RELIABILITY ANALYSIS OF ALBERHILL SYSTEM PROJECT | SCE
CONFIDENTIAL/PROPRIETARY © 2019 QUANTA TECHNOLOGY, LLC 24
2.4.6 Key Highlights of System Performance
The key highlights of system performance are as follows:
1. With the project in service, overloading on the Valley South System transformers is avoided over the study horizon. EENS of 3 MWh is recorded under N-0 condition in year 2048 due to an observed overload of the Alberhill-Fogarty 115 kV line.
2. By year 2038, overloads due to N-1 events will be observable on the Alberhill-Fogarty 115 kV circuit, Alberhill-Skylark 115 kV and Auld-Moraga 115 kV circuits, which cannot be resolved by potential transfer flexibility.
3. The project provides significant flexibility to address N-1 and N-2 events in the system while also providing significant benefits to address needs under high consequence low probability events that occur in the Valley System.
2.5 Evaluation of Quantitative Metrics The established performance metrics were compared between baseline and ASP to quantify the overall benefits accrued over the 10-year and 30-year study horizons calculated at start of the need year 2022; i.e. end of 2021. The benefits are quantified as the difference between baseline and ASP for each of the metrics and discounted at SCE’s Weighted Aggregate Cost of Capital (WACC) of 10%. As an example, Figure 2-10 exhibits N-0 EENS values over study horizon and its present worth using discount rate of WACC. Similar process was applied for other metrics.
The present worth of benefits for reliability metrics over a 10-year and 30-year horizons are presented in Table 2-13.The cumulative benefits over a 10-year and 30-year horizon are presented in Table 2-12.
The cumulative and present worth of benefits are presented in Appendix C: Reliability Performance Additional Details for both, baseline and ASP to provide a relative comparison of performance in each reliability category.

REPORT
RELIABILITY ANALYSIS OF ALBERHILL SYSTEM PROJECT | SCE
CONFIDENTIAL/PROPRIETARY © 2019 QUANTA TECHNOLOGY, LLC 25
Figure 2-10 : N-0 EENS over the study horizon and its PV
Appendix C provides comparative metrics over the 10-year and 30-year horizon between the baseline (no project) and ASP. These are used to derive the benefits presented in Table 2-12 and Table C-1, below.
Table 2-12. Cumulative Benefits between Baseline and ASP (10-year and 30-year)
Category Component Cumulative Value of Benefits over 10-year horizon (until 2028)
Cumulative Value of Benefits over 30-year horizon (until 2048)
N-0 Losses (MWh) 65,319.27 277,608.08
N-1 EENS (MWh) 273.70 20,649.30
N-1 IP (MW) 45.20 601.15
N-1 SAIDI (hr) 3.01 1,344.27
N-1 SAIFI 0.22 16.27
N-1 PFD (hr) 173.00 1,907.00
N-1 Flex-1 (MWh) 75,825.61 777,346.52
N-1 Flex-2-1 (MWh) 1,320,395.24 5,426,238.65
N-1 Flex-2-2 (MWh) 466,803.38 2,872,775.50
N-0 EENS (MWh) 970.80 56,574.70
N-0 IP (MW) 287.80 4,052.60
N-0 SAIDI (hr) 6.48 3,267.57
N-0 SAIFI 1.03 60.20
N-0 PFD (hr) 35.00 811.00
- 1 2 3 4 5 6 7 8 9
10
PV o
f…20
2220
2320
2420
2520
2620
2720
2820
2920
3020
3120
3220
3320
3420
3520
3620
3720
3820
3920
4020
4120
4220
4320
4420
4520
4620
4720
48
EEN
S (M
Wh)
x 1
000
Year
PV
REPORT
RELIABILITY ANALYSIS OF ALBERHILL SYSTEM PROJECT | SCE
CONFIDENTIAL/PROPRIETARY © 2019 QUANTA TECHNOLOGY, LLC 26
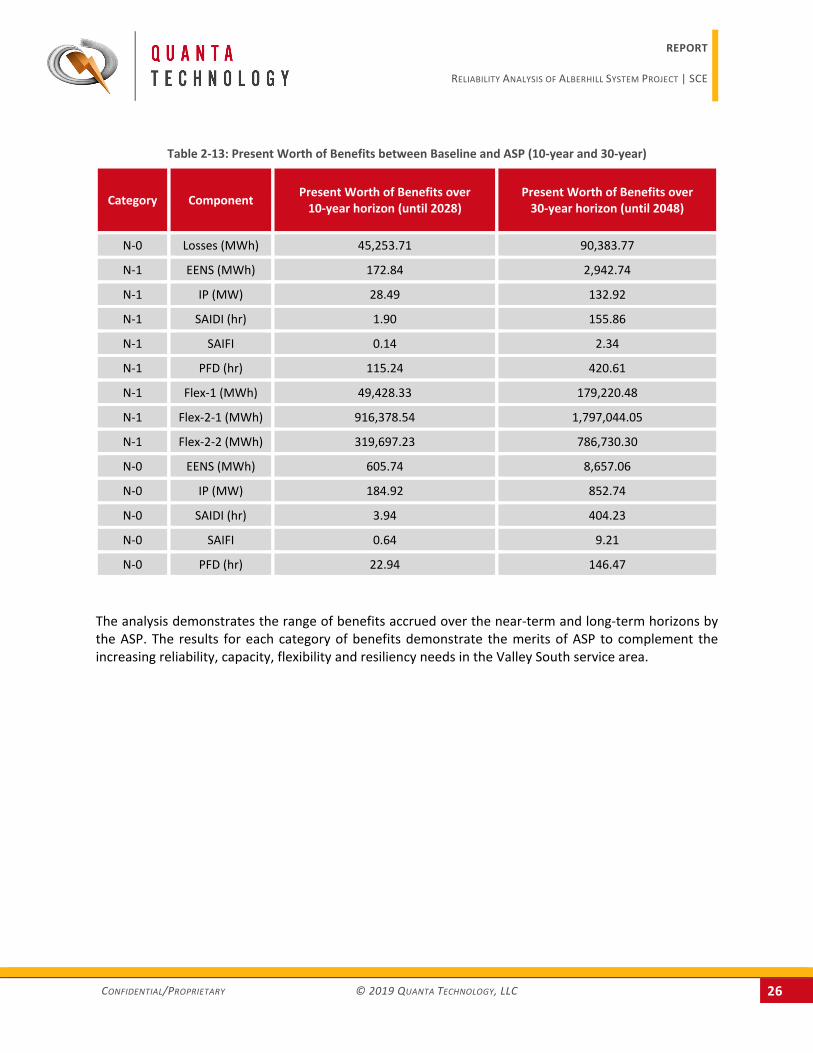
Table 2-13: Present Worth of Benefits between Baseline and ASP (10-year and 30-year)
Category Component Present Worth of Benefits over 10-year horizon (until 2028)
Present Worth of Benefits over 30-year horizon (until 2048)
N-0 Losses (MWh) 45,253.71 90,383.77
N-1 EENS (MWh) 172.84 2,942.74
N-1 IP (MW) 28.49 132.92
N-1 SAIDI (hr) 1.90 155.86
N-1 SAIFI 0.14 2.34
N-1 PFD (hr) 115.24 420.61
N-1 Flex-1 (MWh) 49,428.33 179,220.48
N-1 Flex-2-1 (MWh) 916,378.54 1,797,044.05
N-1 Flex-2-2 (MWh) 319,697.23 786,730.30
N-0 EENS (MWh) 605.74 8,657.06
N-0 IP (MW) 184.92 852.74
N-0 SAIDI (hr) 3.94 404.23
N-0 SAIFI 0.64 9.21
N-0 PFD (hr) 22.94 146.47
The analysis demonstrates the range of benefits accrued over the near-term and long-term horizons by the ASP. The results for each category of benefits demonstrate the merits of ASP to complement the increasing reliability, capacity, flexibility and resiliency needs in the Valley South service area.

REPORT
RELIABILITY ANALYSIS OF ALBERHILL SYSTEM PROJECT | SCE
CONFIDENTIAL/PROPRIETARY © 2019 QUANTA TECHNOLOGY, LLC 27
3 CONCLUSIONS
Southern California Edison (SCE) retained Quanta Technology to supplement the existing record in the California Public Utilities Commission (CPUC) proceedings for the Alberhill System Project (ASP) with additional analyses to meet the capacity and reliability needs of the Valley South 500/115 kV system. The overall objective of this report is to quantitatively assess the reliability benefits of the Alberhill System Project.
A comprehensive framework was developed in coordination with SCE to evaluate the performance of ASP. This evaluation is complemented by the development of load forecasts for the Valley North and Valley South system planning areas. Industry-accepted forecast methodologies to project load growth and to incorporate load-reduction programs (energy efficiency, demand response, and behind-the-meter generation) were implemented. The developed load forecast covers the horizon of 30 years (until year 2048).
The benefits were calculated using power-flow studies that evaluate the impact of the load forecast on the Valley South System both without and with ASP in service. Each of the reliability, capacity, flexibility and resiliency objectives of project performance is quantified by service reliability metrics over a 10-year and 30-year planning horizon. Benefits are quantified as the relative performance of ASP to the baseline for each of the metrics.
The key findings of this study are summarized as follows:
• The peak load forecast identifies a transformer capacity need in the Valley South system by the year 2022, as the load exceeds Valley South 500/115 kV transformer capacity of 1,120 MVA. The peak demand within Valley South service territory is projected to grow from 1,132 MVA in year 2022 to 1,378 MVA in year 2048.
• An evaluation of the quantitative metrics demonstrates significant benefits of the ASP project in meeting overall needs in the Valley South service area. Key highlights from ASP project performance across the 10-year (2028) and 30-year (2048) horizon are discussed. Without ASP in service and under normal operating conditions (N-0 or all facilities in service), the
load at risk increases from 250 MWh to 6,300 MWh between the years 2028 and 2048. With the ASP in service, the amount of load at risk is reduced to 3 MWh in 2048.
The periods wherein the system observes a shortage in capacity increases from 7 hours by the year 2028 to 77 hours by the year 2048 under normal operating conditions (N-0). With the ASP in service, this is reduced to 2 hours in the year 2048.
Without ASP in service, maintaining system adequate N-1 capacity becomes increasingly challenging at higher load levels. ASP reduces the N-1 capacity risk from 2,800 MWh to 200 MWh by the year 2048.
For emergency, unplanned or planned maintenance events involving the simultaneous outage of two or more subtransmission circuits in the Valley South System, the unavailability of system tie-

REPORT
RELIABILITY ANALYSIS OF ALBERHILL SYSTEM PROJECT | SCE
CONFIDENTIAL/PROPRIETARY © 2019 QUANTA TECHNOLOGY, LLC 28
lines results in approximately 52,000 MWh of load at risk by the year 2048. This is reduced to zero with the ASP in service.
ASP provides measurable operational flexibility improvement to address system needs under high impact, low probability (HILP) events in the Valley System. The current system configuration does not provide any benefit in this regard due to unavailable system ties.
ASP reduces the losses in the system from 52 GWh to 42 GWh in the year 2028 and from 61 GWh to 49 GWh in the year 2048.
Overall, ASP demonstrated robustness to address the needs identified in the Valley service territory. The project by design provides an alternative source of supply into the original Valley South service territory while effectively separating the system with tie-lines. This offers several advantages that can also overcome the variability and uncertainty associated with the forecast peak load. The available flexibility through system tie-lines provide relief to system operations under both normal system conditions (increasing flexibility for planned maintenance outages) and for abnormal system conditions (unplanned outages) such as N-1, N-2, and HILP events that affect the region.
Findings and results reported in this document are based on publicly available information and the information furnished by the client at the time of the study. Quanta Technology reserves the right to amend results and conclusions should additional information be provided or become available.

REPORT
RELIABILITY ANALYSIS OF ALBERHILL SYSTEM PROJECT | SCE
CONFIDENTIAL/PROPRIETARY © 2019 QUANTA TECHNOLOGY, LLC 29
APPENDIX A: GLOSSARY
ASP: Alberhill System Project
BES: Bulk Electric System
CAIDI: Customer Average Interruption Duration Index
CAISO: California Independent System Operator
CPUC: California Public Utility Commission
DER: Distributed Energy Resources
EENS: Expected Energy Not Served
NERC: North American Electric Reliability Corporation
SAIDI: System Average Interruption Duration Index
SAIFI: System Average Interruption Frequency Index
SCE: Southern California Edison
SDG&E: San Diego Gas & Electric
WECC: Western Electricity Coordinating Council

REPORT
RELIABILITY ANALYSIS OF ALBERHILL SYSTEM PROJECT | SCE
CONFIDENTIAL/PROPRIETARY © 2019 QUANTA TECHNOLOGY, LLC 30
APPENDIX B: REFERENCES
1. Sub-transmission Planning Criteria and Guidelines, SCE 9/24/2015. 2. Decision Granting Petition to Modify Permit to Construct the Valley-Ivyglen 115 kV Sub-transmission
Line Project and Holding Proceeding Open for Certificate of Public Convenience and Necessity for The Alberhill System Project, CPUC 8/31/2018.

REPORT
RELIABILITY ANALYSIS OF ALBERHILL SYSTEM PROJECT | SCE
CONFIDENTIAL/PROPRIETARY © 2019 QUANTA TECHNOLOGY, LLC 31
APPENDIX C: RELIABILITY PERFORMANCE ADDITIONAL DETAILS
The cumulative benefits over a 10-year and 30-year horizon are presented in Table C-1 and Table C-2, respectively.
Table C-1 : Cumulative Reliability Performance and Benefits with and without the ASP (10-year)
Category Component
Cumulative Service Reliability Performance
over
Cumulative Service Reliability Performance
over Cumulative Benefit
over 10-year horizon 10-year horizon 10-year horizon
Baseline ASP Baseline - ASP
N-0 Losses (MWh)
356,841.60 291,522.32 65,319.27
N-1 EENS (MWh) 273.70 0.00 273.70
N-1 IP (MW) 45.20 0.00 45.20
N-1 SAIDI (hr) 3.01 0.00 3.01
N-1 SAIFI 0.22 0.00 0.22
N-1 PFD (hr) 173.00 0.00 173.00
N-1 Flex-1 (MWh)
75,825.61 0.00 75,825.61
N-1 Flex-2-1 (MWh)
1,382,418.62 62,023.38 1,320,395.24
N-1 Flex-2-2 (MWh)
466,803.38 0.00 466,803.38
N-0 EENS (MWh) 970.80 0.00 970.80
N-0 IP (MW) 287.80 0.00 287.80
N-0 SAIDI (hr) 6.48 0.00 6.48
N-0 SAIFI 1.03 0.00 1.03
N-0 PFD (hr) 35.00 0.00 35.00
Table C-2: Cumulative Reliability Performance and Benefits with and without the ASP (30-year)
Category Component
Cumulative Service Reliability Performance
over
Cumulative Service Reliability Performance
over Cumulative Benefit
over 10-year horizon (till 2048) 30-year horizon (until
2048) 30-year horizon (until
2048)
Baseline ASP Baseline - ASP
N-0 Losses (MWh)
1,494,322.42 1,216,714.34 277,608.08

REPORT
RELIABILITY ANALYSIS OF ALBERHILL SYSTEM PROJECT | SCE
CONFIDENTIAL/PROPRIETARY © 2019 QUANTA TECHNOLOGY, LLC 32
Category Component
Cumulative Service Reliability Performance
over
Cumulative Service Reliability Performance
over Cumulative Benefit
over 10-year horizon (till 2048) 30-year horizon (until
2048) 30-year horizon (until
2048)
Baseline ASP Baseline - ASP
N-1 EENS (MWh) 21,683.80 1,034.50 20,649.30
N-1 IP (MW) 780.05 178.90 601.15
N-1 SAIDI (hr) 1,379.19 34.92 1,344.27
N-1 SAIFI 18.89 2.62 16.27
N-1 PFD (hr) 1,999.00 92.00 1,907.00
N-1 Flex-1 (MWh)
777,346.52 0.00 777,346.52
N-1 Flex-2-1 (MWh)
5,787,561.58 361,322.93 5,426,238.65
N-1 Flex-2-2 (MWh)
2,873,359.55 584.05 2,872,775.50
N-0 EENS (MWh) 56,580.70 6.00 56,574.70
N-0 IP (MW) 4,056.40 3.80 4,052.60
N-0 SAIDI (hr) 3,267.62 0.04 3,267.57
N-0 SAIFI 60.22 0.02 60.20
N-0 PFD (hr) 815.00 4.00 811.00
The present worth of benefits over a 10-year and 30-year horizon are presented in Table C-3 and Table C-4, respectively.
Table C-3 : Present Worth of Benefits with and without the ASP (10-year)
Category Component
Present Worth of Service Reliability Performance
over
Present Worth of Service Reliability Performance
over Present Worth of
Benefits over 10-year horizon (till 2028) 10-year horizon (until
2028) 10-year horizon (until
2028) Baseline ASP Baseline - ASP
N-0 Losses (MWh)
247,374.57 202,120.85 45,253.71
N-1 EENS (MWh) 172.84 0.00 172.84
N-1 IP (MW) 28.49 0.00 28.49
N-1 SAIDI (hr) 1.90 0.00 1.90
N-1 SAIFI 0.14 0.00 0.14

REPORT
RELIABILITY ANALYSIS OF ALBERHILL SYSTEM PROJECT | SCE
CONFIDENTIAL/PROPRIETARY © 2019 QUANTA TECHNOLOGY, LLC 33
Category Component
Present Worth of Service Reliability Performance
over
Present Worth of Service Reliability Performance
over Present Worth of
Benefits over 10-year horizon (till 2028) 10-year horizon (until
2028) 10-year horizon (until
2028) Baseline ASP Baseline - ASP
N-1 PFD (hr) 115.24 0.00 115.24
N-1 Flex-1 (MWh)
49,428.33 0.00 49,428.33
N-1 Flex-2-1 (MWh)
958,931.40 42,552.86 916,378.54
N-1 Flex-2-2 (MWh)
319,697.23 0.00 319,697.23
N-0 EENS (MWh) 605.74 0.00 605.74
N-0 IP (MW) 184.92 0.00 184.92
N-0 SAIDI (hr) 3.94 0.00 3.94
N-0 SAIFI 0.64 0.00 0.64
N-0 PFD (hr) 22.94 0.00 22.94
Table C-4: Present Worth Reliability Performance and Benefits with and without the ASP (30-year)
Category Component
Present Worth of Service Reliability Performance
over
Present Worth of Service Reliability Performance
over Present Worth of
Benefits over 30-year horizon (till 2048) 30-year horizon (until
2048) 30-year horizon (until
2048) Baseline ASP Baseline - ASP
N-0 Losses (MWh)
490,136.78 399,753.01 90,383.77
N-1 EENS (MWh) 3,054.09 111.35 2,942.74
N-1 IP (MW) 153.69 20.77 132.92
N-1 SAIDI (hr) 159.38 3.52 155.86
N-1 SAIFI 2.63 0.28 2.34
N-1 PFD (hr) 431.20 10.59 420.61
N-1 Flex-1 (MWh)
179,220.48 0.00 179,220.48
N-1 Flex-2-1 (MWh)
1,898,439.25 101,395.19 1,797,044.05
N-1 Flex-2-2 (MWh)
786,786.30 56.00 786,730.30
N-0 EENS (MWh) 8,657.55 0.49 8,657.06

REPORT
RELIABILITY ANALYSIS OF ALBERHILL SYSTEM PROJECT | SCE
CONFIDENTIAL/PROPRIETARY © 2019 QUANTA TECHNOLOGY, LLC 34
Category Component
Present Worth of Service Reliability Performance
over
Present Worth of Service Reliability Performance
over Present Worth of
Benefits over 30-year horizon (till 2048) 30-year horizon (until
2048) 30-year horizon (until
2048) Baseline ASP Baseline - ASP
N-0 IP (MW) 853.05 0.31 852.74
N-0 SAIDI (hr) 404.23 0.00 404.23
N-0 SAIFI 9.21 0.00 9.21
N-0 PFD (hr) 146.79 0.33 146.47