Embed Size (px)
Citation preview

Releasing statistics in spreadsheets: Good practice guidance
November 2014 Version 1.0
Guidance purpose This guidance presents good practice for releasing statistics in spreadsheets. It focuses on data released as part of an Official Statistics publication and has two main parts:
Part 1 is about how statistics are displayed. It looks at information that all users will require - as well as preparing worksheets for both: i) presentation purposes ii) data re-use Part 2 is about how the statistics are released. It looks at the open data agenda and how this applies to spreadsheet data released as part of an Official Statistics publication.
Caution: Since there are often many different users for a given set of statistics, it is not always the case that a given presentation format will meet the needs of all users (and potential users). This is discussed throughout in the guidance.

Contents • Document purpose
• Part 1: How statistics are presented a) Information that all users will require b) Preparing worksheets for presentation c) Preparing worksheets for re-use d) Good practice checklist
• Part 2: Releasing data in standardised, open formats a) Background b) Open data format –a case study
• Annex A: Examples from the GSS
• Annex B: Acknowledgements
Clicking on underlined text in the guidance takes you
directly to the relevant link

This section looks at good practice in presenting statistics in spreadsheets
Know your audience The most important consideration when presenting statistics is to think about what information your users will need to make the statistics useful - Code of Practice Principle 1: meeting user needs. Note that different users may have different requirements from the statistics.
Part 1 contents: a) Information that all users will require:
• A contents page • A guidance page • Consistent symbols and codes • Clear, concise, informative titles and headings • Communication of uncertainty • Professional finishing touches
b) Preparing worksheets for presentation (how the statistics appear to the user)
c) Preparing worksheets for re-use (for users focused on re-using the data)
d) A good practice checklist
Part 1: How statistics are presented
Guidance Navigation
Part 1: How statistics are presented a) Information all users
will require b) Preparing worksheets
for presentation c) Preparing worksheets
for re-use d) A good practice
checklist
Part 2: Releasing data in standardised, open formats a) Background b) Case study
Annex A: Examples from the GSS a) A contents page b) A guidance page c) Communicating
uncertainty d) Presentation Vs Re-use
Annex B: Acknowledgements
Start Part Two

Example: House Price Statistics (Office for National Statistics)
This spreadsheet has a succinct and informative contents page.
A contents page
A contents page should include: • Title of the release or data series - including topic, time
period and geographical region • Information about each tab in the spreadsheet (with hyperlinks)
• A link to the wider data series homepage (if available)
• A link to the source publication or bulletin
Providing a link to the publication puts the spreadsheet into the context of supporting documentation and allows the user to find updates. If there are several workbooks in one zipped file, or major changes to the data series, consider a contents page which covers all of them. Also consider whether a cover page would be useful to users (to help frame the release).
Your dataset should have an accompanying contents page
A contents page will help orientate the user, confirm they have found the right statistics and help them locate the exact figures they require.
Guidance Navigation
Part 1: How statistics are presented a) Information all users
will require b) Preparing worksheets
for presentation c) Preparing worksheets
for re-use d) A good practice
checklist
Part 2: Releasing data in standardised, open formats a) Background b) Case study
Annex A: Examples from the GSS a) A contents page b) A guidance page c) Communicating
uncertainty d) Presentation Vs Re-use
Annex B: Acknowledgements
Start Part Two
Click here for more information
(in Annex A)

Example: UK Property Transaction Statistics (HM Revenue & Customs)
The guidance on page 1 is helpful and signposts users to further information.
A notes or guidance page
Notes or guidance should include: • Contact details for responsible statistician and media
enquiries • Date of publication and next update • Glossary of essential technical terms and acronyms (or link to)
• Link to supporting metadata and methodological documents
Guidance information should be relevant to the dataset as a whole, rather than individual tables. It might be appropriate to combine guidance material and a contents page.
Your dataset should have accompanying guidance information
Users need enough information in the spreadsheet to interpret and use the data. Users often save spreadsheets for later reference (without saving the original web page).
Click here for more information
(in Annex A)
Guidance Navigation
Part 1: How statistics are presented a) Information all users
will require b) Preparing worksheets
for presentation c) Preparing worksheets
for re-use d) A good practice
checklist
Part 2: Releasing data in standardised, open formats a) Background b) Case study
Annex A: Examples from the GSS a) A contents page b) A guidance page c) Communicating
uncertainty d) Presentation Vs Re-use
Annex B: Acknowledgements
Start Part Two

Symbols and coding
Consistent use of symbols across the GSS is vital for users to make clear and robust comparisons between datasets
The National Statistics Harmonisation Group (NSHG) is responsible for the design, development and maintenance of common statistical frames and definitions for statistics.
GSS standard symbols
Use nationally recognised classifications like geography codes whenever possible. This is mandatory in some cases. Include a guide to symbols and codes used. Help users to understand changes in classifications. For example, the geography code history database helps users to track changes in area codes.
Concept Symbol
Break in time series b
Confidential c
Earliest revision †
Estimated e
Forecast f
Less than half the final digit shown and different from a real zero
~
Low reliability u
Nil 0
Not applicable z
Not available :
Not significant n
Provisional p
Revised r
Further explanation of these symbols is available in more detailed guidance on the GSS website.
Guidance Navigation
Part 1: How statistics are presented a) Information all users
will require b) Preparing worksheets
for presentation c) Preparing worksheets
for re-use d) A good practice
checklist
Part 2: Releasing data in standardised, open formats a) Background b) Case study
Annex A: Examples from the GSS a) A contents page b) A guidance page c) Communicating
uncertainty d) Presentation Vs Re-use
Annex B: Acknowledgements
Start Part Two

Titles and headings
Does your spreadsheet have informative titles and headings?
Each individual table should have its own title (and subtitle if necessary). Include the following information:
1. A summary of the main subject and breakdown categories
2. The i) time period, ii) regularity of the data, iii) type of data, iv) geographical region covered and iv) units used1
3. Any adjustments to the statistics2
In addition:
• Titles should be in a larger font than headings
• Consider separating the title from the table with a blank row
• Note and explain if data is provisional or revised
• If different columns have different units, include this as part of table headings.
KNOW YOUR AUDIENCE: How titles and heading are displayed will affect data re-useability. More information on presenting data for re-use is available here.
1 The type of data might include counts, rates, percentages, means, confidence intervals. 2 Including if the data has been seasonally adjusted, or presents Full Time Equivalent (FTE) rather than staff headcount.
Guidance Navigation
Part 1: How statistics are presented a) Information all users
will require b) Preparing worksheets
for presentation c) Preparing worksheets
for re-use d) A good practice
checklist
Part 2: Releasing data in standardised, open formats a) Background b) Case study
Annex A: Examples from the GSS a) A contents page b) A guidance page c) Communicating
uncertainty d) Presentation Vs Re-use
Annex B: Acknowledgements
Start Part Two

Example: National Survey for Wales (Welsh Government)
This example uses colour coding in reference tables to visually convey the uncertainty in the statistics.
Communicating uncertainty
Being upfront about uncertainty helps to protect the integrity of statistics
The challenge here is to provide information and explanation that gives assurance and supports understanding of the statistics.
Presenting statistical significance
Presenting confidence intervals
Explain whether a change is statistically significant, where possible. Provide a plain English description of statistical significance.
Significance Level Display Significant at 0.001 level *** Significant at 0.01 level ** Significant at 0.05 level *
Click here for more information
(in Annex A)
Guidance Navigation
Part 1: How statistics are presented a) Information all users
will require b) Preparing worksheets
for presentation c) Preparing worksheets
for re-use d) A good practice
checklist
Part 2: Releasing data in standardised, open formats a) Background b) Case study
Annex A: Examples from the GSS a) A contents page b) A guidance page c) Communicating
uncertainty d) Presentation Vs Re-use
Annex B: Acknowledgements
Start Part Two
For more information see: GSS Guidance on Communicating Uncertainty and Change.
Best display: Both for presentation & re-use The intervals are clearly displayed. Using separate cells enables the data to be more easily reused.
Possible displays: If space is an issue Consider these displays if you have large amounts of data. But, these make it harder for data re-use.

Finishing touches Ensure the spreadsheet has:
• No formal references to other spreadsheets
• Sensibly named tabs which open in the correct place on the sheet
• A sensible opening page. Usually the contents page, or a page which helps the user locate the information they need quickly
• Column/row widths which allow the whole cell contents to be read
• Wrapped text which doesn’t split mid-word
• Correct spelling and grammar
• Underlying cell values which are unrounded for re-use
• Sensible zoom levels - set to optimise text size against maximising screen content. Ideally set the same on all pages
Professional finishing touches reassure users that time and effort have been put into the publication - which aids confidence in the numbers
Think about the print setting for users - so that sheets print neatly onto the fewest A4 pages possible. When spanning more than one side of A4, set the table headings to appear on each sheet.
Guidance Navigation
Part 1: How statistics are presented a) Information all users
will require b) Preparing worksheets
for presentation c) Preparing worksheets
for re-use d) A good practice
checklist
Part 2: Releasing data in standardised, open formats a) Background b) Case study
Annex A: Examples from the GSS a) A contents page b) A guidance page c) Communicating
uncertainty d) Presentation Vs Re-use
Annex B: Acknowledgements
Start Part Two

Formatting for presentation
• See GSS guidance on Effective Graphs and Tables in Official Statistics
• Use ‘freeze panes’ to keep row and column headings visible
• Consider transposing your table: scrolling down is easier than across
• Divide your tables across worksheets to assist reading. For re-use it may be helpful to keep each table together on one sheet
• Summaries such as averages and subtotals help to set the context, but can hamper re-use if embedded in the body of the table
• Adjust row heights and column widths to create space, rather than inserting blank rows or columns, which can hamper re-use
• Hard code formula results to avoid accidental errors in use
• Format numbers as numbers and consider if rounding is appropriate. Rounding assists comparisons and makes numbers easier to remember. But, think about the level of detail your users require
User need is the top priority when disseminating statistics. For some users, the clarity of presentation is the most important concern
Further reading on the importance of understanding user need: 1. Government Service Design Manual: User needs 2. Office for National Statistics’ work on creating user personas
Guidance Navigation
Part 1: How statistics are presented a) Information all users
will require b) Preparing worksheets
for presentation c) Preparing worksheets
for re-use d) A good practice
checklist
Part 2: Releasing data in standardised, open formats a) Background b) Case study
Annex A: Examples from the GSS a) A contents page b) A guidance page c) Communicating
uncertainty d) Presentation Vs Re-use
Annex B: Acknowledgements
Start Part Two
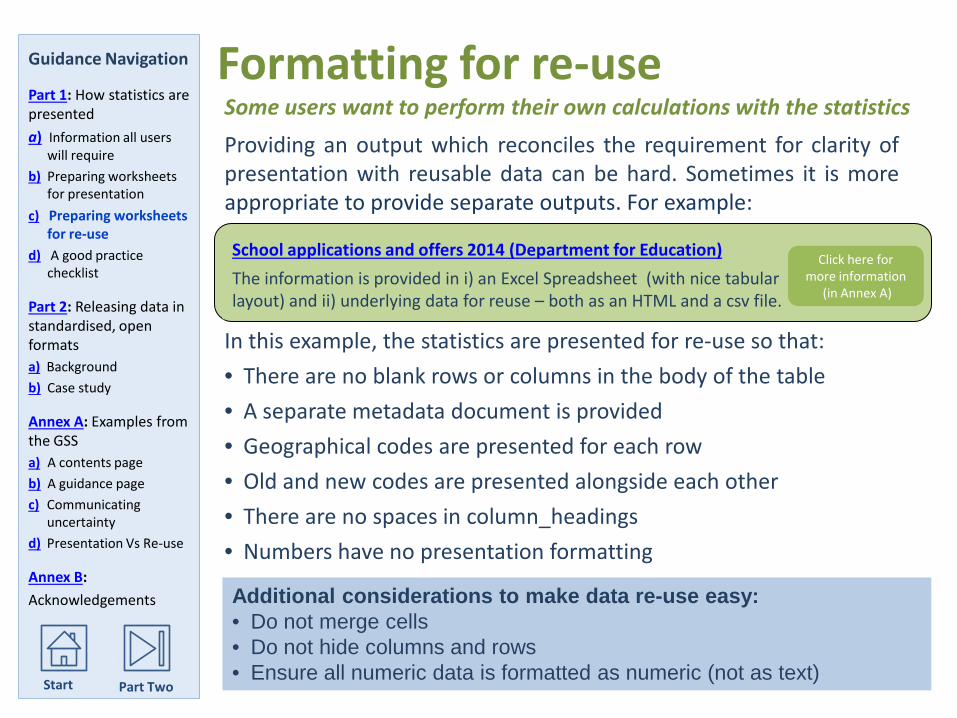
Formatting for re-use Providing an output which reconciles the requirement for clarity of presentation with reusable data can be hard. Sometimes it is more appropriate to provide separate outputs. For example:
Some users want to perform their own calculations with the statistics
School applications and offers 2014 (Department for Education)
The information is provided in i) an Excel Spreadsheet (with nice tabular layout) and ii) underlying data for reuse – both as an HTML and a csv file.
In this example, the statistics are presented for re-use so that:
• There are no blank rows or columns in the body of the table
• A separate metadata document is provided
• Geographical codes are presented for each row
• Old and new codes are presented alongside each other
• There are no spaces in column_headings
• Numbers have no presentation formatting
Additional considerations to make data re-use easy: • Do not merge cells • Do not hide columns and rows • Ensure all numeric data is formatted as numeric (not as text)
Click here for more information
(in Annex A)
Guidance Navigation
Part 1: How statistics are presented a) Information all users
will require b) Preparing worksheets
for presentation c) Preparing worksheets
for re-use d) A good practice
checklist
Part 2: Releasing data in standardised, open formats a) Background b) Case study
Annex A: Examples from the GSS a) A contents page b) A guidance page c) Communicating
uncertainty d) Presentation Vs Re-use
Annex B: Acknowledgements
Start Part Two

Formatting for presentation • Use ‘freeze panes’ to keep row and column headings visible • Consider transposing your table: scrolling down is easier than scrolling
across • Divide your tables across worksheets to assist reading. • Summaries such as averages and subtotals help to set the context, but
can hamper re-use if embedded in the body of the table • Adjust row heights and column widths to create space, rather than
inserting blank rows or columns, which can hamper re-use • Hard code formula results to avoid accidental errors in use • Format numbers as numbers and pay attention to the displayed
rounding and precision so users can get a feel for the numbers
Formatting for easy re-use • No blank rows or columns in the body of the table and no spaces in
column headings • Do not merge cells or hide columns or rows • Provide a separate metadata document • Geographical codes presented for each row • Numbers formatted as numbers, with no presentation formatting
A contents page, containing: • Title of the release or data series, with time period and geographical
region • Information about each tab in the spreadsheet (with hyperlinks)
• A link to wider data series homepage (if available)
• A link to the publication itself
A notes or guidance page, containing: • Contact details for responsible statistician and media enquiries • Date of publication and next update • Glossary of essential technical terms and acronyms (or link to) • Link to supporting metadata and methodological documents
Clear and concise titles and headings • Each individual table should have its own title (and subtitle if necessary) • Titles should include a summary of main subject and breakdown
categories including the i) time period, ii) regularity of the data, iii) type of data, iv) geographical region covered, iv) units used, v) adjustments made, and vi) status
• Titles should be in a larger font than headings • Consider separating the title from the table with a blank row
Consistent symbols and codes • Use nationally recognised classifications and geography codes • Use GSS standard symbols
Communicating uncertainty • Confidence intervals clearly displayed, in separate cells if possible • Explain whether a change is statistically significant (using *), where
appropriate and provide a plain English description of statistical significance
Releasing statistics in spreadsheets Good practice checklist
All users will require …
Formatting for presentation and re-use
Finishing touches … • Sensibly named tabs which open in the correct place on the sheet • Column/row widths which allow the whole cell contents to be read • Wrapped text which doesn’t split mid-word • Correct spelling and grammar • Underlying cell values which are un-rounded for re-use • Sensible zoom levels. Set to optimise text size against maximising screen
content - ideally set the same on all pages
This list is not supposed to be prescriptive – the most important consideration is to think about what information your users will need to make the spreadsheet useful. Focus on whether the user can locate and reuse the information easily.

Part 2: Releasing data in open formats Good practice in choosing file formats for statistics in spreadsheets
Code of Practice for Official Statistics: The Code recognises and focuses on the value of data, particularly concerning accessibility (Principle 8) which requires producers to:
“ Release datasets and reference databases, supported by documentation, in formats that are convenient to users” (Principle 8, practice 6)
This complements Principle 1 - meeting user needs.
Government Open Data White Paper: Released in June 2012, this paper sets out an open data vision: to make it easier for data publishers to release data in standardised, open formats. The paper introduces a ranking scheme from 1 to 5 stars to measure the usability of open data.
The statistical community is considering the implications of adopting open data principles. As illustrated in Part 1, statistics should not be separated from supporting information. Context and caveats are vital to ensure users have enough information to interpret and make effective use of the data.
Guidance Navigation
Part 1: How statistics are presented a) Information all users
will require b) Preparing worksheets
for presentation c) Preparing worksheets
for re-use d) A good practice
checklist
Part 2: Releasing data in standardised, open formats a) Background b) Case study
Annex A: Examples from the GSS a) A contents page b) A guidance page c) Communicating
uncertainty d) Presentation Vs Re-use
Annex B: Acknowledgements
Start Part One
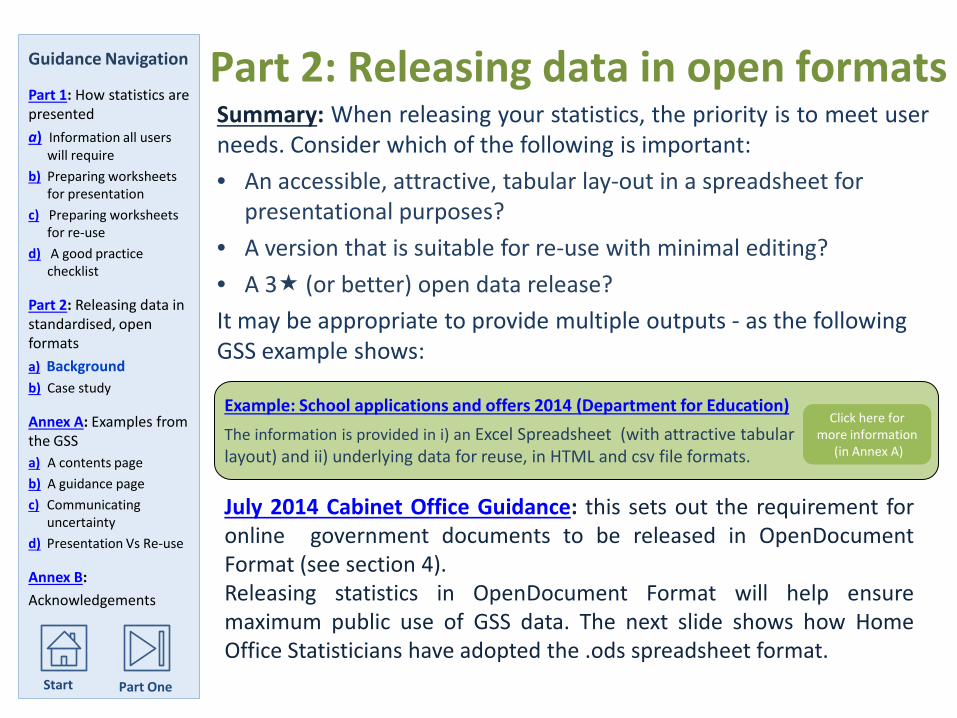
Part 2: Releasing data in open formats
Summary: When releasing your statistics, the priority is to meet user needs. Consider which of the following is important: • An accessible, attractive, tabular lay-out in a spreadsheet for
presentational purposes? • A version that is suitable for re-use with minimal editing? • A 3 (or better) open data release? It may be appropriate to provide multiple outputs - as the following GSS example shows:
Example: School applications and offers 2014 (Department for Education)
The information is provided in i) an Excel Spreadsheet (with attractive tabular layout) and ii) underlying data for reuse, in HTML and csv file formats.
July 2014 Cabinet Office Guidance: this sets out the requirement for online government documents to be released in OpenDocument Format (see section 4). Releasing statistics in OpenDocument Format will help ensure maximum public use of GSS data. The next slide shows how Home Office Statisticians have adopted the .ods spreadsheet format.
Click here for more information
(in Annex A)
Guidance Navigation
Part 1: How statistics are presented a) Information all users
will require b) Preparing worksheets
for presentation c) Preparing worksheets
for re-use d) A good practice
checklist
Part 2: Releasing data in standardised, open formats a) Background b) Case study
Annex A: Examples from the GSS a) A contents page b) A guidance page c) Communicating
uncertainty d) Presentation Vs Re-use
Annex B: Acknowledgements
Start Part One

Case Study: Home Office statistical releases Home Office statisticians publish data tables in the XML-based OpenDocument spreadsheet (.ods) format - making these 3 releases. These spreadsheets are easy to produce. For example, in Excel simply select this format when saving. You can opt to use .ods as your default file format.
Some complex features, such as pivot tables, are not fully supported in .ods files. The Home Office provide additional guidance for Mac users who may experience difficulty with this open format. Compatibility information is available online, but the simplest approach is to check that each table re-opens as expected.
You can open these files in most spreadsheet programs. Unlike csv, the tables retain formatting. The files are also smaller than Excel equivalents.
Applications received for asylum in the United Kingdom, July 2014 (1)
Number of applicants
of whom: of whom: of whom:main main main
Month applicants applicants applicants
Latest monthly data provided to EUROSTAT under Regulation (EC) No 862/2007 of the European Parliament and of the Council on Community
July 2014 (P) 2,902 2,291 2,946 2,327 211 197
(1) For the f igures w hich include dependants further disaggregations by age, gender and nationality w ill be available on the EUROSTAT w ebsite: http://epp.eurostat.ec.europa.eu/portal/page/portal/statistics/search_database
(2) Excludes applicants w ho have made a fresh claim in the same reference month.(3) Includes re-applicants w ho w ithdrew a fresh claim. (P) Provisional f igures.
ApplicationsApplications including fresh claims (2) Applications w ithdraw n (3)
Total (including
dependants)
Total (including
dependants)
Total (including
dependants)
Guidance Navigation
Part 1: How statistics are presented a) Information all users
will require b) Preparing worksheets
for presentation c) Preparing worksheets
for re-use d) A good practice
checklist
Part 2: Releasing data in standardised, open formats a) Background b) Case study
Annex A: Examples from the GSS a) A contents page b) A guidance page c) Communicating
uncertainty d) Presentation Vs Re-use
Annex B: Acknowledgements
Start Part One

Annex A: Contents Page A good practice example
Title of the release and release date
Advance notice of future releases
Guidance on how to navigate the workbook
Hyperlinks to each worksheet
Link: publication home page Link: Publication spreadsheet
Cross-reference to earlier releases
Future release dates are table specific
Consider linking to publication or homepage
Click to return to guidance

Annex A: Notes or Guidance Page
Producer and title
A good practice example
Link: publication home page Link: Publication spreadsheet
Click to return to guidance
Date of current and future releases
Period covered
For this release, the details of the responsible statistician are on the cover sheet
Explanation of statistics and source
Further explanation through statistical commentary

Annex A: Communicating uncertainty
Colour coding based on coefficient of variation. Note this works in grey-scale
A good practice example
Link: publication home page Link: Publication spreadsheet
An explanation of the uncertainty and the confidence intervals
Click to return to guidance
Sample size also provides an indicator of likely precision
For more information see: GSS guidance on communicating uncertainty and change
Lower and upper confidence limits also provided

Annex A: Presentation versus re-use
Title of the release, including time period
Includes national and regional summaries
Numbers for comparison presented in columns
Formats appropriate for the statistics
Use freeze panes to retain title and headings
A good practice example – spreadsheet focused on clarity of presentation
Link: Publication spreadsheet Link: publication home page
See next slide for the same spreadsheet focused on reusability
Click to return to guidance
Statistics presented as numbers, not formulae

Annex A: Presentation versus re-use
Title and top level metadata removed
Standard geographical codes are used
Variable names supplied, without spaces
Totals and subtotals for countries and regions in fixed row positions at top and coded appropriately
Blank rows and columns removed
Presentation formats removed from numbers
A good practice example – spreadsheet focused on reusability
Link: publication home page Link: Publication underlying data
See previous slide for the same spreadsheet focused on clarity of presentation Click to
return to guidance
Released as .csv file
Annex B: Acknowledgements • This guidance has been developed by the Good Practice Team in collaboration
with GSS statisticians Louisa Ashby and Emily Barnett. The project was initiated when Louisa and Emily were on secondment from the GSS to the factchecking organisation Full Fact1.
• The Good Practice Team (GPT) would like to thank Louisa and Emily for developing the original content and working with us on this new version.
• The GPT would also like to thank:
– Bill Oates for technical advice on open data
– Colleagues in the UK Statistics Authority
– All GSS statistical producers who provided feedback on draft versions
– The Full Fact team for helping initiate the project and subsequent input
Contact information For more information about this guidance, or if you have any questions, please contact the GSS Good Practice Team: [email protected] or 01633 651593.
1 The GSS offer secondments to Full Fact (for Senior Statistical Officers & Assistant Statisticians). Further details are available on the GSS website.