Embed Size (px)
Citation preview

Community Development Research
Committee of the Whole
Release of the
2020 Generalized Land Use
Inventory
August 4, 2021
2
• Conducted every 3-7 years
• Based on:
• Aerial photography
• Assessor information
• Building permits & Internet searches
• Represents existing use – not tax
classification, land use guidance, or
land cover
• Interpreted and classified using
generalized and uniform classifications
• Reviewed by communities
• Snapshot in time
About the Land Use Inventory

3
• Land consumption
• Development trends
• Forecasting and land supply
• Regional land use planning
• Climate Analysis
• Groundwater and Surface Water
modeling
• Used by many communities
Why we undertake the
Land Use Inventory
4
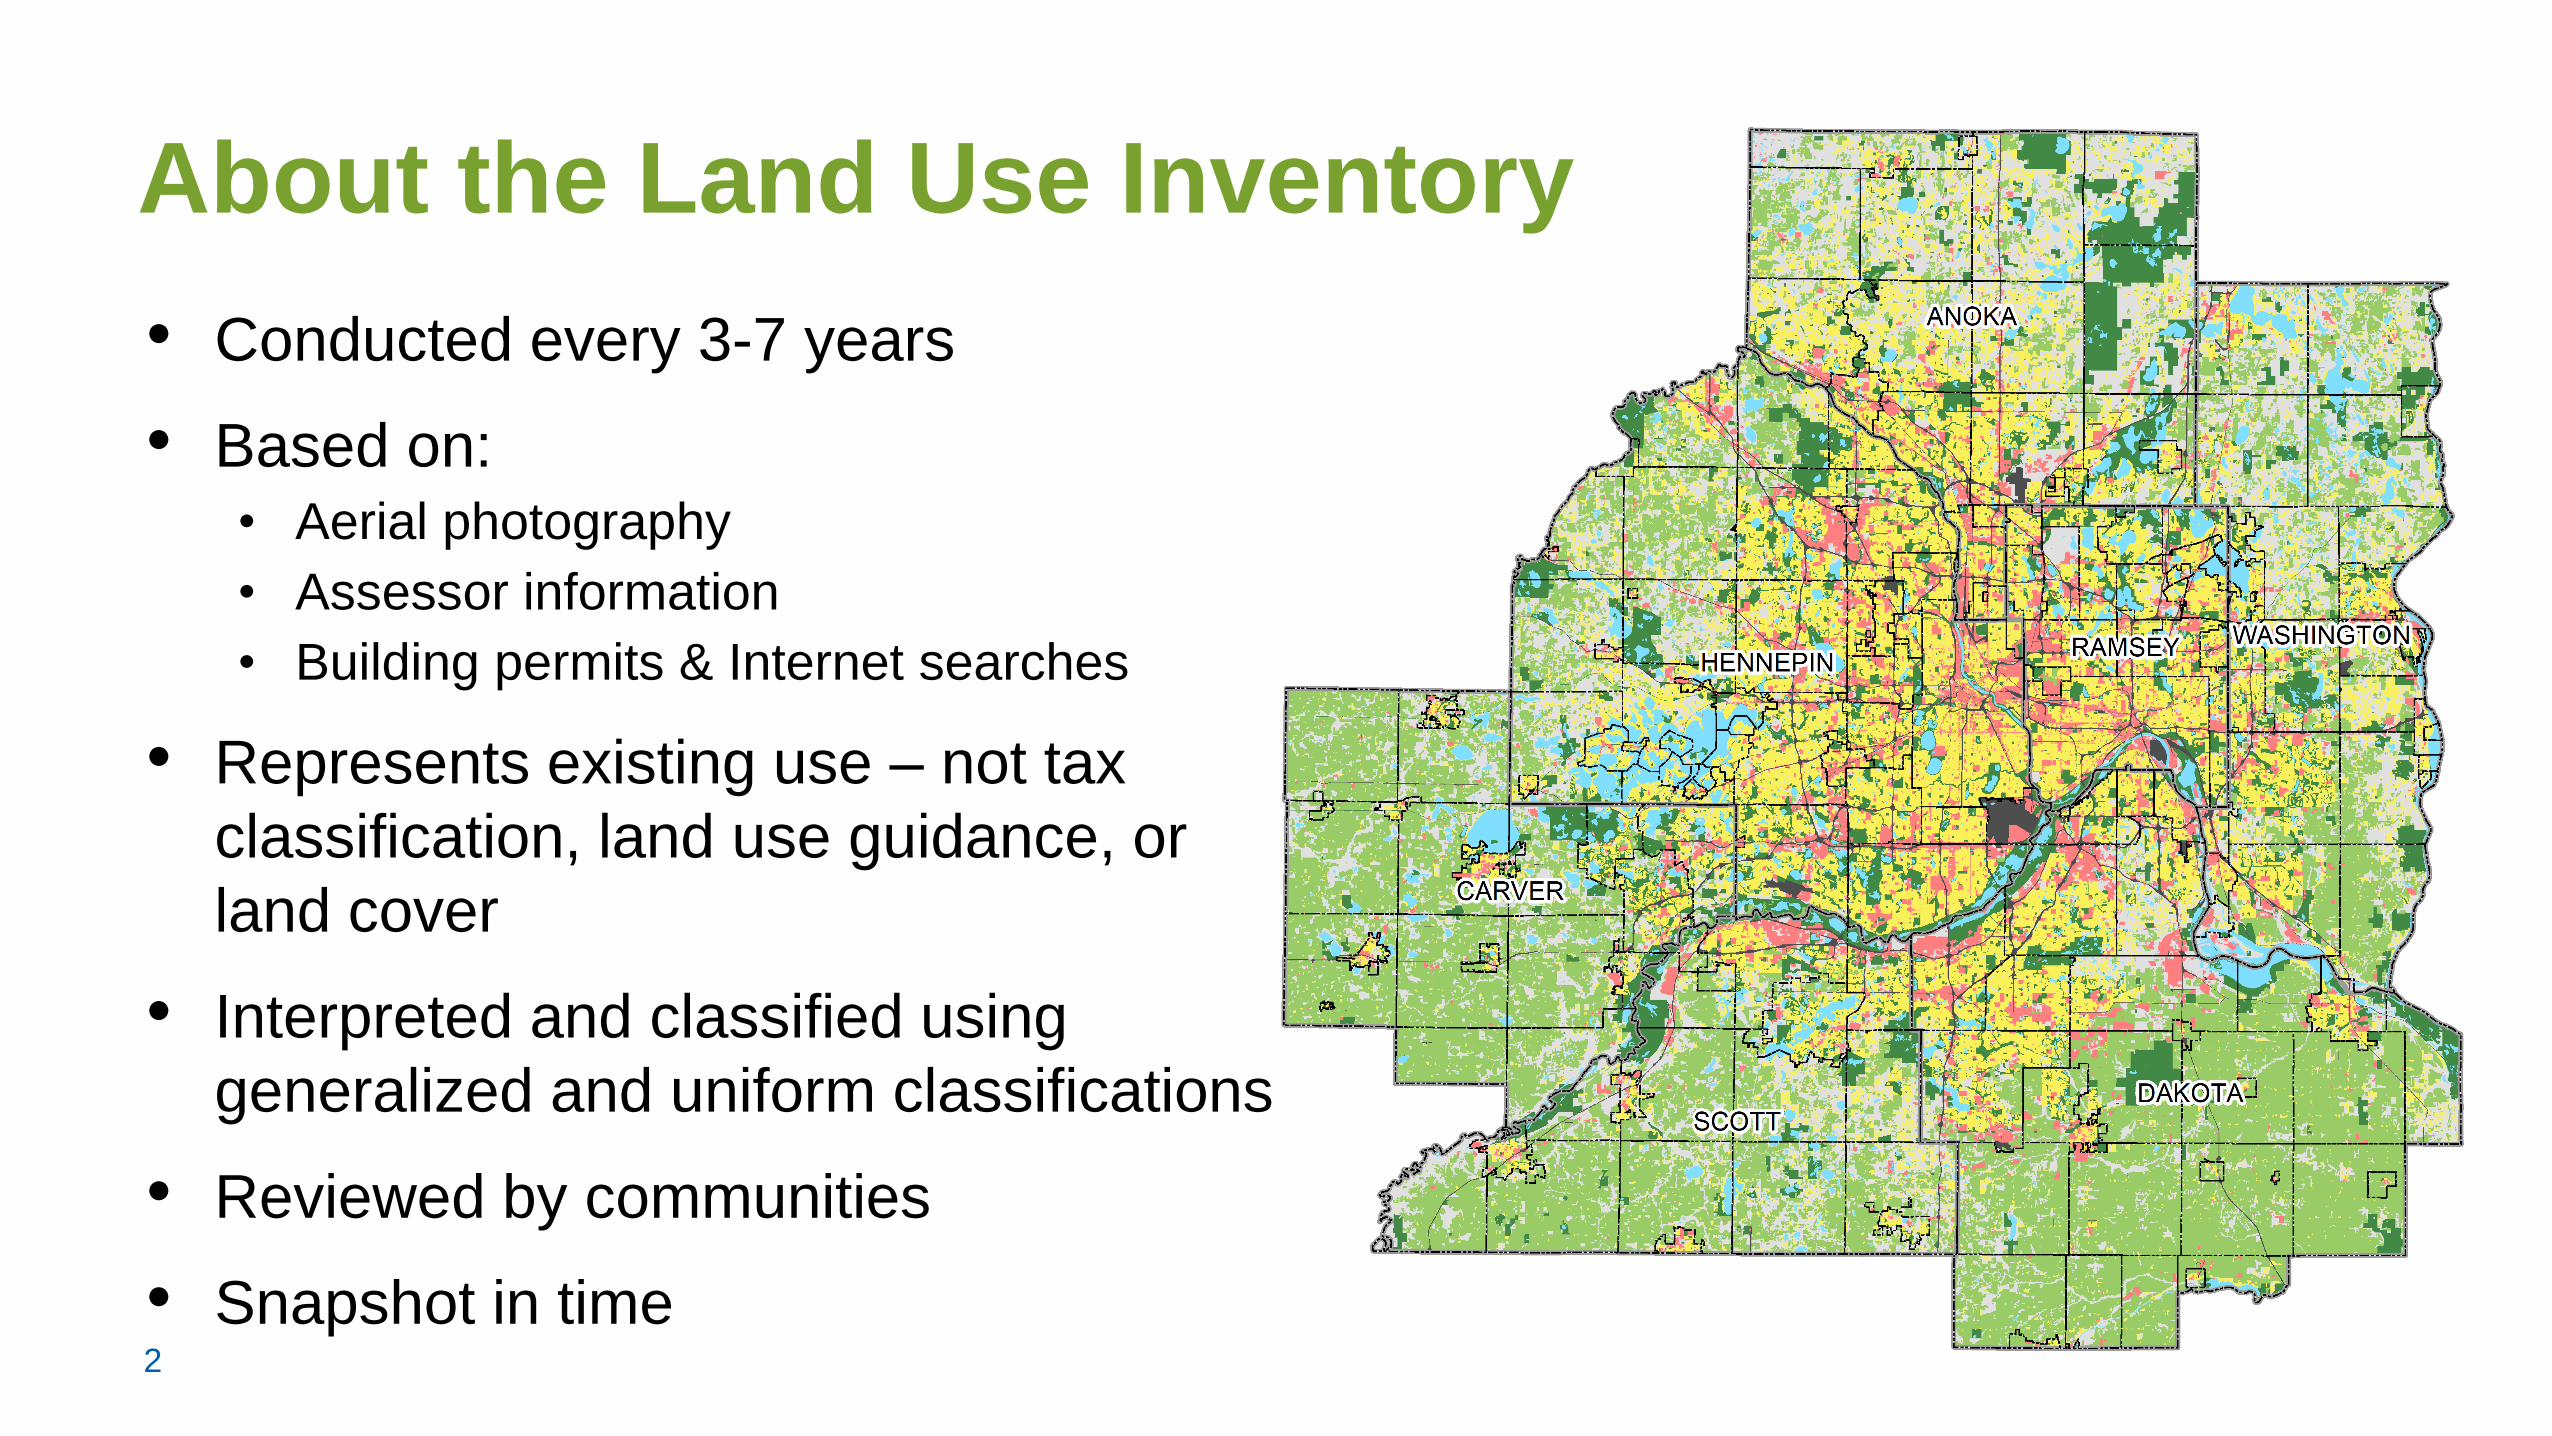
• Land consumption has increased
for first time since 2005
• Single family detached is still the
main driver
• Shifts in non-residential reflect
changing economics and shared
values
• As the region grows, so do parks
• Region is demanding less land to
accommodate the same amount
of people and households
Initial findings
5
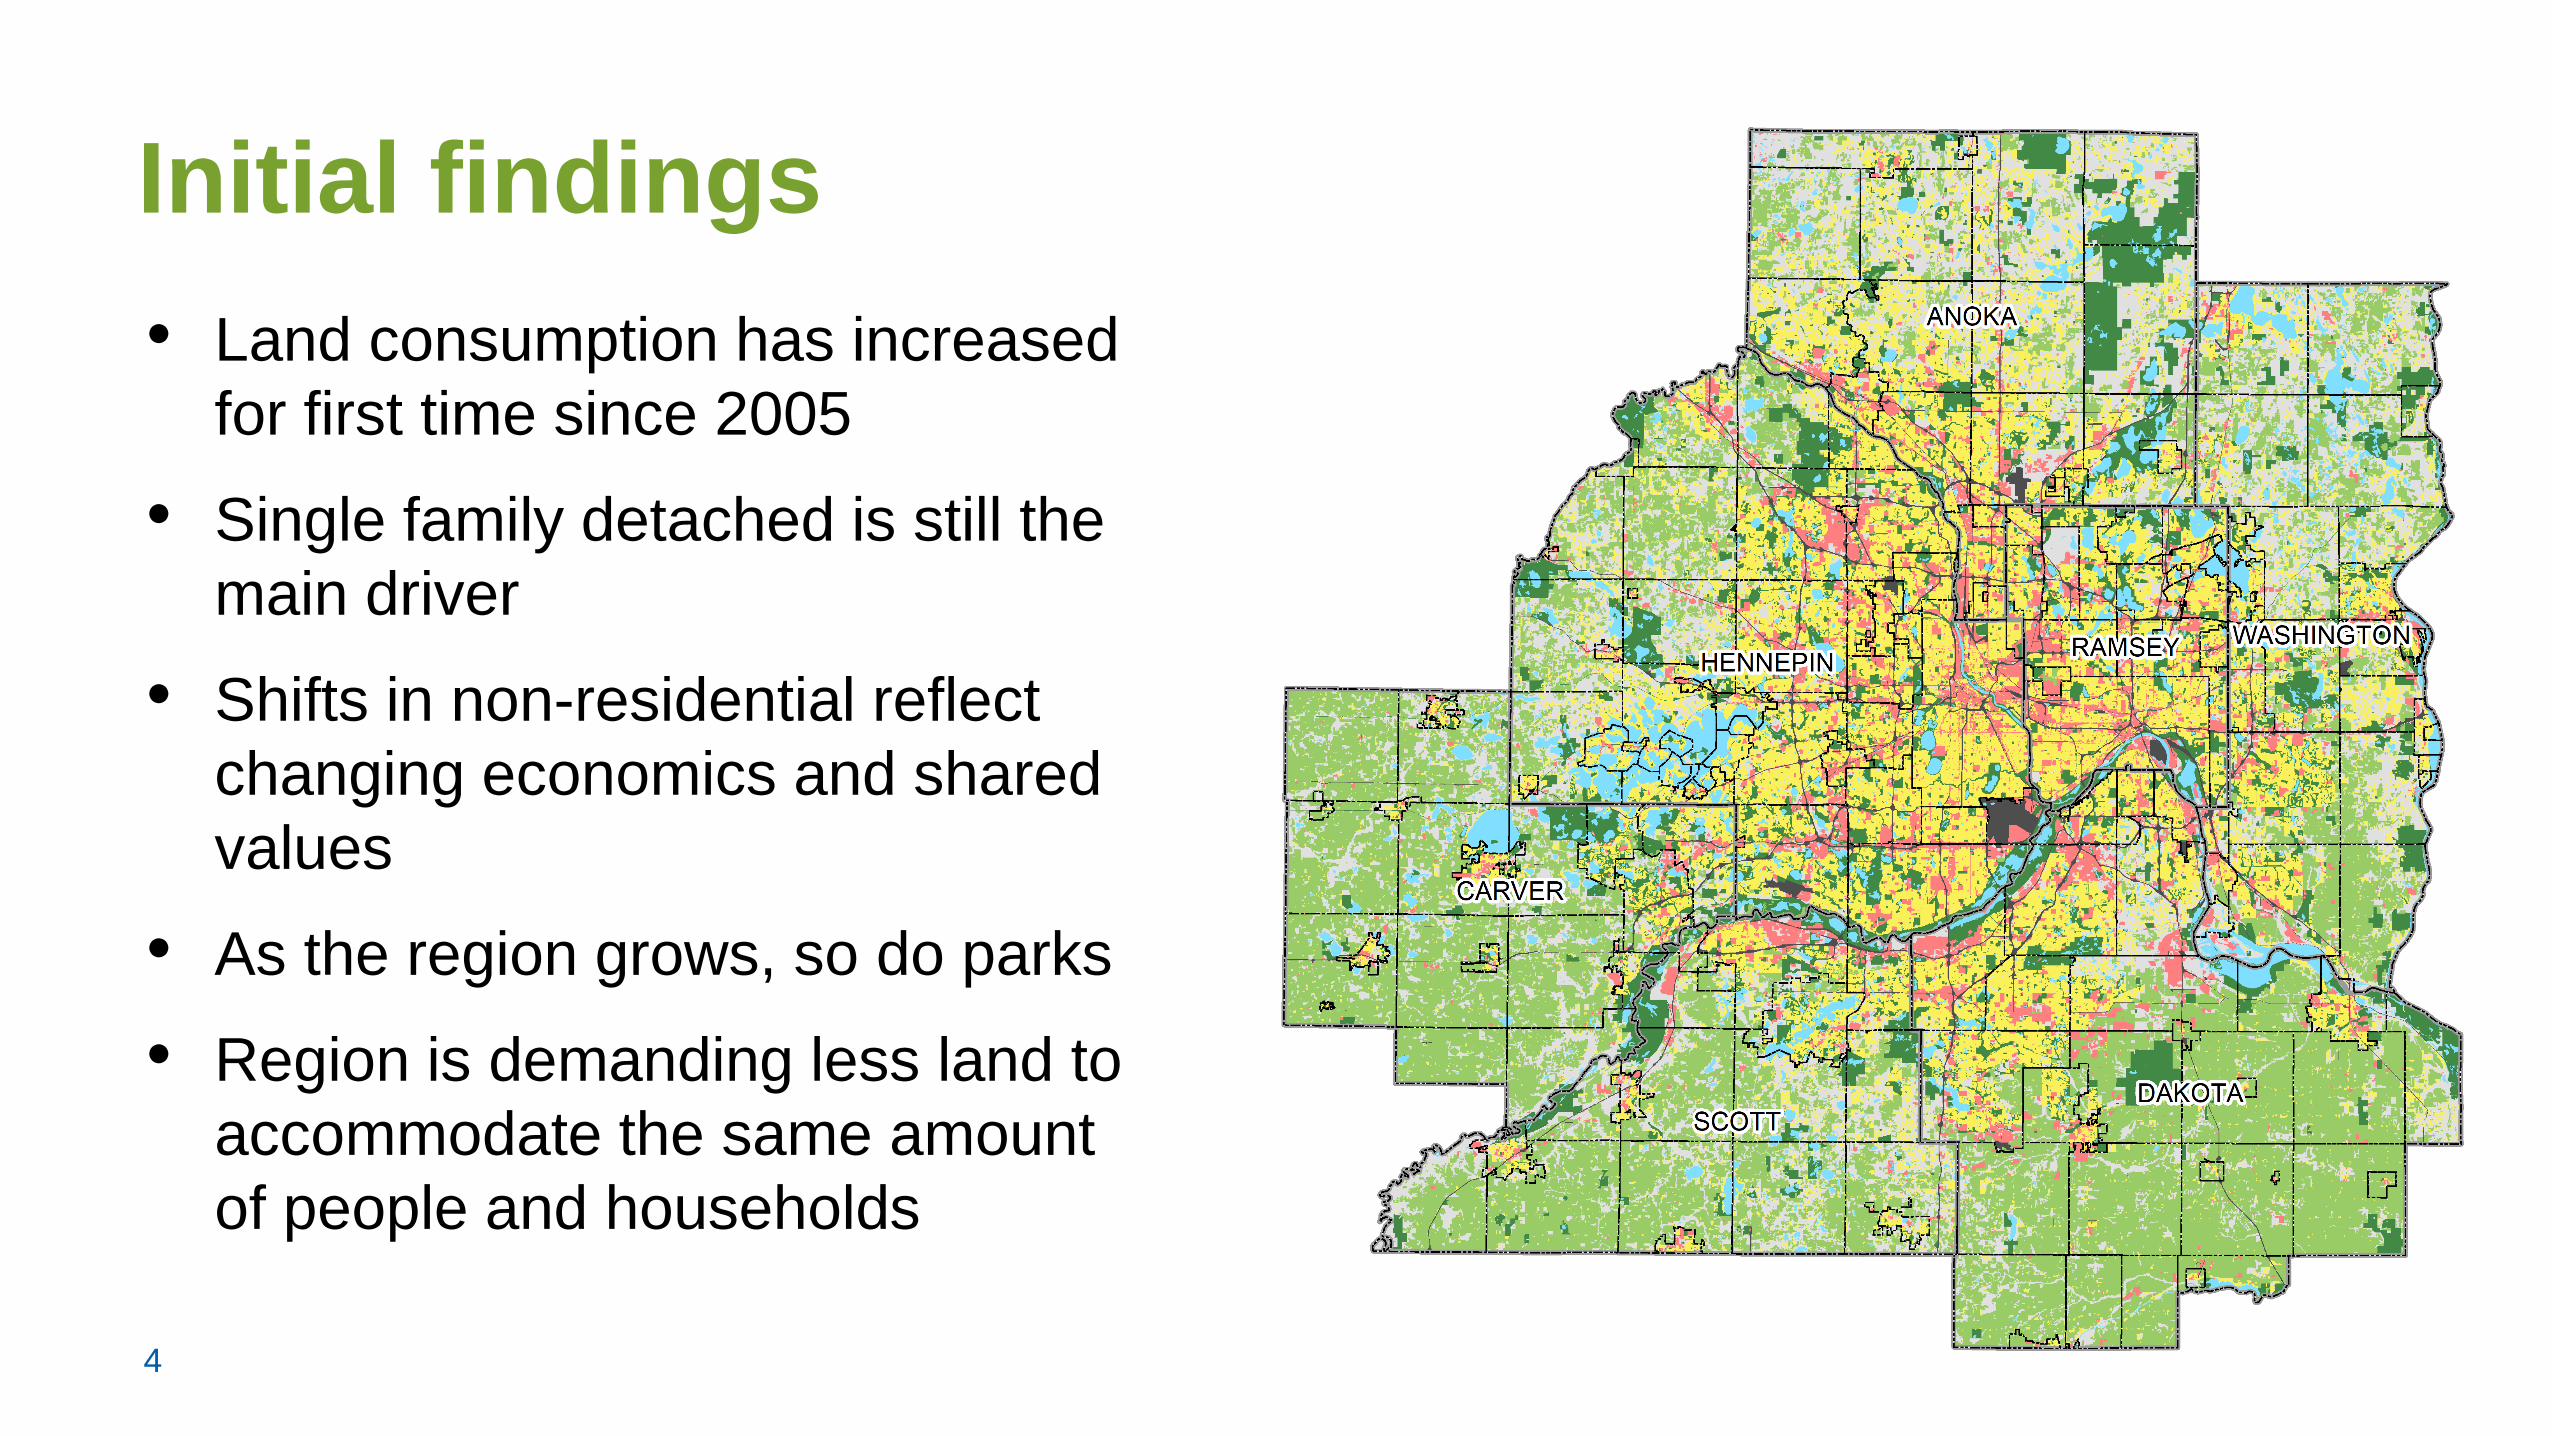
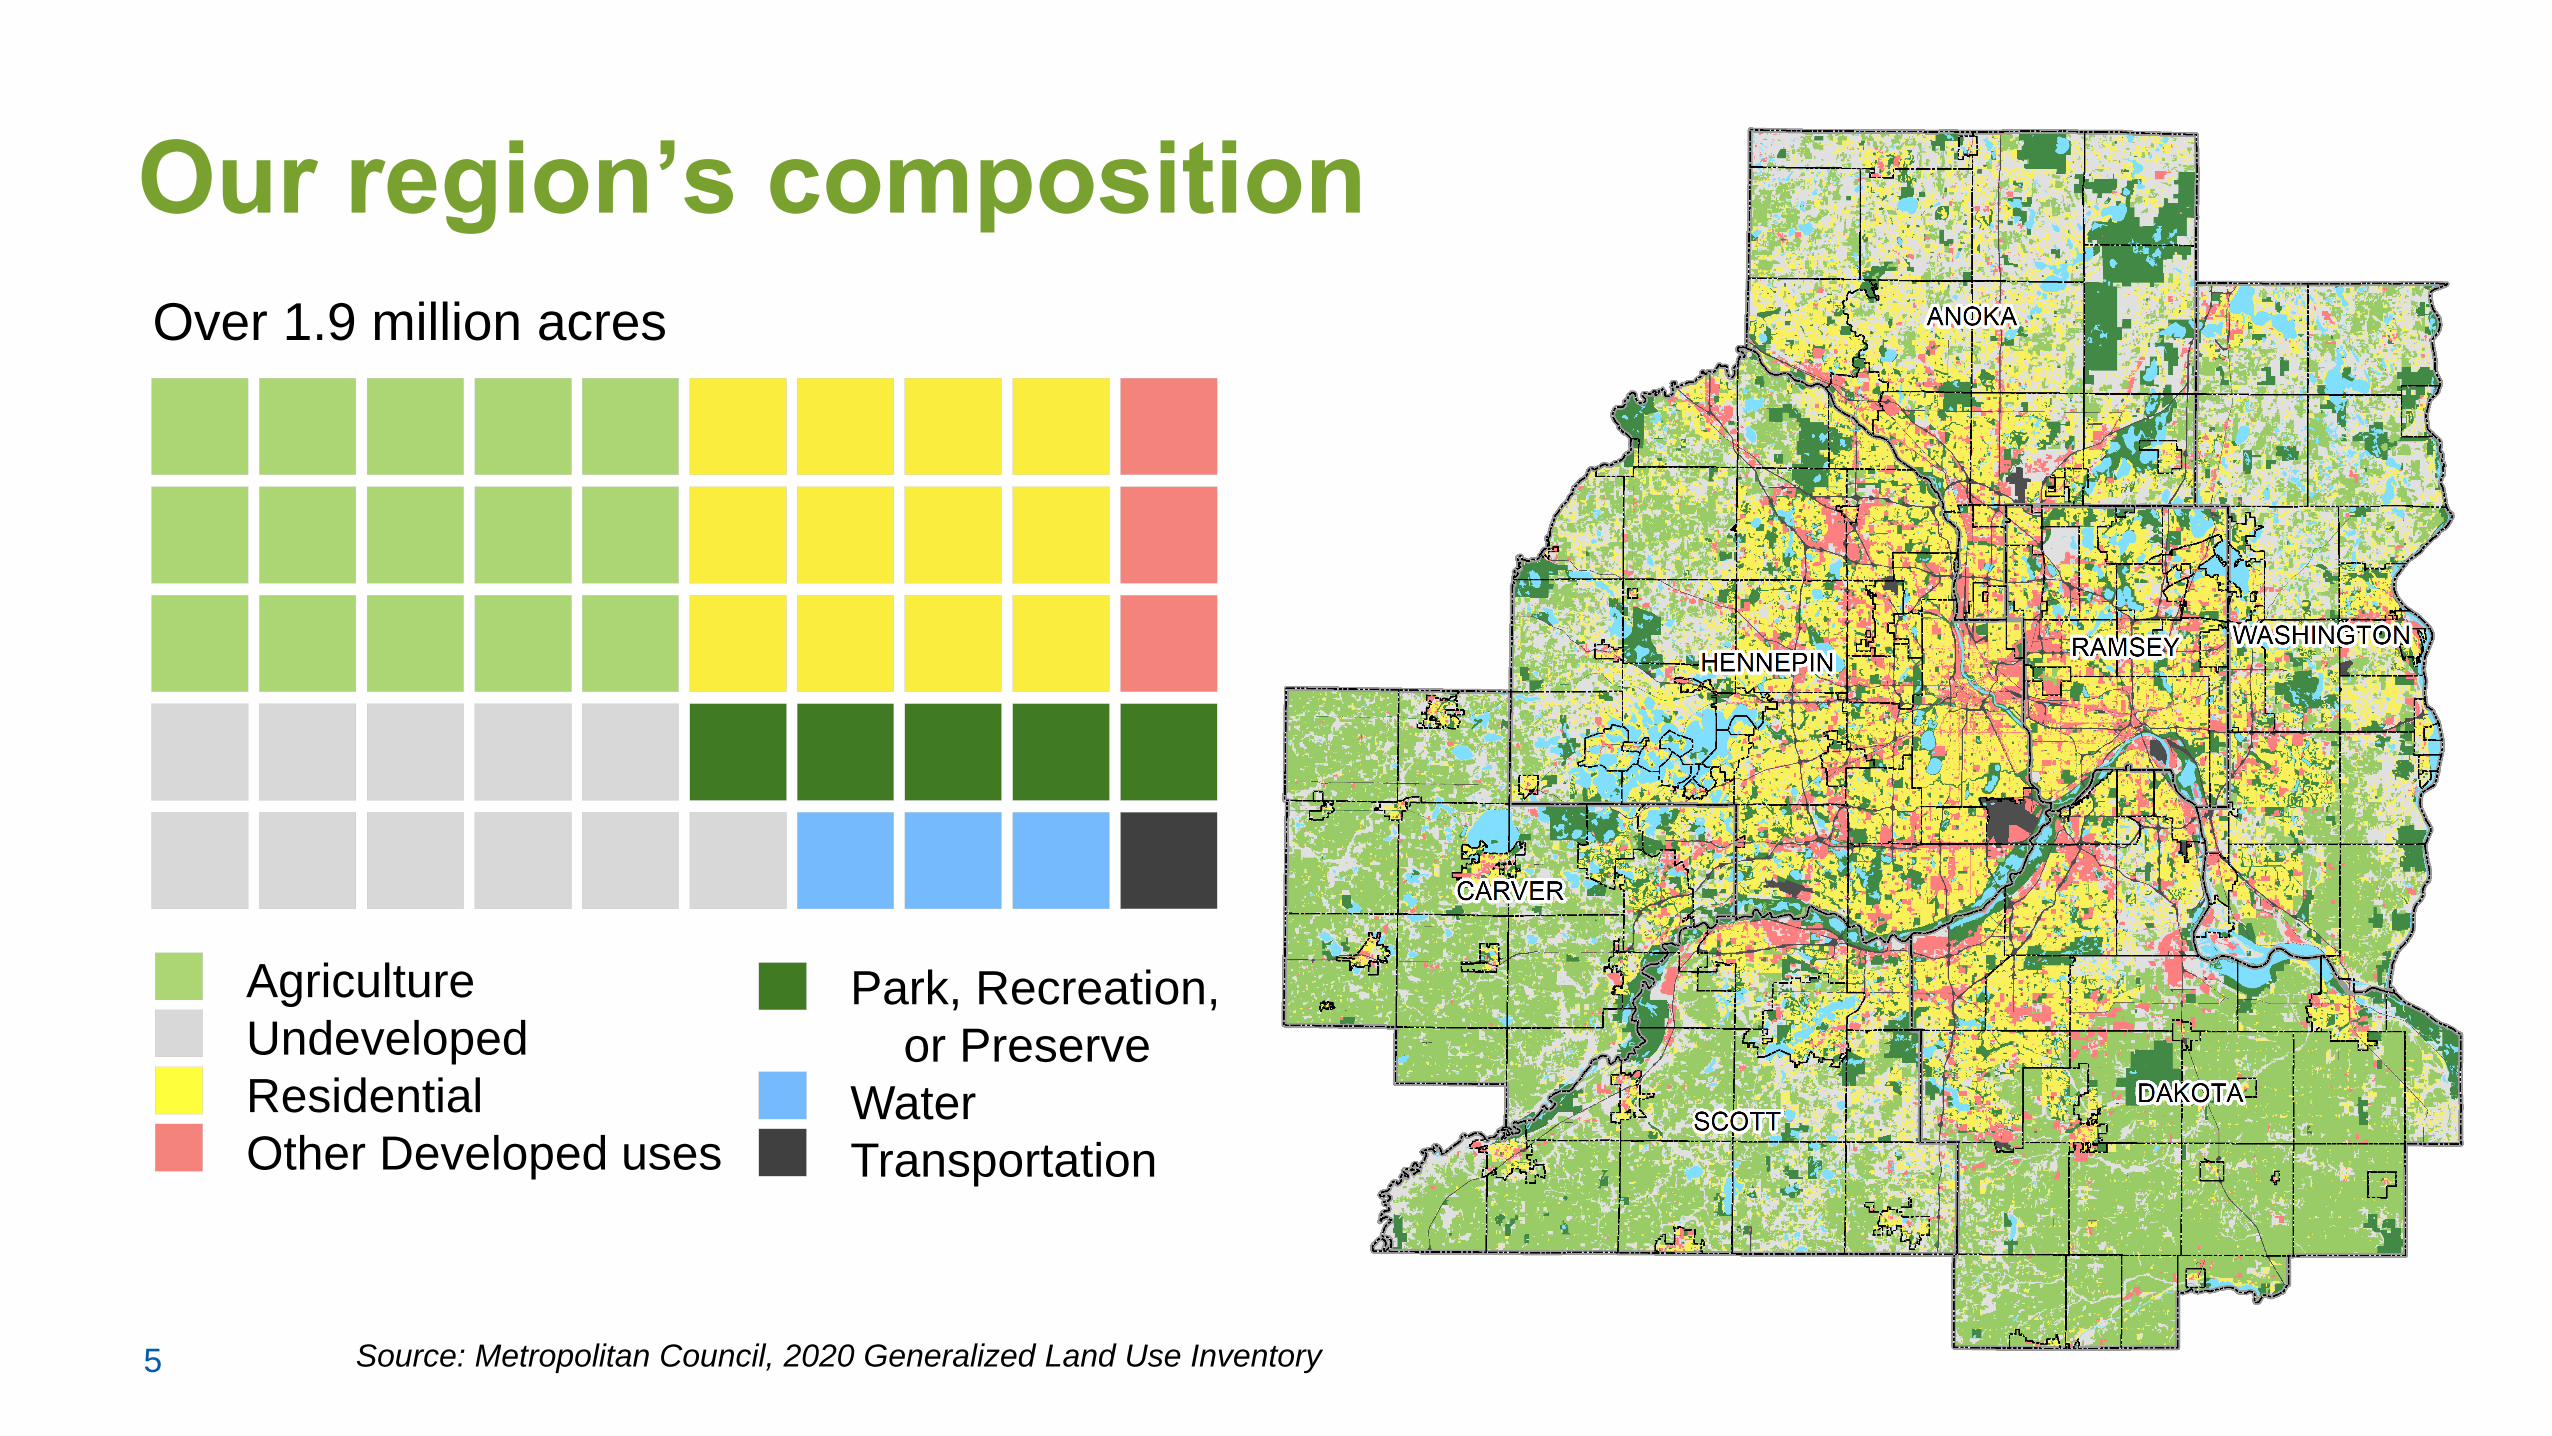
Our region’s composition
Source: Metropolitan Council, 2020 Generalized Land Use Inventory
Agriculture
Undeveloped
Residential
Other Developed uses
Park, Recreation,
or Preserve
Water
Transportation
Over 1.9 million acres
6
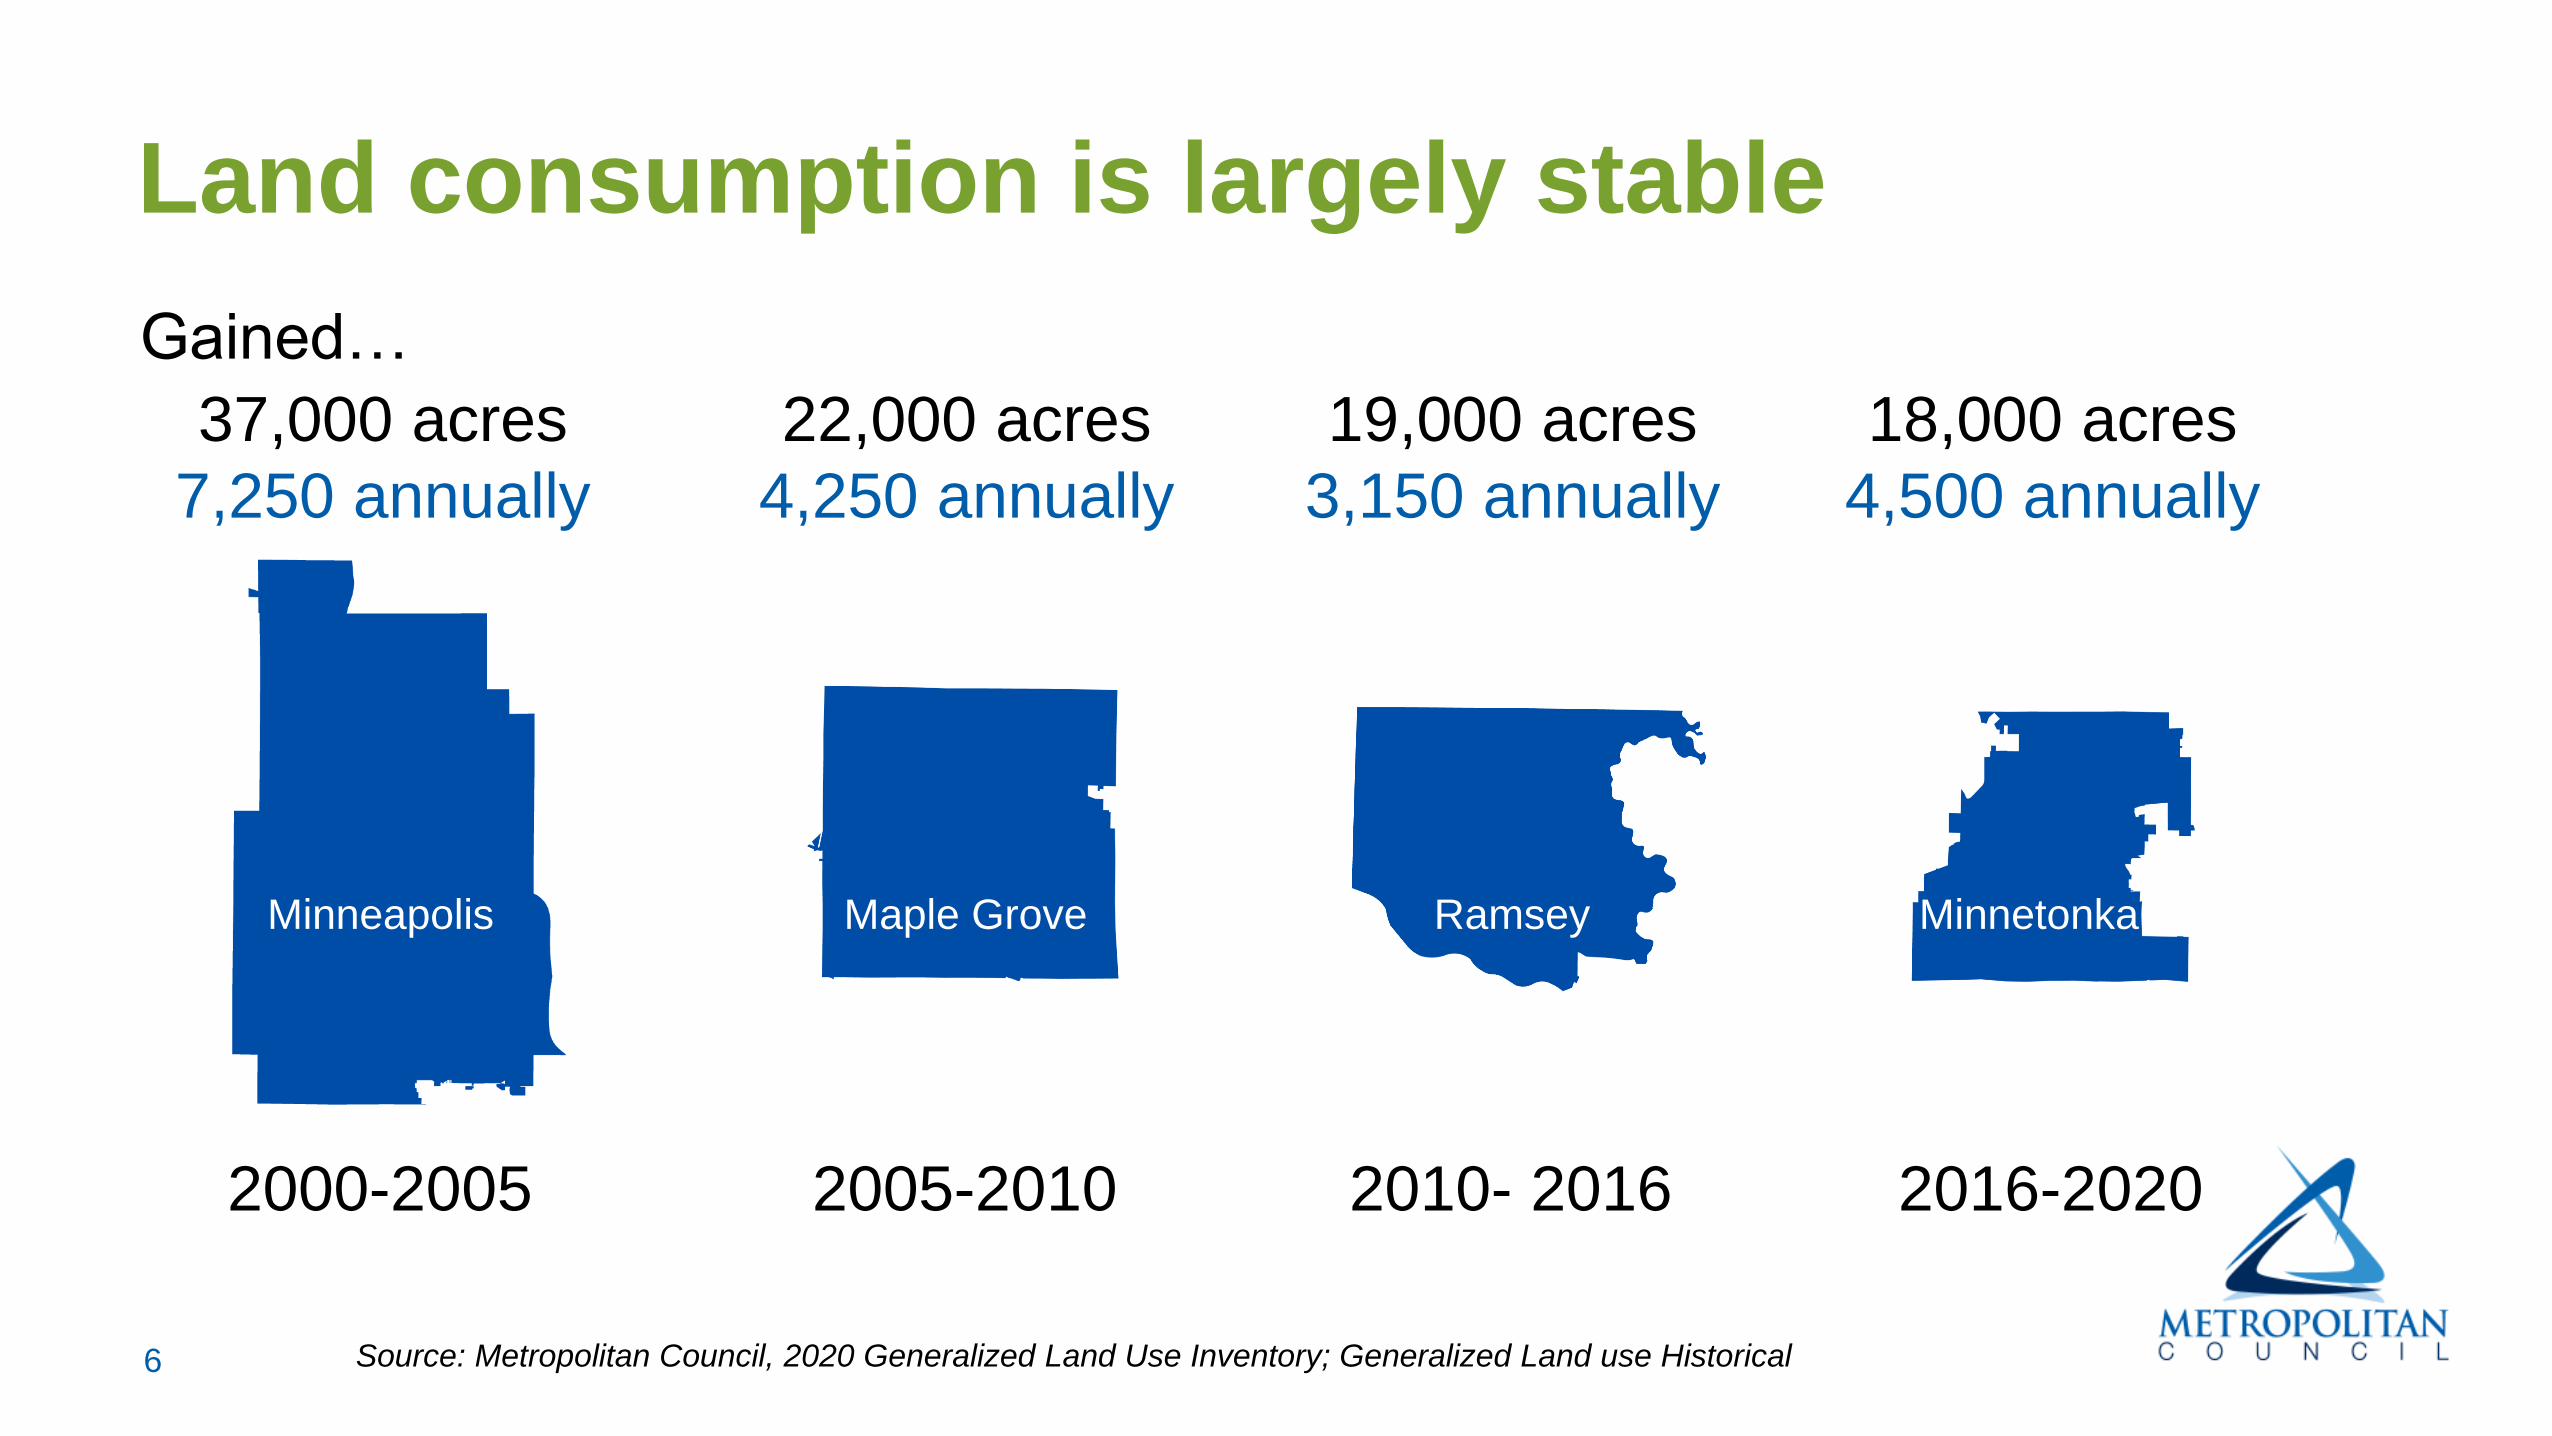
Land consumption is largely stable
37,000 acres
7,250 annually
22,000 acres
4,250 annually
19,000 acres
3,150 annually
18,000 acres
4,500 annually
Minneapolis Maple Grove Ramsey Minnetonka
2000-2005 2005-2010 2010- 2016 2016-2020
Gained…
Source: Metropolitan Council, 2020 Generalized Land Use Inventory; Generalized Land use Historical
7
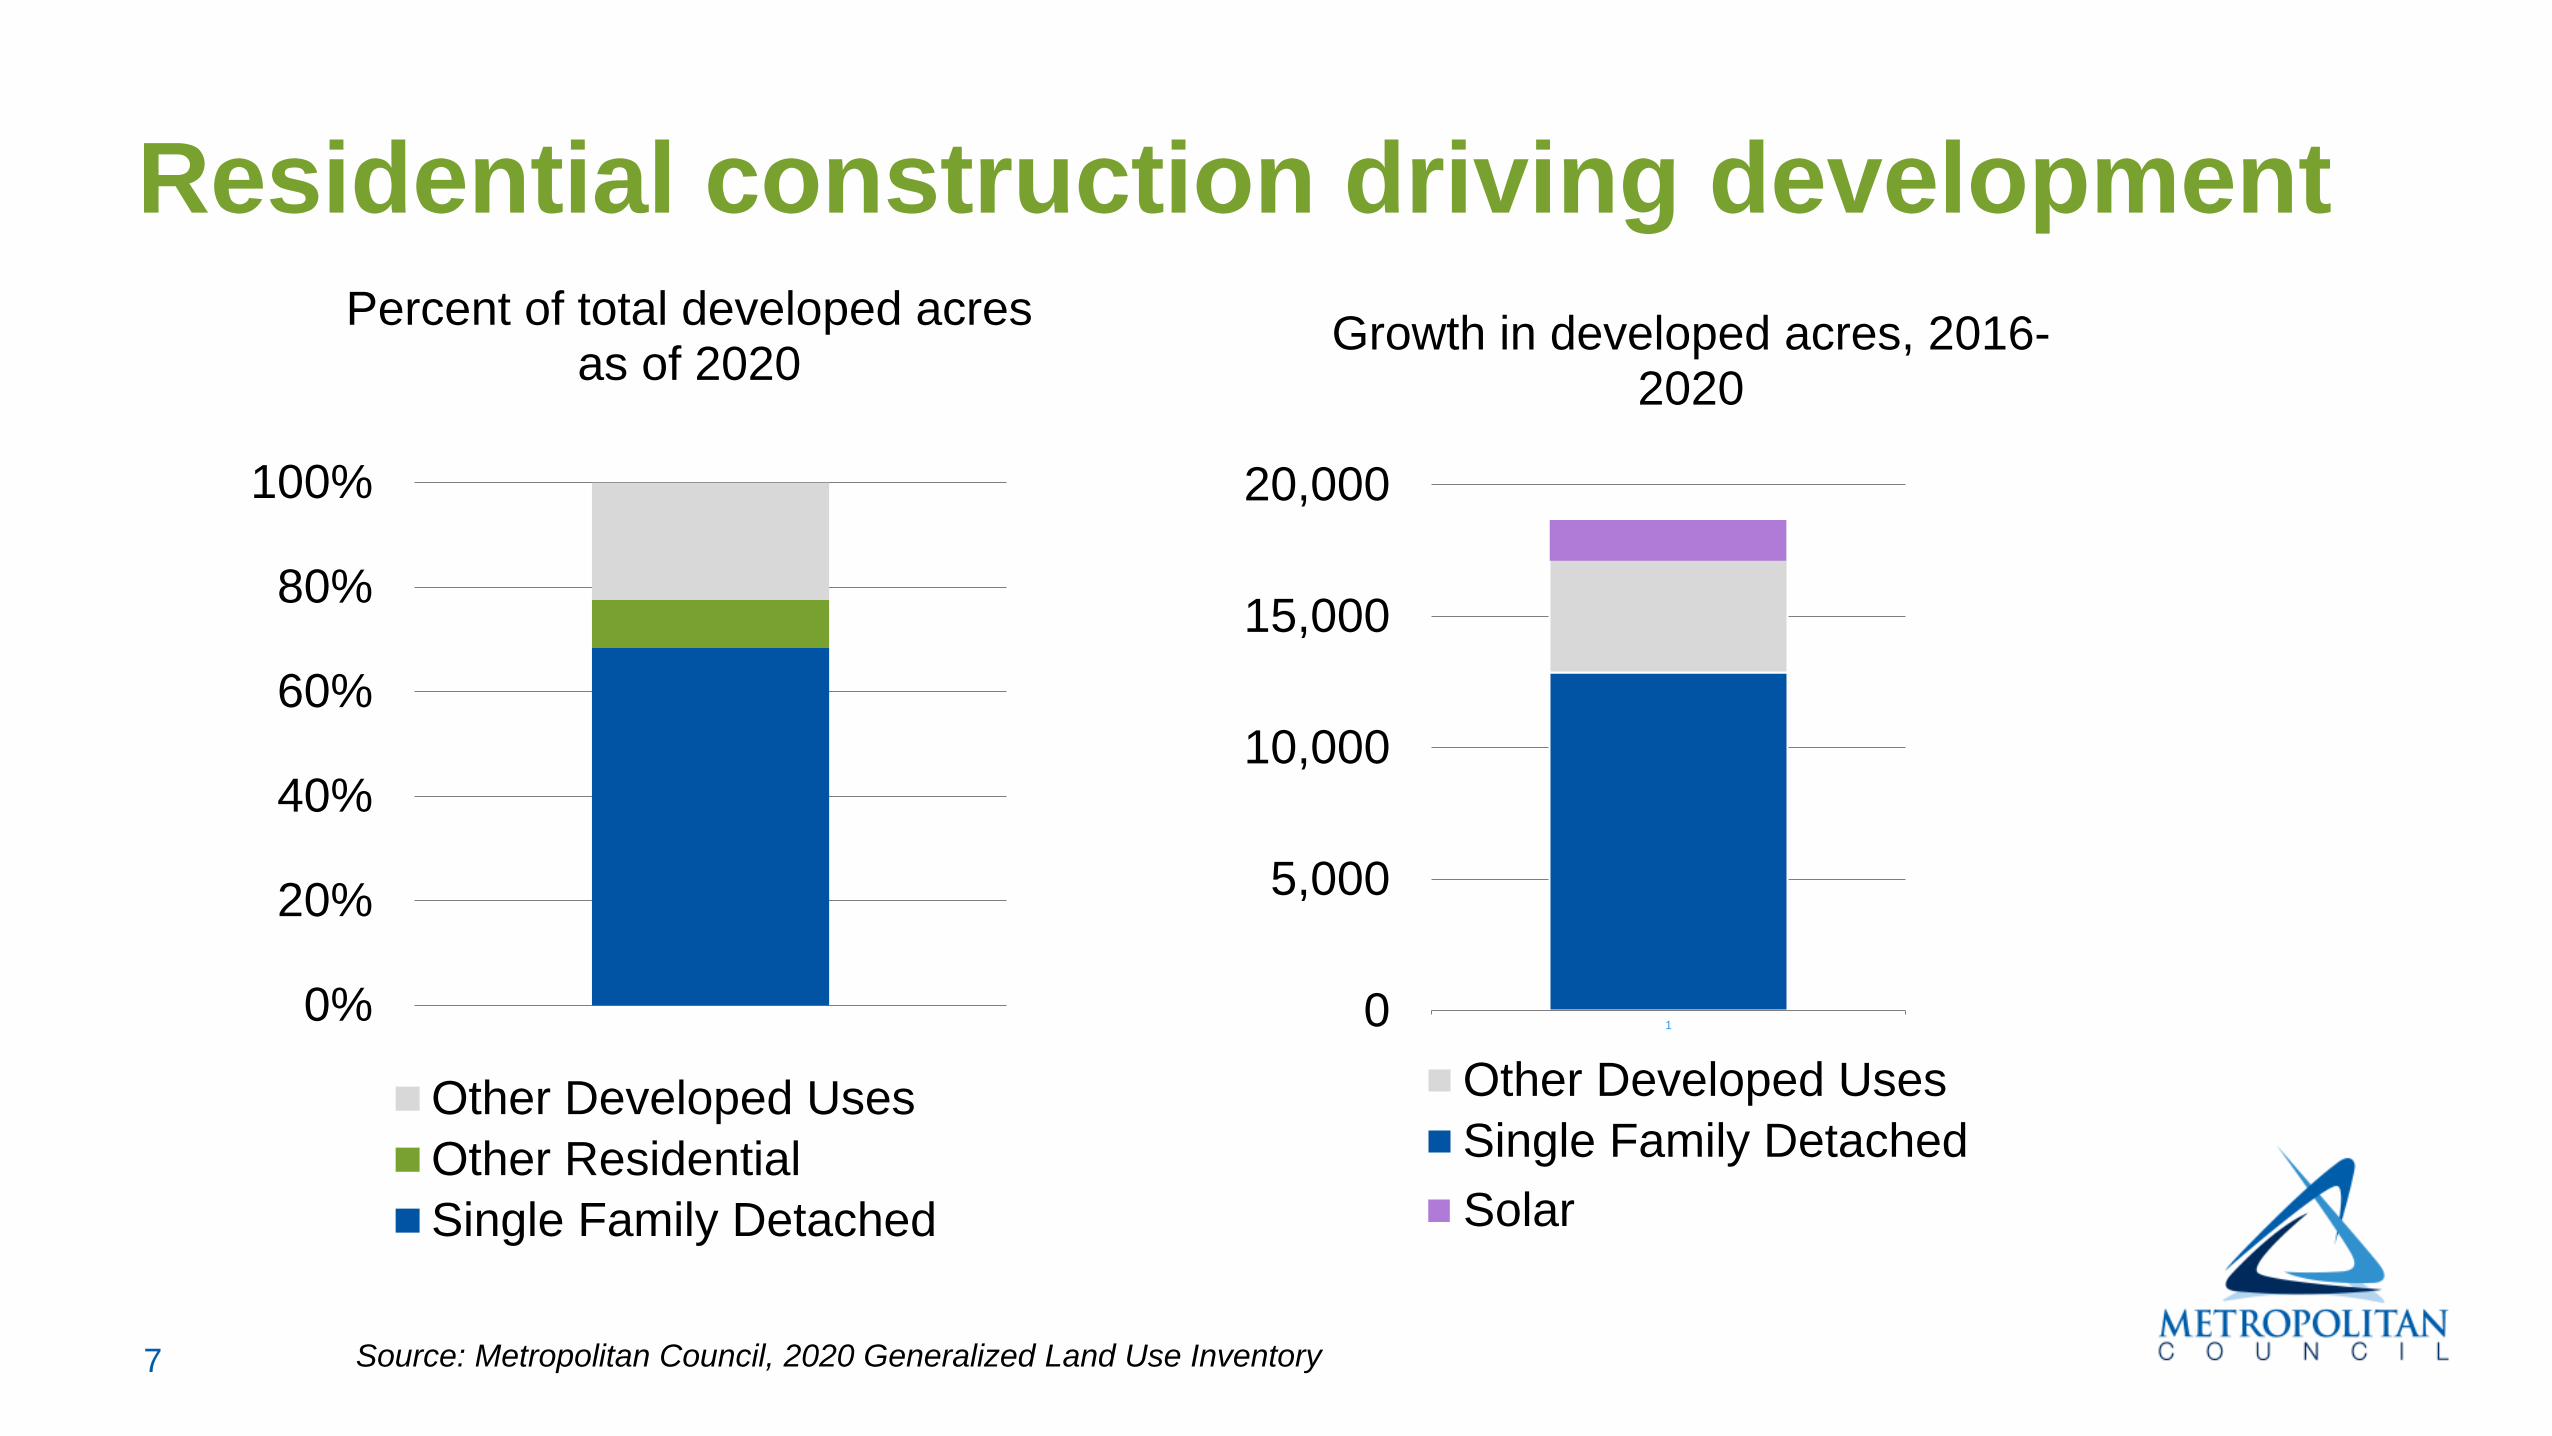
Residential construction driving development
0%
20%
40%
60%
80%
100%
Percent of total developed acres as of 2020
Other Developed Uses
Other Residential
Single Family Detached
0
5,000
10,000
15,000
20,000
1
Growth in developed acres, 2016-2020
Other Developed Uses
Single Family Detached
Source: Metropolitan Council, 2020 Generalized Land Use Inventory
Solar
8
0
500
1,000
1,500
2,000
2,500
3,000
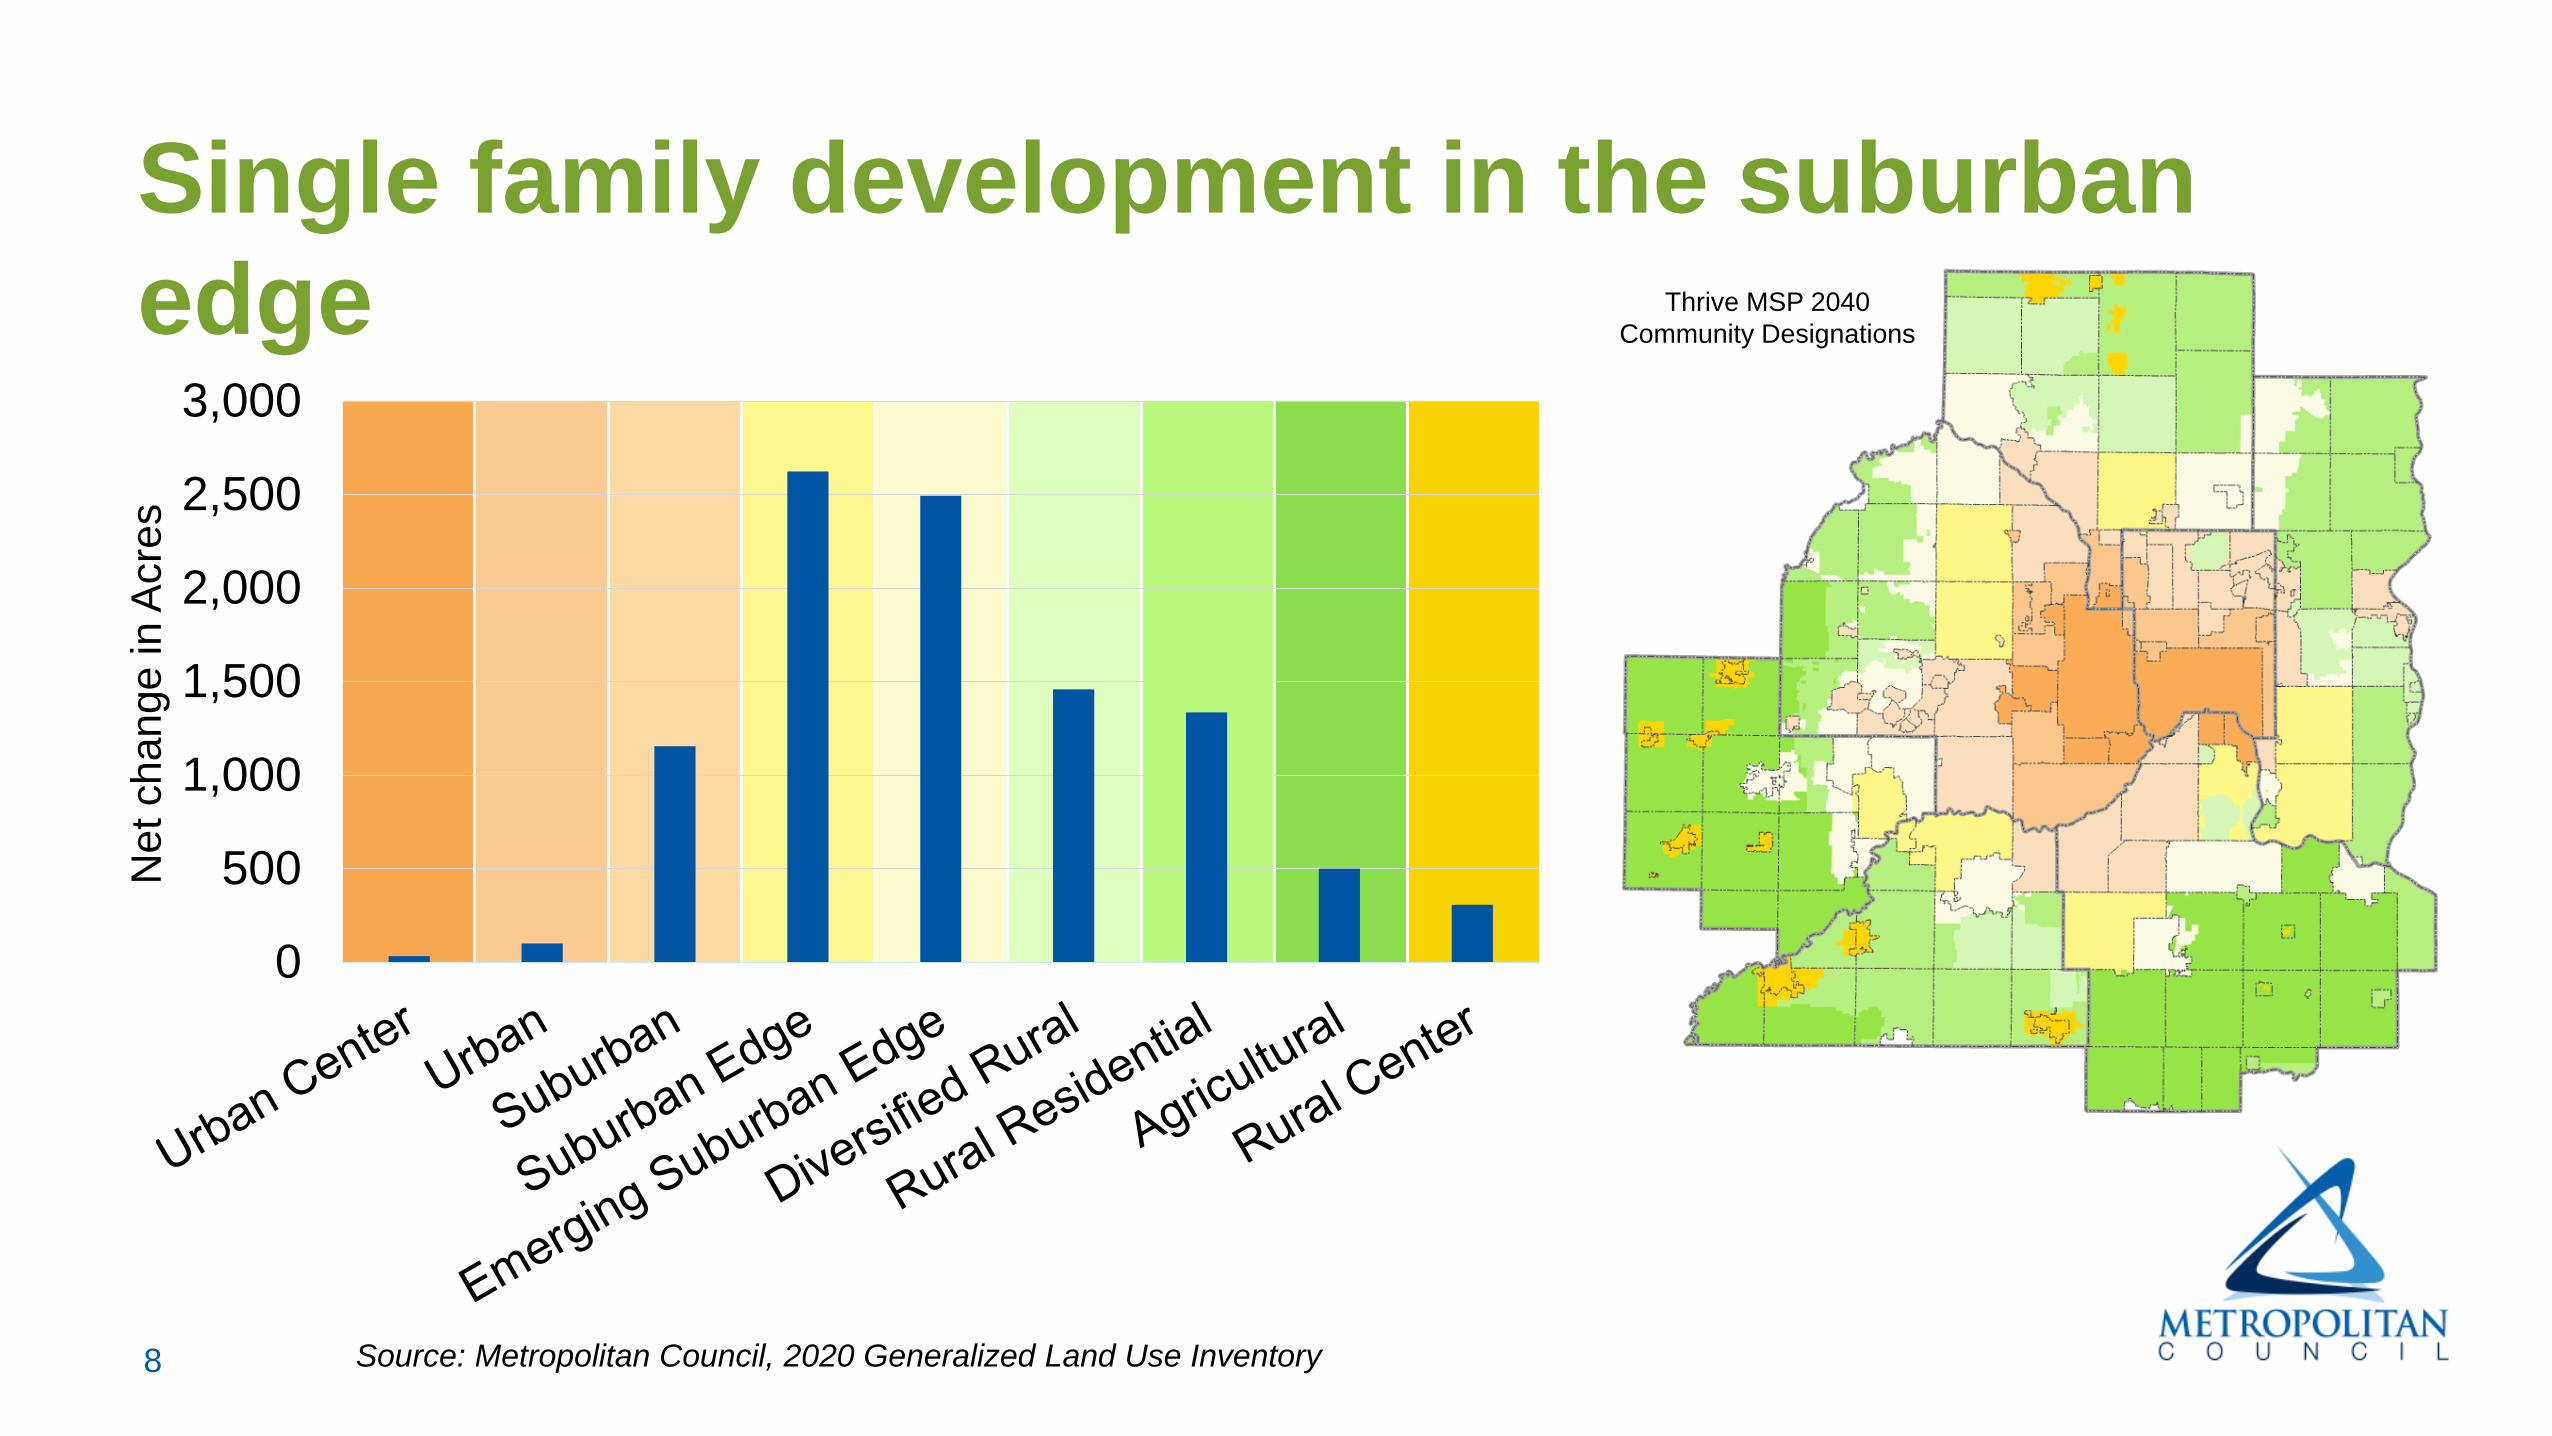
Single family development in the suburban
edge
Ne
t ch
an
ge
in
Acre
s
Source: Metropolitan Council, 2020 Generalized Land Use Inventory
Thrive MSP 2040
Community Designations
9
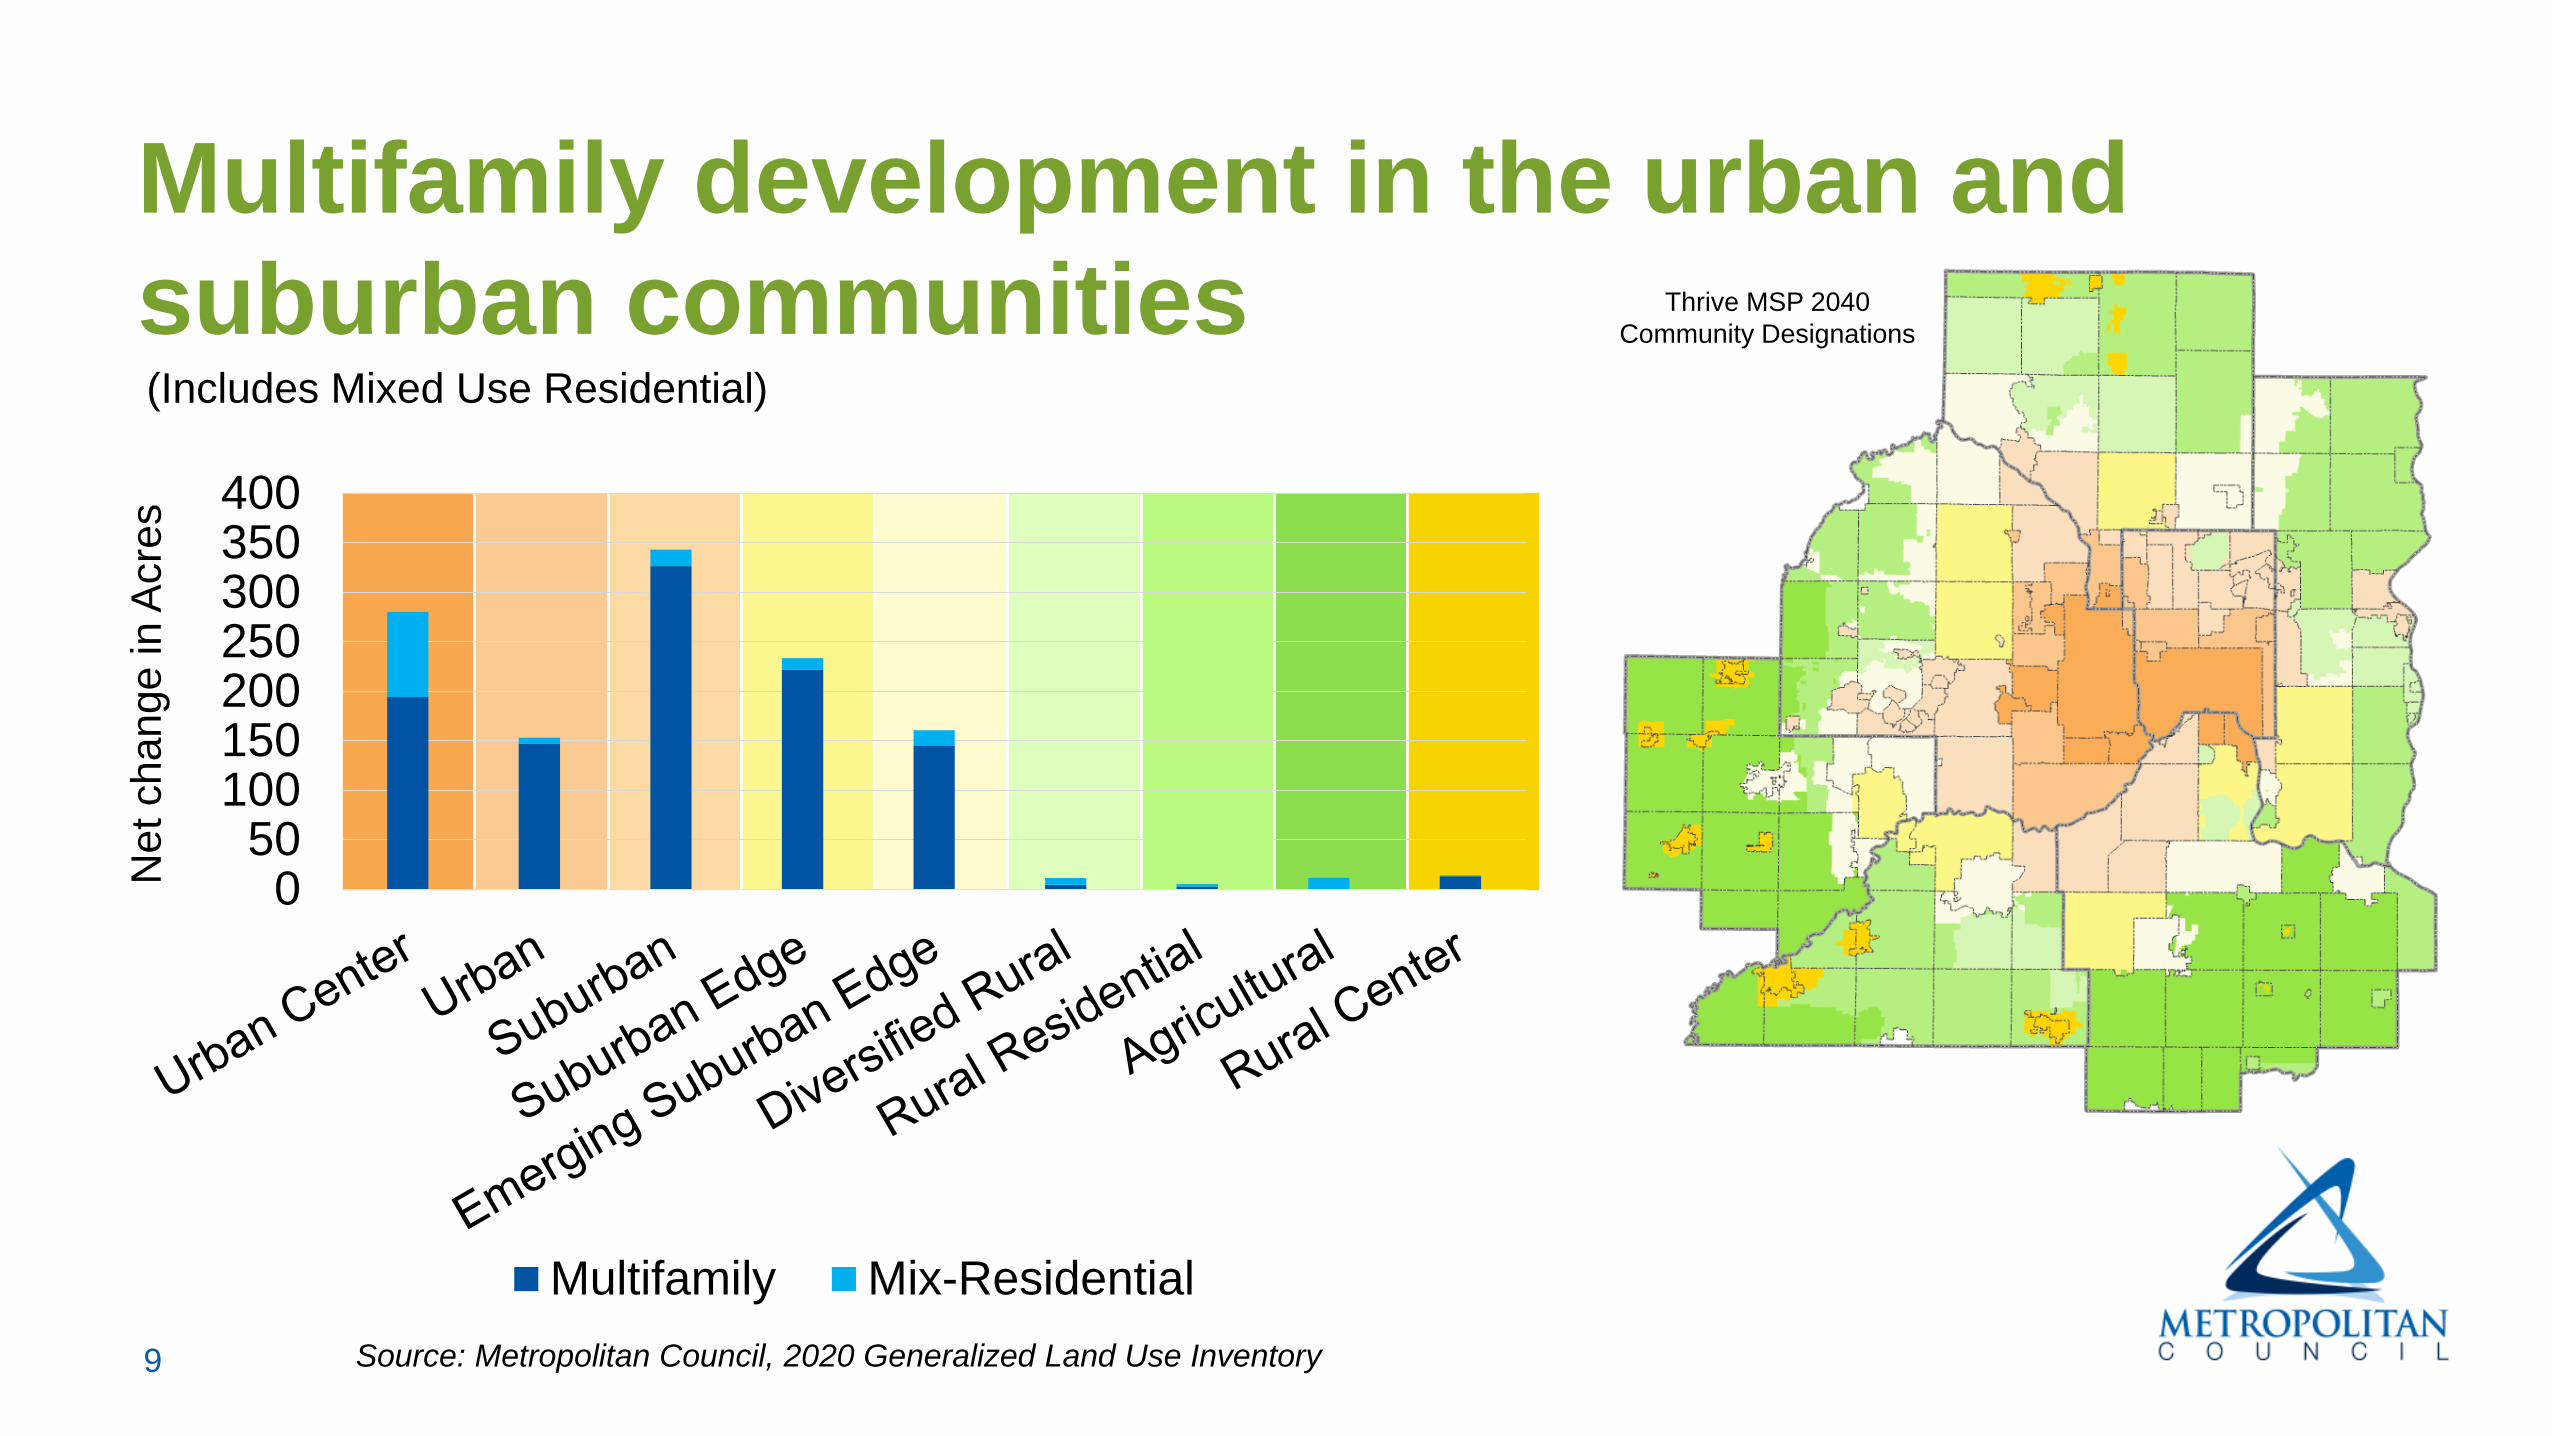
Multifamily development in the urban and
suburban communities
Ne
t ch
an
ge
in
Acre
s
Source: Metropolitan Council, 2020 Generalized Land Use Inventory
(Includes Mixed Use Residential)
050
100150200250300350400
Multifamily Mix-Residential
Thrive MSP 2040
Community Designations

10
Affordable multifamily development in urban
and suburban communities
Ne
t ch
an
ge
in
Acre
s
Source: Metropolitan Council, 2020 Generalized Land Use Inventory; Metropolitan Council’s Affordable
Production Survey (2016-2019)
050
100150200250300350400
Market-rate Multifamily Affordable Multifamily
Thrive MSP 2040
Community Designations
(Includes Mixed Use Residential)
11
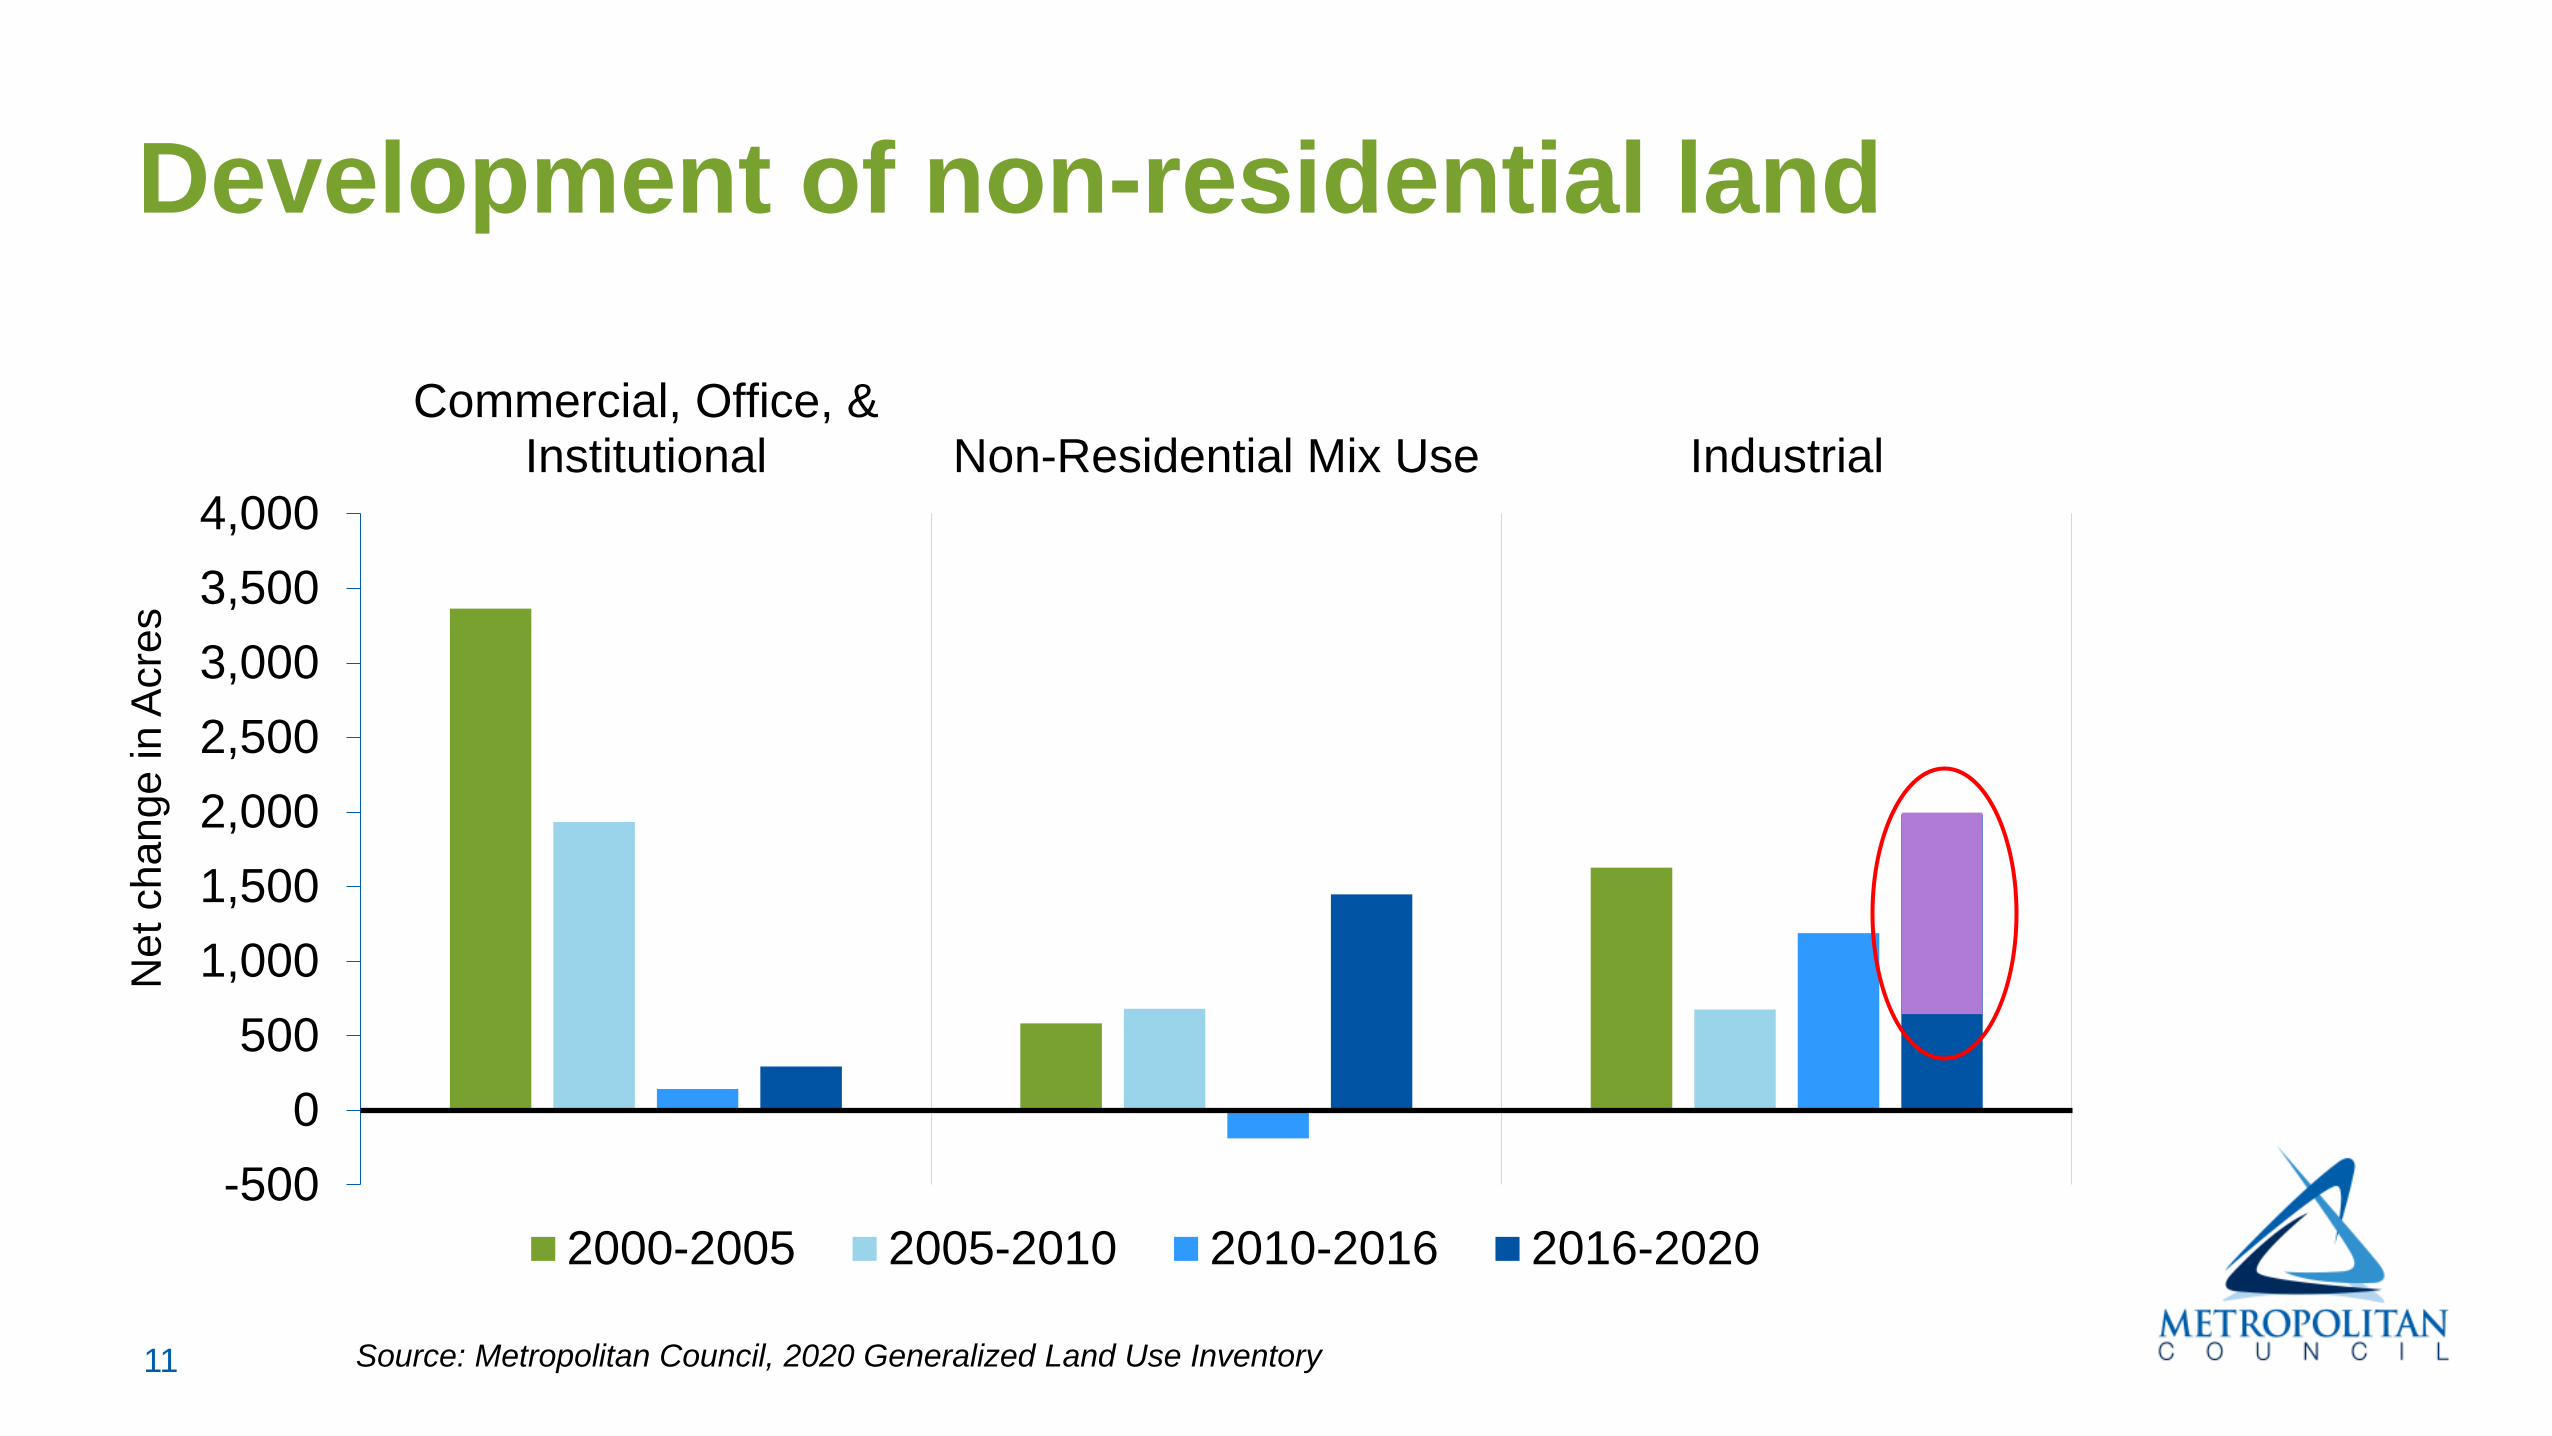
-500
0
500
1,000
1,500
2,000
2,500
3,000
3,500
4,000
Commercial, Office, &Institutional Non-Residential Mix Use Industrial
2000-2005 2005-2010 2010-2016 2016-2020
Development of non-residential landN
et
ch
an
ge
in
Acre
s
Source: Metropolitan Council, 2020 Generalized Land Use Inventory

12
Expansion of parks and recreation acresA
cre
s
Source: Metropolitan Council, 2020 Generalized Land Use Inventory
0
50,000
100,000
150,000
200,000
250,000
1990 2000 2005 2010 2016 2020
Park, Recreational, or Preserve Golf Course Park & Golf Course
13
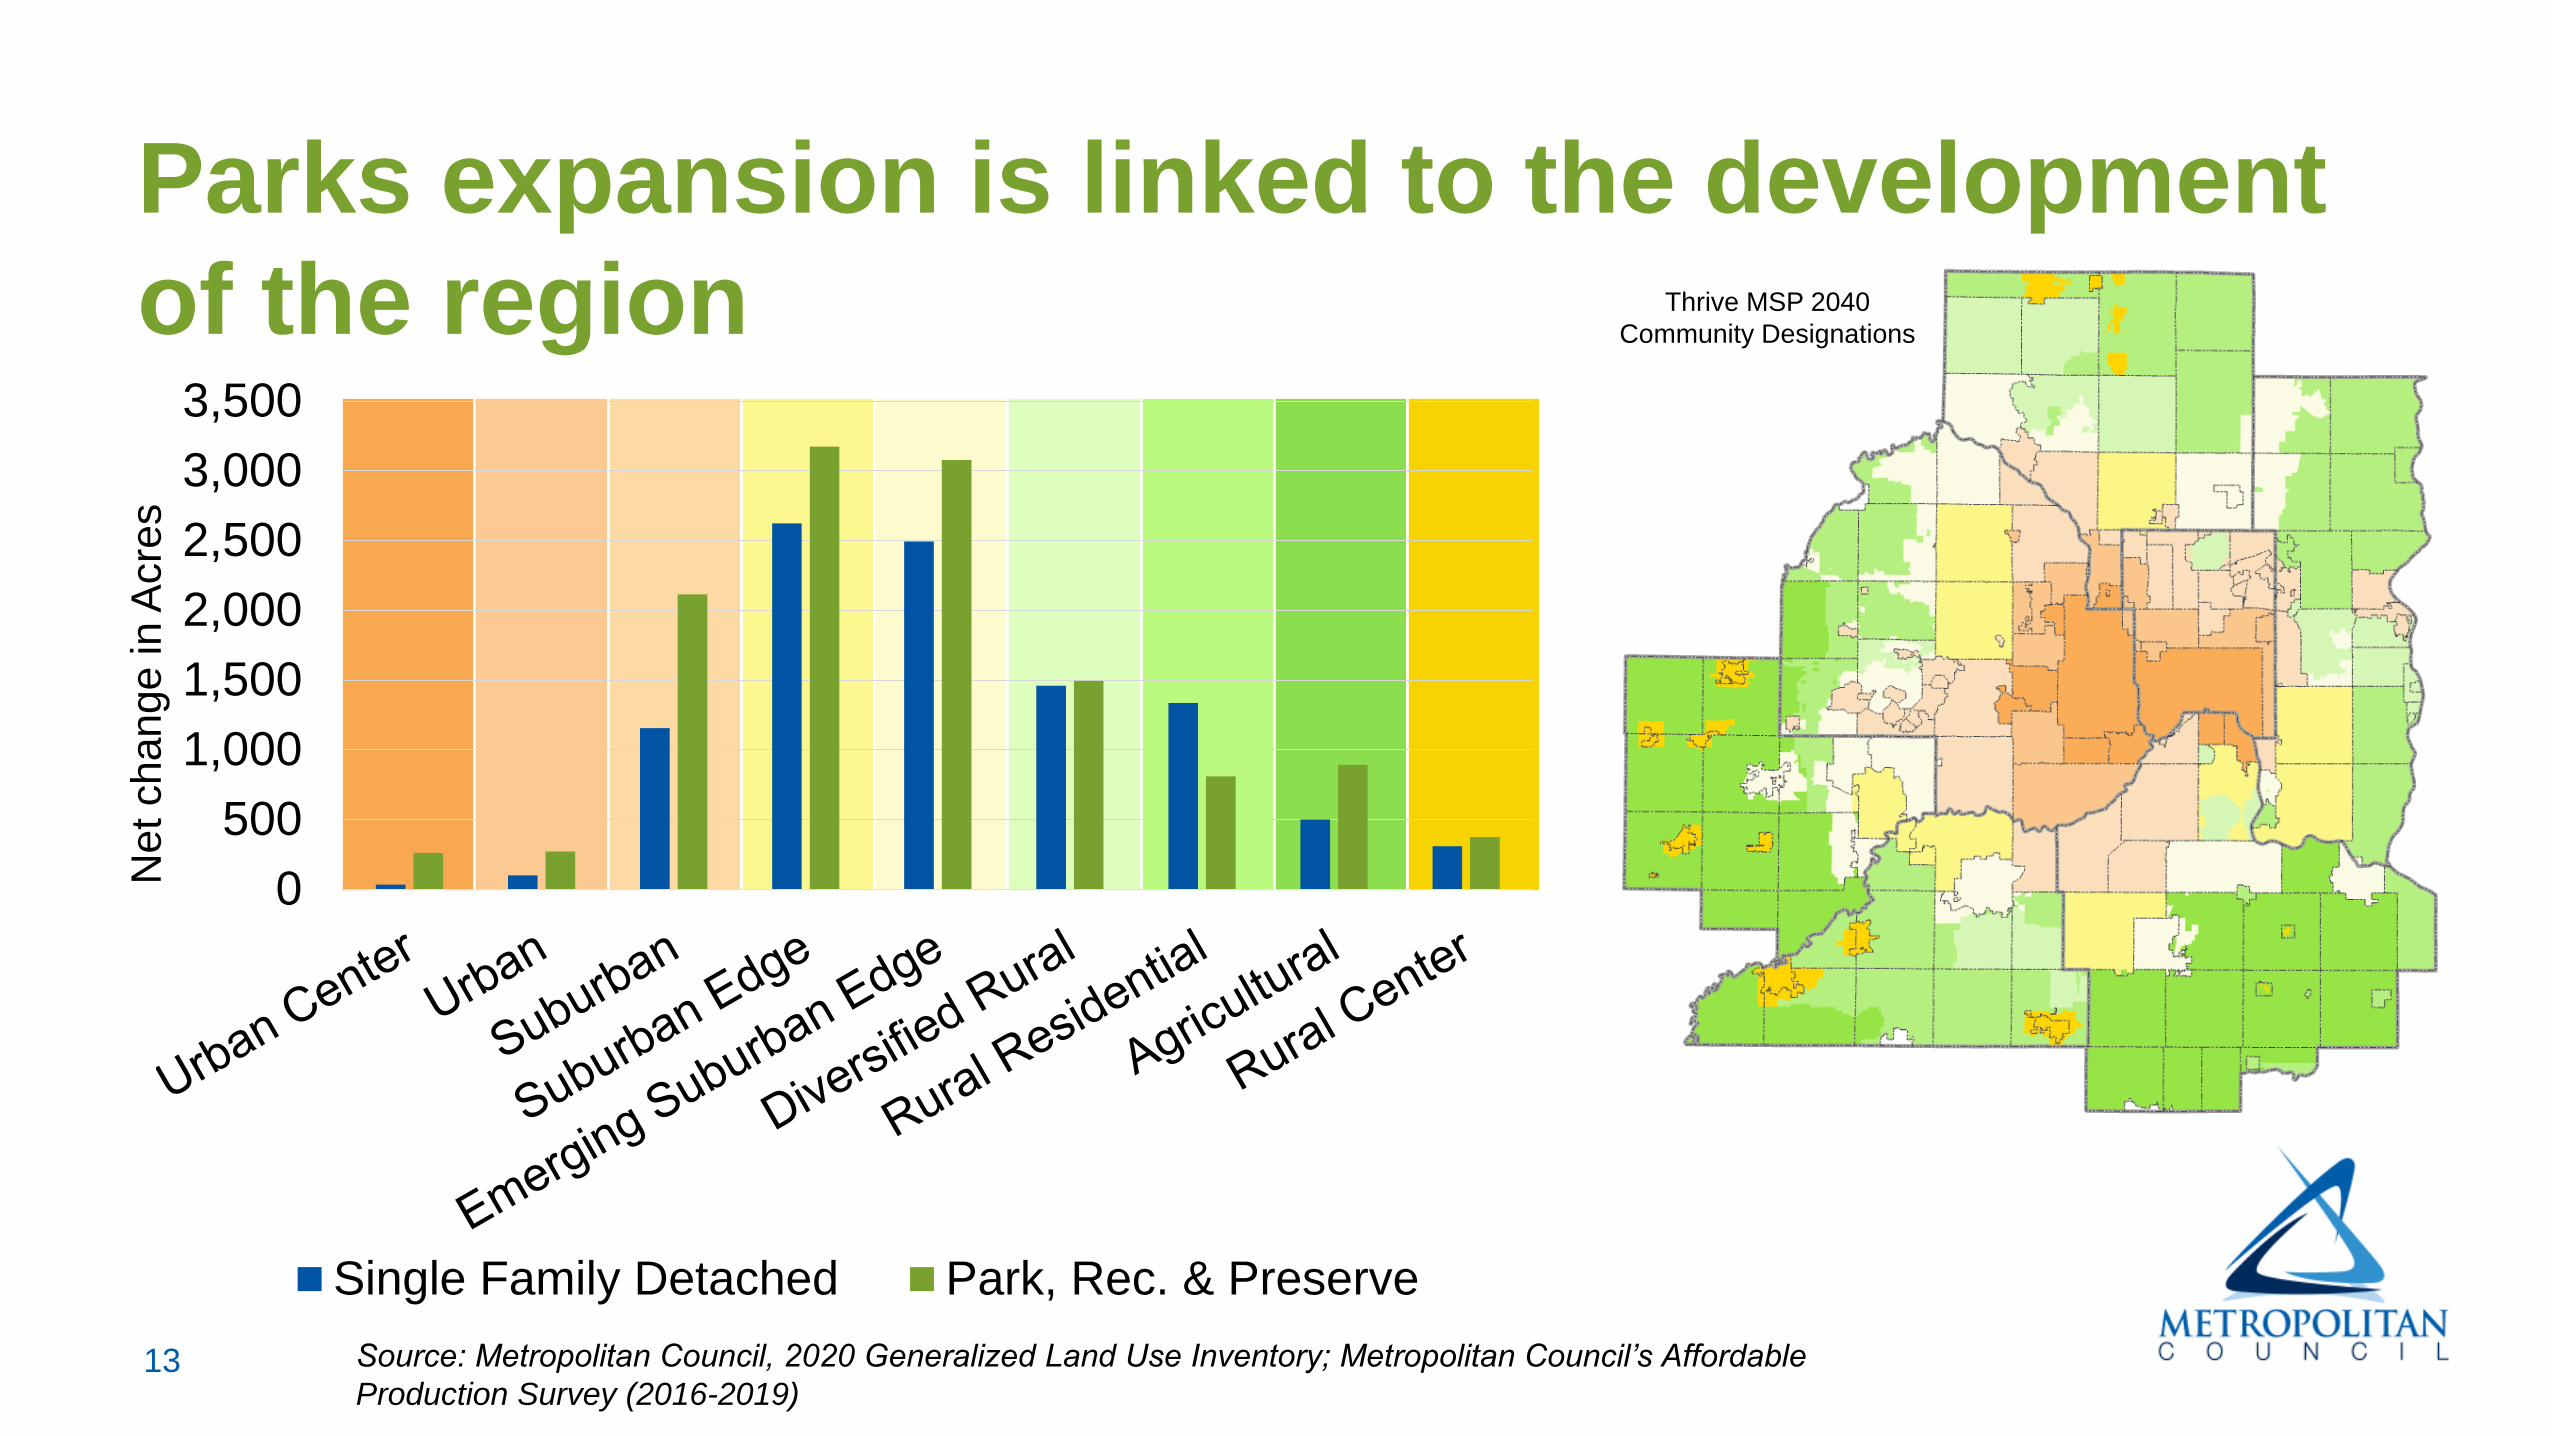
0
500
1,000
1,500
2,000
2,500
3,000
3,500
Single Family Detached Park, Rec. & Preserve
Parks expansion is linked to the development
of the region
Ne
t ch
an
ge
in
Acre
s
Source: Metropolitan Council, 2020 Generalized Land Use Inventory; Metropolitan Council’s Affordable
Production Survey (2016-2019)
Thrive MSP 2040
Community Designations

14
Land consumption suggests more compact
development
Source: Metropolitan Council, 2020 Generalized Land Use Inventory; Metropolitan Council Population Estimates
183227
106
443490
290
1990-2000 2000-2010 2010-2020
Acres per 1,000 new residents Acres per 1,000 new households
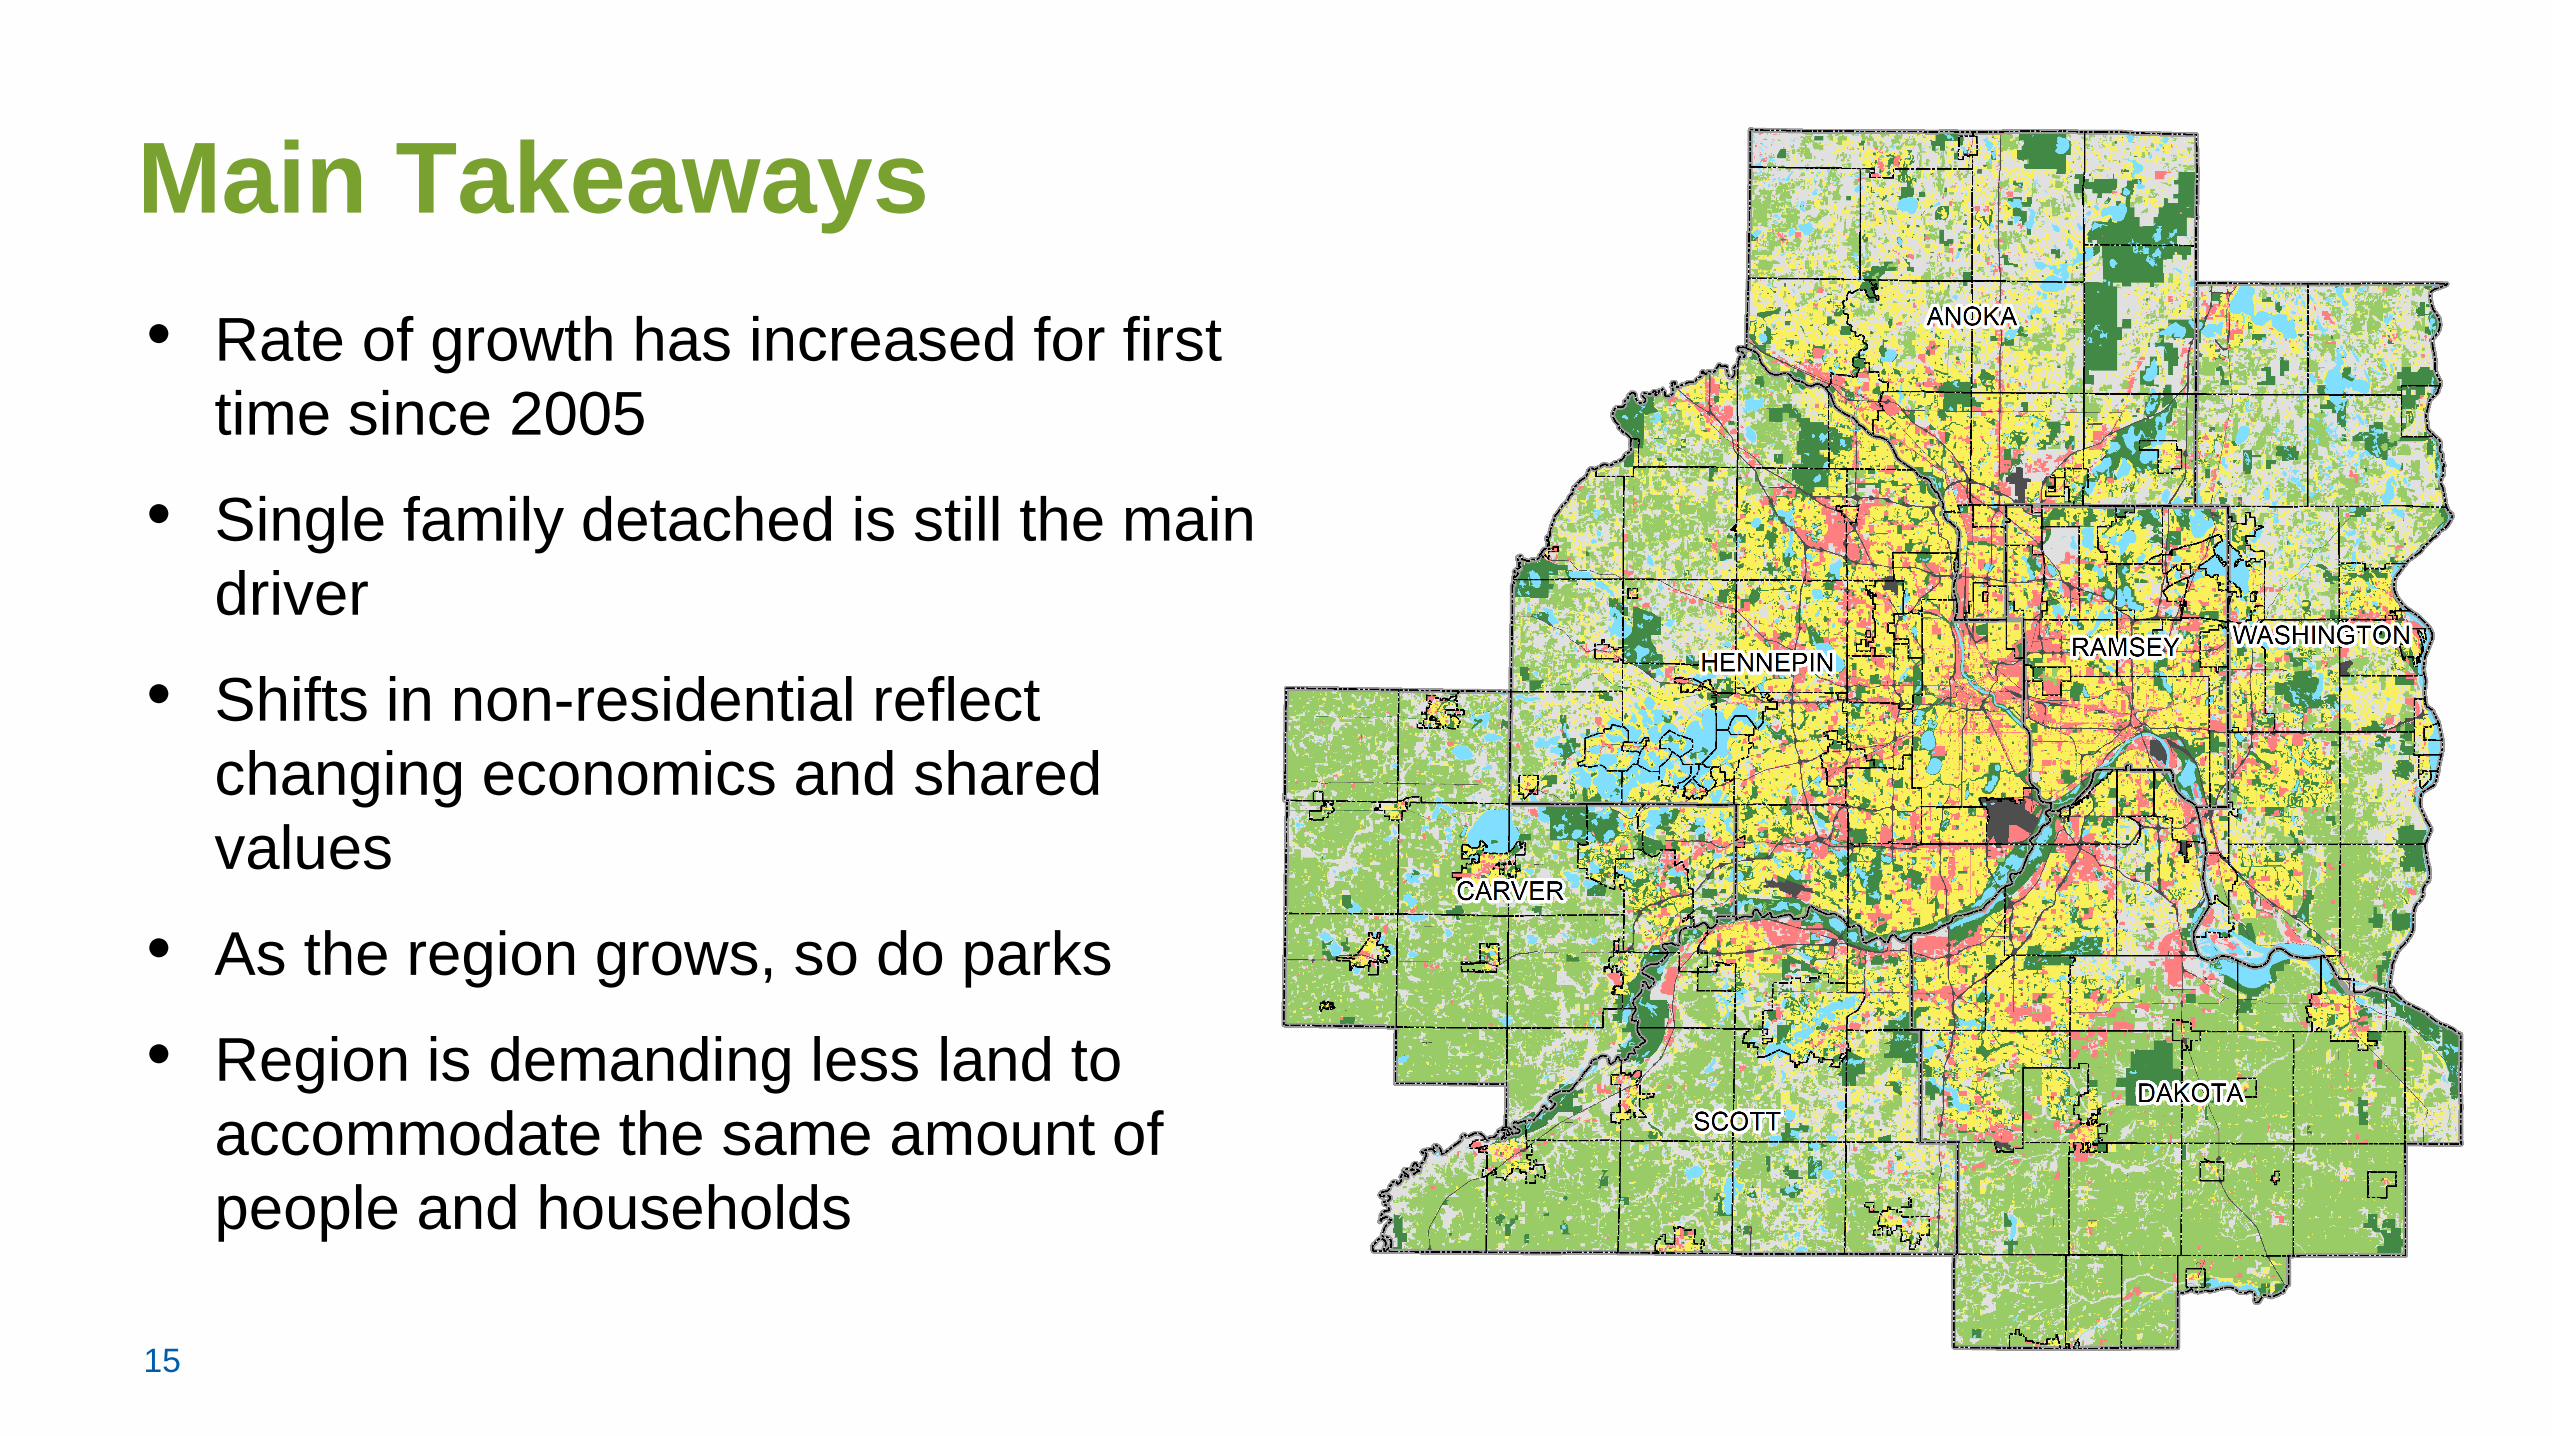
15
• Rate of growth has increased for first
time since 2005
• Single family detached is still the main
driver
• Shifts in non-residential reflect
changing economics and shared
values
• As the region grows, so do parks
• Region is demanding less land to
accommodate the same amount of
people and households
Main Takeaways
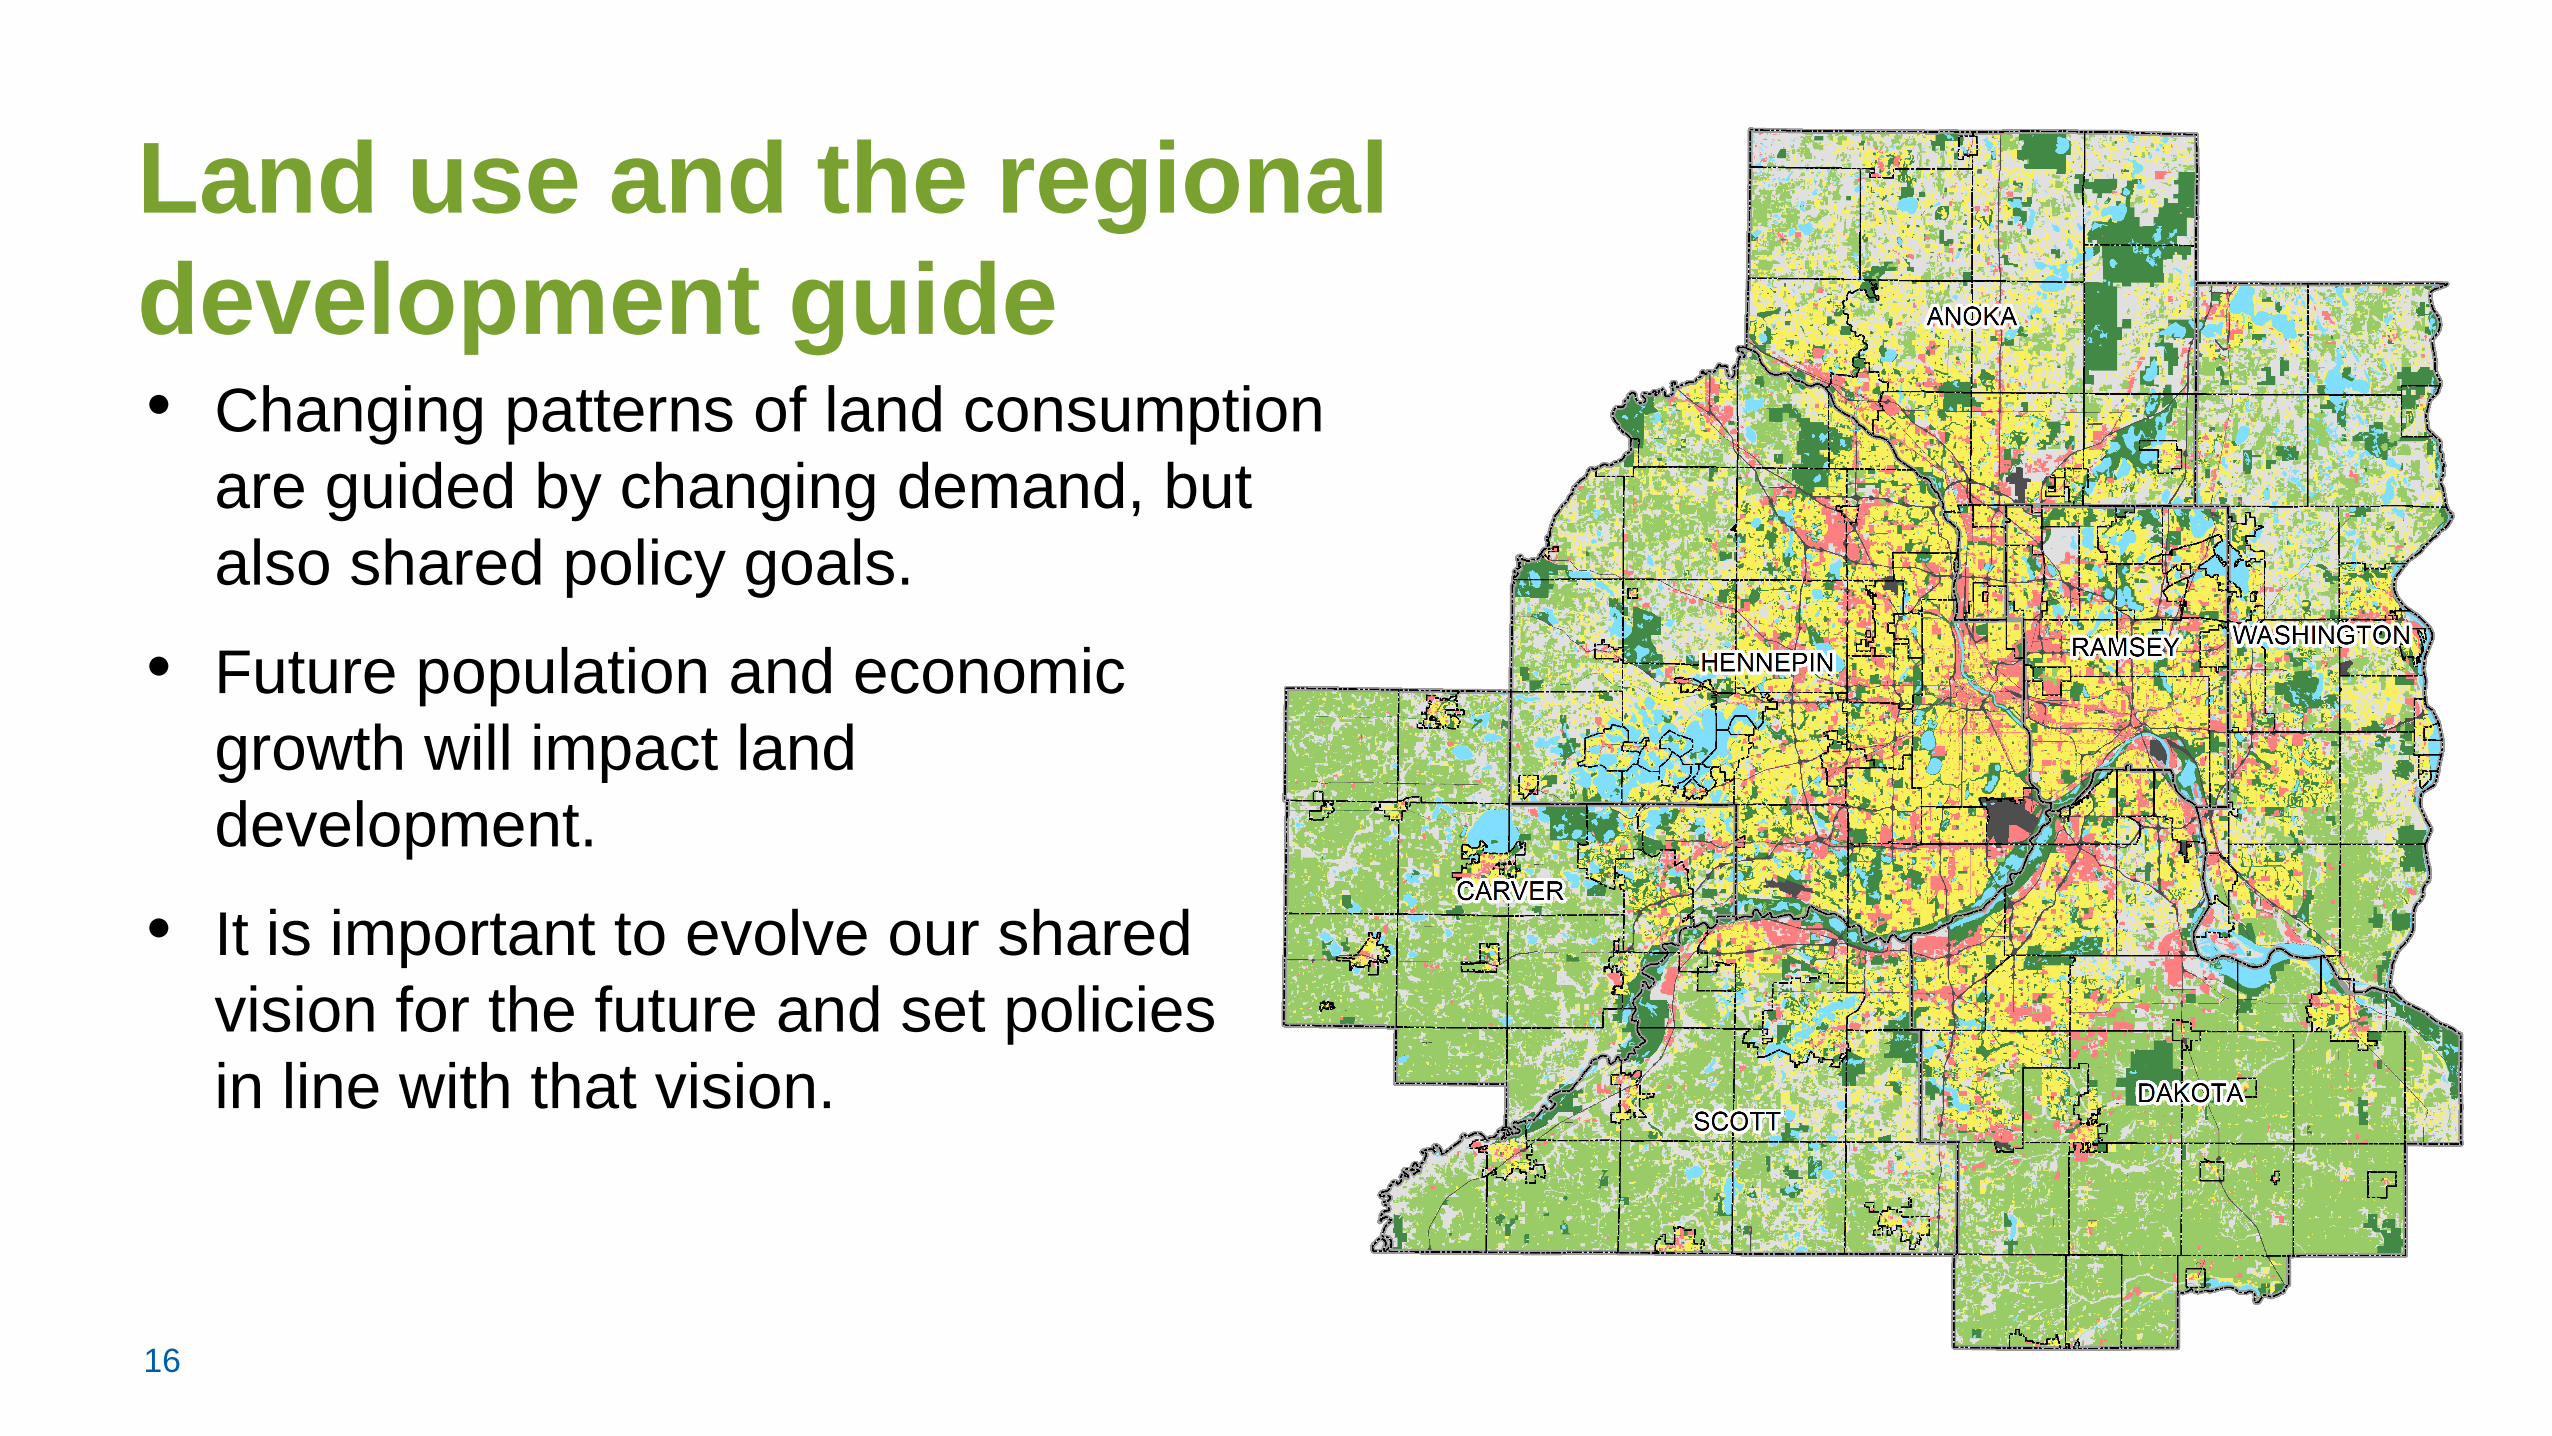
16
• Changing patterns of land consumption
are guided by changing demand, but
also shared policy goals.
• Future population and economic
growth will impact land
development.
• It is important to evolve our shared
vision for the future and set policies
in line with that vision.
Land use and the regional
development guide

Paul Hanson | GIS Coordinator
metrocouncil.org/research
For more information