Embed Size (px)
Citation preview

__
RELEASE OF MICROORGANISMS FROM SOLID MATERIALS
Prepared for
CALIFORNIA INSTITUTE OF TECHNOLOGY
JET PROPULSION LABORATORY
CONTRACT NUMBER 952916
RECEIVED
m2 Me1 FAIWI Wm
Prepared by E.A. Gustan
R. L. Olson, Ph. D.
TmEA rAV"S COMPANY Aerospace Group
Seattle, Washington
(ACCESS (THRU)
COE NATIONAL TECHNIC L>~~~INFORMATION, SEj.VtCE:, |(A O TMSXrifi BVa- elNU 221(CAT
.(NASA CRORTXO UMER-- (CATGRY INOMTQSEVC
https://ntrs.nasa.gov/search.jsp?R=19710024580 2018-08-30T20:51:26+00:00Z

RELEASE OF MICROORGANISMS
FROM SOLID MATERIALS
FINAL REPORT
July 1971
Prepared for
CALIFORNIA INSTITUTE OF TECHNOLOGY JET PROPULSION LABORATORY
CONTRACT NUMBER 952916
"This work was performed for the Jet Propulsion Laboratory, California Institute of Technology, as sponsored by the National Aeronautics and Space Administration under Contract NAS 7-100."
Prepared by
E. A. Gustan R. L. Olson, Ph.D.
THE BOEING COMPANY Aerospace Group
Seattle, Washington
ABSTRACT
RELEASE OF MICROORGANISMS FROM SOLID MATERIALS
This contract consisted of three study phases that provided infor
mation on the release of microorganisms by hard impact and
determined the effect of aeolian erosion on the release of micro
organisms. The first phase was initiated to determine the efficiency
of grinding, as compared to dissolution, for recovery of micro
organisms from solids. An adjustment constant of 20 was derived
from the data that can be used to equate bacterial spore counts
obtained by grinding'with those obtained by dissolution.
Phase II was conducted to determine the percentage of microorganisms
released due to hard impact of Eccobond onto sand. This study pro
vides additional data to JPL Contract Number 952511. In this study,
Eccobond was impacted onto sand at velocities of 168, 457, 945 and
1554 m/sec. The results showed that less than 1 percent of the avail
able organisms was released by impact.
The Phase III study was iritiated to determine the percentage of
bacterial spores released from methyl methacrylate and Eccobond
by aeolian erosion. Sand, accelerated by air or carbon dioxide, was
used to erode 0.25 grams of material from one gram discs. The
results showed that less than 1 percent of the available organisms
was released by the erosion process.

TABLE OF CONTENTS
SECTION I - SUMMARY 1
SECTION . - PHASE I: GRINDING EFFICIENCY STUDIES FOR MICROBIAL RECOVERY
5
SECTION III - PHASE II: IMPACTION OF INOCULATED ECCOBOND ONTO SAND
33
SECTION IV - PHASE Ill: EROSION OF INOCULATED METHYL METHACRYLATE AND ECCOBOND BY SAND BLASTING
58

Cl,m 0

SECTION I
SUMMARY
RELEASE OF MIICROOAGANISMS FROM
SOLID MATERIALS
SUMMARY
RELEASE OF MICROORGANISMS FROM SOLID MATERIALS
This is the final report submitted by The Boeing Company to the Jet Propulsion Laboratory on JPL Contract Number 952916. Three research phases were conducted for the contract that extended from July 1970 through June 1971. These phases are discussed separately in this report in Sections I, III and IV respectively. A summary of the total contract effort is presented in Section I.
INTRODUCTION
Viable terrestrial microorganisms may be trapped in certain solid
spacecraft materials and survive decontamination or terminal sterili
zation processes. These surviving organisms are then available for
release into planetary environments by fracturing of the solid materials
due to a hard impact of the vehicle and by environmental erosion. Data
are required on these release mechanisms in order to evaluate the prob
ability of microbial release from spacecraft within the planetary contami
nation constraints established by the Committee on Space Research
(COSPAR) and the National Aeronautics and Space Administration (NASA).
The probability of release evaluations can have a significant impact on the
spacecraft terminal sterilization cycle as well as the flight acceptance
cycles by their inclusion in a tbtal probabilistic systems analysis of con
taminating events. The objective of this investigation was to obtain in
formation that can be used in probability calculations related to planetary
quarantine.
From a previous study, "Release of Microorganisms From Solids After
Simulated Hard Landings," (JPL Contract No. 952511), additional research
areas were identified which make up the three phases for this investigation.
Phase I was conducted to determine the efficiency of a grinding technique
to release microorganisms for enumeration from the interior of a solid
material. Data was obtained for purposes of calculating an adjustment
constant to be used in adjusting the numerical counts obtained by the
2

grinding technique. The second phase was conducted to determine the
number of bacterial spores released from inoculated Eccobond after
a hard impact onto sand. This release data provides additional informa
tion to supplement the hard impact release studies conducted previously.
Phase III was conducted to provide information on the effect of aeolian
erosion on the release of microorganisms from solid materials. The
data obtained can be used to determine the probability of microbial re
lease due to this erosion process.
PHASE I
GRINDING EFFICIENCY STUDIES FOR MICROBIAL RECOVERY
A series of tests were initiated in which dissolving and grinding techniques
were employed to recover bacterial spores from methyl methacrylate.
Spore recovery data was also obtained from Eccobond by grinding. The
data generated during these tests were used to calculate an adjustment con
stant that is used to equate the microbial counts obtained by grinding to
the counts obtained by dissolution. The spore counts obtained by grinding
are multiplied by the adjustment constant which was calculated to be 20.
In addition, tests were conducted on the size of particles resulting from
grinding methyl methacrylate and Eccobond and the number of spores
associated with these particles. The data indicates that the ground Ecco
bond particles appeared somewhat smaller than the methyl methacrylate
particles. However, the number of spores that grew on the surfaces of
both groups of particles was approximately the same. This discrepancy
may be due to the sieving method that was used for sizing the particles
since it was not possible to determine the exposed surface area directly.
PHASE II
IMPACTION OF INOCULATED ECCOBOND ONTO SAND
Tests were conducted to determine the number of bacterial spores re
leased from internally inoculated Eccobond pellets after a hard impact,
onto sand. One gram Eccobond pellets were fabricated so as to contain
3

4 approximately 1 x 10 Bacillus subtilis var. niger spores. These pellets
were propelled from a gun at 168, 457, 945 and 1554 meters per second
into sand. After impact, the pellet fragments and sand were assayed to
determine the number of viable spores released.
The data showed that less than 1 percent of the available organisms in
the pellets was released upon impact at the four test velocities. These
results are consistent with the results from previous hard impact studies.
PHASE III
EROSION OF INOCULATED METHYL METHACRYLATE AND ECCOBOND
BY SAND BLASTING
A series of tests were conducted to determine the effect of the erosive
action of sand on the release of bacterial spores from solid materials.
Internally inoculated methyl methacrylate and Eccobond 1 gram discs were
subjected to simulated aeolian erosion in a specially designed sand blasting
apparatus. Approximately 0. 25 grams were eroded from each disc for
each of 4 exposure conditions; 0. 5, 2 and Z4 hours using air and 0. 5 hours
using carbon dioxide. After each erosion cycle, the contents of the sand
blasting apparatus were assayed for released viable spores.
The results showed that less than 1 percent of the available spores was
released for all test conditions. An analysis of variance of the percent
of spores released showed no significant differences between the test
conditions or between the 2 materials.

C/3
0

SECTION II
PHASE I
GRINDING EFFICIENCY STUDIES
FOR MICROBIAL RECOVERY
5

TABLE OF CONTENTS
Page
1.0 PURPOSE 7
2.0 INTRODUCTION 7
3.0 PROCEDURE 7
3. 1 Pellet Manufacture 8
3. Z Pellet Dissolving Technique 11
3.3 Pellet Grinding Technique 12
3.4 Particle Sieving Technique 12
3.5 Spore Recovery Analyses 15
3.6 Particle Distribution 17
4.0 RESULTS AND DISCUSSION 17
4. 1 Spore Recovery from Parallel Studies 17
4. 2 Grinding Adjustment Constant 20
4. 3 Particle Sizes from Ground Pellets 21
4.4 Percent Spore Outgrowth Z1
5.0 SUMMARY AND RECOMMENDATIONS 25
6.0 APPENDIX 26
6

PHASE I
GRINDING EFFICIENCY STUDIES FOR MICROBIAL RECOVERY
1.0 PURPOSE
This phase of the program was conducted to determine the efficiency of a
grinding technique used to recover bacterial spores for enumeration from
internally inoculated materials.
2.0 INTRODUCTION
Results from a previous investigation (JPL Contract No.952511, "Release
of Microorganisms From Solids After Simulated Hard Impact") indicated
that when Eccobond was impacted onto stainless steel, the percentage of
spores released was approximately ten times greater than the number of
spores released from methyl methacrylate under the same conditions.
This difference could be attributed to a material effect or to differences
in assay procedures, i.e., Eccobond was ground to obtain the initial num
ber of organisms present in pellets before firing while methyl methacrylate
was dissolved. A gross visual examination of the fractured Eccobond and
methyl methacrylate pellets showed generally similar characteristics with
respect to fracture patterns, surface areas and particle sizes after impact.
The minor differences that were observed in fracturing did not appear great
enough to account for the differences observed in the percentage of spores
released in the two materials. It was, therefore, concluded that the assay
techniques and material fabrication should be investigated. This study was
initiated to investigate these observed differences and to determine the
efficiency of'grinding materials for microbial enumeration.
3.0 PROCEDURE
Methyl methacrylate and Eccobond pellets were inoculated and fabricated
so that each pellet contained approximately 5 x 10⁴ Bacillus subtilis var.
ni2er spores per gram of finished material. Recovery of the spores was
obtained from methyl methacrylate by dissolution and grinding techniques
and from Eccobond by grinding only. Information was also obtained from
methyl methacrylate and Eccobond on the size of the particles resulting
7
from the grinding process. The data from these'parallel studies are
used to calculate an efficiency factor for the grinding process. The steps
and sequence used for the parallel studies are outlined in Figure 1.
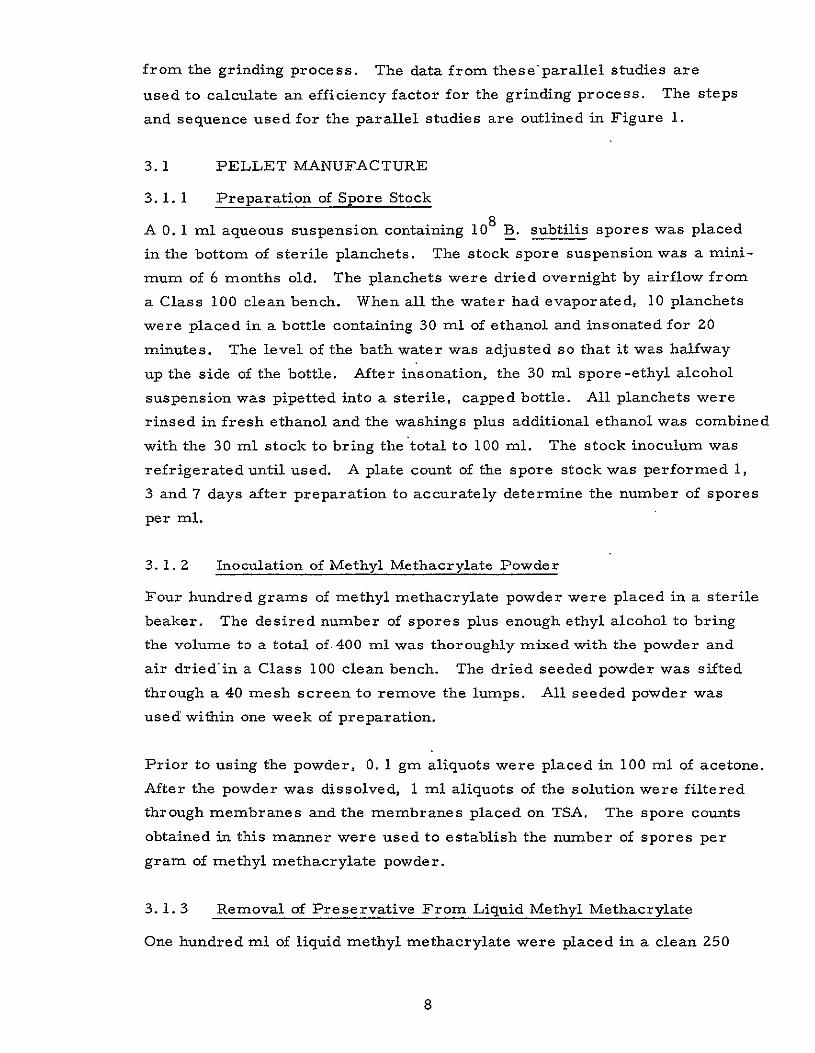
3.1 PELLET MANUFACTURE
3. 1. 1 Preparation of Spore Stock
A 0. 1 ml aqueous suspension containing 108 B. subtilis spores was placed
in the bottom of sterile planchets. The stock spore suspension was a mini
mum of 6 months old. The planchets were dried overnight by airflow from
a Class 100 clean bench. When all the water had evaporated, 10 planchets
were placed in a bottle containing 30 ml of ethanol and insonated for 20
minutes. The level of the bath water was adjusted so that it was halfway
up the side of the bottle. Alter insonation, the 30 ml spore-ethyl alcohol
suspension was pipetted into a sterile, capped bottle. All planchets were
rinsed in fresh ethanol and the washings plus additional ethanol was combined
with the 30 ml stock to bring the total to 100 ml. The stock inoculum was
refrigerated until used. A plate count of the spore stock was performed 1,
3 and 7 days after preparation to accurately determine the number of spores
per ml.
3. 1.2 Inoculation of Methyl Methacrylate Powder
Four hundred grams of methyl methacrylate powder were placed in a sterile
beaker. The desired number of spores plus enough ethyl alcohol to bring
the volume to a total of.400 ml was thoroughly mixed with the powder and
air dried'in a Class 100 clean bench. The dried seeded powder was sifted
through a 40 mesh screen to remove the lumps. All seeded powder was
used within one week of preparation.
Prior to using the powder, 0. 1 gm aliquots were placed in 100 ml of acetone.
After the powder was dissolved, 1 ml aliquots of the solution were filtered
through membranes and the, membranes placed on TSA. The spore counts
obtained in this manner were used to establish the number of spores per
gram of methyl methacrylate powder.
3.1.3 Removal of Preservative From Liquid Methyl Methacrylate
One hundred ml of liquid methyl methacrylate were placed in a clean 250
8

METHYL METHACRYLATE ECCOBOND
Inoculate Powder Inoculate liquidNumber of spores
Number of eporee per gram liquid per gram powder Calculations: MN, 1. (MN0 )(MWTI) . MN. Calculations:1. (ENo)(EWTI) EN = EN0
MN number of spores contained EN, = number of spores, contained Total nght ofpowe pder
Iin
2. (MN
the measured quantity ofmethyl methacrylate powder. 7/(MWTZ) 2 MiNt
in the measured quantityof Eccobond liquid,
2. (EN)/(EWT2 ) = ENt
Total weight of liquid
MWT MNt = theoretical number of spores ENt = theoretical number of E
contained in one gram of spores contained in one polyerised pinstic grain of polymierized
Eccobond
polymerized
T~ta Totalweigt
nigt ofTotal ofpolymierized
weight of
Eccobond' plastic _____________________
= MWT 2 = EWT 2
Fabricate me Fabricate one gram pellets giam pellets
(96)*(32)* Grind, sieve Grind. sieve
- - -& weigh each group
& weigh.each group
aceone & filter pour plate, and filter and plate each-go(16) disle&pourgroup(l6) plate.
=MNd = MN ' " = MN :'MAI'..MA 7 =M .. M oftotalpeilet of total pelletg
retained by retained by • each sieve each sieve,
• = MPr ... MP 7 = EP1 ... EP 7
* Number of Replicate Pellets
NOTE: Heavily outlined boe. ire additional methyl mathacrylate steps
Figue 1: GRI fDING EFFICIENCY STUDY SEQUENCE

ml separatory funnel. A 100 ml freshly prepared 2% solution of sodium
hydroxide was then added. The mixture was gently swirled for one minute
and allowed to separate into two fractions. The bottom pink fraction con
taining the preservative was discarded. Another 100 ml of 2% sodium hy
droxide was added, and the washing process repeated until no pink color
was observed in the bottom layer. When the bottom layer was clear, one
additional washing with 100 ml sodium hydroxide was performed. The
washed liquid methyl methacrylate was rinsed with separate 100 ml volumes
of distilled water to remove all traces of sodium hydroxide. The number of
rinses was one more than the sodium hydroxide. All water (bottom layer)
was drained from the funnel. The washed liquid methyl methacrylate was
used within 24 hours of preparation.
3. 1.4 Polymerization of Methyl Methacrylate
Forty ml of washed liquid methyl methacrylate were added to 40 gm of
seeded powder in a glass beaker and mixed until a uniform slurry was ob
tained. The mixture was poured into glass test tubes (13 x 100 mm) so that
they were 2/3 full. As each tube was filled, the beaker was swirled to assure
a homogeneous mixture. When all tubes were filled, they were immediately
placed in a desiccator jar and the pressure reduced to 127 mm of mercury
for 10 minutes. This vacuum is sufficient to create a slow bubbling action
of the mixture in the tubes, but not so low as to cause the mixture to "climb"
out the tube as the air is removed by the vacuum. The tubes were then trans
ferred for curing to a 50 C water bath and heated for 1. 5 hours. The water
level of the bath was adjusted so that it was slightly above the plastic level
in the tubes. After 1. 5 hours the tubes were removed from the bath and
allowed to cool at room temperature for 10 minutes. The fabricated plastic
rods were removed by breaking the glass tube. The rods were then stored
in a glass jar in the freezer (-180C) until they were machined into pellets.
3. 1. 5 Inoculation and Polymerization of Eccobond
One hundred and twenty grams of Eccobond 55 liquid were placed in a glass
beaker and the required number of spores in 0. 6 ml of ethyl alcohol was
added and thoroughly mixed with the Eccobond. Prior to fabricating the
solid, 0. 1 gm aliquots were removed and placed in 100 ml of acetone. After
the liquid Eccobond had dissolved, I ml aliquots of the solution were filtered
10

through membranes and the membranes placed on TSA. The spore counts
obtained in this manner were used to establish the number of spores con
tained in 1 gram of Eccobond 55.
Forty grams of the inoculated Eccobond 55 were added to 4. 32 grams of
Catalyst 9 and mixed thoroughly. The mixture was then placed in a desic
cator jar and the pressure reduced to 127 mm of mercury for 10 minutes
to remove the air bubbles. The mixture was then removed from the jar
and poured into 13 x 100 mm Teflon tubes which were placed in a 50°C
oven for curing. After 3 hours, the tubes were removed from the oven
and cooled at room temperature for 10 minutes. The Eccobond was removed
from the tubes and the rods were stored in a freezer (-18 C).
3. 1.6 Pellet Fabrication
Seeded methyl methacrylate and Eccobond rods were machined into pellets
by'turning the rods on a lathe. The maching sequence was to cut all rods
from one batch of plastic to an established diameter. Face cuts were then
made to finish the pellets to the correct length. Each finished pellet was
0. 81 cm in diameter, 1. 63 cm long, and weighed approximately I gm.
3. 1. 7 Pellet Surface Sterilization
After machining, each pellet was labelled with a number, weighed to the
nearest one-thousandth of a gram and this information recorded. Each
one was surface sterilized in a freshly prepared 2000 ppm chlorine solu
tion for 10 minutes. This was followed by a 10 minute soak in a fresh
filter-sterilized 2% solution of sodium thiosulfate. Then, the pellets were
exposed to the airflow of a Class 100 clean bench for 15 minutes to evaporate
any moisture on the surface. Each pellet was stored in a freezer in a
sterile, appropriately labelled, screw-capped test tube until used.
PELLET DISSOLVING TECHNIQUE
Acetone was used as the solvent for dissolving methyl methacrylate. Approxi
mately 400 mls of acetone were used to dissolve 1 gram of methyl metha
crylate. The acetone and methyl methacrylate were contained in a one
liter, screw-capped bottled and placed on a refrigerated reciprocal shaker
maintained at 10 0 C. Approximately 24 hours were required for complete
dissolution.
11
3.2
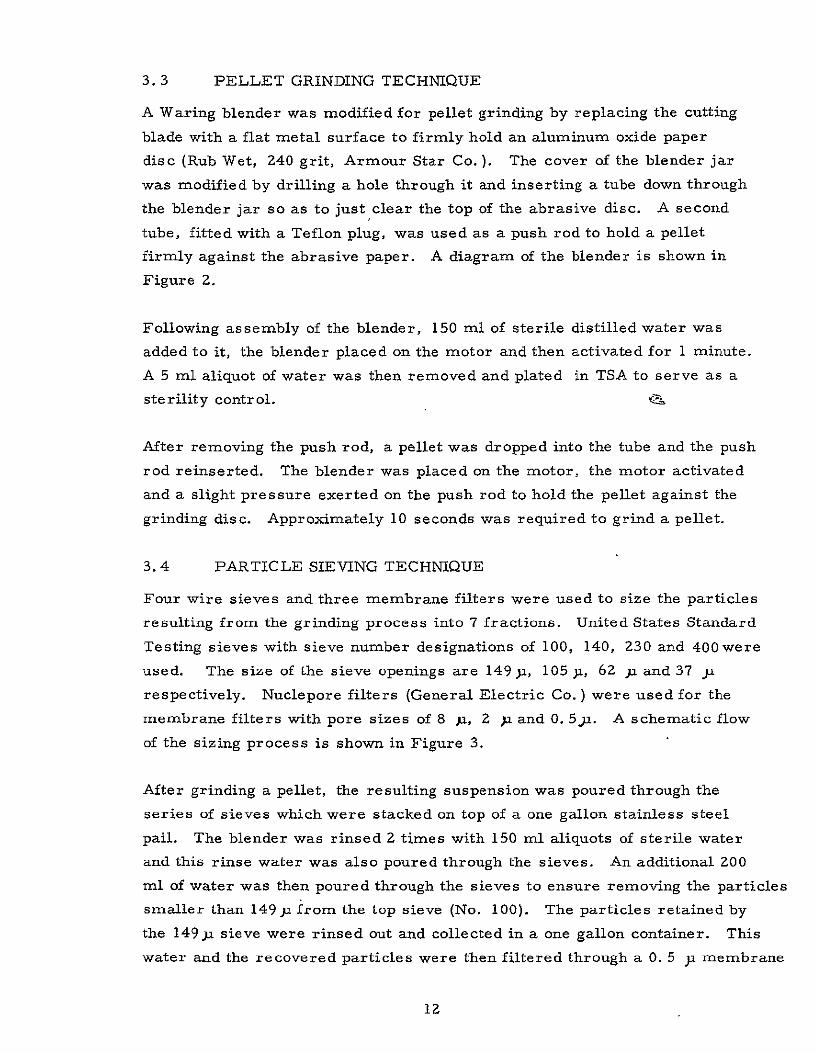
3. 3 PELLET GRINDING TECHNIQUE
A Waring blender was modified for pellet grinding by replacing the cutting
blade with a flat metal surface to firmly hold an aluminum oxide paper
disc (Rub Wet, 240 grit, Armour Star Co.). The cover of the blender jar
was modified by drilling a hole through it and inserting a tube down through
the blender jar so as to just clear the top of the abrasive disc. A second
tube, fitted with a Teflon plug, was used as a push rod to hold a pellet
firmly against the abrasive paper. A diagram of the blender is shown in
Figure 2.
Following assembly of the blender, 150 ml of sterile distilled water was
added to it, the blender placed on the motor and then activated for 1 minute.
A 5 ml aliquot of water was then removed and plated in TSA to serve as a
sterility control.
After removing the push rod, a pellet was dropped into the tube and the push
rod reinserted. The blender was placed on the motor, the motor activated
and a slight pressure exerted on the push rod to hold the pellet against the
grinding disc. Approximately 10 seconds was required to grind a pellet.
3.4 PARTICLE SIEVING TECHNIQUE
Four wire sieves and three membrane filters were used to size the particles
resulting from the grinding process into 7 fractions. United States Standard
Testing sieves with sieve number designations of 100, 140, 230 and 400were
used. The size of the sieve openings are 149 ji, 105 ja, 62 p and 37 y2
respectively. Nuclepore filters (General Electric Co. ) were used for the
membrane filters with pore sizes of 8 jp, 2 pu and 0. 5j. A schematic flow
of the sizing process is shown in Figure 3.
After grinding a pellet, the resulting suspension was poured through the
series of sieves which were stacked on top of a one gallon stainless steel
pail. The blender was rinsed Z times with 150 ml aliquots of sterile water
and this rinse water was also poured through the sieves. An additional ZOO
ml of water was then poured through the sieves to ensure removing the particles
smaller than 14 9u from the top sieve (No. 100). The particles retained by
the 149 ) sieve were rinsed out and collected in a one gallon container. This
water and the recovered particles were then filtered through a 0. 5 ja membrane
iZ

Plunger
O-Ring Seal
Hollow Tube
Grinding Disc
Figure 2: MODIFIED WARING BLENDER
13

GROUNDPELLET
~WATER
RINSES
Figure 3: SCHEMATIC OF SIZING PROCESS
14

filter. The next sieve, 105A, in the stack was then rinsed with 200 ml
of water and the same process repeated to collect the particles on a 0. 5 31
membrane filter. This process was repeated twice more for the remaining
two sieves.
Approximately 1200 ml of water containing particles less than 37 )a were
collected in the pail from the sieve washings. This suspension was divided
into 4 aliquots and each aliquot was filtered through a separate 8 y filter.
The resulting filtrate was then put through a 2 p filter and finally through a
0.5 pu filter to complete the particle sizing into 7 fractions.
3.5 SPORE RECOVERY ANALYSES
The plating medium used for the spore analyses described in the following
paragraphs was Trypticase Soy Agar, BBL. All of the filters used were
Nuclepore membrane filters (General Electric Company). The pour plates
and filters prepared for enumeration of viable spores were incubated at
30 0 C for 72 hours prior to colony counting.
3.5. 1 Dissolved Methyl Methacrylate
After complete dissolution of a methyl methacrylate pellet in 400 mls of
acetone, the solution was assayed for viable spores. A 1 ml aliquot was
filtered through a 0. 5y filter and an additional 10 ml of sterile acetone
were used to rinse the filter and filter funnel. Three replicate samples
were filtered in this manner and the membranes incubated on TSA. The
counts obtained were used to establish the number of spores recoverable
from methyl methacrylate pellets by the dissolving technique.
3. 5. 2 Ground Methyl Methacrylate
Pour plates were made of the suspension resulting from grinding a pellet
in 145 ml of water. A 10 ml aliquot was removed from the blender and
distributed into 3 separate petri dishes. A large tipped - 10 ml pipette
was used for taking the sample because the ground methyl methacrylate
tended to clump and plug the opening of regular pipettes. Three replicate
samples were plated in this manner for spore counts. These counts repre
sent the number of spores recoverable by grinding methyl methyacrylate
pellets.
15

3.5.3 Ground and Dissolved Methyl Methacrylate
After grinding a pellet, the suspension was filtered through a 0. 5u
filter. The blender was rinsed twice with 150 ml aliquots of water and
the rinse water was also filtered. The filter and particles trapped on
it were put into a Fernbach culture flask and 400 ml of acetone added.
After complete dissolution of the particles, a 2 ml aliquot was removed
and filtered through a 0.5 1 filter. The filter was then rinsed with 10
ml sterile acetone and plated on TSA. Three replicate samples were
prepared and the filters incubated for viable spore counts. The counts
obtained in this manner represent the number of spores that have sur
vived the abrasiveness of grinding.
3.5.4 Ground and Sieved Methyl Methacrylate
Methyl methacrylate pellets were ground and sieved into 7 fractions as
described in Section 3. 4. The four 0. 5 ) filters used to collect the
particles from the 100, 140, 230 and 400 wire screens were each placed
in a separate small screw-capped bottle containing 20 ml of sterile
distilled water. The four filters used to collect the 8 u particles were
also put into a bottle containing 20 ml of water. Pour plates were made
from aliquots of each of the samples to obtain the spore counts associated
with each fraction. The filters containing the 2 p and 0. 5 pa particles were
plated directly in TSA. These last two fractions contained very few spores,
therefore, dilution in water was unnecessary.
3.5. 5 Ground, Sieved and Dissolved Methyl Methacrylate
The filters used to collect the particle fractions after grinding and sieving
a pellet were placed in individual 250 ml Erlenmeyer flasks, each con
taining 100 ml sterile acetone. The four filters containing the 8 )1 particles
were placed in one flask. After complete dissolution of the particles, ali
quots from each sample were filtered through 0. 5ji filters. Each filter
was rinsed with 10 ml acetone and then plated in TSA. The counts obtained
were used to establish the total number of spores present in each fraction.
3.5.6 Ground Eccobond
Viable spore counts from ground Eccobond pellets were obtained in the
same manner as for methyl methacrylate described in Paragraph 3. 5. 2.
16

3. 5.7 Ground and Sieved Eccobond
Viable spore counts from the sieved fractions of ground Eccobond are
the same as described in Paragraph 3. 5.4.
3.6 PARTICLE DISTRIBUTION
The distribution of particle sizes resulting from grinding methyl metha
crylate and Eccobond was determined by weight of the particles in each
fraction after sieving, see Section 3.4. The filters used to collect the
particles from the sieving process were weighed prior to use. After
collecting the particle fractions on a filter, the filter was placed in a
petri dish and dried in an oven at 500 C for 72 hours. After drying the
particles, the filter was again weighed to obtain the weight of the material
collected.
4.0 RESULTS AND DISCUSSION
4. 1 SPORE RECOVERY FROM PARALLEL STUDIES
A summary of the results obtained from the parallel studies conducted
with methyl methacrylate and Eccobon is presented in Table 1. The
unreduced data from which these summary figures were calculated are
given in the Appendix.
Table 1: SUMMARY OF PARALLEL STUDIES
Average Average Average Average Theoretical No. Spores No. Spores No. Spores per
Material No. Spores per Gram
per Gram by Dis-
per Gran Grinding
by Gram by Grinding/Dis
solving solving
Methyl 6500Methacry- 50, ZOO 33,600 1500
late
Eccobond 39,800 Data not 1600 Data not Obtainable Obtainable
17

The theoretical number of spores for methyl methacrylate was calcu
lated from the spore counts obtained from the inoculated powder. These
counts showed an average of 7. 0 x 104 spores per gram of powder. Forty
grams of powder were used to make each batch of plastic which repre6
sented 2. 8 x 10 spores per batch. One batch of polymerized plastic
weighed 56 grams which results in 5.0 x 10⁴ spores per gram of methyl
methacrylate.
The theoretical spore level in Eccobond was derived in approximately the
same manner. The spore counts obtained from the inoculated Eccobond
55 showed an average of 4.5 x 10⁴ per gram of material. Thirty-six grams
of Eccobond 55 were used to make each batch of epoxy giving a total of
1. 6 x 10⁶ spores per batch. The total weight of a polymerized Eccobond 4
batch was 40. 32 grams which results in 4. 0 x 10 spores per gram of epoxy.
These derived theoretical spore numbers for methyl methacrylate and Ecco
bond represent the number of viable spores that should be present in a
one -gram pellet. This assumes that no die-off occurred during the poly
merization process or during the fabrication of the pellets.
By comparing the data given in Table 1, the following calculations are made.
A visual presentation of the relationships is presented in Figure 4.
4. 1. 1 Methyl Methacrylate
1) The number of spores killed during polymerization and pellet fabri
cation are calculated by comparing the theoretical number of spores
with the spore counts obtained from dissolving one gram pellets. This
amounts to a reduction factor of 1. 5. (A reduction factor is the ratio
of one spore count to another spore count, for example 50, 200 -4- 33, 600 = 1.5).
2) The number of spores killed by the abrasiveness
by comparing the dissolved spore counts with the
by grinding the pellets and then dissolving the res
calculation gives a reduction factor of 5. 2.
of grinding is derived
spore counts obtained
ulting particles. This
3) The number of viable spores that are uncountable
because they are still encapsulated in particles is
after grinding
calculated by
18

METHYL METHACRYLATE ECCOBOND
Spore Count - Powder Spore Count - Liquid 55
50, ZOO39, 800
TheoreticalTNumbser of Polymriation Theoretical
Spores RFbrictionNumber of Spores
Spore Count Abrasiveness All Processes Dissolve RF = 5.2 R = 32.6 RF=Z4. Z
Total Grinding
6,500 RF = 21.8
Spore Count Grind/Dissolve Encapsulation
RF = 4. 2
Spore Count Spore Count Grind RF = Reduction Factor Grind
Figure 4: SUMMARY OF REDUCTION FACTORS

comparing the grinding/dissolving counts to the grinding counts.
This amounts to a reduction factor of 4. 2.
4) The number of spores that are lost due to the total grinding pro
cess is obtained from the ratio of dissolved counts to the grinding
counts. This calculation shows a reduction factor of 21. 8.
5) A total reduction in spore numbers due to all processes, i. e. ,
polymerization, pellet fabrication, abrasiveness of grinding and
viable spores which remain encapsulated-in particles, is found by
comparing the theoretical number of spores to the spore counts
obtained by grinding. This total reduction factor is 32. 6.
4.1.2 Eccobond
Since there is not a suitable solvent for Eccobond, the only method readily
available for obtaining spore counts is grinding. Therefore, only the total
spore reduction factor can be calculated by comparing the theoretical num
ber of spores with the counts obtained by grinding. This reduction factor
is 24. 2.
4.Z GRINDING ADJUSTMENT CONSTANT
The most accurate method currently available for recovering viable spores
from solids is by dissolution. Significant reductions are observed in the
number of viable spores when the grinding technique is used. Therefore,
it becomes necessary to adjust the spore counts obtained by grinding. A
grinding adjustment constant can be derived from the reduction factors.
An appropriate analysis of variance method was used to compare the total
reduction factors for methyl methacrylate (32. 6) and Eccobond (24. 2). The
results show no significant difference (F = 2. 04 with 1 and 30 degrees of freedom) between the total reduction factors. On the one hand then, assum
ing the same die-off for spores in Eccobond due to polymerization and pellet
fabrication as there is in methyl methacrylate, the adjustment constant
would be 16. However, if no die-off occurs during polymerization and
pellet fabrication in Eccobond the adjustment constant would be Z4. 2. It
appears that an average of these two figures more closely reflects the true
picture. Therefore, 20 is selected for use as the grinding adjustment constant.
20

4.3 PARTICLE SIZES FROM GROUND PELLETS
Pellets of methyl methacrylate and Eccobond were ground and sieved
into seven fractions. The particles in each fraction were dried and
weighed to determine the amount of pellet retained for each pore size.
A summary of the percent weight of the total pellet recovered for each
fraction is given in Table 2. The raw data for these summary figures
are presented in the Appendix.
Table 2: PERCENT WEIGHT OF PARTICLES RECOVERED IN EACH FRACTION AFTER GRINDING PELLETS
Wire Sieve Pore Size Filter Pore Size
Material 149 105 62 37 8 2 0.5
Methyl 67 4 5 6 19 0 0 Methacrylate
Eccobond 22 6 5 15 51 <0. I <0'. 1
A comparison of the grinding characteristics for the two naterials show
that over 60 percent of the methyl methacrylate particles are larger than
149 p and approximately 50 percent of the Eccobond particles are between
37 u and 8 ji. A cursory microscopic examination of the particles indicate
that many of the methyl methacrylate particles are long thin strands
while those of Eccobond appear to be much shorter with approximately the
same diameter. It is possible that some of the shorter Eccobond strands
washed through the larger sized sieves which could account for the wide
variance in percent retention for the two materials. Sieved particles of
the two materials have been sent to JPL for a more detailed examination by
electron microscopy.
4.4 PERCENT SPORE OUTGROWTH
One gram pellets of methyl methacrylate were ground and then sieved
into 7 fractions. Plate counts were made from each fraction to determine
the number of spores that were exposed sufficiently to allow outgrowth.
21

A second set of pellets were ground and sieved into 7 fractions. The
particles collected in each fraction were then dissolved in acetone and
counts made to determine the total number of spores that were present
in each fraction. From these data, the percent spore outgrowth for
each particle fraction was calculated, see Table 3. The data shows
that as the particle size decreases the percent of spore outgrowth in
creases with 100 percent outgrowth occurring with particle sizes between
8 ) and 2.
One gram pellets of Eccobond were also ground and sieved into 7 fractions.
Plate counts were made from the particles for each fraction to obtain the
number of exposed spores. The total number of spores actually present
in the particles for each fraction can be computed by inference from the
methyl methacrylate data. If the assumption is made that spore outgrowth
is a direct function of particle size, the total number of spores in each
fraction can be calculated from the percent outgrowth figures obtained for
methyl methacrylate as given in Table 3. However, another assumption can
be made, that is, the total number of spores contained in the particles of
each fraction is a function of the percent weight of the particles -retained
in each fraction. A summary of these computed total number of spores
in Eccobond is given in Table 4.
22

Table 3: SPORE OUTGROWTH AS A FUNCTION OF PARTICLE SIZE IN GROUND METHYL METHACRYLATE
Mean Number of Mean Number of % Spore Pore Spores Recovered Spores Recovered Outgrowth from
Size
A
from Grinding and Sieving
.
from Grinding, Sieving and Dissolving Particles
Sieved Particles
149 299 4193 7. 1
105 32 209 15.3
62 25 -137 18.2
37 58 235 24.7
8 913 1214 75.Z
2 15 9 100+
0.5 31 18 100+
Total Number 1373 6015 of Spores
23

Table 4: ESTIMATED TOTAL NUMBER OF SPORES IN GROUND ECCOBOND
Mean Number of Computed Total
Pore Spores Recovered From Grinding
Number of SporesBased on o Spore
Size and Sieving Outgrowth for )2 Eccobond- Methyl Methacrylate
149 Z38 335Z
105 135 882
62 81 445
37 182 737
8 794 1056
2 3 3
0.51 1
Total Number 1434 6476 of Spores
Computed Total Number of SporesBased on J Weight for Each Size for Eccobond
1382
377
314
942
3703
3
1
6ZZZ
24

5.0 SUMMARY AND RECOMMENDATIONS
A series of parallel studies were conducted to determine the efficiency
of a grinding technique to recover B. subtilis var. niger spores from
internally inoculated methyl methacrylate and Eccobond. Pellets of the
two materials were inoculated and fabricated to contain approximately
5 x 10⁴ spores per gram. Dissolving and grinding techniques were em
ployed to recover the spores from methyl methacrylate and reduction
factors for spore recovery were determined. The enumeration of .spores
in Eccobond was obtained by grinding only. From these data, the reduc
tion in spore recovery from grinding Eccobond was determined. An
adjustment constant of 20 was calculated for the grinding process.
The parallel studies showed that there are approximately 20 times more
viable spores present in'a one-gram pellet of Eccobond than the counts
indicate from grinding. Therefore, it is recommended that the initial
spore levels obtained for Eccobond in the previous investigation (JPL
Contract No. 952511, "Release of Microorganisms From Solids After
Simulated Hard Impact, " Test III) be increased by a factor of 20. This
increase in-initial spore levels for Eccobond will result in decreasing the
calculated percehtage of spores released after impact onto stainless steel.
These adjustments will make the Eccobond data more consistent with the
methyl methacrylate data on the percentage of microbial release from
solids.
It-is also recommended that the initial spore levels obtained for Eccobond
in Phases II and III of this investigation (JPL Contract No. 952916,
"Release of Microorganisms From Solid Materials") be increased by a
factor of 20.
25

6.0 APPENDIX
The unreduced data for Phase I are presented in Tables 5 through 10.
Z6
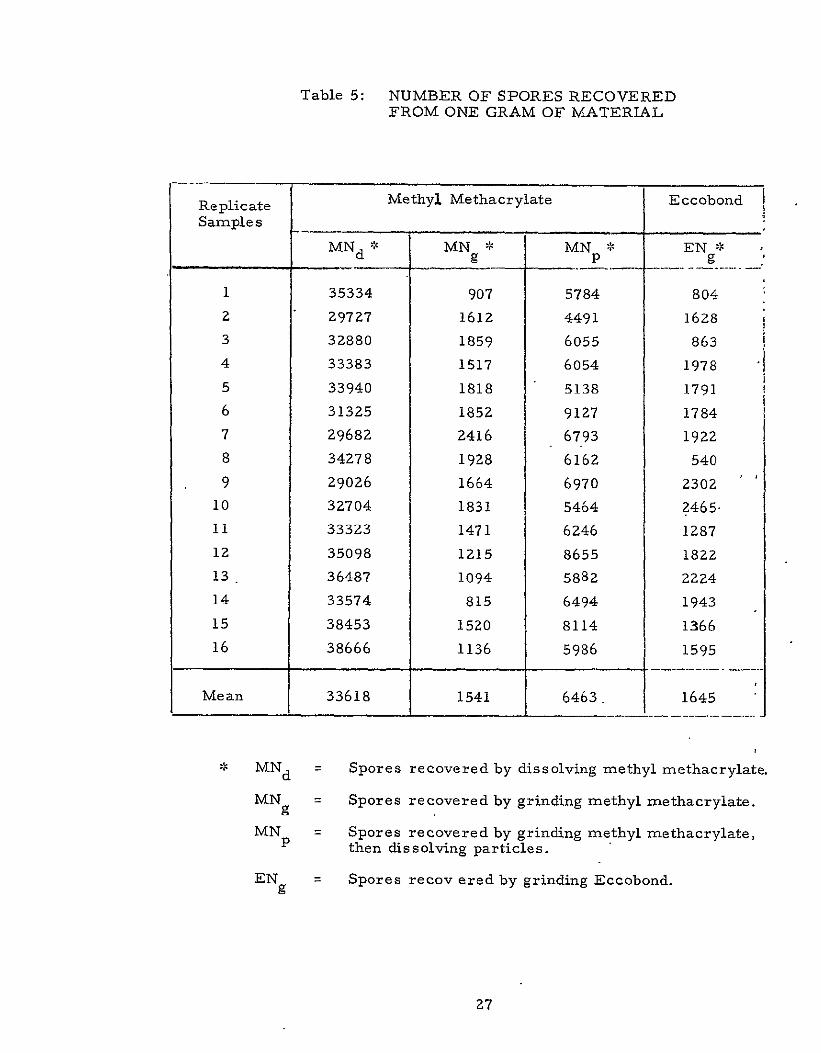
Table 5: NUMBER OF SPORES RECOVERED FROM ONE GRAM OF MATERIAL
Replicate Samples
MNdd
1 35334
z 29727
3 32880
4 33383
5 33940
6 31325
7 29682
8 34278
9 29026
10 32704
11 33323
1z 35098
13 36487
14 33574
15 38453
16 38666
Mean 33618
Methyl Methacrylate
MN* MN
907
1612
1859
1517
1818
1852
2416
1928
1664
1831
1471
1215
1094
815
1520
1136
1541
Eccobond
MN* p EN*
5784
4491
6055
6054
5138
9127
6793
6162
6970
5464
6246
8655
5882
6494
8114
5986
804
1628
863
1978
1791
1784
1922
540
2302
2465
1287
1822
2224
1943
1366
1595
6463. 1645
MN d Spores recovered by dissolving methyl methacrylate.
MNg = Spores recovered by grinding methyl methacrylate.
MNP = Spores recovered by grinding methyl methacrylate, then dissolving particles.
ENg Spores recov ered by grinding Eccobond.
27

Table 6: PERCENT WEIGHT OF PARTICLES RECOVERED FROM EACH FRACTION AFTER GRINDING AND SIEVING METHYL METHACRYLATE PELLETS
Wire Sieve Pore Size Filter Pore Size Replicate Samples
149)1 105 6 2 u 3 7)1 8 Apu 0.5 )1
1 60 4 6 8 22 0 0
2 52 5 6 10 27 0 0
3 73 3 4 5 15 0 0
4 70 3 4 6 17 0 0
5 70 4 4 5 17 0 0
6 79 Z 3 4 12 0 0
7 70 4 4 6 17 0 0
8 67 3 4 6 Z 0 0
9 64 4 6 7 19 0 0
10 69 3 5 6 18 0 0
I1 64 4 5 7 21 0 0
12 74 3 4 5 15 0 1 0
13 70 3 4 5 17 0 0
14 61 5 5 8 Z 0 0
15 64 5 5 7 19 0 0
16 61 5 6 8 Z 0 0
Mean 67 4 5 6 19 0 0
28

PERCENT WEIGHT OF PARTICLES RECOVEREDTable 7: FROM EACH FRACTION AFTER GRINDING AND
SIEVING ECCOBOND PELLETS
Replicate Samples 14 9
Wire Sieve Pore Size ,,
l 05)p 6 2 37
Filter Pore Size
8 u2) 0.5
t i
1
Z
3
4
5
6
7
8
9
10
11
12
13
14
15
16
27
ZZ
Z5
16
27
31
31
21
22
13
ZZ
23
19
Z7
18
14
13
29
13
7
2
3
2
3
2
2
2
3
3
3
3
3
5
7
6
5
6
5
5
5
5
5
5
5
6
5
5
5
10
16
16
37
17
11
Z0
23
13
12
12
10
11
11
1Z
13
45
Z5
40
36
49
49
42
48
58
68
59
60
62
54
6Z
65
0.1
0
0
0
0
0
0
0
0
0
0.,1
0.11
0 1
0
0
0
0
0
0
0
0
0
0
0
0
0
0.1
0
0
0
0
0
Mean 22 6 5 15 51 <0.I <0.1
z9

Table 8: NUMBER OF SPORES RECOVERED FROM EACH FRACTION AFTER GRINDING AND SIEVING ONE GRAM'OF METHYL METHACRYLATE
Replicate Wire Sieve Pore Size Filter Pore Size Total Samples
149 1 105 p 62 p 37 p 8 p ,2 2 0.5 p Spores
1 221 36 15 53 615 9 15 964
2 266 15 17 11 988 24 14 1335
3 308 13 19 71 972 38 33 1454
4 327 56 21 86 984 4 63 1541
5 400 53 47 90 1056 13 58 1717
6 356 45 28 99 732 14 24 1 1298
7 239 26 28 19 969 11 22 1314
8 291 17 13 68 973 31 .35 1428
9 384 40 34 76 998 15 49 1596
10 316 38 25 49 763 14 19 1224
11 211 45, 28 47 893 4 29 1257
12 284 19 32 70 1024 2 27 1458
13 291 43 21 68 730 3 21 1177
14 356 40 28 72 1541 24 56 Z117
15 329 21 132 47 Ii
730 21 4'
12 i192
16 203 11 13 2 646 9 : 18 1 902
Mean Z99 32 Z5 58 913 15 31 1373
30

Table 9: NUMBER OF SPORES RECOVERED FROM EACH FRACTION AFTER GRINDING, SIEVING AND DISSOLVING THE PARTICLES FROM ONE GRAM OF METHYL METHACRYLATE
Wire Sieve Pore Size Filter Pore Size Replicate Total Samples Spores
149u 105, 62 37u 8 ) 2 p 0.51
1 3896 214 90 141 723 1 3 5068
2 3086 173 99 106 282 2 1 3749
3 5403 289 150 182 1658 19 24 7725
4 4054 242 125 203 891 6 32 5553
5 3615 238 168 324 1655 10 16 6026
6 4125 204 222 321 1538 13 20 I 6443
7 2439 180 113 127 673 5 10 3547
8 3700 188 109 127 584 4 17 4729
9 3845 216 124 152 819 10 15 i 5181
10 4300 234 156 322 1370 14 18 6414
11 3275 241 159 199 1433 6 10 5323
12 4763 184 124 347 1396 4 27 6845
13 5430 223 117 234 2033 20 32 8089
14 4891 268 180 516 2385 15 43 I 8298
15 5384 74 120 213 9411 5 12 1 6749
16 4879 182 139 Z43 1035 11 14 6503
Mean 4193 209 137 I 235 1214 9 18 60f5
31

Table 10: NUMBER OF SPORES RECOVERED FROM EACH AND SIEVINGFRACTION AFTER GRINDING
ONE GRAM OF ECCOBOND
Pore Size Filter Pore Size TotalReplicate Wire Sieve SporesSamples
62. 37pu 82 2. 0.5).149 u l05x
50 91 1140 13 1 17731 364 114
Z 502 205 50 66 1028 6 4 1861
2 1398147 6103 158 263 214 4
56 17 541 1 0 8754 187 73
739 0 1 12345 135 97 104 158
45 50 67 396 2 1 7666 205
1 15447 215 104 83 351 789 1
8 256 153 87 193 633 2 0 1324
0 11269 63 237 19 177 629 1
3 0 137910 344 206 42 127 657
11 184 59 104 354 1484 1 1 2187
12 198 123 146 223 1021 1 0 1712
1 148313 362 160 48 156 754 2
81 200 790 3 0 140414 198 132
3 1 137115 237 133 119 217 661
16 201 59 116 293 839 2 1 1511
3 1 1434135 182Mean 238 81 794
32

rj)C, 04
Ea 2
P
SECTION III
PHASE II
IMPACTION OF INOCULATED
ECCOBOND ONTO SAND
33

TABLE OF CONTENTS
Page
1.0 PURPOSE 35
2.0 INTRODUCTION 35
3.0 PROCEDURES 35
3. 1 Pellet Manufacture 35
3.2 Pellet Launchings 37
3.3 Pellet Analysis 39
3.4 Data Recording and Analysis 44
4.0. RESULTS AND DISCUSSION 44
4. 1 Percent Pellet Recovered After -44 Impact and Fracture Characteristics
4. 2 Spores Released from the Interior 45 of Impacted Pellets
4.3 Test Controls 50
4.4 Statistical Analysis 50
5.0 SUMMARY 50
6. 0 REVISED HARD IMPACT DATA 51
.7.0 APPENDIX 54
34

PHASE II
IMPACTION OF INOCULATED ECCOBOND ONTO SAND
1.0 PURPOSE
This investigation was conducted to determine the percentage release
of microorganisms embedded in pellets that were impacted onto sand.
2.0 INTRODUCTION
Eccobond pellets were fabricated so that each pellet interior contained
approximately 104 Bacillus subtilis var. niger spores. A series of these pellets were propelled from a gun at 168, 457, 945 and 1554
meters per second into sand. After sand impact, the pellet fragments
were analyzed to determine the number of exposed viable microorganisms.
The test program is presented in Table 1.
3.0 PROCEDURES
3. 1 PELLET MANUFACTURE
3. 1. 1 Preparation of Spore Stock
A 0. 1 ml aqueous suspension containing 108 B. subtilis spores was placed
in the bottom of sterile planchets. The stock spore suspension was a mini
mum of 6 months old. The planchets were dried overnight by airflow from
a Class 100 blean bench. When all the water had evaporated, 10 planchets
were placed in a bottle containing 30 ml ethanol and insonated for 20 minutes.
The level of the ultrasonic bath water was adjusted so that it was half
way up the side of the bottle. After insonation, the 30 ml spore-ethyl
alcohol suspension was pipetted into a sterile, capped bottle. All planchets
were rinsed in fresh ethyl alcohol and the washings plus additional alcohol
were combined with the 30 ml stock to total 100 ml. The stock inoculurn
was refrigerated until used. A plate count of the spore stock was per
formed 1, 3, and 7 days after preparation to accurately determine the
number of spores per ml.
3. 1. 2 Epoxy Fabrication
Thirty-six grams of Eccobond 55 were placed in a glass beaker and 4. 32
35

Table 1: PHASE II - ECCOBOND PELLETS IMPACTED
ONTO SAND
Pellet Launching Velocity,
Meters/Second
Percent, by Weight, Pellet Recovered
After Impact
(sterile pellets)
Total Spores Released from Impacted Pellet
(104 spores/pellet)
Procedural Controls
(sterile pellets)
01
168
457
6
6
(a) 6
6
1
1
945
1554
6
6
6
6
1
1
24 24 4
(a) Number of Replicate Pellets
52 Total Pellets Fired

grams of Catalyst 9 added. A 6 x 10⁶ spore inoculum in 0. 2 ml of
alcohol waa added and the mixture thoroughly stirred. The glass beaker
containing the liquid Eccobond was placed in a desiccator jar and the
pressure reduced to 127 mm of mercury for 10 minutes. The mixture
was removed from the jar and poured into 13 x 100 mm teflon tubes. The
tubes were cured in a 50 C oven for 3 hours.
After curing, the tubes were removed from the oven, allowed to cool at
room temperature for 10 minutes, and the Eccobond removed. The Ecco
bond rods were stored in a glass jar, labelled with information as to date
of seeding, fabrication, batch number, and the number of spores per gram
of epoxy.
3. 1. 3 Pellet Machining
A seeded Eccobond rod was machined into firing pellets by turning the rod
on a small bench lathe. Each finished pellet was approximately 0. 81 cm
in diameter, 1. 63 cm long, and weighed approximately 1. 0 gram. The
machining sequence was to cut all rods of the same epoxy batch to the
established diameter. Face cuts were then made to finish the pellets to
the correct length.
3. 1.4 Pellet Surface Sterilization
After machining, each pellet was identified by a number, weighed to the
nearest one-thousandth of a gram and this information recorded. Each
pellet was surface sterilized in a freshly prepared 2000 ppm chlorine solu
tion for 10 minutes. This was followed by a 10 minute soak in a fresh
filter-sterilized 2% solution of sodium thiosulfate. Each pellet was stored
in a sterile, appropriately labelled, screw-capped test tube until launched.
PELLET LAUNCHINGS
3. 2. 1 Collection Canister
The sterile collection'canister (Figure 1) was constructed such that an
impacting pellet struck only sand. In order to facilitate recovery of the
projectile particles and impacted sand, the impact area was isolated from
37
3.2

I
Pellet
I Funnel
I Baffle
I
- * c..........
*t6, * *~~ * ~ .*
Fige 1: CI3
c~.*,96
. .6.......,....,.... ...:. ..!, 94c c. *6" .'., . .- .6. " .
.6,•, *• * *
* 9''. 4 6 cc.-.. c.... ,. .
.aSand
.,.. *Rubber
S
Condomn
Figure 1 : COLLECTION CANISTER FOR SAND IMPACT
38

the rest of the supporting sand by a rubber condom. With this apparatus,
it was possible to work with a relatively small quantity 9f sand (less than
200 grams) without changing the impact characteristics of the sand. A
baffle was also incorporated in the collection device to aid in retaining
the sand at impact.
3. 2. 2 Pellet Firings
The pellets were fired by personnel of the Damage Mechanics Laboratory.
In order to assure reliability in the firings, one person was responsible
for all launchings. The gun barrel was positioned so that impact occurred
vertically into the sand in an upright canister (Figure 2). The gun was
cleaned before each day's firing by first flushing the barrel and chamber
with air followed by an ethanol scrub. The sterile collection canister con
taining the sand was placed in the gun chamber in the support sand. The
pellet was loaded in the breech using sterile forceps. The cover of the
canister was removed, the chamber door closed, and the pellet launched.
After firing, the chamber door was opened, the canister cover replaced,
the velocity recorded, and the canister returned to the Microbiology Lab
oratory for analysis.
The Eccobond pellets were fired at velocities of 168 (+ 30), 457 (+ 60),
945 (+ 90), and 1554 (+ 90) m/sec. Compressed air was employed to attain
168 m/sec, and a powder charge was used to launch pellets at the higher
velocities. Velocities were measured using breakscreen techniques.
3.3 PELLET ANALYSIS
3.3. 1 Percent Pellet Recovery After Iinpact
Six unseeded Edcobond pellets were launched at each test velocity and
impacted on sand. Each pellet was weighed, fired and collected in a
separate canister. All particles of the impacted pellet were then weighed
again. The procedures used to recover the particles were identical to
those that were employed in the analysis for released spores from seeded
pellets after impact. The results of these firings established the percent
of pellet recovered. The particles of each impacted pellet were saved
for delivery to JPL.
39

a
Bolt
Breech
Pellet
30. 06 Smooth Bore
* Blast Tank
-_. -Breakscreen
Target Tank
Impact Canister
Sand
Figure 2: GAS AND POWDER GUN
40

3.3.2 Analysis for Spores Released After Pellet Impact
The collection canister, containing the impacted pellet, was analyzed
in the Microbiology Laboratory. Analysis for the recovery of released
spores was performed as outlined in Figure 3. The rubber condom con
taining the plastic particles.and the impacted sand was removed from the
canister. Large projectile particles were recovered by sifting the sand
through a sterile screen mounted over a sterile beaker. The trapped
pellet particles were transferred, with sterile forceps, to a sterile petri
plate. Trypticase Soy Agar (TSA) was then poured into the plate so that
each particle was completely covered with the medium. The sifted sand
was poured into plates of molten TSA and gently swirled to insure even
particle distribution. The sand and particles were incubated in TSA for
2 weeks at 30 0 C. Daily examinations were performed and each colony
observed was recorded as one released spore.
3.3. 3 Analysis for Total Spore Level
On each day of firing two pellets were chosen at random to determine the
total spore level. A pellet was placed in a modified Waring blender
(Figure 4), and wet ground. The contents of the blender were plated in
molten TSA and incubated for 2 weeks at 30 C. The number of spores
recovered by this procedure was multiplied by 20 to account for the spore
reduction which occurs by grinding as discussed in Section II of this report.
This procedure established the number of spores present per gram of pellet.
3.3.4 Procedural Controls
On each test day, an unseeded control pellet was launched prior to the
firing of seeded pellets. The control pellet particles were subjected to
analysis as outlined in Figure 3. This control pellet established the reli
-ability of the test data with respect to possible contamination due to pro
cedural techniques.
Also, on each test day, a seeded pellet was selected at random and embedded
in melted TSA. The plate was incubated at 300C and examined periodically
for 2 weeks. The absence of surface colonies established reliability in
the method used to sterilize the pellet surface.
41
PELLET FABRICATION
Pellet FiringI 168, 457, 945 and 1554 Meters/Second
Sand Impact
Analysis for Total Spore Analysis for Spores Released Level After Impact
Wet grind pellet in modified 1. Rubber condom removed. Waring blender.
2. Particles removed from sand by2. Plate aliquots of ground sifting through a sterile screen.
Eccobond in TSA. 3. Particles, sand, and membrane
3. Incubation for 2 weeks at 30°C. plated separately in TSA.
4. Plate count at 72 hours and 4. Incubation for 2 weeks at 300C. 2 weeks.
5. Daily examination.
Figure 3: TEST ANALYSIS

Plunger
O-Ring Seal
Hollow Tube
Grinding Disc
Figure 4: MODIFIED WARING BLENDER
43

3.4 DATA RECORDING AND ANALYSIS
The data was recorded on data sheets that contained the date of pellet
firing, pellet number and weight, the velocity of impact, the analysis
performed and the results of the analysis. The data sheet for each
test day was checked and initialed by the program manager.
These data provided information on: (1) the number of viable organisms
released from solids after hard impact; (Z) differences in release of
organisms due to variations in impact velocities.
The data were evaluated statistically using analysis of variance techniques.
These analyses detected any significant variance between pellets in a
replicate group and between pellets impacted at 168, 457, 945 and 1554
m/sec.
4.0 RESULTS AND DISCUSSION
4.1 PERCENT PELLET RECOVERED AFTER IMPACT AND FRACTURE CHARACTERISTICS
The percentage of epoxy recovered from the sand after pellet impaction
at the four test velocities is presented in Table Z. The unreduced data
is given in the Appendix.
Table Z:' PERCENT RECOVERY OF PELLET FOLLOWING IMPACT
Velocity Mean Percent Recovery m/sec of Pellet (a)
168 100
457 92
945 73 (b)
1554 69 (b)
(a) Mean of 6 Pellets
(b) Many small "sand-grain" size pellet particles passed through the recovery sieve with the sand.
44

A majority of the pellets launched at 168 m/sec did not fracture upon
impact in the sand. However, areas of sand abrasion were observed
on these intact pellets. The higher velocities, 457, 945 and 1554 m/sec,
resulted in completely fractured pellets. As the impact velocity increased,
the number of pellets particles increased and the size of the pieces de
creased.
In fact, fractured pellet pieces the size of sand grains accounted for
approximately 30%, by weight, of a pellet impacted at 945 and 1554 m/sec.
Figures 5 through 8 show a comparison of a pellet impacted at each of the
four velocities.
4.2 SPORES RELEASED FROM THE INTERIOR OF IMPACTED PELLETS
The percentage of spores released from the interior of the pellets after
sand impact are presented in Table 3. The unreduced data is given in the Appendix.
Table 3: SPORES RELEASED FROM THE INTERIOR OF INTERNALLY CONTAMINATED PELLETS AFTER IMPACTION
Velocity Mean Percent Spores Released (a)
m/sec (104 Spores Available for Release) (b)
168 0.01
457 0.29
945 0.23
1554 0. 34
(a) Mean of 6 Pellets
(b) Adjusted Spore Level
45

FigureS5: IMPAc7rAT168 M/SEc NOT REPRODUCIBLE

0 0
0
d
4~.-J
IMPACTAT457M/SECFigure6: REPRODUCIBLENOT

00
NOT REPRODUCIBLE Figure 7: IMPACT AT 945M/SEC

INOT REPRODUCIBLE FigureS8: IMPACT ATI1,554 M/SEC

It was noted that, at the four test velocities, less than 1 percent of
the available number of spores in the pellet were released.
4. 3 TEST CONTROLS
No background contamination due to fabrication and handling of the
material, or due to the recovery and analytical procedures was observed.
In addition, the surface sterilization method was found to be effective
for eliminating all viable external spores from the pellets.
4.4 STATISTICAL ANALYSIS
An applicable analysis of variance technique was employed to assess the
data obtained on spore release. The results show a highly significant
difference (F = 10. 59 with 3 and 20 degrees of freedom) in the percentage
of spores released at the four velocities. The differences were examined
at the 1% level.
5.0 SUMMARY
This test was conducted to determine the number of microorganisms
released from the interior of Eccobond pellets impacted onto sand. The
pellets were fabricated so that each pellet interior contained approximately
1 x 10⁴ B. subtilis var. niger spores. A series of pellets were propelled
from a gun at 168, 457, 945 and 1554 m/sec. Impact occurred in sand
which was contained in a collection canister. After impact, the pellet fragments and sand were analyzed to determine the number of viable spores
released.
An analysis of variance of the percentage of spores released upon impact
showed a significant difference between the four test velocities. However,
less than 1 percent of the available organisms in the pellets was released
upon impact at all test velocities.
50

6.0 REVISED HARD IMPACT DATA
A summary of the data from all hard impact studies conducted during
the past three years are presented in this section. The microbial
release data obtained during this Phase II study provided the additional
information to supplement the hard impact release studies conducted
previously. The grinding constant determined during Phase I has been
applied to adjust the Eccobond data. Table 4 presents the revised data
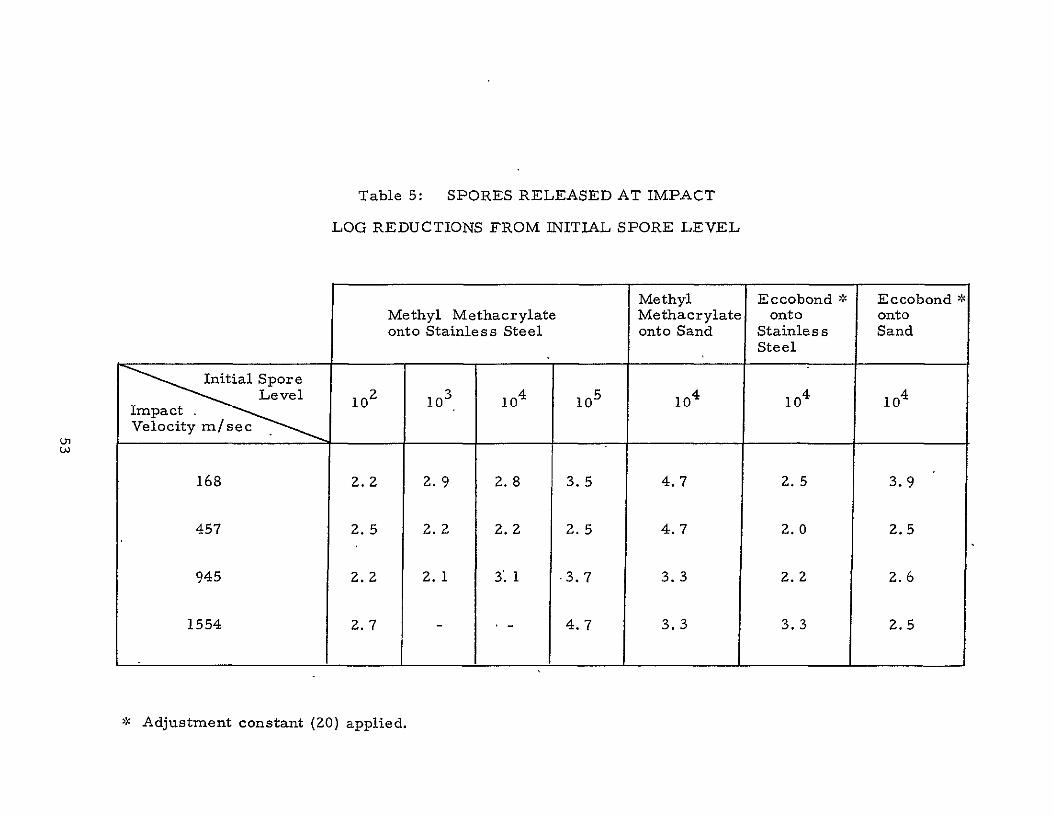
for the percent of microbial spores released upon impact. The log re
ductions in population from the initial spore levels after hard impact are
given in Table 5.
As these summary data show, in no case were more than 1% of the total
available spores released upon impact. Also, the log reductions from
the initial spore levels were Z or greater for all test conditions.
51

Table 4: PERCENT SPORES RELEASED AT IMPACT
Methyl Eccobond - Eccobond * Methyl Methacrylate Methacylate onto onto Onto Stainless Steel,
onto Sand Stainle ss Sand Steel
Initial Spore
Impact Level 10z 103 10 10 10 10 10 Velocity rn/sec
168 o.6 0.1 0.2 0.03 0.001 0.31 0.01
457 0.4 o.6 0.6 0.3 0.001 0.98 0.29
945 0.6 0.8 0.1 0.02 O.06 0.64 O.Z3
1554 O. Z - 0.00Z 0.06 0.06
Adjustment constant"(ZO) applied.
0.34
4
168
457
945
1554
Table 5: SPORES RELEASED AT IMPACT
LOG REDUCTIONS FROM INITIAL SPORE LEVEL
Methyl Methyl Methacrylate Methacrylate onto Stainless Steel onto Sand
2z el 104 104imp0ct 10 3 105
2.2 Z.9 2.8 3.5 4.7
2.5 2.2 2.2 2.5 4.7
2.2 Z.1 3'.1 3.7 3.3
2.7 - 4.7 3.3
Eccobond * Eccobond onto onto
Stainless Sand Steel
104 104
2.5 3.9
2.0 2.5
2.2 2.6
3.3 2.5
-X Adjustment constant (Z0) applied.

7.0 APPENDIX
The unreduced data for this investigation are given in Tables 6, 7, and
8.
54

Table 6: PERCENT PELLET RECOVERY OF ECCOBOND PELLETS FOLLOWING IMPACT ONTO SAND
Velocity Pellet m/sec Number
149 A-3 171 A-5 178 A-6 181 A-8 180 A-9 180 A-10
509 B-1Z 480 B-13 511 B-14 421 B-15 483 B-16 468 B-17
914 B-18 927 B-19 881 B-Z0 939 B-21 911 B-22 913 B-24
1606 B-25 1579 B-28 1591 C-37 1542 C-38 1582 C-39 1490 C-40
Pellet Weight Prior to Launch,
ramsGrams
0.962 0.961 0.964 0.961 0. 964 0. 961
0. 959' 0.962 0.957 0.962 0.963 0.963
0.961 0.964 0.962 0.956 0.958 0.957
0.962 0.959 0.958 0.959 0. 957 0.960
Recovered Percent, By Pellet Weight Weight, Pellet After Impact, Recovered
0.962 100. 0 0.961 100.10 0.942 97.7 0.957 99.6 0. 965 100. 1 0.96Z 100. 1
0.968 100.9 0.753 78.3 0.840 87.8 0.964 100.z 0.863 89.6 0.913 94.8
0.303 31. 5 0.8Z6 85.7 0.628 65.3 0.757 79.2 0.781 81. 5 0.880 92.0
0.449 46.7 0.660 68.8 0.775 80.9 0.618 64.4 0.758 79.2 0.734 76.5
55

Table 7: , TOTAL SPORE LEVEL OF ECCOBOND PELLETS
Pellet Spore Total Spore Adjusted Total Pellet Weight, Spore Count/ Level/Gram Spore Level/ Number Grams Count Gram Pellet (a) Gram Pellet
Pellet (b)
I-22 0. 925 1450 1568 1445 28, 900
1-23 0.878 1160 1321
11-46 0. 959 2393 2495 2202 44, 040
11-47 0. 950 1813 1908
111-70 0. 959 986 1028 1105 22, 100
111-71 0.958 1131 1181
(a) Mean for that plastic batch.
(b) Spore level increased by 20 times.
56

Table 8: SPORES RELEASED FROM INOCULATED ECCOBOND AFTER IMPACT ONTO SAND
Velocity Pellet Pellet m/sec Number Weight,
Grams
183 I-i 0.958 146 I-2 0.960 177 1-4 0. 956 182 1-5 0. 957 166 1-6 0.953 176 1-7 0.960
495 1-8 0.950 434 1-9 0.956 466 1-10 0.952 494 I-l1 0. 955 451 1-12 0.959 469 1-13 1 0.959
884 II-Z4 0. 960 860 II-Z5 0.958 924 ii-z6 0.958 881 II-Z8 0.959 838 II-Z9 0.957 960 11-31 0.958
1579 11-33 0. 958 1533 11-38 0.954 1494 11-41 0.954 1554 111-53 0. 963 1554 111-54 0.963 1544 111-55 0.964
Adjusted Initial Spore Level/G Pellet Before
Impact
28,900 28,900 Z8,900 28,900 Z8,900 Z8,900
28, 900 28,900 28,900 28,900 28,900 Z8,900
44, 040 44,040 44,040 44,040 44,040 44,040
44,040 44,040 44,040 ZZ, 100 22,100 22,100
Number Spores Released Upon Impact
6 1 5 5 0 5
24 70 152 81 120 40
1Z7 195 75 53 54 87
121 167 135 78 69 74
Number
Spores/G Pellet %Spores Released Released Upon Impact
6.3 0. 02 1.0 0. 003 5. z 0.0Z 5.2 0. 02 0 0 5.2 0. 0Z
25 0.09 73 0. Z5 160 I 0.55
85 0.-Z9 125 0.43 42 0.15
132 0.30 204 0.46 78 0.18 55 0. 12 56 0. 13 91 0.21
IZ6 0.29 175 0.40 14Z 0.32
81 0.37 72 0.33 77 0.35
57

0tI2rn

SECTION IV
PHASE III
EROSION OF INO CULATE D
METHYL METHACRYLATE AND ECCOBOND
BY SAND BLASTING
58

TABLE OF CONTENTS
Page
1.0 PURPOSE 60
2.0 INTRODUCTION 60
3.0 PROCEDURE 60
3. 1 Disc Manufacture 60
3.2 Sand Blasting Apparatus 64
3.3 Erosion Tests 64
3.4 Spore Recovery Analysis 67
3.5 Enumeration of Spores in Discs 67
3.6 Procedural Controls 70
3.7 Temperature and Humidity Measurements 70
4.0 RESULTS AND DISCUSSION 71
4. 1 Erosion Rates 71
4.2 Spores Released by Erosion 71
4.3 Spores Remaining in Eroded Discs 74
4.4 Procedural Controls 74
4.5 Temperature and Humidity 74
5.0 SUMMARY 76
6.0 APPENDIX 77
59

PHASE III
EROSION OF INOCULATED METHYL METHACRYLATE AND ECCOBOND BY SAND BLASTING
1.0 PURPOSE
This study was conducted to determine the effect of the erosive action of
sand on the release of bacterial spores from methyl methacrylate and
Eccobond.
2.0 INTRODUCTION
Methyl methacrylate and Eccobond have been impacted at various velocities
onto stainless steel and sand. The results from these studies show that
viable spores remain in the fractured material. Even though all of these
spores were not released by impact they are still available for release by
erosion. Therefore, this program was initiated to study the effect of
aeolian erosion on the release of encapsulated microorganisms.
3.0 PROCEDURE
Methyl methacrylate and Eccobond discs were fabricated so that each disc
contained approximately 4 x 10 4 Bacillus subtilis var. nige spores. 'A
disc was placed in a specially designed sand blasting device which utilized
the Venturi principle to accelerate sand which was directed towards the
disc. Tests were conducted using both filtered air and carbon dioxide to
accelerate the sand. The carbon dioxide tests were conducted to determine
if the carrier gas had an effect on microbial survival and to more closely
approximate Martian atmospheric conditions. Three exposure times of
0. 5, 2 and Z4 hours were used for the air tests. One exposure time of 0. 5
hours was used for carbon dioxide. After sand blasting, the remaining
disc, sand, dust and filter were analyzed for viable spores that had been
released by erosion. The erosion tests are outlined in Table 1.
3.1 DISC MANUFACTURE
3. 1. 1 Preparation of Spore Stock
A 0. 1 ml aqueous suspension containing 1 x 10⁸ B. subtilis spores was
placed in the bottom of sterile planchets. The stock spore suspension was
60

Table 1: PHASE III - EROSION TESTS
1 Methyl Methacrylate Eccobond
Environment Exposure Released Count Released Count nT e after Erosion Procedural after Erosion ProceduralTime 10, 000 spores/ Controls 10, 000 spores/ Controls
gm (unseeded) gm (unseeded)
Air 30 min. 6' 1 6 1
120 min. 6 1 6 1
24 hr. 6 1 6 1
co 2 30 min. 6 1 6 1
Total 24 4 Z4 4
Total: 56 Discs
irNumber of Replicate Discs

a minimum of 6 months old. The planchets were dried overnight by
airflow from a Class 100 clean bench. When all the water had evaporated,
10 planchets were placed in a bottle containing 30 ml of ethanol and inso
nated for 20 minutes. The level of the bath water was adjusted so that it
was halfway up the side of the bottle. After insonation, the 30 ml spore
ethyl alcohol suspension was pipetted into a sterile, capped bottle. All
planchets were rinsed in fresh ethanol and the washings plus additional
ethanol were combined with the 30 ml stock to bring the total to 100 ml. The
stock inoculum was refrigerated until used. A plate cont of the spore stock
was performed 1, 3 and 7 days after preparation to accurately determine the
number of spores per ml.
3. 1. Z Inoculation of Methyl Methacrylate Powder
One hundred grams of methyl methacrylate powder were placed in a sterile
150 mm petri plate. The desired number of spores plus enough ethyl
alcohol to bring the volume to a total 100 ml was throughly mixed with the
powder. The wet seeded powder was air dried in a Class 100 clean bench
overnight. The dried seeded powder was sifted through a 40 mesh screen
and stored in a glass beaker. All seeded powder was used within one week
of preparation.
3. 1. 3 Removal of Preservative From Liquid Methyl Methacrylate
One hundred ml of liquid methyl methacrylate were placed in a 250 ml
separatory funnel. A 100 ml freshly prepared 2% solution of sodium hydrox
ide was then added. The mixture was gently swirled for one minute and
allowed to separate into two fractions. The bottom pink fraction containing
the preservative was discarded. Another 100 ml of 2% sodium hydroxide
was added, and the washing process repeated until no pink color was ob
served in the bottom layer. When the bottom layer was clear, one addi
tional washing with 100 ml sodium hydroxide was performed. The washed
liquid methyl methacrylate was rinsed with separate 100 ml volumes of
distilled water to remove all traces of sodium hydroxide. The number of
rinses was one more than the sodium hydroxide. All water (bottom layer)
was drained from the funnel. The washed liquid methyl methacrylate was
used within 24 hours of preparation.
62
3. 1.4 Polymerization of Methyl Methacrylate
Forty ml of washed liquid methyl methacrylate were added to 40 gm of
seeded powder in a glass beaker and mixed until a uniform slurry was
obtained. The mixture was poured into glass test tubes (13 x 100 mm)
so that they were 2/3 full. As each tube was filled, the beaker was
swirled to assure a homogeneous mixture. When all tubes were filled,
they were immediately placed in a desiccator jar and the pressure reduced
to 127 mm of mercury for 10 minutes. This vacuum is sufficient to create
a slow bubbling action of the mixture in the tubes, but not so low as to cause
the mixture to "climb" out the-tube as the air is removed by the vacuum.
The tubes were then transferred for curing to a 50 0 C water bath and heated
for 1. 5 hours. The water level of the bath was adjusted so that it was
slightly above the plastic level in the tubes. After 1. 5 hours the tubes were
removed from the bath and allowed to cool at room temperature for 10
minutes. The fabricated plastic rods were removed by breaking the glass
tube. The rods were then stored in a glass jar in the freezer (-18°C) until they'were machined into pellets.
3. 1.5 Inoculation and Polymerization of Eccobond
Thirty-six grams of Eccobond 55 were placed in a glass beaker and 4. 32
grams of Catalyst 9 added. The required number of spores in 0. 2 ml of
alcohol were added and the mixture thoroughly stirred. The glass beaker
containing the liquid Eccobond was placed in a desiccator jar and the pres
sure reduced to 127 mm of mercury for 10 minutes. The mixture was then
removed from the jar and poured into 13 x 100 mm Teflon tubes. The tubes
were cured in a 500C oven for 3 hours.
After 3 hours, the tubes were removed from the oven, allowed to cool at
room temperature for 10 minutes, and the Eccobond removed from the
tubes. The Eccobond rods were stored in a glass jar in the freezer (-18 0 C)
until machining.
3. 1.6 Disc Fabrication
Seeded methyl methacrylate and Eccobond rods were machined into discs
by turning the rods on a lathe. The machinirng sequence was to cut all
rods from one batch of plastic to an established diameter. Face cuts were
63

then made to finish the discs to the correct length. Each finished disc
was 1. 27 cm in diameter, 0.71 cm long and weighed approximately 1 gm.
3. 1. 7 Disc Surface Sterilization
After machining, each disc was numbered, weighed to the neare'st one
thousandth of a gram and this information recorded. The discs were sur
face sterilized in a freshly prepared 2000 ppm chlorine solution for 10
minutes. This was followed by a 10 minute soak in a fresh filter-sterilized
2% solution of sodium thiosulfate. Then, the discs were exposed to the air
flow of a Class 100 clean bench for 15 minutes to evaporate any moisture
on the surface. Each disc was stored in a freezer in a sterile, appropriately
labelled, screw-capped test tube until used.
3.2 SAND BLASTING APPARATUS
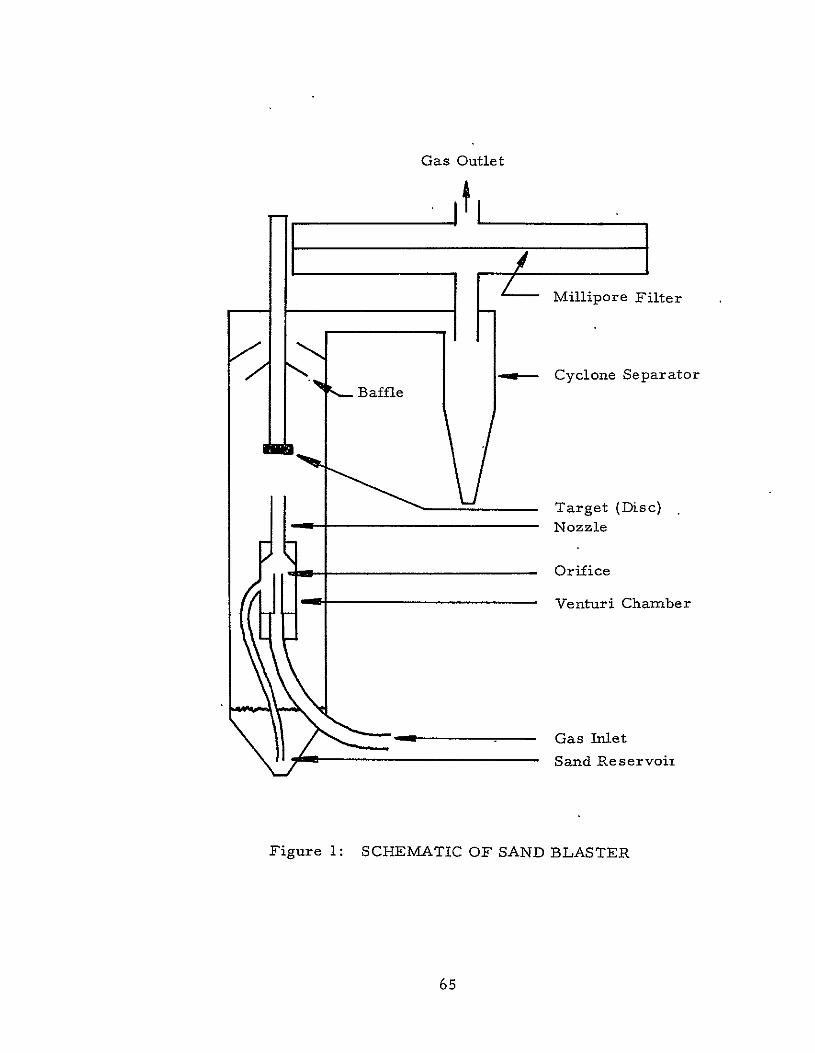
The simulation of aeolian erosion was accomplished by utilizing the Venturi
principle in a specially designed sand blasting device (Figure 1). A con
trolled flow of filtered air or carbon dioxide was metered (Rotameter,
Brooks, Instrument Co.) into the apparatus. The pressure differential
created by the Venturi arrangement picked sand up from the reservoir and the gas flow through the nozzle accelerated the sand which was directed
towards the target. - The design of the apparatus allowed the sand to drop
back down into the reservoir for recirculation. Any dust that was formed
was carried with the gas flow and trapped in the cyclone separator. Very
fine dust particles not trapped in the separator were carried out and trapped
on a 0. 45 u membrane filter.
3.3 EROSION TESTS
The sand blasting apparatus was sterilized in a hot air oven at 150 0 C for
24 hours. Eighty grams of sterilized sand (washed and ignited sand, J. T.
Baker Co. ) were placed in the sand reservoir. A disc was attached to the
target holder with sterile double-backed tape and a sterile filter was placed
in the filter holder. The apparatus was then assembled and connected to
either the air or carbon dioxide supply and the proper flow adjustments
made with the rotameter. Figure 2 is a photograph of the test set-up. The
rate of erosion was varied for each of the four test conditions (i. e. , air
tests of 0.5, Z and 24 hours and a CO 2 test of 0.5 hours) so as to erode
64
Gas Outlet
Millipore Filter
" BalBaffle w- Cyclone Separator
Target (Disc)
Nozzle
Orifice
Venturi Chamber
Gas Inlet
Sand Reservoir
Figure 1: SCHEMATIC OF SAND BLASTER
65

,~at, 'F,
SAND RESERVOIR
q SEARTO ANPNOZZLE
Figure 2: SANDBLASTING APPARATUS NOT REPRODUCIBLE
0. 25 + 0.05 grams from each test disc. The amount of erosion was
determined by weighing each disc before and after sand blasting. The
assembly and disassembly of the apparatus was performed in a Class 100
clean bench.
3.4 SPORE RECOVERY ANALYSIS
After sand blasting, the apparatus was disassembled for analysis of the
contents, Figure 3. The remaining sand in the reservoir was removed and
distributed into petri dishes and covered with Trypticase Soy Agar (TSA).
The dust that had collected in the cyclone separator was removed and also
distributed into petri dishes and mixed with TSA. The 0. 4 5 u filter was
removed from the holder and overlayed with TSA in a petri dish. The.
apparatus was then rinsed twice with 500 ml aliquots of sterile distilled
water which was filtered through several membranes. These filters were
then placed on TSA in a petri dish. After rinsing, the disc was removed
and weighed. For the 6 replicate discs eroded for each test condition, 3
of these discs were placed in petri dishes and overlayed with TSA. The
other 3 discs were assayed to obtain the number of viable spores remaining
in each disc. These assay procedures are given in the following paragraph.
All of the agar plates were incubated for 2 weeks at 30 0 C. Each colony
counted on the plates was recorded as one spore released from the disc.
3. 5 ENUMERATION OF SPORES IN DISCS
Acetone was used as the solvent for dissolving methyl methacrylate. Four
hundred ml of acetone were used to dissolve 1 gram of methyl methacrylate.
The acetone and methyl methacrylate were contained in a one liter, screw
capped bottle and placed on a refrigerated reciprocal shaker maintained at
100C. Approximately 24 hours were required for complete dissolution.
After dissolution, one ml aliquots were removed from the bottle and filtered
through .0. 5 p membranes. Each filter was placed on TSA and incubated for
72 hours at 30°C.
A Waring blender was modified for grinding Eccobond discs, Figure 4.
The cutting blades were replaced with a flat metal surface to firmly hold an
aluminum oxide paper disc (Rub Wet, 240 grit, Armour Star Co.). The
67

t
Contents
BlaterRinse
Sand Blasting Apparatus
1,000 ml
Water4
Filter Through
0.4511 MembranesM
Filter
TTSA
Sand
Z
Dust
TA Incubate 2 Weeks at 30*C
----- TSA
Disc
0 Filter Figure 3: RELEASED SPORE ANALYSIS

Plunger
O-Ring Seal
Hollow Tube
Grinding Disc
Figure 4: MODIFIED WARING BLENDER
69
cover of the blender jar was modified by drilling a hole through it and
inserting a tube down through the blender jar so as to just clear the top
of the abrasive disc. A second tube, fitted with a Teflon plug, was used
as a push rod to hold a disc firmly against the abrasive paper.
Following assembly of the blender, 150 ml of sterile distilled were added
to it, the blender placed on the motor and activated for I minute. A 5 ml
aliquot of water was then removed and plated in TSA to serve as a sterility
control.
After removing the push rod, a disc was dropped into the tube and the push
rod reinserted. The blender was placed on the motor, the motor activated
and a slight pressure was exerted on the push rod to hold the disc against the
grinding disc. Approximately 10 seconds were required to grind a disc. Ten
ml aliquots of the suspension were plated in TSA and incubated for 72 hours
at 300C.
3.6 PROCEDURAL CONTROLS
Unseeded, sterile discs were exposed to the abrasive action of sand in the
erosion apparatus. An analysis of the erosion products was conducted in
the same-manner as described in paragraph 3.4. These controls were used
to establish the reliability of the test data with respect to possible con
tamination due to procedural techniques.
3.7 TEMPERATURE AND HUMIDITY MEASUREMENTS
Temperature changes occurring from sand impaction on the discs wore
measured. Thermocouples were embedded near the surface of the discs and
each disc was eroded to the point of breaking the thermocouple. Tempera
tures were measured with a pyrotest thermocouple potentiometer.
The humidity of the air and CO was measured with a dew point recorder.
The gases were measured at both the nozzle and outlet portion of the sand
blasting apparatus.
70

4.'0 RESULTS AND DISCUSSION
4. 1 EROSION RATES
The gas flow metered into the sand blasting apparatus was varied with
each test condition to effectively erode 0. 25 + 0. 05 gm from each disc.
Table Z gives the parameters used for each test condition. Figure 5
shows a methyl methacrylate and Eccobond disc with approximately 0. Z5
grams eroded.
Table 2: TEST PARAMETERS
Test Condition I. D. Orifice I. D. Nozzle Flow Rate
mm mm ipm
0.5 hour - CO Z 2.36 4.70 105.2
0.5 Hour -Air 2.44 4.70 134.4
2 Hour - Air 2.44 4.70 119.3
24 Hour - Air 2.36 4.70 66.2
4. Z SPORES RELEASED BY EROSION
A summary of the spores released by aeolian erosion is presented in
Table 3. The unreduced data for these summary figures are given in the
Appendix. It was noted that the average percent of spores released based
on the number of spores available for release is less than 1 percent for
all test conditions.
An appropriate analysis of variance technique was used to assess the data
obtained on spore releases. The results of this analysis show no signifi
cant differences ( F = 1. 42 with 7 and 40 degrees of freedom) between the
4 test conditions or between the Z materials.
71

Figure 5: ERODED DISCS
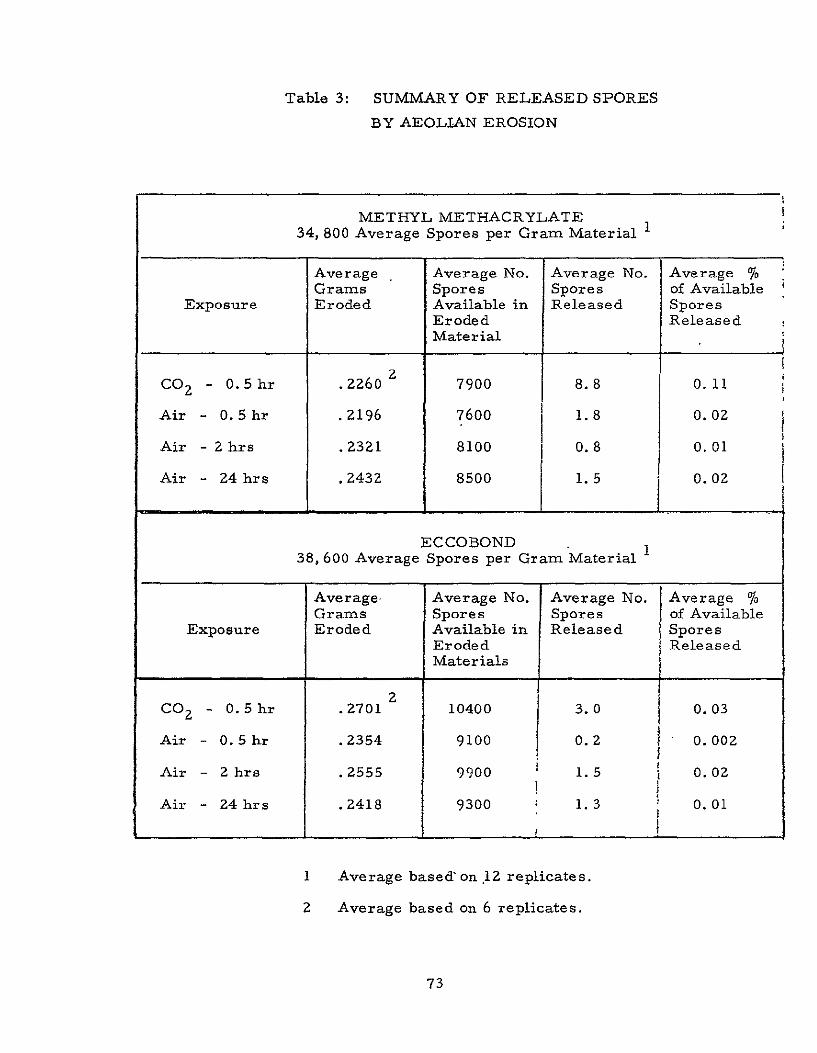
Table 3: SUMMARY OF RELEASED SPORES
BY AEOLIAN EROSION
METHYL METHACRYLATE 34,800 Average Spores per Gram Material I
Average Average No. Average No. Average 0 Grams Spores Spores of Available
Exposure Eroded Available in Released Spores Eroded Released Material
2 CO 2 - 0.5hr .2260 7900 8.8 0.11
Air 0.5 hr .Z196 7600 i1.8 0.0Z
Air - 2 hrs .2321 8100 0.8 0.01
Air Z4 hrs .2432 8500 1.5 0.0Z
ECCOBOND 38,600 Average Spores per Gram Material
Average- Average No. Average No. Average % Grams Spores Spores of Available
Exposure Eroded Available in Released Spores Eroded Released Materials
2 CO Z - 0.5 hr .2701 10400 3.0 0.03 Air .0.Shr .2354 9100 0.2 0.002
Air 2 hrs .2555 9900 1.5 0.02
Air 24 hrs .2418 9300 1.3 0.01
I__Averagebased'_______replicates.
1 Average based on .12 replicates.
2 Average based on 6 replicates.
73

4.3 SPORES REMAINING IN ERODED DISCS
One-half of the eroded discs were assayed to determine the number of
viable spores remaining in the disc. A summary of these data are
presented in Table 4. See Appendix for raw data.
Table 4: VIABLE SPORES IN DISC AFTER EROSION
Methyl Methacrylate E ccobond Average NumberExposure Average Number
Spores Remaining Spores Remaining in Disc in Disc
CO 0. 5 hours 28,400* 36, 900t
Air - 0.5 hours 31,200 32,800
Air - 2 hours 30,400 32 400
Air - 24 hours 2Z, 700 33,000
* Average based on 3 replicates.
4.4 PROCEDURAL CONTROLS
Uninoculated, sterile discs were exposed to the same erosion conditions
as the test discs. The results of the microbial analysis of these discs
showed no recovery of B. subtilis spores.
4.5 TEMPERATURE AND HUMIDITY
The results of the temperature measurements taken during the erosion
process are shown in Table 5. These figures represent the rise in
temperature above ambient which was measured as 23 0 C. No differences
were detected between methyl methacrylate and Eccobond discs. The results of the humidity measurements are given in Table 6.
74

Table 5: EROSION TEMPERATURES
Temperature RiseExposure 0 C Above Ambient
CO2 0.5 hours 0
Air - 0.5 hours 8
Air - 2 hours 7
Air - 24 hours 1
Table 6: RELATIVE HUMIDITY
Exposure o Relative Humidity %Relative HumidityGas Inlet at Nozzle Gas Outlet at Filter
CO2 0.5 hour 4.0 5 min = 3.5
25 min. = 0.8
Air - 0.5 hour 22.4 5 min = 6.6
25 min = 5.4
Air -Z hour 21.7 5 min = 5.9
60 min = 8.0
115 min = 7.3
Air -24 hour 17.0 1 hr. = 4.6
7 hrs = 7.6 23 hrs = 9.5
75
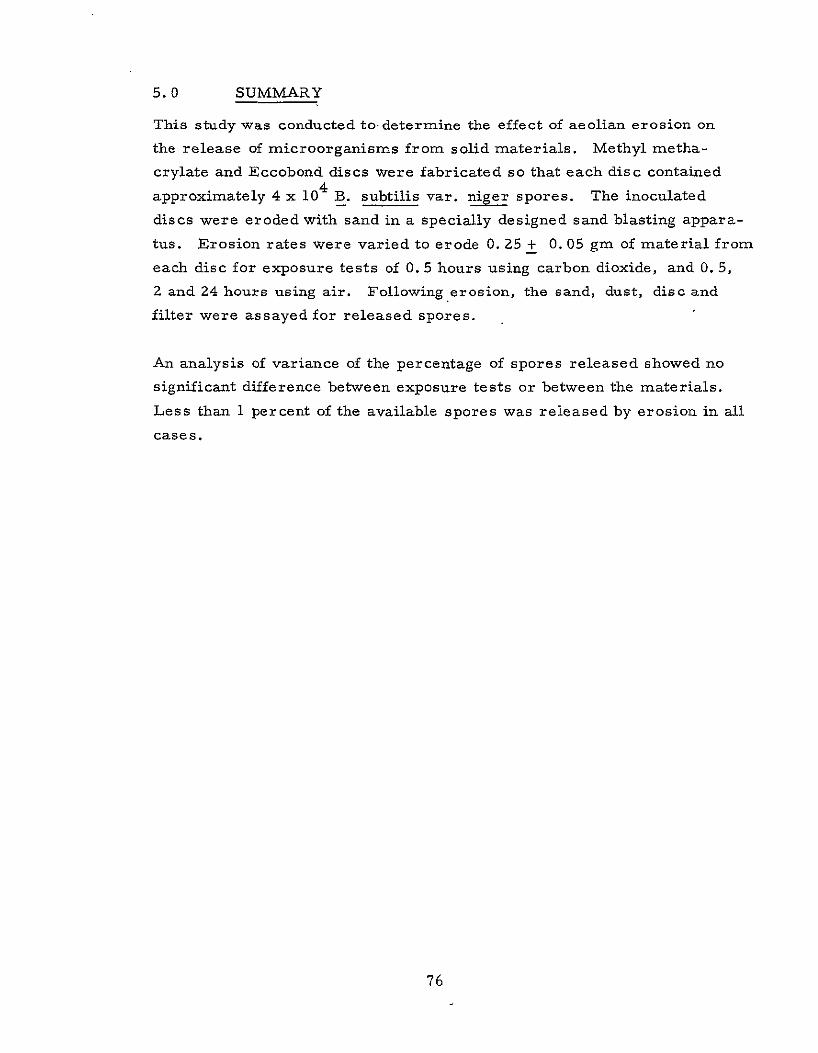
5.0 SUMMARY
This study was conducted to determine the effect of aeolian erosion on
the release of microorganisms from solid materials. Methyl metha
crylate and Eccobond discs were fabricated so that each disc contained
approximately 4 x 10⁴ B. subtilis var. iiger spores. The inoculated
discs were eroded with sand in a specially designed sand blasting appara
tus. Erosion rates were varied to erode 0. 25 + 0. 05 gm of material from
each disc for exposure tests of 0.5 hours using carbon dioxide, and 0. 5,
2 and 24 hours using air. Following erosion, the sand, dust, disc and
filter were assayed for released spores.
An analysis of variance of the percentage of spores released showed no
significant difference between exposure tests or between the materials.
Less than 1 percent of the available spores was released by erosion in all
cases.
76

6.0 APPENDIX
The raw data for this program are presented in Tables 7 through 12.
77

Table 7: INITIAL NUMBER OF SPORES PER ONE GRAM DISC
Replicates Methyl Methacrylate Eccobond
1 3Z, 109 30,500
2 35,711 46,460
3 32, 586 33, 560 4 30,325 34,1Z0
5 30,811 43,960 6 38,724 40,540
7 35,616 47, 160
8 35, 171 34, 340
9 34,735 33,000
10 37,839 35,420
11 34,490 43,300 iZ 39,321 40,900
Mean 34,800 38,600
78

Table 8: 0. 5 HOURS EROSION WITH CARBON DIOXIDE
Replicates Grams Eroded
1
2
3
4
5
6
.2320
.Z429
.2239
.2068
.Z347
.2156
.Mean .2Z60
Replicates Grams Eroded
1
Z
3
4
5
6
.2954
.2540
.2879
.2622
. 2699
.2514
Mean .2 701
METHYL METHACRYLATE
Number Spores Number SporesAvailable in Ed MtiRlsReleasedEroded Material
8074 4
8453 41
7792 3
7197 3
8168 0
7503 2
7900 8.8
ECCOBOND
Number of Spores Number Spores Available in Released Eroded Material
11402 4
9804 5
11113 2
10121 0
10418 3
9704 4
10400 3.0
79
o of Available SporesReleased
0.050
0.485
0.039
0. 04Z,
0
0. 027
0. 11
% of Available Spores Released
0.035
0.051
0.018
0
0. 029
0.041
0.03

Table
Replicates Grams
Eroded
1 .2059
z .2195
3 .2145
4 .2115
5 .2245
6 .2416-
Mean .2196
Replicates GramsGrams
Eroded
1 Z086
2 .2113
3 .2416
4 . 2698
5 . z638
6 . 2171
Mean .2354
9: 0.5 HOURS EROSION WITH AIR
METHYL METHACRYLATE
Number Spores Number Spores % AvailableAvailable in Spores ' Eroded Material Released Released
7165 1 0,014
7639 1 0. 013
7465 0 0 7360 7 0.095
7813 z 0.0Z6
8408 0 0
7600 1.8 0.02
ECCOBOND
Number Spores Number Spores % of AvailableAvailable, in Spores
Eroded Material Released Spoes
8052 0 0
8156 1 0.01Z
9326 0 0
10414 0 0
10183 0 0
8380 0 0
9100, 0.2 0. 002
80

Table 10: 2 HOURS EROSION WITH AIR
METHYL METHACRYLATE Repicate s
Grams Number Spores Number Spores % of Available I
Eroded Available in Eroded Material
Released Spores Released
1 .2561 8912 0 0
2 .2139 7444 0 0
3 .2530 8804 1 0.011
4 .2245 7813 0 0
5 .2021 7033 0 0
6 .2430 8456 4 0.047
Mean .2321 8100 0.8 0.01
ECCOBOND
Replicates Grams Number Spores Available in
Number Spores Released
% of Available Spor
Eroded Eroded Material Released
1 .2593 10009 2 0.020
2 .2950 11387 1 0.009
3 .2349 9067 0 0
4 .2662 10275 3 0. 029
5 .2428 9372 1 0.011
6 .2349 9067 2 0.022
Mean .2555 9900 1.5 0.02
81
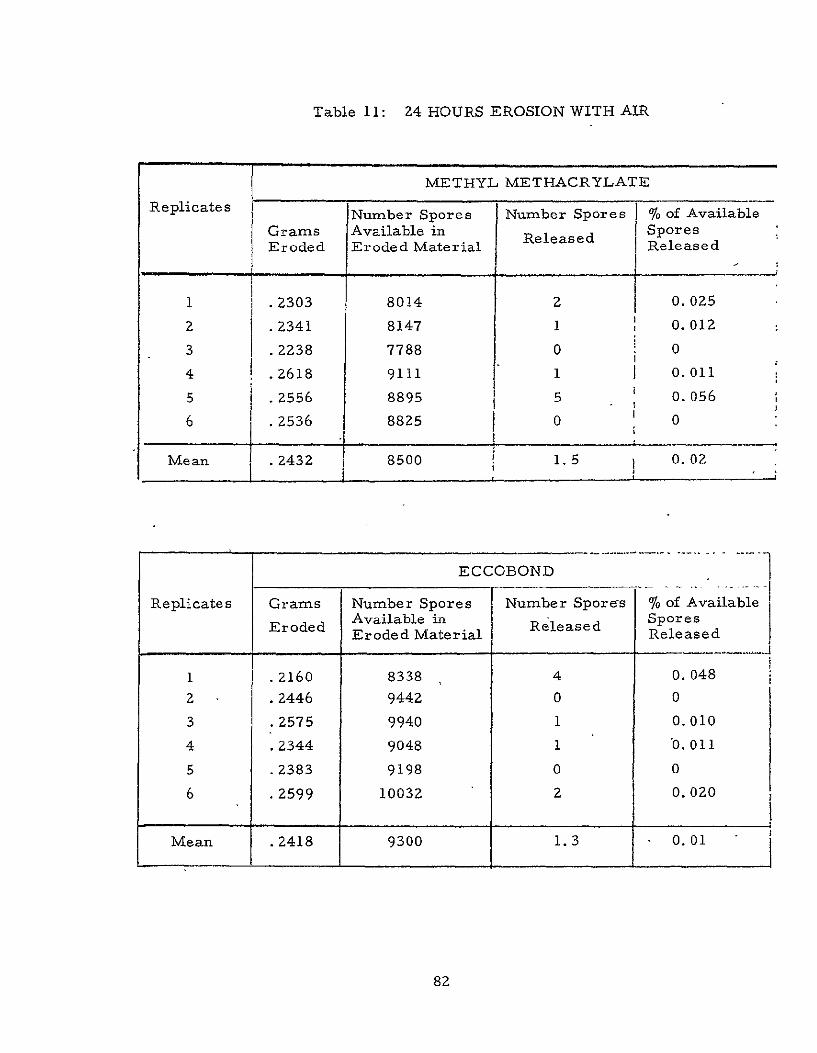
Table 11: 24 HOURS EROSION WITH AIR
METHYL METHACRYLATE
Replicates Number Spores Number Spores 1% of Available
Grams Available in I Spores Eroded Eroded Material Released Released
1 .2303 8014 z 0.025
2 .2341 8147 1 0.012
3 .2238 7788 0 0
4 .2618 9111 1 0.011
5 .2556 8895 5 0.056
6 .2536 8825 0 0
Mean .2432 8500 1.5 0.02
ECCOBOND
Replicates Grams Number Spores Number Spores % of Available Available in Released Spores
Eroded Eroded Material Releasedes
1 .2160 8338 4 0.048
2 .2446 9442 0 0
3 .2575 9940 1 0.010
4 .2344 9048 1 0.011
5 .2383 9198 0 0
6 .2599 10032 2 0.020
Mean .2418 9300 1.3 0.01
8z

Table 12: NUMBER OF VIABLE SPORES REMAINING
Exposure
CO 2 - 0.5 hours
Air - 0. 5 hours
Air - 2 hours
Air - 24 hours
IN DISC AFTER EROSION
Methyl Ecbn Replicates MethacrylateEccobond
1 30,251 42,780
2 26,995 37,440
3 Z7,863 30, 580
1 33,8Z9 30, 880
2 28, 168 41, 100
3 31,475 26,300
1 27,689 31,000
2 32,829 35,860
3 30,743 30,400
1 24,733 36,300
2 20, 159 37,820
3 23,335 24,800
83