Embed Size (px)
Citation preview

Earnings Release 3Q17
Paloma E. Arellano Bujanda Investor Relations [email protected] Tel. +52 (81) 8389 – 3400 ext.1419 www.grupofamsa.com
1 / 14
3Q17 EARNINGS RELEASE

Earnings Release 3Q17
Paloma E. Arellano Bujanda Investor Relations [email protected] Tel. +52 (81) 8389 – 3400 ext.1419 www.grupofamsa.com
2 / 14
Recent Developments
Consolidated Results
3Q17 3Q16 ∆% YTD 17 YTD 16 ∆% Net Sales 4,255 4,125 3.2% 12,503 12,276 1.8% Cost of Sales (2,379) (2,160) (10.1%) (6,840) (6,427) (6.4%) Gross Profit 1,876 1,965 (4.5%) 5,663 5,849 (3.2%) Operating Expenses (1,815) (1,709) (6.2%) (5,116) (5,057) (1.2%) Other Income (Expenses), net 204 34 >100.0% 294 115 >100.0% Operating Profit 265 290 (8.5%) 842 908 (7.3%) EBITDA 366 389 (5.9%) 1,157 1,227 (5.7%) Net Income 15 125 (88.0%) 721 445 62.0% Gross Margin 44.1% 47.6% - 45.3% 47.6% - EBITDA Margin 8.6% 9.4% - 9.3% 10.0% - Net Margin 0.3% 3.0% - 5.8% 3.6% -
Grupo Famsa reedemed an advance payment of its Senior Notes due 2020, for a total amount
of US$116 million, using the resources obtained from the Ps.2,634 million credit facility subscribed with Bancomext (rate of TIIE + 300 bps., with 10-year term and a flexible amortization plan). Furthermore, Ps.498 million of short-term bank debt has also being paid with this credit facility´s proceeds. Consequently, the Company has significantly reduced its exposure to foreign exchange rate fluctuations of the MXP vs. the USD.
Grupo Famsa successfully concluded the sale negotiations of 5 properties, for a total amount of Ps.630 million, which we anticipate will be received during the last quarter of the year. Proceeds will be used mainly for the amortization of short-term liabilities. Additionally, the Company expects to conclude sales negotiations of other properties for an estimated amount of Ps.600 million before year-end.
Monterrey, Mexico October 26, 2017. – Grupo Famsa, S.A.B. de C.V. (BMV: GFAMSA), a leading Mexican commercial conglomerate in the retail, consumer and savings sector, announced today its earnings results for the third quarter 2017. The preliminary, unaudited financial statements presented in this report have been prepared in accordance with IFRS and the interpretations in effect as of September 30, 2017. Figures are expressed in millions of current, nominal Mexican pesos, unless otherwise stated.

Earnings Release 3Q17
Paloma E. Arellano Bujanda Investor Relations [email protected] Tel. +52 (81) 8389 – 3400 ext.1419 www.grupofamsa.com
3 / 14
MESSAGE FROM THE CEO
During the third quarter of 2017, we achieved significant progress in our financial initiatives, outstanding: i) the reduction in the dollar-denominated debt balance, through the agile use of the loan subscribed with Bancomext for Ps.2,634 million for a 10-year term; ii) the sale process of 5 properties amounting Ps.630 million (in titling and payment process); and, iii) the ongoing sell negotiations of other properties totaling an estimated figure of Ps.600 million (expected closing towards year-end).
Consequently, during the LTM the balance of consolidated net debt has decreased 10.1% YoY. Likewise, the exposure to the FX MXP-USD fluctuation has declined, recording a net FX gain of Ps.364 million as of September 30, 2017 following the outstanding Dollar-denominated debt reduction, which shifted from a 56% share of the total debt as of December 2016 to a 32% as of September 2017. Both actions have provided flexibility and stability to our operation.
In relation to our strategy of incorporating high-quality assets into our portfolio and efficiently managing credit risk, the participation of clients from the formal economy continues its upward trend in the consolidated credit portfolio, increasing from 62.9% in 3Q16 to 66.1% at quarter-end.
Likewise, we continue striving in the optimization of our store network, conducting during the third quarter the selective closing of 1 store and 2 banking branches in Mexico, as well as 2 stores and 1 non-banking branch in the US.
Moving to Famsa Mexico's operating results, during 3Q17 we achieved an 8.0% growth in Net Sales, despite a challenging consumption context (high interest rates and inflationary pressures on real wages), seeking to consolidate a high-quality revenue mix quarter-on-quarter, mainly supported by our solid credit origination standards. Similarly, EBITDA in Mexico reached Ps.391 million, equivalent to a 10.5% YoY growth.
In the United States, the immigration uncertainty surge derived from even more severe projects of law sent by the Trump Administration to the US Congress, took a toll in Net Sales, which in MXP fell by 27.8%, in addition to the landfall of Hurricane Harvey during the third quarter 2017. Notwithstanding, in Texas the anti-immigration law (SB4) which would be in force on September 1st, 2017, was suspended. This, in addition to our initiative to expand our market niche among Hispanic groups of second and third-generation, will allow us to increase sales dynamism during 4Q17. Moreover, we reaffirm our strategy to turn-around Famsa USA’s operations to prevailing market trends, which has been recorded in the 18.3% (in MXP) reduction of its cost structure in 3Q17 YoY.
Following our 3Q17 results, Consolidated EBITDA totaled Ps.366 million, decreasing 5.9% YoY, partly reflecting the effects of natural phenomena that impacted some states of Mexico and Texas, where a number of branches had to be closed for a few days. Isolating the impact of these events, Consolidated EBITDA would have reached Ps.391 million in 3Q17.
On our banking operations, Bank Deposits increased 15.7% YoY, responding favorably to our offering of saving instruments and wealth management financial products. As for the quality of Banco Famsa’s credit portfolio, the total NPL ratio remained stable, at its level of 8.3%.
To conclude, I would like to highlight the progress to strengthen our financial position, clearly stated in the improvement of our debt maturity profile and lower exposure to market risks, due to its crucial importance to advance with stability along our consolidation process to reach an optimal business structure. In this context, we are prepared to take advantage of the most relevant season (4Q17), and firmly close the year.
Humberto Garza Valdez, Chief Executive Officer
Earnings Release 3Q17
Paloma E. Arellano Bujanda Investor Relations [email protected] Tel. +52 (81) 8389 – 3400 ext.1419 www.grupofamsa.com
4 / 14
Business Segments Famsa Mexico During the third quarter of 2017, Net Sales grew by 8.0% YoY, despite the earthquake impact on some stores located in affected regions, and in line with the YoY growth of 7.2% in Same Stores Sales (SSS) registered in the period, amid a challenging consumption environment (high interest rates and inflationary pressures). YTD, Net Sales totaled Ps.11,089 million, 5.7% above YoY.
Outstanding was the quarterly growth reached in Appliances (+8.5%), mainly driven by the implementation of promotions and campaigns, such as “Credit Festival” and “Buy more and still pay the same” in 3Q17.
These results are supported by a strategy focused on generating high-quality revenue by analyzing through robust economic and social standards the credit authorization process at each market, instead of centralized procedures. Furthermore, we are focused on increasing the customer base in Mexico by redefining the profile of target customers while maintaining the same level of credit risk and, consequently, expanding the market segments to which we have access. Also, we are strengthening the canvassing channel structure and operation, which is featured by: i) an objective-oriented compensation plan designed to minimize the SG&A effect of its operation; and ii) an agile process to speed up credit origination and customer orders directly from their houses.
Banco Famsa
During the quarter we launched a wide marketing campaign, covering extensive advertising and attractive promotions to boost the opening of new accounts, succeeding both in the origination of credits and allocation of saving instruments, mainly in those clients belonging to the formal sector of the economy.
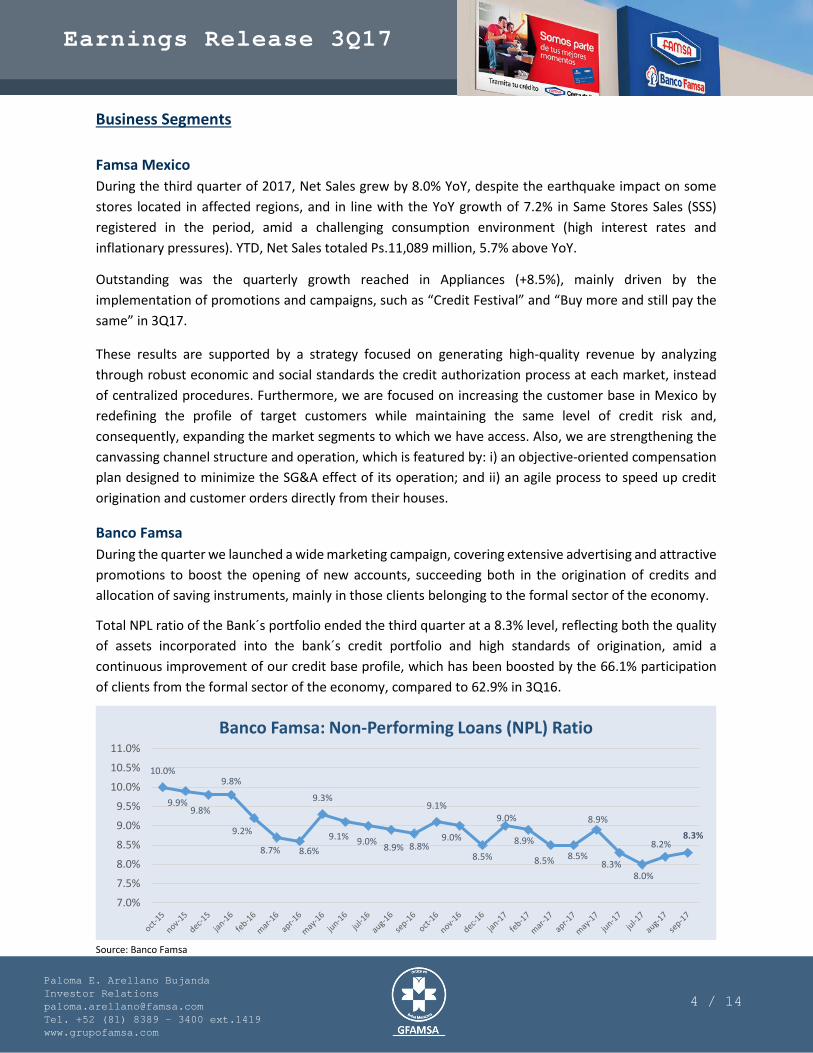
Total NPL ratio of the Bank´s portfolio ended the third quarter at a 8.3% level, reflecting both the quality of assets incorporated into the bank´s credit portfolio and high standards of origination, amid a continuous improvement of our credit base profile, which has been boosted by the 66.1% participation of clients from the formal sector of the economy, compared to 62.9% in 3Q16.
Source: Banco Famsa
10.0%
9.9%9.8%
9.8%
9.2%
8.7% 8.6%
9.3%
9.1% 9.0% 8.9% 8.8%
9.1%
9.0%
8.5%
9.0%
8.9%
8.5% 8.5%
8.9%
8.3%8.0%
8.2%8.3%
7.0%
7.5%
8.0%
8.5%
9.0%
9.5%
10.0%
10.5%
11.0%Banco Famsa: Non-Performing Loans (NPL) Ratio
Earnings Release 3Q17
Paloma E. Arellano Bujanda Investor Relations [email protected] Tel. +52 (81) 8389 – 3400 ext.1419 www.grupofamsa.com
5 / 14
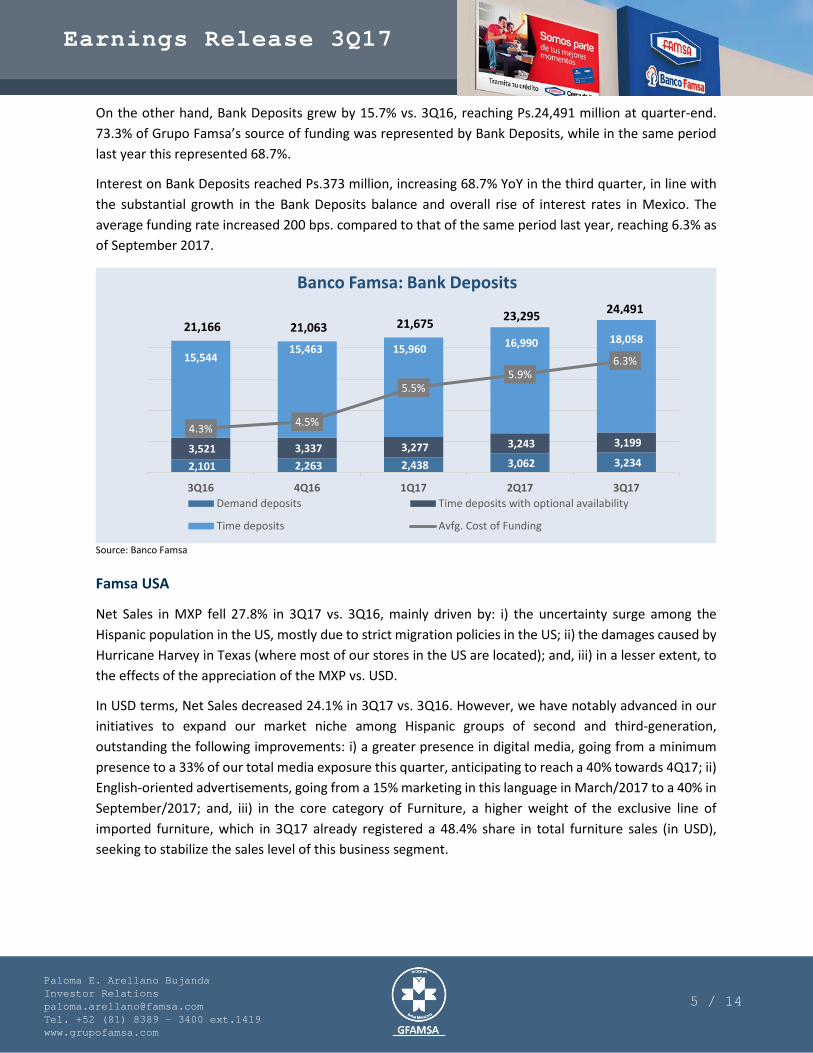
On the other hand, Bank Deposits grew by 15.7% vs. 3Q16, reaching Ps.24,491 million at quarter-end. 73.3% of Grupo Famsa’s source of funding was represented by Bank Deposits, while in the same period last year this represented 68.7%.
Interest on Bank Deposits reached Ps.373 million, increasing 68.7% YoY in the third quarter, in line with the substantial growth in the Bank Deposits balance and overall rise of interest rates in Mexico. The average funding rate increased 200 bps. compared to that of the same period last year, reaching 6.3% as of September 2017.
Source: Banco Famsa
Famsa USA
Net Sales in MXP fell 27.8% in 3Q17 vs. 3Q16, mainly driven by: i) the uncertainty surge among the Hispanic population in the US, mostly due to strict migration policies in the US; ii) the damages caused by Hurricane Harvey in Texas (where most of our stores in the US are located); and, iii) in a lesser extent, to the effects of the appreciation of the MXP vs. USD.
In USD terms, Net Sales decreased 24.1% in 3Q17 vs. 3Q16. However, we have notably advanced in our initiatives to expand our market niche among Hispanic groups of second and third-generation, outstanding the following improvements: i) a greater presence in digital media, going from a minimum presence to a 33% of our total media exposure this quarter, anticipating to reach a 40% towards 4Q17; ii) English-oriented advertisements, going from a 15% marketing in this language in March/2017 to a 40% in September/2017; and, iii) in the core category of Furniture, a higher weight of the exclusive line of imported furniture, which in 3Q17 already registered a 48.4% share in total furniture sales (in USD), seeking to stabilize the sales level of this business segment.
2,101 2,263 2,438 3,062 3,234 3,521 3,337 3,277 3,243 3,199
15,544 15,463 15,960 16,990 18,058
21,166 21,063 21,675 23,295
4.3% 4.5%
5.5%5.9%
6.3%
3Q16 4Q16 1Q17 2Q17 3Q17
Banco Famsa: Bank Deposits
Demand deposits Time deposits with optional availability
Time deposits Avfg. Cost of Funding
24,491

Earnings Release 3Q17
Paloma E. Arellano Bujanda Investor Relations [email protected] Tel. +52 (81) 8389 – 3400 ext.1419 www.grupofamsa.com
6 / 14
Business Units
To ease interpretation of Grupo Famsa’s business units results, the following breakdown of our network of stores and banking branches is presented.
(1) Most banking branches are located within Famsa Mexico stores. (2) Acquisition of branches from Monte de Mexico, S.A. de C.V.
In line previous announcements, during this third quarter 1 store and 2 banking branches were closed in Mexico, as well as 2 stores and 1 personal loans branches in the U.S. CAPEX continues to be used solely for maintenance purposes of the current commercial network. Likewise, for the last quarter of the year, we will go forward with our selective closing schedule, expecting to close 2 stores, 3 banking branches and 10 pawnshop branches in Mexico, as well as 1 store in the U.S., in accordance with our strategic initiatives for operational savings.
Consolidated Financial Results
Net Sales
(1) Includes sales of non-retail business (2) Includes Banco Famsa (3) SSS calculated in US dollars, excluding foreign exchange rate effects
Consolidated Net Sales reached Ps.4,255 million in 3Q17, with a stable growth of 3.2% YoY, despite a challenging consumption environment in Mexico and low performance of Famsa USA due to a number of economic and political conditions that affected our target market in the US. In addition, SSS increased 7.2% in Mexico, but decreased 28.7% in the US in 3Q17.
Retail Stores & Banking
Business Units Floor Space (m²)
3Q17 Openings Closures 2Q17 3Q16 ∆% YoY 3Q17 3Q16 ∆% YoY
Total 857 2 6 861 885 (3.2%) 534,991 566,689 (5.6%)
Stores 424 1 4 427 434 (2.3%) 493,888 522,878 (5.5%)
Famsa Mexico 376 0 1 377 380 (1.1%) 446,459 452,294 (1.3%)
Famsa USA 22 0 2 24 26 (15.4%) 43,887 66,434 (33.9%)
PL USA Branches 26 1 1 26 28 (7.1%) 3,542 4,150 (14.6%)
Banking Branches¹ 389 1 2 390 398 (2.3%) 38,206 40,166 (4.9%)
Pawnshop Brches² 44 0 0 44 53 (17.0%) 2,897 3,645 (20.5%)
Segment Net Sales Same Store Sales (SSS)
3Q17 3Q16 ∆% YTD 17 YTD 16 ∆% 3Q17 3Q16 YTD 17 YTD 16 Grupo Famsa¹ 4,255 4,125 3.2% 12,503 12,276 1.8% 2.8% 4.0% 1.5% 5.3% Famsa Mexico² 3,837 3,552 8.0% 11,089 10,491 5.7% 7.2% 6.8% 5.2% 7.5% Famsa USA3 395 548 (27.8%) 1,328 1,702 (22.0%) (28.7%) (14.9%) (26.0%) (8.6%) Other 223 227 (2.0%) 727 722 0.8% - - - - Intercompany (199) (201) 0.9% (642) (639) (0.5%) - - - -

Earnings Release 3Q17
Paloma E. Arellano Bujanda Investor Relations [email protected] Tel. +52 (81) 8389 – 3400 ext.1419 www.grupofamsa.com
7 / 14
Accumulated Consolidated Net Sales as of September 30, 2017 amounted to Ps.12,503 million, an increase of 1.8% YoY.
Cost of Sales
Consolidated Cost of Sales for 3Q17 totaled Ps.2,379 million, a 10.1% increase vs. 3Q16, mainly due to the increase in Bank Deposit’s interests of 68.7% YoY as a result of the continuous expansion of our time deposits base and reference interest rate rises in Mexico. Similarly, a rise of Ps.78 million was registered in allowances for doubtful accounts at a consolidated level, in line with the credit portfolio growth as of September 2017.
YTD, Cost of Sales totalized Ps.6,840 million, growing 6.4% when compared with the Ps.6,427 million of the same period of last year.
Gross Profit
3Q17 Consolidated Gross Profit registered a YoY 4.5% decrease, amounting to Ps.1,876 million. Gross Profit Margin also decreased by 350 basis points, mainly explained by higher costs of funding recorded during the quarter. YTD Consolidated Gross Profit as of September 30, 2017 totaled Ps.5,663 million, falling 3.2% YoY.
Operating Expenses
Consolidated Operating Expenses (sales and administrative expenses) increased by 6.2% YoY in 3Q17, totaling Ps.1,815 million, vs. Ps. 1,709 million in 3Q16. This is mainly explained by anticipated expenses oriented to widen the benefit of the highest sales season of the year, mainly in Banco Famsa marketing campaigns, and strengthening of the canvassing salesforce.
Outstanding during the quarter was the 18.3% YoY savings in the expense structure of Famsa USA, following the execution of our strategic initiatives oriented to adjust operating expenses at a new Sales level.
17.2% 10.3% 16.3% 11.4%
25.2% 36.0% 24.9% 34.2%
15.0% 12.6% 15.8% 13.4%
12.8% 12.9% 12.8% 13.3%
10.8% 10.7% 10.4% 10.0%9.8% 8.7% 11.0% 9.1%6.0% 5.8% 5.7% 5.9%3.2% 3.0% 3.1% 2.7%
3Q16 3Q17 YTD 2016 YTD 2017
Consolidated Product Mix
Computers
Motorcycles
Electronics
Mobile Phones
Appliances
Furniture
Loans
Others
$4,125 $12,276$4,255 $12,503

Earnings Release 3Q17
Paloma E. Arellano Bujanda Investor Relations [email protected] Tel. +52 (81) 8389 – 3400 ext.1419 www.grupofamsa.com
8 / 14
Accumulated Consolidated Operating Expenses slightly increased 1.2% YoY, from Ps.5,057 million during 2016 to Ps.5,116 million recorded in the same period of the previous year.
EBITDA
Segment EBITDA % EBITDA
3Q17 3Q16 ∆% YTD 17 YTD 16 ∆% 3Q17 3Q16 YTD 17 YTD 16
Grupo Famsa¹ 366 389 (5.9%) 1,157 1,227 (5.7%) 8.6% 9.4% 9.3% 10.0% Famsa Mexico² 391 354 10.5% 1,205 1,101 9.4% 10.2% 10.0% 10.9% 10.5% Famsa USA (20) 35 (157.4%) (40) 128 (131.4%) (5.1%) 6.4% (3.0%) 7.5% Other (5) 0 >100.0% (5) (2) >100.0% (2.0%) (0.1%) (0.7%) (0.2%) Intercompany 0 0 >100.0% (2) 0 >100.0% 0.2% 0.0% 0.4% 0.0% (1) Includes EBITDA from non-retail business (2) Includes Banco Famsa
Consolidated EBITDA totaled Ps.366 million in 3Q17, representing a decrease of 5.9% compared to the same period last year, due to a higher proportion of cost and expenses to net sales, that was partially offset by the Ps.204 million non-recurring gain recorded in “Other Income”. Most of the “Other Income” line this quarter is related to the sale transaction of Banco Famsa’s corporate building oriented to enhance the capital level of the bank. Meanwhile, consolidated EBITDA margin decreased 80 bps. reaching 8.6%, from 9.4% in 3Q16. YTD, Consolidated EBITDA decreased by 5.7%, reaching Ps.1,157 million.
It is important to highlight we are pursuing a higher EBITDA throughout the execution of the following initiatives: i) incremental revenue, from both our revitalized canvassing salesforce in Mexico and a wider market penetration in Famsa USA; and, ii) the continuous savings generation towards the consolidation of a more lean and efficient structure (interrupted this quarter due to expenditures focused on the maximization of benefits from the most relevant sales season of the year).
Financial Expenses, net
3Q17 3Q16 ∆% YTD 17 YTD 16 ∆%
Interest income 95 96 (1.0%) 283 286 (1.2%) Interest expenses (293) (238) (23.5%) (805) (667) (20.8%) Exchange gain & losses, net 13 (119) 111.2% 365 (353) 203.4% Total (185) (260) 28.9% (158) (733) 78.5%
In 3Q17, Net Financial Result totaled Ps.185 million, 28.9% lower vs. the Ps.260 million recorded in the same period last year, driven by a net FX gain of Ps.13 million, vs. a Ps.119 million loss recorded in 3Q16, following the appreciation of the MXP vs. the USD during the quarter and the decrease in the Dollar-denominated debt balance. Interest Expenses recorded a 23.5% growth that follows the upward trend of the TIIE (+230 bps.), which increased the debt service of our floating rate tranche (66.8% of the consolidated gross debt balance, excluding bank deposits). Additionally, Accumulated Financial Expenses as of September 30, 2017 were Ps.158 million, decreasing 78.5% compared to the Ps.733 million in the same period of 2016.

Earnings Release 3Q17
Paloma E. Arellano Bujanda Investor Relations [email protected] Tel. +52 (81) 8389 – 3400 ext.1419 www.grupofamsa.com
9 / 14
Net Income
Consolidated Net Income for the third quarter of 2017 amounted to Ps.15 million, decreasing 88.0% compared to the Ps.125 million recorded in 3Q16, due to a Ps.65 million non-cash effect in the deferred taxes line. The deferred asset taxes declined in 3Q17 due to the appreciation of the Mexican Peso vs. US dollar, impacting the valuation of deferred assets in foreign currency. However, year-to-date, Accumulated Consolidated Net Income increased 62.0% from Ps.445 million as of September 30, 2016 to Ps.721 million YTD 2017.
Financial Position Summary
Key Items 3Q17 4Q16 ∆% Trade Receivables, net 28,610 25,893 10.5%
Mexico Consumer 22,299 19,583 13.9% Mexico Commercial 4,368 3,691 18.3% USA Consumer 1,943 2,619 (25.8%)
Inventory 2,476 2,554 (3.0%)
Trade Receivables
At the end of the third quarter, the consolidated balance of Trade Receivables, net of allowances for doubtful receivables, was Ps.28,610 million, 10.5% higher than the balance recorded as of December 31, 2016. Also, the net balance of the consumer portfolio (net balance) in Mexico recorded an increase of 13.9% during the third quarter of 2017, totaling Ps.22,299 million, mainly due to a higher origination of payroll credits.
In parallel, the Commercial Portfolio (net balance) in Mexico increased by Ps.677 million as of September 30, 2017, 18.3% higher when compared to that of December 31, 2016, amounting to Ps.4,368 million (with an outstanding NPL ratio below 0.9%). Finally, the Consumer Portfolio (net balance) in the US registered a 25.8% decrease from December 2016 to September 2017, mainly due to the above-mentioned factors, which affected the segment.
Debt
Debt Ratios 3Q17 4Q16 ∆% Net Debt 7,080 8,497 (16.7%)
Gross Debt 8,902 10,001 (11.0%)
Net Debt at quarter-end, excluding Bank Deposits, totaled Ps.7,080 million, a decrease of 16.7% compared to the Ps.8,497 million in 4Q16, mainly due to the amortization of short-term debt derived of the resources obtained in the monetization of the contributed assets, the currency appreciation of the MXP vs. USD during the period, as well as to a 21.2% rise in the cash and cash equivalents account, which increased from Ps.1,504 million in 4Q16 to Ps.1,822 million in 3Q17. Additionally, the Gross Debt balance as of September 30, 2017, excluding Bank Deposits, recorded an 11.0% decrease vs. 4Q16.

Earnings Release 3Q17
Paloma E. Arellano Bujanda Investor Relations [email protected] Tel. +52 (81) 8389 – 3400 ext.1419 www.grupofamsa.com
10 / 14
Gross Debt as of September 30, 2017, was composed as follows:
Debt Composition Short-term % Long-term % Total % Bank Debt 1,580 52.4% 3,388 57.5% 4,968 55.8%
Debt Securities 1,432 47.6% 2,502 42.5% 3,934 44.2% 3,012 100.0% 5,890 100.0% 8,902 100.0%
20% 16%
26%52%
54%32%
3 Q 1 6 3 Q 1 7
Debt Profile
Debt Securities Bank Debt Foreign Debt
830 602704 639 250 394
2,639124 1452,502
73
2017 2018 2019 2020 > 2021
Debt Maturity Schedule
Debt Securities Bank Debt Foreign Debt
69% 68% 73%
22% 23% 12%9% 9% 15%
3 Q 1 6 4 Q 1 6 3 Q 1 7
Funding Sources
Bank Deposits Debt Securities Bank Debt
68%
32%
MXP USD
33%
67%
Fixed Rate Floating Rate
By Currency By Rate

Earnings Release 3Q17
Paloma E. Arellano Bujanda Investor Relations [email protected] Tel. +52 (81) 8389 – 3400 ext.1419 www.grupofamsa.com
11 / 14
Shareholders’ Equity Shareholders’ Equity as of September 30, 2017, amounted to Ps.8,853 million, increasing 6.5% vs. the balance registered as of December 31, 2016.
*********************************************
Forward-looking Statements
Analyst Coverage
Since Grupo Famsa, S.A.B. de C.V. (“Famsa”) securities are subject to the rules and regulations included in the Reglamento Interior de la Bolsa Mexicana de Valores (Interior Rules and Regulations of the Mexican Stock Market), the Company would like to inform that, in compliance with that stated in Disposition 4.033.10 of said Rules and Regulations, the following financial institutions provide formal coverage over its stock: GBM, Vector and BBVA Bancomer. For further information on institutional coverage, please visit www.grupofamsa.com.
Technical Notes and Bases for Consolidation and Presentation
Non-performing Loans Ratio (IMOR): The calculation of IMOR in this Quarterly Report includes “Collection Rights” in Banco Famsa’s total Credit Portfolio. These rights correspond to loans that are discounted via payroll. Due to an accounting reclassification that came into effect in July 2013, they are excluded from the Credit Portfolio used for the calculation of the IMOR indicator for the Mexican National Banking and Securities Commission (CNBV).
Credit Portfolio: Banco Famsa’s business model focuses largely on Consumer Credit, therefore the weight of such credits in the bank’s portfolio mix differs from that of standard financial institutions in the Mexican-banking sector. Consequently, Banco Famsa’s results and figures are not directly comparable with those of the aforementioned.
Net Financial Expenses: They are primarily comprised of the Financial Expenses corresponding to financing instruments and foreign exchange rate effect.
Percentage rates of change: Percentage rates of change presented in this Report are calculated according to the consolidated financial statements contained herein.
This report contains, or may be deemed to contain, forward-looking statements. By their nature, forward-looking statements involve risks and uncertainties because they relate to events and depend on circumstances that may or may not occur in the future. The future results of Grupo Famsa, S.A.B. de C.V. and its subsidiaries may differ from the results expressed in, or implied by, the forward-looking statements set out herein, possibly to a material degree.

Earnings Release 3Q17
Paloma E. Arellano Bujanda Investor Relations [email protected] Tel. +52 (81) 8389 – 3400 ext.1419 www.grupofamsa.com
12 / 14
Consolidated Financial Statements Grupo Famsa, S.A.B. de C.V. and subsidiaries
Consolidated statements of financial position Thousands of Mexican Pesos
30-sep-17 31-dec-16 ∆$ ∆% Assets CURRENT ASSETS:
Cash and equivalents 1,821,791 1,503,578 318,213
21.2% Trade receivables, net 25,338,960 22,773,269
2,565,691
11.3%
Rights to collect from related parties 260,520 800,000
(539,480) (67.4%) Recoverable taxes 652,652 602,327
50,325
8.4% Other accounts receivable 2,243,060 1,770,899 472,161 26.7% Inventories 2,476,166 2,553,842 (77,676) (3.0%)
Total current assets $32,793,149 $30,003,915
2,789,304
9.3% NON-CURRENT ASSETS:
Restricted cash 311,785 311,785 - - Trade receivables, net 3,271,150 3,119,608 151,542 4.9% Rights to collect from related parties 4,105,381 4,105,381 - - Property, leasehold improvements, and furniture & equipment, net 1,421,938 1,880,989 (459,051) (24.4%) Goodwill and intangible assets, net 337,296 251,821 85,475 33.9% Guarantee deposits 145,805 127,258 18,547 14.6% Other assets 1,067,445 993,981 73,464 7.4% Deferred income tax 1,678,339 1,695,040
(16,701) (1.0%)
Total non-current assets $12,339,139 $12,485,863
(146,724) (1.2%) Total assets $45,132,288 $42,489,778
$2,642,510 6.2%
Liabilities and Stockholders’ equity CURRENT LIABILITIES:
Demand deposits 17,925,448 17,274,090 651,358 3.8% Short-term debt 3,012,170 4,026,018 (1,013,848) (25.2%) Suppliers 1,102,876 1,373,372 (270,496) (19.7%) Accounts payable and accrued expenses 1,234,047 1,238,526 (4,479) (0.4%) Deferred income from guarantee sales 216,413 222,846 (6,433) (2.9%) Income tax payable 54,033 36,912 17,121 46.4%
Total current liabilities $23,544,987 $24,171,764 (626,777) (2.6%) NON-CURRENT LIABILITIES:
Time-deposits 6,565,746 3,788,816 2,776,930 73.3% Long-term debt 5,889,562 5,974,656 (85,094) (1.4%) Deferred income for guarantee sales 147,660 120,175 27,485 22.9% Employee benefits 131,073 119,123 11,950 10.0%
Total non-current liabilities $12,734,041 $10,002,770
2,731,271 27.3%
Total liabilities $36,279,028 $34,174,534
2,104,494 6.2% Stockholders’ equity
Capital stock 1,705,046 1,703,847 1,199 0.1%
Additional paid-in capital 3,824,432 3,810,052 14,380 0.4% Retained earnings 1,975,230 1,631,283
343,947 21.1%
Net income 719,505 343,947
375,558 109.2% Reserve for repurchase of shares 224,333 234,471 (10,138) (4.3%)
Foreign currency translation adjustment 369,357 558,059
(188,702) (33.8%) Total stockholders’ equity attributable to shareholders 8,817,903 8,281,659 536,244 6.5% Non-controlling interest 35,357 33,585 1,772 5.3% Total stockholders’ equity $8,853,260 $8,315,244 538,016 6.5% Total liabilities and stockholders’ equity $45,132,288 $42,489,778
2,642,510 6.2%

Earnings Release 3Q17
Paloma E. Arellano Bujanda Investor Relations [email protected] Tel. +52 (81) 8389 – 3400 ext.1419 www.grupofamsa.com
13 / 14
Grupo Famsa, S.A.B. de C.V. and subsidiaries Consolidated statement of income
Thousands of Mexican Pesos
3Q17 3Q16 ∆$ ∆% YTD 17 YTD 16 ∆$ ∆% Total revenues 4,255,331 4,125,300 130,031 3.2% 12,502,813 12,276,192 226,621 1.8% Cost of sales (2,379,100) (2,160,115) (218,985) (10.1%) (6,839,532) (6,427,118) (412,414) (6.4%) Gross profit 1,876,231 1,965,185 (88,954) (4.5%) 5,663,281 5,849,074 (185,793) (3.2%) Selling & administrative expenses (1,815,027) (1,708,767) (106,260) (6.2%) (5,116,073) (5,056,702) (59,371) (1.2%) Other Income, net 204,261 33,746 170,515 >100.0% 294,420 115,386 179,034 >100.0% Operating profit 265,465 290,164 (24,699) (8.5%) 841,628 907,758 (66,130) (7.3%) Financial income 94,951 95,891 (940) (1.0%) 282,881 286,295 (3,414) (1.2%) Financial expenses (293,458) (237,632) (55,826) (23.5%) (805,262) (666,634) (138,628) (20.8%) FX gain & losses, net 13,313 (118,588) 131,901 >100.0% 364,620 (352,651) 717,271 >100.0% Financial expenses, net (185,194) (260,329) 75,135 28.9% (157,761) (732,990) 575,229 78.5% Profit before income tax 80,271 29,835 50,436 >100.0% 683,867 174,768 509,099 >100.0% Income tax (65,381) 94,687 (160,067) <(100.0%) 37,402 270,353 (232,951) (86.2%) Consolidated net income 14,891 124,522 (109,631) (88.0%) 721,268 445,121 276,148 62.0% Controlling interest 14,594 123,816 (109,222) (88.2%) 719,497 441,697 277,801 62.9% Non-controlling interest 297 706 (409) (57.9%) 1,771 3,424 (1,653) (48.3%) Consolidated net income 14,891 124,522 (109,631) (88.0%) 721,268 445,121 276,148 62.0%

Earnings Release 3Q17
Paloma E. Arellano Bujanda Investor Relations [email protected] Tel. +52 (81) 8389 – 3400 ext.1419 www.grupofamsa.com
14 / 14
Grupo Famsa, S.A.B. de C.V. and subsidiaries
Consolidated statement of cash flows Thousands of Mexican Pesos
YTD 17 YTD 16 Operating activities
Profit before income tax $ 683,875 $ 174,770 Depreciation and amortization 315,528 319,665 Allowance for doubtful receivables 1,034,482 952,261 Gain on sale of property, leasehold improvements, furniture &
equipment
(200,701)
(18,730) Estimated liabilities for labor benefits 52,468 48,162 Interest income (282,881) (286,295) Interest expenses 1,780,679 1,273,059 Trade receivables (2,940,753) (4,146,996) Inventories 77,676 (280,090) Other accounts receivable (635,528) (188,372) Suppliers (248,610) (368,048) Accounts payable and accrued expenses (101,817) 93,615 Income tax paid (51,869) (50,915) Demand deposits and time deposits 3,385,799 2,796,688 Interest to bank depositors (932,928) (596,347) Exchange gain and losses, net (625,390) 612,882 Net cash flows from operating activities $ 1,310,030 $ 335,309
Investing activities
Acquisition of property, leasehold improvements, furniture and equipment
(75,516) (121,734)
Acquisition of intangible assets (9,975) (19,347) Proceeds from sale of property, furniture and equipment 244,784 21,996 Interest received 11,399 7,367 Net cash flow used in investing activities $ 170,692 $ (111,718)
Financing activities
Interest paid (724,488) (588,132) Proceeds from current and non-current debt and bank loans 4,367,716 1,387,054 Payments of current and non-current debt and bank loans (4,811,922) (1,446,417) Resale Share (repurchase), net 5,441 (1,817)
Net cash flow from financing activities $ (1,163,253) $ (649,312)
Increase (decrease) in net cash and cash equivalents
$ 317,469
$ (425,721)
Adjustments to cash flow as a result of changes in exchange rates $ 744 $ 17,065 Cash and cash equivalents at the beginning of the period $ 1,503,578 $ 2,194,323 Cash and cash equivalents at the end of the period $ 1,821,791 $ 1,785,667
Notes to the Financial Statements: For a greater depth of analysis, we recommend referring to the Notes of our Financial Statements at www.grupofamsa.com.


![Results Press Release & Investor Update [Company Update]](https://img.dokumen.tips/doc/110x75/577cb4891a28aba7118c8067/results-press-release-investor-update-company-update.jpg)


![Investor Release [Company Update]](https://img.dokumen.tips/doc/110x75/577cb49f1a28aba7118c9558/investor-release-company-update.jpg)

![Results Press Release & Investor Presentation [Company Update]](https://img.dokumen.tips/doc/110x75/577ca5611a28abea748b80bd/results-press-release-investor-presentation-company-update.jpg)