Embed Size (px)
Citation preview

Relaxation and self-organization in two-dimensional plasma and neutral fluid flowsystemsAmita Das Citation: Physics of Plasmas (1994-present) 15, 022308 (2008); doi: 10.1063/1.2844441 View online: http://dx.doi.org/10.1063/1.2844441 View Table of Contents: http://scitation.aip.org/content/aip/journal/pop/15/2?ver=pdfcov Published by the AIP Publishing Articles you may be interested in Kolmogorov flow in two dimensional strongly coupled dusty plasma Phys. Plasmas 21, 073707 (2014); 10.1063/1.4890488 Numerical study on a canonized Hamiltonian system representing reduced magnetohydrodynamics and itscomparison with two-dimensional Euler system Phys. Plasmas 21, 032103 (2014); 10.1063/1.4863982 Shocks, explosions, and vortices in two-dimensional homogeneous quantum magnetoplasma Phys. Plasmas 18, 022303 (2011); 10.1063/1.3551577 Probability distribution function for self-organization of shear flows Phys. Plasmas 16, 052304 (2009); 10.1063/1.3132631 Chaotic behavior of a Galerkin model of a two-dimensional flow Chaos 14, 1056 (2004); 10.1063/1.1804091
This article is copyrighted as indicated in the article. Reuse of AIP content is subject to the terms at: http://scitation.aip.org/termsconditions. Downloaded to IP: 193.0.65.67
On: Wed, 10 Dec 2014 12:12:23

Relaxation and self-organization in two-dimensional plasmaand neutral fluid flow systems
Amita Dasa�
Institute for Plasma Research, Bhat, Gandhinagar-382428, India
�Received 28 August 2007; accepted 18 January 2008; published online 29 February 2008�
Extensive numerical studies in the framework of a simplified two-dimensional model for neutral andplasma fluid for a variety of initial configurations and for both decaying and driven cases are carriedout to illustrate relaxation toward a self-organized state. The dynamical model equation constitutesa simple choice for this purpose, e.g., the vorticity equation of the Navier–Stokes dynamics for theincompressible neutral fluids and the Hasegawa–Mima equation for plasma fluid flow system.Scatter plots are employed to observe a development of functional relationship, if any, amidst thegeneralized vorticity and its Laplacian. It is seen that they do not satisfy a linear relationship as thewell known variational approach of enstrophy minimization subject to constancy of the energyintegral for the two-dimensional �2D� system suggests. The observed nonlinear functionalrelationship is understood by separating the contribution to the scatter plot from spatial regions withintense vorticity patches and those of the background flow region where the background vorticity isweak or absent altogether. It is shown that such a separation has close connection with the knownexact analytical solutions of the system. The analytical solutions are typically obtained by assuminga finite source of vorticity for the inner core of the localized structure, which is then matched withthe solution in the outer region where vorticity is chosen to be zero. The work also demonstrates thatthe seemingly ad hoc choice of the linear vorticity source function for the inner region is in factconsistent with the self-organization paradigm of the 2D systems. © 2008 American Institute ofPhysics. �DOI: 10.1063/1.2844441�
I. INTRODUCTION
A fluid flow system can be truly represented by three-dimensional �3D� dynamics. However, there are instances inwhich a flow system can be depicted suitably by a 2D dy-namics. For example, a stratified fluid in the presence ofgravity, a fluid in the presence of strong rotation, and/or mag-netic field typically behave as a 2D system. The reduceddimensionality makes it easier for these 2D systems to beamenable to numerical investigation. The 2D systems, how-ever, show certain salient features that are distinct from their3D counterparts. One of the most interesting aspect in thisregard is the existence of an additional �other than energy�invariant, viz. enstrophy, in the nondissipative limit of the 2Dsystems. The existence of two invariants is responsible forthe phenomena of dual spectral cascade observed in 2D sys-tems. The energy cascades toward longer scales and the en-strophy toward short scales. Since dissipation is high atshorter scales, this results in a selective dissipation of enstro-phy while the energy remains essentially invariant. This par-ticular feature has been the basis of the relaxation paradigmfor 2D flow systems. A variational approach, wherein theenstrophy is minimized subject to the constancy of energy, isadopted by several authors1–4 for understanding the relaxedstate of the 2D system. Such a treatment predicts a linearrelationship between the generalized vorticity function andits Laplacian in the relaxed state.
The numerical investigations studying the possibility of
self-organization for 2D systems have primarily relied ongross attributes.1–4 A qualitative similarity in the appearanceof the relaxed configuration and/or a close agreement of theratio of enstrophy and energy in the evolved state with thesquare of the permissible minimum wave number in thesimulation box are taken as sufficient signatures for a self-organized state. The primary motivation of the present studyis to study the establishment of a functional form, if any,amidst the vorticity function and its Laplacian in the relaxedconfiguration for a variety of distinct simulations. Both thedecaying as well as driven flow systems in 2D have beenconsidered. A range of initial configurations corresponding torandom flows to ordered shear flow configurations were cho-sen to understand the process of relaxation in each of thesecases and to identify the subtle issues pertaining to each ofthem specifically. It is shown that the system evolves towarda state with formation of localized intense vorticity regionsinterspersed in a background flow with weak or negligiblevorticity. The self-organization paradigm is seen to be validonly in the core region of these structures. A connection withthe analytical solutions of the nonlinear equations and thestructures observed during the course of evolution is alsohighlighted. It is pointed out that the ad hoc choice of thevorticity source function made while obtaining an analyticalsolution for the inner core region of the localized structurefinds its justification in the minimum enstrophy self-organization paradigm.
There are several model equations that have been con-sidered by various authors for the study of 2D dynamics indifferent contexts. Here we choose the most simple modelsa�Electronic mail: [email protected].
PHYSICS OF PLASMAS 15, 022308 �2008�
1070-664X/2008/15�2�/022308/12/$23.00 © 2008 American Institute of Physics15, 022308-1
This article is copyrighted as indicated in the article. Reuse of AIP content is subject to the terms at: http://scitation.aip.org/termsconditions. Downloaded to IP: 193.0.65.67
On: Wed, 10 Dec 2014 12:12:23

for our study which have the rudimentary aspects governingthe neutral and plasma dynamics. The evolution equation forthe component of vorticity along the symmetry direction de-scribes the neutral fluid flow in 2D1 and is chosen for ourstudies. This system is inherently scale-free. The existence ofnatural length and time scales is typically one of the essentialfeatures characterizing the plasmas. The Hasegawa–Mima5
model is one of the simplest models containing these rudi-mentary attributes. It describes a wide-ranging plasma phe-nomenon from drift wave turbulence5 to the electron magne-tohydrodynamic �EMHD� fluid description6 �under specificcircumstances� and also the Rossby wave phenomena in thecontext of planetary atmospheres.7 For the purpose of oursimulation, we have chosen the dynamics governing the evo-lution of the vorticity component along the symmetry direc-tion to represent the 2D neutral fluid flow �termed here asNS� and the Hasegawa–Mima5 model �termed HM here� forthe depiction of 2D plasma fluid. Basically, the NS modelsdepicts a scale-free system and HM contains aspects associ-ated with inherent length and time scales. The spectral cas-cade properties of various fields have been studied in thecontext of other complex models also,8 which represent evo-lution of multiple fields and often include higher-dimensional contributions. It was, however, shown byNaulin9 that though these models have their importance,some of the cascade properties of the multiple fields can berecovered through simpler models.
In the next section, we present the governing equationsfor the NS and HM models, which have been employed forthe purpose of numerical simulation studies. A brief descrip-tion of the energy and enstrophy invariants for these systemsis also presented. A description of the functional relationshipbetween the generalized vorticity and its Laplacian resultingfrom the variational treatment based on enstrophy minimiza-tion subject to the constancy of energy is also provided. Thissection also contains some details of the exact nonlinear ana-lytical solutions that have been obtained and studied by sev-eral authors. The ansatz of choosing a definite form of thevorticity source function for obtaining an analytical expres-sion of the localized solution is also outlined. The questionof the validity of the ansatz in the context of numerical evo-lution is addressed in subsequent sections. Section III con-tains the simulation results for the decaying case. We presentresults for a variety of initial configurations ranging fromrandom to ordered shear flows. The scatter plots are em-ployed to see the development of the functional relationshippredicted from the variational approach. We also study thepossibility of weakening of the nonlinear term �and henceapproach toward the nonlinear solutions� of the model equa-tions by analyzing the scatter plot amidst the generalizedvorticity function and the velocity stream function. This alsodemonstrates the validity of the choice of the vorticity sourcefunction made for obtaining the analytical solutions. In Sec.IV, the influence of forcing and wave excitations is studied.Section V contains a summary of our results.
II. GOVERNING EQUATIONS
As mentioned in the preceding section, we study thedynamical evolution of the field � given by the followingmodel:
�
�t��2� − �2�� + z � �� · ��2� + Vn
��
�y
= �− 1��p+1���2p��2�� + F . �1�
Equation �1� represents the evolution equation for the drivendissipative Hasegawa–Mima model. Here F depicts the ex-ternal forcing function. In this equation, � is the wave num-ber corresponding to the characteristic natural length scale ofthe system. The term Vn�� /�y is responsible for real fre-quency associated with the wave excitation in the linearizedsystem. For �=Vn=0, the equation reduces to the two-dimensional Navier–Stokes equation for the incompressibleneutral fluid wherein the variable � is the velocity potentialand �2� represents the z �the symmetry direction� compo-nent of vorticity. A choice of hyperviscous damping, i.e.,D= �−1��p+1���2p��2��, confines dissipation to very shortscales. When � and Vn are finite, Eq. �1� depicts a variety of2D plasma flow scenarios. As discussed in the precedingsection, it is used as a paradigm for the depiction of low-frequency electrostatic phenomena in a low-� plasma. In thiscase, Eq. �1� describes the evolution of the normalized scalarpotential e� /Te=�. The length and time are normalized by�s=cs /�ci and �ci
−1, respectively. The ion gyroradius�s=�−1=1 is the characteristic natural length scale for thissystem. The parameter Vn represents the normalized equilib-rium density scale length of the system.
An altogether different plasma phenomenon associatedwith the dynamics of fast magnetized electrons �electronmagnetohydrodynamics�6 is also depicted by Eq. �1�. Theevolution of the z component of the magnetic field in thetwo-dimensional electron magnetohydrodynamics �EMHD�phenomenon follows Eq. �1� in the absence of the in-planex−y component of the magnetic field. The collisionless elec-tron skin depth c /�pe=de=�−1 is the natural length scale ofthe system in this particular case.
For the decaying system �i.e., when forcing F is absent�,we obtain by multiplying Eq. �1� by � and integrating overspace
dE
dt=
d
dt� � 1
2�����2 + �2�2�d2x
= �� � ��p+1��2d2x . �2�
Similarly a multiplication with �2� and integration overspace yields
d
dt=
d
dt� � 1
2���2��2 + �2����2�d2x
= �� � ��p+2��2d2x . �3�
Clearly, for �=0, E �energy� and �enstrophy� are con-served. In the presence of finite �, the dissipation is much
022308-2 Amita Das Phys. Plasmas 15, 022308 �2008�
This article is copyrighted as indicated in the article. Reuse of AIP content is subject to the terms at: http://scitation.aip.org/termsconditions. Downloaded to IP: 193.0.65.67
On: Wed, 10 Dec 2014 12:12:23

weaker for energy as it cascades toward longer scales thanthat of enstrophy, which cascades toward short scales. Theselective decay of enstrophy and the relative constancy ofenergy have encouraged studies on seeking a variationaltreatment for the understanding of final relaxed state. Suchan approach has been adopted by several authors in the pastfor this as well as other systems possessing two integral in-variants and exhibiting dual cascade behavior.1–3
The self-organized state is obtained by minimizing thefunction −E, where is the Lagranges multiplier. Theform of the self-organized state for the neutral fluid NS sys-tem can be recovered in the limit of �=0,
− E =� � ���2��2 + ��2 − �����2 − �2�2�dxdy .
�4�
Varying the field � by a small amount �� produces the fol-lowing variation in the integral:
�� − E� = 2� � ��2��2�� + ��2 − � � � � ��
− �2����dxdy . �5�
It can be shown that the variation can be zero for anyarbitrary choice of �� provided the following condition issatisfied:
�2� = − �; � = ��2 − �2�� . �6�
Here the Lagrange multiplier corresponds to the ratio ofthe enstrophy and energy in the relaxed state,
=������2dxdy
���2dxdy=
�����2��2 + �2����2�dxdy
�������2 + �2�2�dxdy=
E.
�7�
It is clear that the relationship given by Eq. �6� can be satis-fied by choosing � as a sinusoidal function of space. In someof the earlier studies,1,4 such a choice has been made. Theself-organization of the flow system is then inferred byshowing that the ratio /E approaches a value close to thesquare of the minimum wave number permissible by thesimulation box size. In the subsequent sections, we use amore stringent criterion, namely that of the approach towarda functional relationship of the kind illustrated by Eq. �6� inthe evolved state with the help of scatter plots.
We now come to the second aspect, namely that of anexact analytical solution for � for the nonlinear evolutiongoverned by Eq. �1�. A number of studies have been dedi-cated for obtaining exact localized nonlinear solutions of Eq.�1� �in the limit of F=�=0� and an investigation of theirdynamical properties.10–18 These nonlinear solutions are dis-tinct from a simple sinusoidal form that has been chosen1,4 tosatisfy the relationship of Eq. �6�. We briefly recount some ofthe salient features of these solutions here. The objective istwofold. First, we wish to see how closely the solutions fitinto the self-organization paradigm outlined above. Sec-ondly, in the subsequent sections we would then seek the
possibility of the spontaneous formation of such structures inthe numerical evolution of Eq. �1� under varying initial con-figurations.
For simplicity, we restrict ourselves to the case ofVn=0 here. There are in general two varieties of localizedsolutions possible, one that is stationary and has a mono-polar form, and the other that travels with a constant velocityu� and has a form of a dipole. For seeking traveling solutions,the time derivative in Eq. �1� is replaced by −u� /�y �fordefiniteness here, the propagation of the structure is chosento be along the y axis�. The choice of u=0 describes thestationary mono-polar solutions. Using such a substitution,Eq. �1� can be expressed as a Poisson bracket of the follow-ing form:
��2� − �2�,� + ux� = 0. �8�
It is clear that the solutions of Eq. �8� can be obtained for thechoice
�2� − �2� = F�� + u�x − x0�� , �9�
where F can be any function of the argument �+u�x−x0�.The coordinate x0 refers to the center of the structure. Thefunction F basically represents a source function of the gen-eralized vorticity, viz., �2�−�2�. The analytical solutionsare obtained by choosing a suitable form for this particularfunction F. A separation in two distinct spatial regions, viz.,the inner region with finite vorticity and the outer regioncharacterized by the absence of the source function, i.e., F=0, is made. An analytical form of the solution is obtainedby choosing the vorticity source function to be a linear func-tion of its argument in the inner region, i.e., F��+ux�=a��+ux�, here a is a proportionality constant and is deter-mined along with other parameters by the matching of innerand outer solutions and their derivatives at the boundary ofthe two regions. The localization is achieved by seeking adecaying solution for � in the outer region. The solution inthis region has the form of the modified Bessel function ofthe second kind, which is usually denoted by the letter K. Itis then made to join smoothly with an inner solution of �,which is a Bessel function of first kind represented by J.Clearly, for � to have a form of the Bessel function of thefirst kind in the inner region, the sign of the parameter ashould be negative and its magnitude should be such that�a� �2. Operating with nabla2 on Eq. �9� for the aforemen-tioned choice of F clearly shows that �2� is a linear functionof � in the inner region. For the outer region, both �2� and� are zero. Thus, for the spatial points of the outer region ofthe solution, the scatter plot amidst �2� versus � woulddegenerate to a single point. The data from the spatial pointsin the inner region of the structure would, however, yield astraight line with negative slope for the same plot.
We wish to point out here that several authors in the pasthave referred the specific choice of F made for seeking ana-lytical solution of the structure as ad hoc.13 However, such achoice clearly is consistent with the self-organization para-digm. The linear choice of the vorticity source function forthe inner region is clearly consistent with the variational
022308-3 Relaxation and self-organization… Phys. Plasmas 15, 022308 �2008�
This article is copyrighted as indicated in the article. Reuse of AIP content is subject to the terms at: http://scitation.aip.org/termsconditions. Downloaded to IP: 193.0.65.67
On: Wed, 10 Dec 2014 12:12:23

scheme. For the outer region too, the absence of a vorticitysource function ensures that there is no subsequent minimi-zation of enstrophy possible in this region.
In terms of the velocity stream function �, it is interest-ing to note the following features that these localized solu-tions would display. For stationary monopoles �u=0 solu-tions� �2� is a linear function of �, with different slopescorresponding to the inner and outer region of a structure.For the outer region, the slope is positive and equal to �2. Onthe other hand, for the inner region, the slope is negative andequal to −�a�+�2. For the traveling dipole structures, theouter region characterized by F=0 shows a linear functionalrelationship of the form �2�=�2�. In the inner region fordipoles, however, the following relationship is satisfied:�2�=−��a�−�2��+u�x−x0�. Clearly, for this case one mayexpect a slight blurring in the linear relationship between�2� and � due to the presence of the additional termu�x−x0�. However, the blurring effect is expected to be weakas the extent of the inner region corresponds to the vortexcore size ��x−x0�� and is typically small. Furthermore, in thecore region the magnitudes of both �2� and � are typicallyhigh. It can also be shown that for the analytical solutions,the amplitude of � in the core region increases with increas-ing u. It is also important to mention here that for the outerregion, the NS system with �=0 satisfies �2�=0, which isdistinct from the HM system for which �2�=−�2�. It wouldbe interesting to see whether the numerical relaxation pro-cess indeed shows this difference in the NS and HM systems.
For the aforementioned choice for F, a solution for Eq.�9� is obtained in the cylindrical coordinate system by themethod of separation of variables. When u is zero, the solu-tions are radially symmetric functions. For the NS system,the outer solution for � decays logarithmically, whereas forthe HM system the decay is faster and is given by the modi-fied Bessel function of the second kind, K. The inner solu-tions are the Bessel functions of the first kind denoted by J.For a finite u the separation in � coordinate is responsible forthe cos��� dependence producing dipole structures.
Though it is generally believed that the structures ob-served during the course of evolution of Eq. �1� correspondto these analytical solutions, a detailed comparison of thefunctional form has not been provided so far. It is thereforeinteresting to investigate whether the system relaxes towarda state with a self-consistent generation of some of thesesolutions.
III. NUMERICAL RESULTS: DECAYING SIMULATION
A pseudospectral scheme is adopted for numericallystudying the evolution governed by Eq. �1�. A square domainof the simulation box with spectral resolution ranging from1282 to 5122 modes was employed. The results presented inthis section correspond to the case of F=Vn=0. We havechosen to study the relaxation from two distinct initial con-ditions. The choice of initial random flow configuration ismotivated by the fact that such a configuration is likely to bemost unconstrained and unrestricted to begin with. The like-lihood of a thorough mixing of each individual fluid elementexists in this particular case. For comparison, we also choose
an initial state that constitutes a sheared flow configurationalong one of the axes. This particular flow is comparativelymore restrictive. The possibility of mixing amidst fluid ele-ments spatially separated transverse to the fluid flow direc-tion is small in this particular case.
A. Initial state: Random flow
We choose an initial configuration that is comprised of acollection of randomly phased Fourier modes. The evolutionfor both NS ��=0� as well as the HM ��=1� systems fromthis initial configuration clearly shows a selective decay ofenstrophy while the energy remains essentially conserved.
The contour plots at various times �t=0, 500, and 4000�for the field � is depicted in Fig. 1 for the fluid NS system�subplots of the left column� and the plasma HM system�subplots of the right column�. Simulations were carried outfor several box sizes. However, the plot in the figure corre-sponds to a simulation box size of Lx=Ly =10�. A shorterbox size, viz., Lx=Ly =4�, has only a few scales longer thanthe natural length scale �=1, where the HM system essen-tially starts showing differences from NS. To distinguish thedifference between the two cases, results from simulation ofa larger box size such as Lx=Ly =10� have been shown inthis figure. The plots distinctly show a tendency for the struc-tures to merge and form large-scale patterns. This occursfaster in the case of the NS system, for which it can beobserved that as early as around t=500 the system has al-ready separated into distinct regions of positive and negativevorticity. For the HM system, the vortex merging is not com-pleted by this time. The vorticity structures continue to sur-vive in the form of several distinct patches. Only at a con-siderably later time �t�4000� does the merger process seemto be complete with regions of positive and negative vorticityclearly separated into two separate patches. The delayed ap-proach toward a relaxed state in the HM system can be un-derstood by realizing that the inverse energy cascade rate isslower for the HM system for scales longer than the intrinsiclength scale of �=1.19,20 The plots also show that the finalstructures for the NS system are typically of the order of thebox size. On the other hand, for the HM system the struc-tures have a much shorter extent. This again is due to the factthat the natural length scale acts as a barrier in the process ofinverse cascade19,20 in the HM case.
To investigate whether the structure formation observedin the simulation is an artifact of the evolution proceedingtoward a self-organized minimum enstrophy state outlined inthe preceding section, we show a plot of �2� versus � atvarious times for both the NS and the HM systems in Fig. 2.Here �=�2�−�2� is the generalized vorticity function. Itshould be noted that the function �2� is totally uncorrelatedwith � for the initial configuration as can be adjudged fromthe scatter in the points. However, at later times the scatterseems to lessen and the points start falling on a curve. Thecurve, however, is not a straight line as a process of globalrelaxation would predict, and also the choice of � as a har-monic function1,4 would have required. The low-amplituderegion of � shows considerable oscillations, whereas athigher amplitude the curve is essentially a straight line. The
022308-4 Amita Das Phys. Plasmas 15, 022308 �2008�
This article is copyrighted as indicated in the article. Reuse of AIP content is subject to the terms at: http://scitation.aip.org/termsconditions. Downloaded to IP: 193.0.65.67
On: Wed, 10 Dec 2014 12:12:23
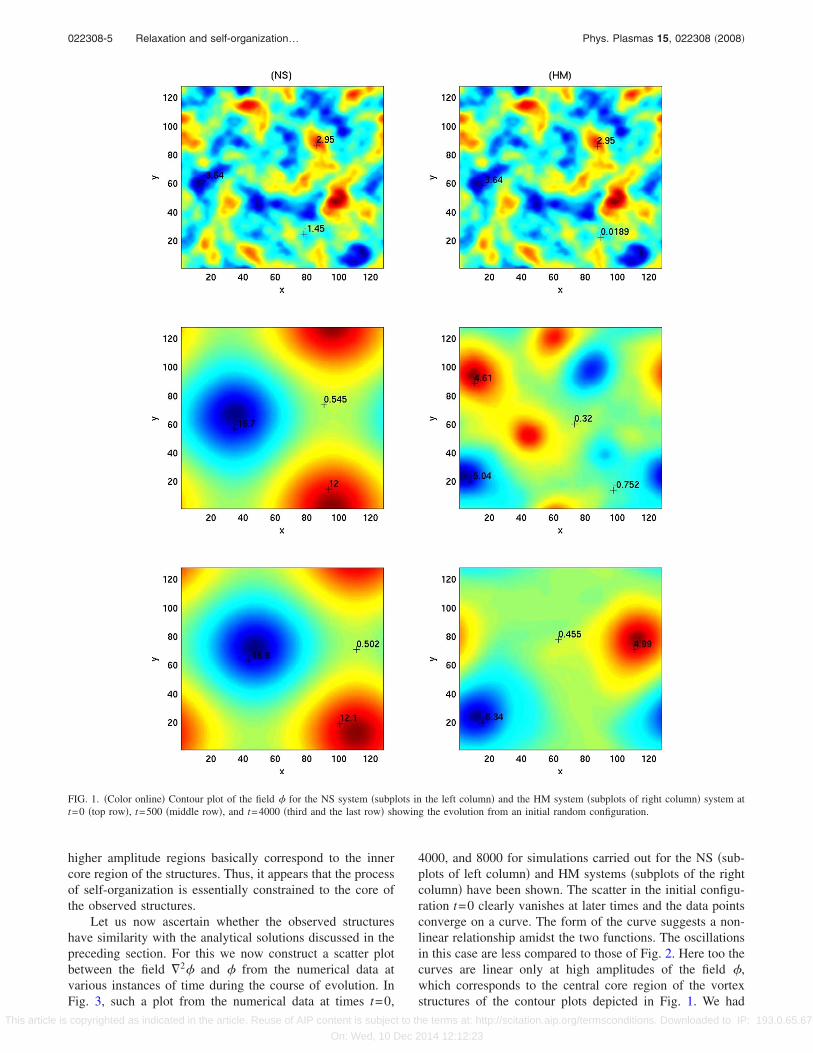
higher amplitude regions basically correspond to the innercore region of the structures. Thus, it appears that the processof self-organization is essentially constrained to the core ofthe observed structures.
Let us now ascertain whether the observed structureshave similarity with the analytical solutions discussed in thepreceding section. For this we now construct a scatter plotbetween the field �2� and � from the numerical data atvarious instances of time during the course of evolution. InFig. 3, such a plot from the numerical data at times t=0,
4000, and 8000 for simulations carried out for the NS �sub-plots of left column� and HM systems �subplots of the rightcolumn� have been shown. The scatter in the initial configu-ration t=0 clearly vanishes at later times and the data pointsconverge on a curve. The form of the curve suggests a non-linear relationship amidst the two functions. The oscillationsin this case are less compared to those of Fig. 2. Here too thecurves are linear only at high amplitudes of the field �,which corresponds to the central core region of the vortexstructures of the contour plots depicted in Fig. 1. We had
FIG. 1. �Color online� Contour plot of the field � for the NS system �subplots in the left column� and the HM system �subplots of right column� system att=0 �top row�, t=500 �middle row�, and t=4000 �third and the last row� showing the evolution from an initial random configuration.
022308-5 Relaxation and self-organization… Phys. Plasmas 15, 022308 �2008�
This article is copyrighted as indicated in the article. Reuse of AIP content is subject to the terms at: http://scitation.aip.org/termsconditions. Downloaded to IP: 193.0.65.67
On: Wed, 10 Dec 2014 12:12:23

mentioned earlier that for the core region of the analyticalvortex solutions10–14 with a finite source of vorticity, �2� isa linear function of the field � ��2�=−��a�−�2��� with anegative slope as the function � has a form of modifiedBessel function of the first kind in the inner region. Thenegative slope as well as the linear dependence at highervalues of � are indeed observed in the plot, which testifiesthat the vortex core formed during the course of numericalsimulation is similar to the analytical solution. We noticefrom Fig. 3 that for lower values of the field �, the value of�2� is typically very small and close to zero. The linearhigh-amplitude region of the curve in Fig. 3 for the plots of
the NS system joins smoothly with the low-amplitude regionof negligible �2�. The two regions of the curve in the caseof the HM system, however, join abruptly. For the exactsolutions of the NS and HM system, the outer region of thesolutions are obtained by using the simplifying assumptionof the absence of a generalized vorticity source function.This is characterized by linearity �2�=�2� �with a positiveslope� for HM and �2�=0 for NS. From Fig. 3 it appearsthat for low amplitude �viz. ����5� though �2� is small, thecurve for both NS and HM systems shows a weak negativeaverage slope �O�0.1�. For the HM system, the curve in thecentral region shows some oscillations as well. Clearly, the
−20 −10 0 10 20−1500
−1000
−500
0
500
1000
∇2
ψ
ψ
(NS)
−2 −1 0 1 2 3−3
−2
−1
0
1
2
3
4
∇2
ψ
ψ
−2 −1 0 1 2 3−2
−1
0
1
2
3
∇2
ψ
ψ
−20 −10 0 10 20−1500
−1000
−500
0
500
1000
∇2
ψ
ψ
(HM)
−10 −5 0 5 10−30
−20
−10
0
10
20
∇2
ψ
ψ
−10 −5 0 5 10−20
−15
−10
−5
0
5
10
15
∇2
ψ
ψ
FIG. 2. Scatter plot amidst �2� vs � for the NS system �subplots in left column� and the HM system �subplots in right column� for simulations from a randominitial configuration. The top, middle, and bottom rows are the plots at time t=0, 4000, and 8000, respectively.
022308-6 Amita Das Phys. Plasmas 15, 022308 �2008�
This article is copyrighted as indicated in the article. Reuse of AIP content is subject to the terms at: http://scitation.aip.org/termsconditions. Downloaded to IP: 193.0.65.67
On: Wed, 10 Dec 2014 12:12:23

numerical observations do not seem to support the analyticalform of the outer region solution for this particular case.
We feel that the deviation in the low-amplitude outerregion is an artifact of the constraints of the initial configu-ration. The initial power in the long scales �comparable tothat of the system size� Fourier modes cannot relax any fur-ther. The inverse cascade of energy associated with thesemodes gets constrained by the simulation box boundaries.Therefore, the smaller negative slope of the curve �2� ver-sus � observed at low amplitudes of � is essentially theremnant of the power content of the initial long scales. The
observed small negative slope testifies that it corresponds toa harmonic function �Fourier mode�. The typical magnitudeof the slope viz. �0.1 is also comparable to the longestwavelength Fourier modes that can be accommodated in a
simulation box size of 10� as kl=�2� /Lx�2+ �2� /Ly�2
=2�10−1. The plot of Fig. 2 between �2� and � �fieldswith higher spatial derivatives� showing oscillations in thecentral region also suggests that the background flow is notrelaxed and contains a certain remnant of initial power inlong-scale Fourier modes.
FIG. 3. Scatter plot amidst �2� vs � for the NS system �subplots in left column� and the HM system �subplots in the right column� for simulations from arandom initial configuration. The top, middle, and bottom rows are the plots at time t=0, 4000, and 8000, respectively.
022308-7 Relaxation and self-organization… Phys. Plasmas 15, 022308 �2008�
This article is copyrighted as indicated in the article. Reuse of AIP content is subject to the terms at: http://scitation.aip.org/termsconditions. Downloaded to IP: 193.0.65.67
On: Wed, 10 Dec 2014 12:12:23

B. Initial state: Sheared flow
In this subsection, we choose ordered sharp shear flowconfigurations as initial condition. This is done with the ob-jective to test two issues:
�i� Does the ordered flow constrain the relaxation processdue to the lack of adequate mixing opportunity amidstthe fluid elements?
�ii� The initial configuration of sharp shear flow configu-ration has insignificant power at long scales. Thus thepossibility of a remnant power in a long scale disturb-ing the approach toward outer analytical solutions es-sentially gets ruled out. In this case, if the systemwere to approach the analytical solutions, one wouldexpect the numerical evolution to approach a state ofzero generalized vorticity for the outer decaying re-gion at smaller amplitudes of �.
We have investigated two distinct shear flow configurations,one for which � has only one extrema and remains of thesame sign over the entire spatial domain. The choice of��sech�x /�� profile ensures this. We term simulations forthis particular initial condition as case �A�. The other choicetermed case �B� has ��sech�x /��tanh�x��, which corre-sponds to an antisymmetric profile for �. The field � takesup both positive and negative values and has two extrema inthis case. Both these choices of � produce a sheared�x-dependent� profile of the flow velocity. It should also benoted here that these choices for � are basically equilibriumconfigurations, as the nonlinear term z��� ·��2� vanishesidentically for them. For such an equilibrium configuration,the system can relax only by taking recourse to the instabilityof the chosen equilibrium state. The sheared velocity profileis susceptible to the well known Kelvin–Helmholtz �KH�instability. A very small amplitude random perturbation isadded to the initial sheared flow profile to hasten the devel-opment of this instability.
The numerical simulation studies were carried out forseveral different choices of parameters. Two different valuesfor the simulation box size were considered, namely Lx=Ly
=4� as well as Lx=Ly =10�. The value of shear layer thick-ness � was also varied from 0.2 to 0.8. We now describe theobservations gleaned from these numerical studies. The sys-tem typically relaxes by first generating vortices with scalelength of the order of the most unstable mode of the KHinstability. For simulations with initial condition of case �A�,vortices of only one sign are formed, whereas in case �B�vortices with both signs get formed. As the system evolves intime, the vortices mix and merge with each other. The char-acteristic inverse cascade feature of the 2D flow system be-ing operative led to the formation of longer size structures.This reduces the total number of vorticity patches in thesystem. The contour plots of Fig. 4 indeed illustrate this. Itappears that the time involved in the process of such mergersis crucially dependent on the possibility of the mixing per-mitted amidst various fluid elements in a given configuration.We observe that the process of mixing and merging is con-siderably easier and faster when vortices with both signs arepresent in the system, as in case �B�. In contrast, the merging
is difficult when only single signed vortices are present in thesystem as in case �A� simulations. Here, four vortex patchesfor both NS and HM systems continue to survive until thevery end. This observation can be readily understood. Thestrength of interaction amidst the � field of two vortexpatches is dependent on their separation distance. For theneutral fluid NS equation the interaction strength fallsweakly, as an inverse of the separation distance, while for theHM system, a more drastic exponential fall beyond the sepa-ration distance of natural length scale occurs. Any individualvortex pattern with circular symmetry is an exact stationarysolution of the evolution equation. Once the individual vor-tices achieve this �and observations support this to be indeedhappening�, the only way any further evolution can occur isthrough the nonlinear interaction with other vortices presentin the system. This requires the vortices to be present in closeproximity to each other. The vortices can come close to eachother within the interaction distance with the help of thebackground ambient flow that survives in the system. For therandom initial configuration outlined in an earlier subsection,the presence of a significant long-scale background ambientflow helps bring the vortices in close proximity to each otherto enable the merger process. It should also be noted that forthe random configuration, vortices of both signs are present,as is the case with the sheared flow configuration with profile�B� here. The ambient flow surviving after the KH destabili-zation is weak for both profile �A� as well as �B�. For profile�A�, with the existence of only single sign vortices, the like-lihood of two vortex patches coming within an interactiondistance for merger becomes negligible. On the other hand,when vortices of both signs exist in the system, as in the caseof profile �B�, there is an increased likelihood of merger andrelaxation is comparatively faster, because a pairing amidstunlike sign vortices results in a dipole structure that is knownto translate along its axis. Clearly, such a pairing has anincreased mobility that enhances the probability of interac-tion with other vortices of the system, thereby enabling fastermerging than in case �A�.
It is necessary to point out here that in the context ofnon-neutral plasmas, it is often stated that the equations gov-erning its dynamics are isomorphic to the vorticity equationof the 2D hydrodynamic fluid.21 The experiments on non-neutral plasma are thus claimed to be a test bed for studies onhydrodynamic fluid turbulence. It is important, however, tonote that as the non-neutral plasma can only support vorticesof a single sign, its dynamics is much more constrained thanthat of a 2D hydrodynamic fluid.
We now address the second question posed in the begin-ning of this subsection. In Fig. 5, a scatter plot between �2�and � for the data of case �B� at t=8000 has been shown.These plots correspond to the choice of Lx=Ly =4��a smaller box size� for which it is typically more difficult todiscern differences between the NS and HM systems. Thedifference �even for this case� in the scatter plot of Fig. 5 forthe two systems is clearly evident. It should be noted that forthe NS system, the flat central part of the curve shows that�2�=0. For the HM system, on the other hand, �2� is notzero but displays a linear dependence on � with unit positiveslope, thereby confirming �2�=�2� at low amplitudes of �.
022308-8 Amita Das Phys. Plasmas 15, 022308 �2008�
This article is copyrighted as indicated in the article. Reuse of AIP content is subject to the terms at: http://scitation.aip.org/termsconditions. Downloaded to IP: 193.0.65.67
On: Wed, 10 Dec 2014 12:12:23

This indicates that for low values of the field ���, the gener-alized vorticity function is zero. For higher values of ���, thefunctional dependence of �2� on � is linear with a negativeslope. This is as expected for a vorticity source functionwhich is finite and a linear function of its arguments. Thusboth the traits of the exact analytical solutions, viz. �i� thegeneralized vorticity source being a linear function of � withnegative slope for the inner solutions and �ii� the generalizedvorticity source function being zero for the outer region ofthe exact solutions, are seen to be satisfied by the data fromthe numerical simulations for this case. It should also be
noted that in this case, the curve in the linear regime is some-what blurred, which is expected in the context of dipolestructures as discussed in the preceding section.
For the data from case �A�, even though the mergingprocess is incomplete, �2� does develop a functional rela-tionship with �, as can be seen from Fig. 6. At higher am-plitudes, the curve seems to break up in several distinctstraight lines with different slopes. However, each of theselines corresponds to the inner region of one of the individualvortex patches shown in the contour plot of Fig. 4. In thiscase, the lines are much sharper than those of Fig. 5. This is
FIG. 4. �Color online� Contour plots of � for NS and HM systems for initial sheared flow configurations of the case �A� and case �B� mentioned in the text.The plots are for t=0 �first row�, t=4000 �second row�, t=8000 �third row�, and t=10000 �fourth row�.
022308-9 Relaxation and self-organization… Phys. Plasmas 15, 022308 �2008�
This article is copyrighted as indicated in the article. Reuse of AIP content is subject to the terms at: http://scitation.aip.org/termsconditions. Downloaded to IP: 193.0.65.67
On: Wed, 10 Dec 2014 12:12:23

because here only mono-polar structures are formed. How-ever, there are separate strands of the curve corresponding toeach of the distinct structures in Fig. 4 for this particularprofile. It suggests that the process of relaxation is local inindividual vortex patches. The �2� within each vortex corehas a sharp linear dependence on � as envisaged by the exactanalytical solutions and as expected from the self-organization paradigm. The lower subplots in this figureshow the scatter diagram on an expanded scale, which illus-
trates the comparison of the slope with that expected forouter decaying solutions �drawn by a dashed line corre-sponding to �2�=0 for the NS system and �2�=�2�=� forthe HM system� clearly.
IV. RELAXATION IN DRIVEN SYSTEMSAND THE INFLUENCE OF WAVE EXCITATIONS
In the preceding section, we investigated the case fordecaying simulations. It might appear that the presence ofexternal forcing would ruin the process of self-organizationaltogether. However, in some of the previous studies19,20 itwas shown that a forced HM system has a tendency to formquasicrystalline patterns at the natural length scale. This hap-pens when the forcing is at scales shorter than the naturallength scale. This might suggest that the underlying self-organization process continues even in the driven case.
For our simulations, we drive the system at scalesshorter than the intrinsic length scale �=1. The forcing func-tion F in Eq. �1� is finite over a set of wave numbers Kinj
lying between kf1=3.0 and kf2=3.5. The choice of forcingfunction is similar to the form described by Grossman et al.22
and considered in the earlier driven simulations of theHasegawa–Mima system20 viz.
F�p,t� =�inj��p,t�
q�Kinj
���q,t��2; p � Kinj,
F�p,t� = 0 otherwise.
Here F�p , t� is the pth Fourier mode of the forcing function Fat time t. The above form of forcing injects energy in thesystem at a rate of �inj. The observation of the formation ofquasicrystalline vortex patterns for the driven system wasalready reported in one of our earlier studies.20 Here, weshow the scatter plot amidst the fields �2� versus � for thedriven system in Fig. 7.
The figure clearly demonstrates that even in the presenceof forcing, the tendency toward developing a functional re-
−1 −0.5 0 0.5 1−1.5
−1
−0.5
0
0.5
1
1.5
2
φ
∇2
φNS(B)
−0.5 0 0.5 1−2
−1.5
−1
−0.5
0
0.5
1
1.5
2
φ
∇2
φ
HM(B)
FIG. 5. Scatter plot amidst �2� vs � from the simulation data at t=8000 forthe initial configuration of case �B� for the neutral fluid Navier–Stokes �NS�system �left subplot� and the Hasegawa–Mima �HM� system �right subplot�.The dashed line with unit slope has been drawn to show that the centralregion of the curve satisfies the relationship �2�=�2�, �=1 for the HMsystem.
−0.5 0 0.5 1−2
−1
0
1
φ
∇2
φ
NS(A)
−0.2 0 0.2
−0.2
0
0.2
0.4
φ
∇2
φ
−0.5 0 0.5 1−2
−1.5
−1
−0.5
0
0.5
φ
∇2
φ
HM(A)
−0.1 0 0.1−0.1
0
0.1
0.2
φ
∇2
φ
FIG. 6. Scatter plot between �2� vs � from the simulation data att=8000 for the initial configuration of case �A� for the neutral fluid Navier–Stokes �NS� system �left subplots� and the Hasegawa–Mima �HM� system�right subplots�. The lower two subplots show the curve on an expandedscale. It is interesting to observe that for this set of simulations, the range of� corresponding to the outer decaying solution is considerably smaller thanthat of Fig. 5.
−15 −10 −5 0 5 10 15−60
−40
−20
0
20
40
60
φ
∇2
φ
FIG. 7. Scatter plot of �2� vs � for a driven HM system.
022308-10 Amita Das Phys. Plasmas 15, 022308 �2008�
This article is copyrighted as indicated in the article. Reuse of AIP content is subject to the terms at: http://scitation.aip.org/termsconditions. Downloaded to IP: 193.0.65.67
On: Wed, 10 Dec 2014 12:12:23

lationship exists. The curve in the driven case, however, is nolonger a sharp curve. Instead it is somewhat broader. Thebroadening of the curve is clearly an influence of randomforcing, which tries to obliterate the process of self-organization. However, even though the curve is broadened,the presence of several streaks of straight lines at higheramplitudes is unmistakable. Their number tells us that for thedriven system, a distribution of vortex structures exists.These structures are going through the process of continuousmerging to form longer and fewer patterns �as the decayingsimulations illustrate� and at the same time they are alsobeing continuously generated in this case through the exter-nal forcing.
In the previous study,20 it was also shown that the pres-ence of wave excitations leads to the melting of the quasic-rystalline structures in the HM system. This happens as aresult of an increased cascade rate toward longer scales in thepresence of waves. The presence of waves �for finite Vn inEq. �1�� alters the scatter plot significantly, as can be seenfrom Fig. 8. There is a significant drop in the extrema valuesof the fields �as can be seen by comparing it to Fig. 7, whichcorresponds to the same set of simulation parameters butwith Vn=0�. In the presence of waves, it can be seen that theentire curve tries to approach a linear form. This suggeststhat the presence of waves aids the process of global self-organization by connecting regions that were isolated earlierdue to the lack of interaction. Furthermore, a single �albeitsomewhat broad� straight line passing through the center inthis case is also suggestive of the harmonic form that thefield � is trying to approach in this case.
V. SUMMARY
The evolution of 2D hydrodynamic and plasma systemsis numerically investigated. In particular, the self-organization paradigm based on the minimization of enstro-phy subject to the relative constancy of energy has been ex-plored by these studies using more stringent criteria than
those adopted in earlier studies.1,4 Another aspect of thepresent studies is to compare the observed structures in thefinal stages of the evolution with exact analytical solutions ofthese equations. A wide variety of initial configurations rang-ing from random to ordered shear flows has been employedfor such investigations. The decaying as well as driven caseshave been considered.
The variational scheme based on the selective decay ofenstrophy predicts a linear functional relationship amidst thegeneralized vorticity and its Laplacian. The approach towarda functional relationship amidst the two fields is investigatedwith the help of scatter plots from the numerical data. Thedata clearly show that though the two fields acquire a definitefunctional form as a result of evolution, the relationship,however, is far from linear. The shape of the curve is thenunderstood by realizing that the relaxation is not global butoccurs in the core region of isolated localized structures.These localized structures are found to be interspersed in abackground flow that in general constitutes a weak vorticity.The flow is essentially found to be a remnant of the initiallong-scale �of the size of simulation box� excitation. For aspecially prepared initial configuration that had less or neg-ligible power in such long scales, the background flow isfound to be devoid of generalized vorticity. The evolved con-figuration in this case is more in tune with the structural formof the analytical solutions that have been obtained for thenonlinear evolution equations.
It was also shown that the presence of vorticity patchesof both signs in the initial configuration hastens the mergeramong various like signed vorticity patches and hence aidsthe process of self-organization. This happens as in this casedipole structures can form that are known to translate alongtheir axis. This enhances the mobility of the structures andincreases the likelihood of various structures to encounterand interact with each other. For cases with flows that sup-port vorticity of single sign only, the global relaxation pro-cess comes to a halt as the structures get separated withdistances more than the interaction length. The core of theindividual structures in this case, however, is also seen tosatisfy separately the characteristic functional relationshipexpected from the self-organization process.
The slowing down of the relaxation process and also thehindrance in achieving global relaxation for the particularsheared flow profile, which yields only like signed vorticitypatterns, has implications to the non-neutral plasmastudies.21 The governing equation of the non-neutral plasmaconfined in a strong axial magnetic field is isomorphic to the2D neutral fluid vorticity equation. The non-neutral plasmahas therefore often been projected as a test bed for the 2Dfluid neutral fluid system. However, the non-neutral plasmasupports the formation of only single sign vorticity struc-tures. Here the vorticity �2� �� is also the scalar potential inthis case� is directly related to the charge density throughPoisson’s equation. We feel that the dynamics for the non-neutral case would therefore be severely constrained in con-trast to the neutral 2D fluid flow system.
A study of the driven HM system also shows that thesystem has a tendency to self-organize by predominantly ac-cumulating power at the intrinsic scale length. The continu-
−4 −3 −2 −1 0 1 2 3 4 5−6
−4
−2
0
2
4
6
φ
∇2
φ
FIG. 8. Scatter plot of �2� vs � for a HM system in the presence of waveexcitations.
022308-11 Relaxation and self-organization… Phys. Plasmas 15, 022308 �2008�
This article is copyrighted as indicated in the article. Reuse of AIP content is subject to the terms at: http://scitation.aip.org/termsconditions. Downloaded to IP: 193.0.65.67
On: Wed, 10 Dec 2014 12:12:23

ous random forcing, however, keeps generating vortexpatches of other shorter scale lengths. In this case, therefore,at higher amplitude the scatter plot between �2� and �shows the presence of several straight lines with varyingslopes. We have also shown that in the presence of waveexcitations, i.e., when Vn is made finite, the distinct vorticitypatches seem to melt away20 and extend over the entirelength of the simulation box size. The outer decaying solu-tion in this case no longer exists. The scatter plot between�2� and � is linear over the entire domain, suggesting thatthe velocity potential behaves as a sinusoidal function overthe entire simulation box, suggesting that the presence ofwaves connects the isolated vorticity region.
ACKNOWLEDGMENTS
The author would like to thank Professor P. K. Kaw forhis helpful remarks.
This work was financially supported by DAE-BRNSsanction no. 2005/21/7-BRNS/2454.
1A. Hasegawa, Adv. Phys. 34, 1 �1985�.2W. H. Matthaeus, W. T. Stribling, D. Martinez, S. Oughton, and D. Mont-gomery, Phys. Rev. Lett. 66, 2731 �1991�, and references therein.
3V. Naulin and K. H. Spatschek, Phys. Rev. E 55, 5883 �1997�.4A. Miura, Phys. Rev. Lett. 83, 1586 �1999�.
5A. Hasegawa and K. Mima, Phys. Fluids 21, 87 �1978�.6A. S. Kingsep, K. V. Chukbar, and V. V. Yankov, in Reviews of PlasmaPhysics �Consultants Bureau, New York, 1990�, Vol. 16 and referencestherein; A. Das and P. H. Diamond, Phys. Plasmas 7, 170 �2000�.
7M. V. Nezlin and E. N. Snezhkin, Rossby Vortices, Spiral Structures, Soli-tons, Springer Series in Nonlinear Dynamics �Springer, Berlin, 1992�.
8D. Biskamp and H. Kaifen, Phys. Fluids 21, 2172 �1985�; R. D. Hazeltine,D. D. Holm, and P. J. Morrison, J. Plasma Phys. 34, 103 �1985�; A.Hasegawa and M. Wakatani, Phys. Rev. Lett. 59, 1581 �1987�.
9V. Naulin, K. H. Spatschek, and A. Hasegawa, Phys. Fluids B 4, 2673�1992�.
10M. E. Stern, J. Mar. Res. 33, 1 �1975�.11V. D. Larichev and G. M. Reznik, Oceanology �Engl. Transl.� 16, 547
�1976�.12G. R. Flierl, V. D. Larichev, J. C. McWilliams, and G. M. Reznik, Dyn.
Atmos. Oceans 5, 1 �1980�.13J. D. Meiss and W. Horton, Phys. Fluids 26, 990 �1983�.14M. B. Isichenko and A. M. Marnachev, Sov. Phys. JETP 66, 702 �1987�.15E. W. Laedke and K. H. Spatschek, Phys. Fluids 28, 1008 �1985�; 29, 133
�1986�; 31, 1492 �1988�.16T. Huld, A. H. Nielsen, H. L. Pecseli, and J. Juul Rasmussen, Phys. Fluids
B 3, 1609 �1991�.17W. Horton, D. Jovanovic, and J. Juul Rasmussen, Phys. Fluids B 4, 3336
�1992�.18A. Das, Plasma Phys. Controlled Fusion 41, A531 �1999�.19N. Kukharkin, S. A. Orszag, and V. Yakhot, Phys. Rev. Lett. 75, 2486
�1995�.20A. Das, Phys. Plasmas 14, 072307 �2007�.21C. F. Driscoll, D. Z. Jin, D. A. Schecter, and D. H. E. Dubin, Physica C
369, 21 �2002�.22S. Grossman and D. Lohse, Phys. Fluids 6, 611 �1994�.
022308-12 Amita Das Phys. Plasmas 15, 022308 �2008�
This article is copyrighted as indicated in the article. Reuse of AIP content is subject to the terms at: http://scitation.aip.org/termsconditions. Downloaded to IP: 193.0.65.67
On: Wed, 10 Dec 2014 12:12:23