Embed Size (px)
Citation preview

American Economic Association
Relative Goods' Prices, Pure Inflation, and The Phillips CorrelationAuthor(s): Ricardo Reis and Mark W. WatsonSource: American Economic Journal: Macroeconomics, Vol. 2, No. 3 (July 2010), pp. 128-157Published by: American Economic AssociationStable URL: http://www.jstor.org/stable/25760311 .
Accessed: 10/05/2014 08:41
Your use of the JSTOR archive indicates your acceptance of the Terms & Conditions of Use, available at .http://www.jstor.org/page/info/about/policies/terms.jsp
.JSTOR is a not-for-profit service that helps scholars, researchers, and students discover, use, and build upon a wide range ofcontent in a trusted digital archive. We use information technology and tools to increase productivity and facilitate new formsof scholarship. For more information about JSTOR, please contact [email protected].
.
American Economic Association is collaborating with JSTOR to digitize, preserve and extend access toAmerican Economic Journal: Macroeconomics.
http://www.jstor.org
This content downloaded from 94.228.80.50 on Sat, 10 May 2014 08:41:36 AMAll use subject to JSTOR Terms and Conditions
American Economic Journal: Macroeconomics 2 (July 2010): 128-157
http://www. aeaweb. org/articles.php?doi=10.1257/mac. 2.3.128
Relative Goods' Prices, Pure Inflation, and The Phillips Correlation1
By Ricardo Reis and Mark W. Watson*
This paper uses a dynamic factor model for the quarterly changes in
consumption goods' prices in the United States since 1959 to sepa rate them into three independent components: idiosyncratic relative
price changes, a low-dimensional index of aggregate relative-price changes, and an index of equiproportional changes in all inflation rates that we label "pure" inflation. We use the estimates to answer two questions. First, what share of the variability of inflation is associated with each component, and how are they related to con
ventional measures of monetary policy and relative-price shocks?
Second, what drives the Phillips correlation between inflation and measures of real activity? (JEL E21, E23, E31, E52)
One
of the goals of macroeconomics is to explain the aggregate sources of
changes in goods' prices. If there was a single consumption good in the world, as is often assumed in models, describing the price changes of consumption would
be a trivial matter. But, in reality, there are many goods and prices, and there is
an important distinction between price changes that are equiproportional across all
goods (absolute-price changes) and changes in the cost of some goods relative to oth
ers (relative-price changes). The goal of this paper is to empirically separate these
sources of price changes and to investigate their relative size, their determinants, and their role in the macroeconomic Phillips relation between inflation and output.
Our data are the quarterly price changes in each of 187 sectors in the US per sonal consumption expenditures (PCE) category of the national income and product accounts from 1959:Q1 to 2006:Q2. Denoting the rate of price change for the /'th
good between dates t ? 1 and t by 7r/r, and letting irr be the iVx 1 vector that col
lects these goods' price changes, we model their co-movement using a linear factor
model:
(1) 7Tt = AF, + U,.
*Reis: Department of Economics, Columbia University, 1002 International Affairs Building, 420 West 118th
Street, New York, NY 10027 (e-mail: [email protected]); Watson: Department of Economics and Woodrow
Wilson School, Princeton University, Princeton, NJ 08544-1013 (e-mail: [email protected]). We are grate ful to several colleagues for their valuable input to this research project. For their support and hospitality, Reis
thanks the Hoover Institution at Stanford University under a Campbell national fellowship, Columbia University's
Program for Economic Research, the University of Chicago, and Princeton University where much of the work
for this paper was completed. The National Science Foundation provided support through grants SES-0617811
and SES-0921147. + To comment on this article in the online discussion forum, or to view additional materials, visit the articles
page at http://www.aeaweb.org/articles.php?doi=10.1257/mac.2.3.128.
128
This content downloaded from 94.228.80.50 on Sat, 10 May 2014 08:41:36 AMAll use subject to JSTOR Terms and Conditions

VOL. 2 NO. 3 REIS AND WATSON: RELATIVE GOODS' PRICES AND PURE INFLATION 129
The k factors in the k x 1 vector Ft capture common sources of variation in prices. These might be due to aggregate shocks affecting all sectors, such as changes in
aggregate productivity, government spending, or monetary policy, or they might be
due to shocks that affect many, but not all sectors, such as changes in energy prices, weather events in agriculture, or exchange rate fluctuations and the price of trad
ables. The N x k matrix A contains coefficients ("factor loadings") that determine
how the price of each individual good responds to these shocks. The N x 1 vector ut is a remainder that captures good-specific relative price variability associated with
idiosyncratic sectoral events or measurement error.
We see the empirical model in (1) as a useful way to capture the main features
of the covariance matrix of changes in the goods' prices. To the extent that the fac
tors in F, explain a significant share of the variation in the data, then changes in
goods' prices provide information on the aggregate shocks that macroeconomists care about. We separate this aggregate component of price changes into an absolute
price component and possibly several relative price components. Denoting these by the scalar at and the Rt vector of size k ? 1, respectively, this decomposition can be
written as:
Absolute price changes affect all prices equiproportionately, so 1 is an N x 1 vector
of ones, while relative price changes affect prices in different proportions according to the N x (k
? 1) matrix T. The first question this paper asks is whether the com
mon sources of variation, AF? can be decomposed in this way. One issue is that 1 may not be in the column space of A. That is, there may be
no absolute-price changes in the data. Given estimates of the factor model, we can
investigate this empirically using statistical tests and measures of fit. Another issue is that the decomposition in (2) is not unique. That is, at and Rt are not separately identified. The key source of the identification problem is easy to see. For any arbi
trary (k -
1) x 1 vector a, we have that \at + YRt = l(at + a'Rf) + (T -
Ia')R? so that (at, Rt) cannot be distinguished from (at +<x'Rf, Rt). The intuition is that the absolute change in prices cannot be distinguished from a change in "average relative
prices" ct'R?, but there are many ways to define what this average means.1 We overcome this identification problem by focusing on two independent compo
nents: "pure" inflation vt, and a low-dimensional relative price index pt defined as
(2) AF( =
\a, + TRf.
(3) vt = at- E[at\{RT}TT^}
(4) p, = ?[F,|{RXi]
1 One natural way is to assume that relative price changes must add up to zero across all goods. Reis and
Watson (2007) use this restriction to define a numeraire price index that measures absolute price changes. A fur ther identification issue in the model is that TRt
= TAA_1Rf for arbitrary nonsingular matrix A. For our purposes,
we will not need to separately identify the elements of Rr, so this final issue is not important.
This content downloaded from 94.228.80.50 on Sat, 10 May 2014 08:41:36 AMAll use subject to JSTOR Terms and Conditions

130 AMERICAN ECONOMIC JOURNAL: MACROECONOMICS JULY 2010
Pure inflation is identified, and it has a simple interpretation. It is the common
component in price changes that has an equiproportional effect on all prices and is
uncorrelated with changes in relative prices at all dates. We label it "pure" because,
by construction, its changes are uncorrelated with relative price changes at any point in time, and because it corresponds to the famous thought experiment that econo
mists have used since David Hume (1752): "imagine that all prices increase in the same proportion, but no relative price changes."2 The relative-price index captures all of the aggregate movements in goods' price changes that are associated with
some change in relative prices at some date. In an economic model, these com
ponents map into different fundamental shocks. For instance, an exogenous, but
anticipated, increase in the money supply that leads all price-setters to raise their
prices in the same proportion leads to pure inflation, while an unanticipated increase
in money to which some firms respond, but others do not, leads to a change in the
relative price index.3 In this dichotomy, inflation due to changes in the money supply that are reactions to relative price changes also lead to changes in the relative-price
index, since pure inflation is uncorrelated with any relative price change. The first contribution of this paper consists of estimating the empirical model in
(l)-(4) providing a decomposition of inflation into three independent components:
(5) 7Cr = lvt+ ?pt + ut.
Our estimates show that these three components have differed markedly over the
last 40 years, and allow us to address two issues. First, we are able to quantify the
share of inflation's variability associated with each of the components. We find that
for a typical good, its idiosyncratic relative price component accounts for roughly 70 percent of its variability, so that macroeconomic shocks account for almost as
much as one-third of the movement in sectoral prices. Within aggregate sources
of variation, pure inflation accounts for about 15-20 percent of the variability in
PCE inflation. Researchers must be cautious when comparing the predictions for
inflation from models with a single consumption good to the data, because most of
the variation in standard aggregate inflation indices is associated with relative-price
movements, which these models ignore. Second, we relate our estimates to other
variables. At business-cycle frequencies, pure inflation is barely correlated with
money growth, while it has a correlation of around 0.5 with nominal interest rates.
The relative price index is weakly related to food and energy prices, but it is strongly related to the relative price of nondurables and services. However, even considering as many as four conventional measures of relative price changes, the two relative
price factors in our baseline specification appear to be a more comprehensive mea
sure of relative price movements.
The second contribution of this paper is to re-examine the correlation between
inflation and real activity. A. W. Phillips (1958) famously first estimated it, and a vast
2 The definition of pure inflation also appears in current textbooks (Olivier J. Blanchard 2009, 31). 3 In some sticky-price models, like a Calvo model in which the frequency of price adjustments differs across
sectors, an anticipated increase in the money supply would not lead to pure inflation, as the price-setters are, by
assumption, unable to all raise their prices at once.
This content downloaded from 94.228.80.50 on Sat, 10 May 2014 08:41:36 AMAll use subject to JSTOR Terms and Conditions
VOL. 2 NO. 3 REIS AND WATSON: RELATIVE GOODS' PRICES AND PURE INFLATION 131
subsequent literature confirmed that it is reasonably large and stable (James H. Stock
and Watson 1999). This correlation has posed a challenge for macroeconomists
because it signals that the classical dichotomy between real and nominal variables
may not hold. The typical explanation for the Phillips correlation in economic mod
els involves movements in relative prices. For instance, models with sticky wages, but flexible goods prices (or vice versa), explain it by movements in the relative price of labor. Models of the transaction benefits of money or of limited participation in asset markets explain the Phillips correlation by changes in the relative price of con
sumption today vis-a-vis tomorrow, or asset returns. Models with international trade
and restrictions on the currency denomination of prices explain it using the relative
price of domestic vis-a-vis foreign goods, or exchange rates. We show that, after con
trolling for all of these relative prices, the Phillips correlation is still quantitatively and statistically significant. Then, using our estimates, we control, instead, for the relative price of different goods. This would be suggested by models with many con
sumption goods, as is the case in modern sticky-price or sticky-information models.
We find that, controlling for relative goods prices, the Phillips correlation becomes
quantitatively negligible This suggests a more important role for rigidities in goods markets and a less important role for rigidities in labor or asset markets.
This paper is organized as follows. Section I outlines the methods that we use to estimate the factor model and to compute the inflation components and their correla tion with other variables. Section II presents a stylized structural model of inflation
dynamics that generates the decomposition in equation (5) and relates its three com
ponents to fundamental economic shocks. Sections III and IV present estimates of the factor model, the factors, and their relation to observables. Section V investigates the Phillips correlation, and Section VI discusses the robustness of the conclusions in the previous two sections to different specifications. Section VII concludes, sum
marizing our findings and discussing their implications.
Relation to the Literature.?There has been much research using statistical mod els to define and measure inflation (see the survey by E. A. Selvanathan and D. S. Prasada Rao 1994) but, as far as we are aware, there have been relatively few
attempts at separating absolute from relative price changes. An important exception is Michael F. Bryan and Stephen G. Cechetti (1993), who use a dynamic factor model in a panel of 36 price series to measure what we defined above as at. They achieve identification and estimate their model imposing strong and strict assumptions on the co-movement of relative prices, in particular that relative prices are indepen dent across goods. Moreover, while they use their estimates to forecast future infla
tion, we use them to separate inflation into components and to assess the Phillips correlation.4
In methods, our use of large-scale dynamic factor models draws on the litera ture on their estimation by maximum likelihood (e.g., Danny Quah and Thomas J. Sargent 1993; and Catherine Doz, Domenico Giannone, and Lucrezia Reichlin
4 Bryan, Cecchetti, and Roisin O'Sullivan (2002) use a version of the Bryan-Cecchetti (1993) model to study
the importance of asset prices for an inflation index.
This content downloaded from 94.228.80.50 on Sat, 10 May 2014 08:41:36 AMAll use subject to JSTOR Terms and Conditions
132 AMERICAN ECONOMIC JOURNAL: MACROECONOMICS JULY 2010
2008) and principal components (e.g., Jushan Bai and Serena Ng 2002; Mario Forni
et al. 2000). We provide a new set of questions to apply these methods.
Using these methods on price data, Riccardo Cristadoro et al. (2005) estimate a
common factor on a panel with price and quantity series and ask a different ques tion: whether it forecasts inflation well. Marlene Amstad and Simon M. Potter
(2007) address yet another issue, using dynamic factor models to build measures
of the common component in price changes that can be updated daily. Marco Del
Negro (2006) estimates a factor model using sectoral PCE data allowing for a single common component and relative price factors associated with durable, nondurable, and services goods sectors. Finally, Filippo Altissimo, Benoit Mojon, and Paolo
Zaffaroni (2009) estimate a common factor model using disaggregated Euro-area
consumer prices and use the model to investigate the persistence in aggregate Euro
area inflation. The common factor in these papers is not a measure of pure inflation, since it affects different prices differently.
Closer to our paper, in the use of dynamic factor models to extract a measure of
inflation that is then used to assess macroeconomic relations suggested by theory, is
Jean Boivin, Marc P. Giannoni, and Ilian Mihov (2009). They extract a macroeco
nomic shock using many series that include prices and real quantities, estimate the
impulse response of individual prices to this shock, and then compare their shape to the predictions of different models of nominal rigidities. In contrast, we use only
price data (and no quantity data) to separate different components of inflation, so
that we can later ask how they relate to quantities. Moreover, we apply our estimates
to assess unconditional correlations of real variables with inflation, whereas they focus on the link conditional on identified monetary shocks. Finally, we separate relative prices and pure inflation, while their inflation measure is a mix of the two, so we ask a different set of questions.
I. Measuring the Components of Inflation and Calculating Macro-Correlations
The model in (l)-(4) is meant to capture the key properties of the inflation series
as they pertain to the estimation of their separate components, with an eye on the
applications that we discussed in the introduction. We use a factor model for the
covariance between sectoral inflation rates because past research focusing on the
output of different sectors, and macroeconomic variables more generally, found that
this model is able to flexibly and parsimoniously account for the main features of the
economic data (Stock and Watson 1989, 2005, Forni et al. 2000).
A. Estimating the Dynamic Factor Model
The strategy for estimating the model can be split in two steps. First, we choose
the number of factors (k). Second, we estimate the factors [at, R,) and the factor load
ings (r), and examine the restriction that the factor loading on at is equal to unity. We discuss each of these in turn.
Choosing the number of factors, that is the size k of the vector F? involves a trade
off. On the one hand, a higher k implies that a larger share of the variance in the data
is captured by the aggregate components. On the other hand, the extra factors are
This content downloaded from 94.228.80.50 on Sat, 10 May 2014 08:41:36 AMAll use subject to JSTOR Terms and Conditions

VOL. 2 NO. 3 REIS AND WATSON: RELATIVE GOODS' PRICES AND PURE INFLATION 133
increasingly harder to reliably estimate and are less quantitatively significant. Bai and
Ng (2002) have developed estimators for k that are consistent (as min(iV, r) ?
oo) in models such as this. We compute the Bai-Ng estimators, which are based on the
number of dominant eigenvalues of the covariance (or correlation) matrix of the data.
We complement them by also looking at a few informative descriptive statistics on
the additional explanatory power of the marginal factor. In particular, we estimate an
unrestricted version of (1) that does not impose the restriction in (2) that the first factor has a unit loading. We start with one factor and successively increase the number of
factors, calculating at each step the incremental share of the variance of each good's inflation explained by the extra factor. If the increase in explained variance is large
enough across many goods, we infer it is important to include at least these many fac
tors. These pieces of information lead us to choose a benchmark value for k. In Section
VI, we investigate the robustness of the results to different choices of k.
To estimate the factor model, we follow two approaches. The first approach esti
mates (l)-(2) by restricted principal components. It consists of solving the least
squares problem
N T
(6) minr>,R) E wi E fat ~at~ nf/R*)2. i=\ t=\
where % denotes the /'th row of T (from (2)) and wt are weights. We set wt equal to the inverse of the sample variance of ixit, so that the solution to (6) yields the
restricted principal components associated with the sample correlation matrix of the
inflation series (C. Radhakrishna Rao (1973, section 8g.2). When N and T are large, and the error terms uit are weakly cross-sectionally and serially correlated, the prin
cipal components/least squares estimators of the factors have two important statisti
cal properties that are important for our analysis (Stock and Watson 2002; Bai 2003; Bai and Ng 2006). First, the estimators are consistent. Second, the sampling error in the estimated factors is sufficiently small that it can be ignored when the estimates,
say at and R,, are used in regressions in place of the true values of at and Rt. The second approach makes parametric assumptions on the stochastic properties
of the three latent components (at, R? and uit), estimates the parameters of the model
by maximum likelihood, and then computes estimates of the factors using signal extraction formulae. In particular, we assume that (at, Rf) follow a vector autore
gression, while uit follow independent autoregressive processes, all with Gaussian
errors.5 The resulting unobserved-components model is
(?)
(8)
T.7 = a, + fi'Rt + "ir
*(L)
5 One concern with assuming Gaussianity is that disaggregated inflation rates are skewed and fat-tailed. In
general, skewness is not a major concern for Gaussian MLEs in models like this (Watson 1989), but excess kur tosis is more problematic. To mitigate the problem, we follow Bryan, Cecchetti, and Rodney L. Wiggins II (1997) and pre-treat the data to eliminate large outliers (Section III has specifics).
This content downloaded from 94.228.80.50 on Sat, 10 May 2014 08:41:36 AMAll use subject to JSTOR Terms and Conditions

134 AMERICAN ECONOMIC JOURNAL: MACROECONOMICS JULY 2010
(9)
with {eit}, {ejt}j^ {e} being mutually and serially uncorrelated sequences that are
normally distributed with mean zero and variances var(eit) =of and rar(e,) = Q.
To identify the factors, we use the normalization that the columns of T are mutually
orthogonal and add up to zero, although the estimates of vt and pt do not depend on
this normalization.
Numerically maximizing the likelihood function is computationally complex because of the size of the model. For example, our benchmark model includes at and two additional relative price factors, a VAR(4) for (8), univariate AR(1) mod els for the {wiY}, and N = 187 price series. There are 971 parameters to be estimat
ed.6 Despite its complexity, the linear latent variable structure of the model makes
it amenable to estimation using an EM algorithm with the "E-step" computed by Kalman smoothing and the "M-step" by linear regression. The Web Appendix to
this paper describes this in more detail.
While this exact dynamic factor model (7)-(9) is surely misspecified?for instance, it ignores small amounts of cross-sectional correlation among the uit terms, conditional heteroskedasticity in the disturbances, and so forth?it does capture the key cross sectional and serial correlation patterns in the data. Doz, Giannone, and Reichlin (2008) study the properties of factors estimated from an exact factor structure as in (7)-(9) with parameters estimated by Gaussian MLE, but under the
assumption that the data are generated from an approximate factor model (so that
(7)-(9) are misspecified). Their analysis shows that when TV and T are large, the factor estimates from (7)-(9) are consistent despite potential misspecification in the
model.
We carry out our analysis using the principal components estimates of the factors
and the estimates from (7)-(9). To save space, unless noted otherwise, the results
reported in Sections III-V are based on the estimates from the parametric factor
model (7)-(9). Results with the principal components estimates of the factors are
shown in Section VI, which focuses on the robustness of the empirical conclusions.
The model in (l)-(2) imposes the restriction that the loading on the absolute-price factor must be one for all goods. To investigate how restrictive this is, we calculate
the increase in fit that comes from dropping the restriction, measured as the fraction
of (sample) variance of ̂ explained by the factors. Moreover, we estimate the value
of q in the N regressions:
using at and R, in place of at and R? as explained above. When ^ = 1, this cor
responds to our restricted model, so we can use the estimates of ^ to judge how
adequate is this restriction.
(10)
6 The number of unknown parameters is 186 + 185(7,) + 187(A) + 187(c,-) + 187(var (?, )) + 36($) +
3(var(e)) = 971, where these values reflect the normalizations used for identification.
This content downloaded from 94.228.80.50 on Sat, 10 May 2014 08:41:36 AMAll use subject to JSTOR Terms and Conditions

VOL. 2 NO. 3 REIS AND WATSON: RELATIVE GOODS' PRICES AND PURE INFLATION 135
B. Computing the Aggregate Components of Inflation
To separate the components of inflation and obtain time-series for pure infla
tion and the relative-price index (vt, pf), we need to calculate the expectation of absolute-price changes conditional on relative-price changes in (3)-(4). This
requires a model of the joint dynamics of at and Rt. We model this as a VAR, as
in (8), which is estimated by Gaussian MLE in the parametric factor model, or by OLS using the principal-component estimators for the factors as in the two-step
approach taken in factor-augmented VARs (Ben S. Bernanke, Boivin, and Piotr
Eliasz 2005). Finally, given estimates of 3>(L), we compute the implied projection in (3) and (4) to obtain pure inflation and the relative-price index. Details are pro vided in the Web Appendix.
C. Computing Macro-Correlations at Different Frequencies
As described in the introduction, we are interested in the relationship between
pure inflation and the relative-price index, vt and pt, and other macro variables such
as the PCE deflator, food and energy prices, the unemployment rate, or the nominal
interest rate. Let xt denote one of these macro variables of interest and consider the
projection of xt onto leads and lags of vt (or p,)
(11) xt = 6(L)vt + et.
The fraction of variability of xt associated with {v} (or {pJ) can be computed as the R2 from this regression. Adding additional control variables, say z0 to the regres sion makes it possible to compute the partial R2 of x with respect to leads and lags of
vt (or pt) after controlling for zt. We will compute frequency-domain versions of these variance decompositions
and partial R2,s (squared coherences or partial squared coherences). One of their
virtues is that they allow us to focus on specific frequency bands, like business
cycle frequencies. Another virtue is that they are robust to the filter used to define
the variables (e.g., levels or first differences). In particular, we report the squared coherence (the R2 at a given frequency) between x and v (or p) averaged over vari ous frequency bands. When it is relevant, we also report partial squared coherences
controlling for (leads and lags) of a vector of variables z (the partial R2 controlling for z at a given frequency), again, averaged over various frequency bands.
We are also interested in the relationship between Rt and standard measures of
relative prices, such as the relative price of consumer durables, food, energy, and so forth. Let qt denote a vector of these variables. We summarize the correlation between R and q using canonical correlations, again implemented using frequency domain methods. In particular, we report the squared canonical coherences between R and q averaged over various frequency bands.
These various spectral R2 measures are computed using VAR spectral estimators, where the VAR is estimated, in the first instance, using xt, dt, Rf, and (if appropri
ate) z? and in the second instance using Rt and qt. The standard errors for the spec tral measures are computed using the delta-method and a heteroskedastic-robust
This content downloaded from 94.228.80.50 on Sat, 10 May 2014 08:41:36 AMAll use subject to JSTOR Terms and Conditions

136 AMERICAN ECONOMIC JOURNAL: MACROECONOMICS JULY 2010
estimator for the covariance matrix of the VAR parameters. Details are provided in
the Web Appendix.
II. A Theoretical Framework
The statistical decomposition in (5) expresses 7rit in terms of three components: vf, which we have labeled pure inflation; p? which is a function of aggregate relative
price shocks; and uivt which captures sector-specific relative price changes or mea
surement error. Structural macro models give rise to an analogous representation for
inflation, where the components depend on the various shocks in the macro model.
The specifics of the structural model determine the relative variances of the com
ponents and their correlation with nonprice variables such as real output, money, interest rates, and so forth.
This section presents a simple economic model of inflation that relates key struc
tural shocks to the statistical constructs v, p, and u. The goal is to help guide the
reader's intuition about the forces underlying the statistical factors that we estimate, so the model is kept as simple as possible. We believe that its main conclusions are
robust to the specific modeling choices (like the source of nominal rigidities, or the
particular functional forms), and that this model could serve as the starting point for
a more structural empirical analysis of inflation's components in future work.
A. The Model
The general-equilibrium setup follows Blanchard and Nobuhiro Kiyotaki (1987) and Michael Woodford (2003) allowing for many sectors. A representative con
sumer maximizes
(12) OO / J l+lf)
where 6 < 1 is the discount factor, and ip is the elasticity of labor supply. Total labor
supplied is L? and Ct is a consumption aggregator with elasticity 7 across N sectors,
indexed by /, and across a continuum of varieties within each sector, indexed by j:
1 / N \7/(7-l) / f \7/(7"l)
(13) Ct = ^"1/7E C^-^J
, with C, = y
Cit(j)^ dj
At every date, the consumer purchases each good at price Pit(j) for a total spend
ing of St = Ei /PitU) Cit(j) dj, earns a wage Wt for labor services, and pays taxes at rate Tt. She has three other sources of income that are lump-sum: profits Dt from
firms, transfers Gt from the fiscal authorities, and money injections Ht from the
monetary authority. Finally, the consumer holds money Mt to save and to purchase
consumption goods. The budget and cash-in-advance constraints are
(14) S, + M,= (l- Tt) WtL, + M,_, + D,+ G,+ H?
This content downloaded from 94.228.80.50 on Sat, 10 May 2014 08:41:36 AMAll use subject to JSTOR Terms and Conditions

VOL. 2 NO. 3 REIS AND WATSON: RELATIVE GOODS' PRICES AND PURE INFLATION 137
(15) St<Mt_{ + Ht.
Firms are monopolistically competitive, each hiring labor Lit(j) to produce out
put Yit(j) with productivity Xit(j) subject to decreasing returns to scale at rate rj < 1:
(16) Yit(j) = Xit{j)Lit(jy.
Finally, the two government authorities simply return their funds to consumers, so that Ht= Mt- Mt_i and Gt
= TtWtLt. Market clearing in the goods and labor
market require Yit(j) =
Cit(j) andL, = ?f / Lit(j) dh respectively. In this simple economy, there is uncertainty about taxes Tt9 the money supply
Mt, and productivity Xit(j), each of which depends on shocks. Letting small letters
denote the natural logarithm of the corresponding capital letters:
(17) xit{j) = x + Zit(j) + Xit+Oitt
(18) mt=mt + ut+ fjbt+ wQt
(19) \n(l-Tt) = t-rt.
The six independent shocks (in Greek letters with time subscripts) are: firm
specific productivity (?), sectoral productivity (x), aggregate productivity with a
sector-specific impact (?), anticipated monetary policy (a;), unanticipated monetary policy (/i), and anticipated tax changes (r). In (18), note that the monetary policy rule
responds systematically to productivity shocks. For simplicity, we assume that each
shock follows an independent random walk, and that the variety-specific and sector
specific shocks approximately average to zero in each time period, f0 iit{j)dj ? 0 for all / and N~l Ya=\ Xu ~ 0. We further assume that mt grows over time at a rate m that is large enough so that SEt(Mt/Mt+1) < 1, ensuring that the cash-in-advance constraint always binds.
We model price rigidity through imperfect information as in Robert E. Lucas, Jr. (1973) and N. Gregory Mankiw and Reis (2002). In particular, we assume that at the beginning of every period, all firms learn about the past values of the six shocks, as well as the current values of the anticipated fiscal and monetary shocks.
However, only a randomly drawn fraction 0f of firms in each sector observe the contemporaneous realization of the other four shocks before making their
pricing decisions. The remaining 1 - qbi fraction of firms learn these shocks only in the following period, and we denote their expectations with this incomplete information by ?( ). This assumption of imperfect information has a long tradition in macroeconomics (Woodford 2003, chapter 3, labels it the "neoclassical" case) and is in line with the recent work on sticky-information Phillips curves.
This content downloaded from 94.228.80.50 on Sat, 10 May 2014 08:41:36 AMAll use subject to JSTOR Terms and Conditions

138 AMERICAN ECONOMIC JOURNAL: MACROECONOMICS JULY 2010
The Web Appendix solves for the equilibrium in this economy, showing that it can be reduced to the following equations for pit, pt, and yt (ignoring constants):
(20) pit =</>i[pt+a(yt -
xt) + nr]rt -
k(xu -
*,)]
+ (1 -
</>/) E[ pt + a(yt -
xt) + Ki)Tt -
k{xu -
*,)],
(21) Pt=N~ltpin
(22) mt = pt+yn
where a and k are two positive parameters that depend on the preference and pro duction parameters, xit = J xit(j) dj is sectoral productivity and xt
? N~l Ya=i xit is
average productivity. The first equation is the fundamental pricing equation in new
Keynesian models, relating sectoral prices to marginal costs, which, in this model, depend on aggregate output, sectoral productivity, and taxes. The second equation is a log-linear approximation to the static cost-of-living price index, which we denote
by pt. The third equation is the quantity theory relation that follows from the cash in-advance constraint. This basic reduced-form structure is shared by many modern
models of inflation dynamics. A few steps of algebra show that sectoral price changes in this economy follow
the same linear dynamic factor model in (5), itt ?
\vt + ?pt + ut, that we will esti mate in the data. The three components are:
(23) ut= Aw(+^Ar(,
(24) 0iPr = A/x,_, + ( 7' )A2/x, ,1 ? (1 ?
a)(p,
a(0 -
w) + 0(1 -
a)(l -
0)(a -
?)\a2/ \ 1 ? (1
? a)(f)
-K^-^^Ac+a-^Ac,.,],
(25) uit = -K(<j)iXll+ (1 -
4>,)Axu-i),
where 9 and $~ are the sectoral averages of #, and 4>h respectively, A = (1
- L) is the
first-difference operator, and ?, on the left-hand side of (24) denotes the factor load
ing for 7r?. Aggregate output in turn is
(26) yt = 1
L 1 - (1 -
a)</> An,
a+ k{6 -
1) 1 - (1
- a)<j>
AC.
This content downloaded from 94.228.80.50 on Sat, 10 May 2014 08:41:36 AMAll use subject to JSTOR Terms and Conditions

VOL. 2 NO. 3 REIS AND WATSON: RELATIVE GOODS' PRICES AND PURE INFLATION 139
Table 1?Fundamental Shocks, Inflation Components, and The Phillips Correlation
Fundamental shocks Inflation component Phillips correlation?
Anticipated money (u) v No
Unanticipated money (//) p Yes
Aggregate productivity (Q p Yes
Sectoral productivity (x) u No
Firm-level productivity (?) 0 No
Anticipated tax changes (r) v Yes
B. Relation between the Theory and the Estimates
We ask, in the model, the same two questions that we will ask in the data: what
part of price changes is due to pure inflation, relative-price aggregate shocks, and
idiosyncratic shocks? And, which shocks account for the Phillips correlation between
real activity and inflation? We answer these questions shock by shock (Table 1 sum
marizes the results).
Anticipated Money (uj).?When money grows by 1 percent and all price-setters know about it, then all raise their prices by exactly 1 percent once and for all. No
relative prices change, and there is pure inflation. The quantity theory implies that
output is unchanged so there is no Phillips correlation. This is a result of the absence of money illusion in this model, as rational consumers and firms realize that nothing but monetary units have changed, so there is no reason to change any real actions.
Unanticipated Money (ju).?In this case, only a fraction 0f of the firms in each sector change their prices in response to a shock, while the others remain inatten tive. As a result, sectoral inflation is different across sectors, depending on the share of attentive firms in each sector, so there is an aggregate relative-price change. A
monetary expansion raises output, because of the information stickiness of prices, and there is a Phillips correlation.
Aggregate Productivity (C).?This shock has a similar effect as an unanticipated money shock, both through its direct effect and through the systematic response of
monetary policy. Either because it affects the productivity of different sectors differ
ently, or because of different information stickiness across sectors, the shock induces a change in relative prices. Output increases when firms become more productive so there is a Phillips correlation.
Sectoral Productivity (x).?These shocks map directly into the idiosyncratic shocks to relative prices in our measurement model. Because we assumed that an
approximate law of large numbers holds, they do not affect output, so they do not
generate a Phillips correlation.
This content downloaded from 94.228.80.50 on Sat, 10 May 2014 08:41:36 AMAll use subject to JSTOR Terms and Conditions

140 AMERICAN ECONOMIC JOURNAL: MACROECONOMICS JULY 2010
Firm-Specific Productivity (?).?These shocks are an example of something that the statistical model will miss. While these shocks induce relative-price changes
within each sector, they wash out at the sectoral level, so they do not affect relative sectoral prices. Likewise, while they affect the allocation of production across firms
within each sector, they average out in the aggregate, so they neither move aggregate output nor prices. Whether these shocks are important or not cannot be answered without more disaggregated data.
Anticipated Tax Changes (r).?When taxes increase, the representative agent raises her wage demand. As this affects all firms equally, all raise their price in the same amount. Therefore, there is pure inflation. However, output falls as the return to
work has fallen. The Phillips correlation results not from a change in the relative price of goods, but rather from a change in the relative price of labor versus consumption.
To conclude, our empirical estimates are informative about the role of different
shocks in this economy. Our first empirical contribution, the estimates of the vari
ability of overall inflation due to pure inflation, aggregate sources of relative prices, and idiosyncratic shocks, pins down the relative variance of anticipated versus
unanticipated shocks and of aggregate versus sectoral shocks.7 Our second empiri cal contribution, whether the Phillips correlation is still present after we control for
goods' relative prices, tells us whether this famous relation is due to monetary and
productivity shocks via goods' relative prices, as models of monopolistic competi tion emphasize, or whether it is due instead to shocks to other relative prices like
real wages.
III. The Estimated Factor Model
A. The Data
The price data are monthly chained price indices for personal consumption
expenditures by major type of product and expenditure from 1959:M1 to 2006:M6.
Inflation is measured in percentage points at an annual rate using the final month
of the quarter prices: nit = 400 x \n{Pit/Pit_x), where Pit are prices for March, June,
September, and December.8 Prices are for goods at the highest available level of
disaggregation that have data for the majority of dates, which gives 214 series. We
then excluded series with unavailable observations (9 series), more than 20 quar ters of 0 price changes (4 series), and series j if there was another series i such
that Corfo,, njt) > 0.99 and Cor(A7rl7, Anjt) > 0.99 (14 series). This left N = 187
price series. Large outliers were evident in some of the inflation series, and these
7 Our definition of pure inflation only allows us to gauge the relative variance of the unsystematic parts of
money supply. To identify the policy rule, in this case, the coefficient w requires more structure just as in the VAR
literature on identifying monetary policy shocks. Also, as in that literature, a small role for pure inflation should not be confused for a small role for monetary policy. 8 We considered using monthly, rather than quarterly, price changes, but found that the extra idiosyncratic error in monthly price changes outweighed the benefit of more observations.
This content downloaded from 94.228.80.50 on Sat, 10 May 2014 08:41:36 AMAll use subject to JSTOR Terms and Conditions
VOL. 2 NO. 3 REIS AND WATSON: RELATIVE GOODS' PRICES AND PURE INFLATION 141
observations were replaced with centered seven-quarter local medians. A detailed
description of the data and transformations is given in the Web Appendix. As the economic model from Section II makes clear, the level of aggregation
across goods and time affects the interpretation of the estimated model. For exam
ple, as stressed in Section II, the sectoral data provide no information about the
relative prices of goods within a sector. The hope, therefore, is that the sectoral
information is rich enough to capture important aggregate shocks. Furthermore, as with all models of information flows and discrete actions, the definition of the
appropriate time period is important. The use of quarterly data means, for exam
ple, that equiproportional changes in all sectoral price indexes within the quarter are included in at, even if these changes occur at different times throughout the
quarter. Said differently, the relative price factors, Rr, capture only those relative
price changes that persist for at least one quarter. Because most macroeconomic
analyses focusing on aggregate shocks use quarterly data, we are not departing from tradition.
One feature of these data is the constant introduction of new goods within each sector (Christian Broda and David E. Weinstein 2007). Insofar as our statistical fac tor model of sectoral price changes remains a good description of their co-movement
during the sample period, this should not affect our results. Another common con cern with price data is the need to re-weight prices to track expenditure shares and
measure their effects on welfare. Our model in (l)-(5) does not require any expendi ture shares, since the objective of measuring pure inflation is not to measure the cost
of living, but rather to separate absolute from relative price changes.
B. The Number of Factors and the Estimated Parameters
Panel A of Figure 1 shows the largest 20 eigenvalues of the sample correlation matrix of the inflation data. It is clear that there is one large eigenvalue, but it is much less clear how many additional factors are necessary. The Bai-Ng (Bai and
Ng 2002) estimates confirm this uncertainty. Their ICPh ICP2, and ICP3 estimates are 2 factors, 1 factor, and 11 factors, respectively. Panel B of Figure 1 summarizes the fraction of variance explained by unrestricted factor models with 1-4 factors for each of the 187 inflation series.9 To make the figure easier to read, the series have been ordered by the fraction of variance explained by the 1-factor model. The
uncertainty in the appropriate number of factors is evident here as well. The second factor improves the fit for several series, but it is unclear whether a third, fourth, or fifth factor is necessary. In our benchmark model, we will use 3 factors {at and two relative price factors in R,). We summarize the key results for other choices in Section VI.10
9 These measures were computed as R?
= 1 - [ var(wl-)/^.], where var(w,) is the estimated variance of w( from the estimated model, and si. is the sample variance of 7rf. 10 There is also uncertainty about the number of dynamic factors, which corresponds to the rank of the cova riance matrix of e in (8). The estimator developed in Bai and Ng (2007) indicates that the number of dynamic factors is the same as the number of static factors, while the estimators discussed in Dante Amengual and Watson
(2007) and Marc Hallin and Roman Liska (2007) suggest one dynamic factor. In our parametric model, we will not constrain the rank of the covariance matrix of e.
This content downloaded from 94.228.80.50 on Sat, 10 May 2014 08:41:36 AMAll use subject to JSTOR Terms and Conditions

AMERICAN ECONOMIC JOURNAL: MACROECONOMICS JULY 2010
Panel A. Eigenvalues of the correlation matrix
45
1 2 3 5 6 7 8 9 10 11 12 13 14 15 16 17 18 19 20
Panel B. Contribution of more factors to the R2 of each good 1
ik = 3
Figure 1. Choosing the Number of Factors
Notes: Panel A shows the eigenvalues of the N x TV sample correlation matrix of inflation rates. Panel B shows the fraction of sample variance of inflation explained by k factors, where k var ies from k ? 1 to k = 4. The horizontal axis in panel B goes from i
? 1 to i = 187, where the
series are ordered by the fraction of variance explained by the first factor.
This content downloaded from 94.228.80.50 on Sat, 10 May 2014 08:41:36 AMAll use subject to JSTOR Terms and Conditions

VOL. 2 NO. 3 REIS AND WATSON: RELATIVE GOODS' PRICES AND PURE INFLATION 143
We use the parametric factor estimates from (5)-(7) in our benchmark calcu
lations. Results using the principal components estimators are similar and are
summarized in Section VI. The VAR for the factors in the benchmark specification uses four lags, guided by a few diagnostic tests (not reported). It is well-known that
inflation series are quite persistent, and it is difficult to reject the null hypothesis that
they have a unit root in the autoregressive representation (Frederic Pivetta and Reis
2007). When we estimate the VAR in (6), we find that there are several large roots
in <?(L), and one that is very close to unity. In our benchmark model, we impose two
unit roots in <fr(L). That is, at and one of the relative price factors are treated as 1(1)
processes. Results in which these unit roots are not imposed turn out to be very simi
lar, and, again, we summarize results for these models in Section VI. Finally, we use
only one lag in the univariate autoregressions of uit, as suggested by diagnostic tests.
The estimated AR(1) coefficients for uit are typically small, suggesting 1(0) variation in the idiosyncratic relative inflation rates.
Values for the estimated parameters for the benchmark model are given in the
Web Appendix.
C. The Unit Coefficient on at
Panel A of Figure 2 summarizes the fit of unrestricted factor models that do
not impose the unit restriction on the loading of the absolute-price factor. It shows
that the increase in fit, measured by R2 is less than 3 percent for 80 percent of the
series. The median increase is less than 1 percent. The unrestricted model appears to fit appreciably better only for a small number of price series. For 10 series, the
increase in R2 exceeds 10 percent. Panel B of Figure 2 shows the ordered values of
the estimates of ^ from (10). That is the least-squares coefficient from regressing
irit on at controlling for Rt. Most of the estimates are close to one. Panel C shows
the ordered values of the (4-lag Newey-West) ^-statistic testing that qt= 1. There are
far more rejections of the restriction than would be expected by sampling error, with
over 30 percent of the ^-statistics above the standard 5 percent critical values and over
20 percent above the 1 percent critical values. These results suggest that, as a formal
matter, the unit factor loading restriction in (2) appears to be rejected by the data. That
said, the results in panels A and B suggest that little is lost by imposing this restriction.
IV. Decomposing Sectoral Inflation
Figure 3 shows the historical decomposition of headline PCE inflation (top panel) and a representative sector, "major household appliances" (bottom panel). By con
struction, the pure-inflation (v) component is identical in the two plots (note the
difference in the scales), while the idiosyncratic (u) component differs across goods, and the aggregate relative prices component (p) differs in its impact (0). Because vt = at
- E[at\{RT}l=l], we have plotted the data from 1965-1999 to eliminate
uncertainty associated with pre-sample and post-sample values of Rt. Pure inflation is somewhat smoother than the other series and less volatile. The
standard deviation of Avt is 0.3 percent, while the standard deviation of PCE infla
tion changes is 1.7 percent. Sectoral inflation is more volatile. The standard deviation
This content downloaded from 94.228.80.50 on Sat, 10 May 2014 08:41:36 AMAll use subject to JSTOR Terms and Conditions

144 AMERICAN ECONOMIC JOURNAL: MACROECONOMICS JULY 2010
Panel A. Increase in R2 from moving to unrestricted model
Panel B. Estimates of $jt the coefficient on the absolute-price component
Panel C. Individual f-statistics for hypothesis c, = 1
-4
Figure 2. Comparison with Unrestricted Factor Model
Notes: The horizontal axis in each panel goes from / = 1 to / = 187. In each panel, the goods are organized in increasing order.
This content downloaded from 94.228.80.50 on Sat, 10 May 2014 08:41:36 AMAll use subject to JSTOR Terms and Conditions

VOL. 2 NO. 3 REIS AND WATSON: RELATIVE GOODS' PRICES AND PURE INFLATION 145
Panel A. Headline PCE inflation (demeaned)
10
-6 I_,_,_,_,_,_,_I 1965 1970 1975 1980 1985 1990 1995 2000
Panel B. Major household appliances inflation (demeaned)
1965 1970 1975 1980 1985 1990 1995 2000
Figure 3. Estimates of Inflation and its Components
for changes in "major household appliances" is 4.1 percent, and the median across
all 187 sectors is 5.9 percent. Evidently, aggregate relative price changes (p) explain much of the low-frequency variability in headline PCE. For example, much of the increases in inflation in the early 1970s and the declines in inflation in the 1990s
were associated with changes in the relative price factor. That said, pure inflation (v) did account for over 2 percent of the increase in inflation from 1970-1980, and over
2 percent of the subsequent decline from 1980-1983.
A. The Relative Size of the Components
Table 2 shows the fraction of the variability of overall inflation associated with each of its components, either averaged over all frequencies or just over business-cycle frequencies. The first row of the table uses the PCE deflator as the measure of overall inflation and shows that, at business-cycle frequencies, 15 percent of the movements
This content downloaded from 94.228.80.50 on Sat, 10 May 2014 08:41:36 AMAll use subject to JSTOR Terms and Conditions

146 AMERICAN ECONOMIC JOURNAL: MACROECONOMICS JULY 2010
Table 2?Fraction of Variability of Inflation Associated with Aggregate Components
(Average squared coherence over frequencies (standard errors in parenthesis))
All frequencies tt/32 < u < -k/6
Inflation measure p? vt
Aggregate inflation rates
Headline PCE 0.51 (0.05) 0.16 (0.04) 0.76 (0.10) 0.15 (0.07) Headline GDP 0.35 (0.06) 0.21 (0.04) 0.71 (0.11) 0.15 (0.07)
Headline CPI 0.47 (0.04) 0.12 (0.03) 0.76 (0.09) 0.15 (0.06) Core PCE 0.32 (0.05) 0.24 (0.05) 0.69 (0.11) 0.21 (0.09) Median CPI 0.39(0.08) 0.14(0.04) 0.64(0.13) 0.18 (0.08)
187 Sectoral inflation rates
25th percentile 0.13 0.03 0.15 0.02
Median 0.19 0.05 0.25 0.05
75th percentile 0.25 0.07 0.42 0.08
Notes: PCE is the Personal Consumption Expenditures deflator, GDP is the Gross Domestic Product deflator, and CPI is the Consumer Price Index. Median CPI inflation is from the Federal Reserve Bank of Cleveland and these data are available for t > 1967:2. For the last three rows, we computed the fraction of variability explained by pure inflation for each of the 187 goods' series, and report the 25, 50, and 75 percent values.
in the series are accounted for by pure inflation, 76 percent is accounted for by the
relative-price index, and the remainder is accounted for by the idiosyncratic sectoral
shocks. The second and third row look at two other commonly used measures of
overall inflation, the GDP deflator and the Consumer Price Index, and show similar
results. The two-dimensional relative-price index captures most of the variance in
aggregate measures of inflation, while pure inflation plays a smaller, but not negligi ble, role. Including all frequencies, the role of pure inflation rises (with the exception of the CPI), while the relative-price index is significantly less prevalent.
These results have implications for macroeconomic models. For example, in terms
of the model of Section II, this 5-to-l ratio in the relative variances of the relative
price index and pure inflation would say that a weighted average of the variance of
anticipated shocks is significantly less volatile than an average of the unanticipated shocks. More generally, it is customary to compare the predictions of models with a
single good for inflation with, for example, the data on the PCE deflator. The results
in Table 2 show that it is dangerous to do so since as much as 85 percent of the move
ments in the PCE deflator are driven by changes in the relatives prices of different
goods. For some questions, it might be better to compare the predictions of these
models with our estimated series for pure inflation.
Two common approaches to strip relative-price movements from inflation are to
exclude the prices of food and energy or to look at the median inflation across the
different sectors. The next two rows in Table 2 show that these rough attempts at
controlling for relative price changes go in the right direction, but remain quite far
from excluding all relative price changes. Core inflation is less closely tied to the
relative price index and more related to pure inflation, but the squared coherences
are still only slightly different, 69 percent and 21 percent, respectively. For median
This content downloaded from 94.228.80.50 on Sat, 10 May 2014 08:41:36 AMAll use subject to JSTOR Terms and Conditions

VOL. 2 NO. 3 REISAND WATSON: RELATIVE GOODS' PRICES AND PURE INFLATION 147
Table 3?The Components of Inflation and Other Observables
(Average squared canonical coherence over frequencies (standard errors in parenthesis))
Frequencies
Observable All tt/32 < uj < tt/6 Panel A. Relative-price index p,
Durables 0.42 (0,06) 0.58 (0.09)
Nondurables 0.47 (0.05) 0.72 (0.09)
Services 0.48 (0.05) 0.75 (0.08) Food 0.20(0.05) 0.55 (0.14)
Energy 0.30(0.05) 0.37 (0.11) Food, energy 0.53 (0.04) 0.06 (0.03) 0.78 (0.08) 0.10 (0.08) Durables, nondurables, food, energy 0.62 (0.04) 0.25 (0.04) 0.87 (0.05) 0.42 (0.10)
Panel B. Pure inflation vt
M0 0.04 (0.02) 0.01 (0.02) Ml 0.06 (0.03) 0.01 (0.02) M2 0.03 (0.02) 0.01 (0.02)
Federal funds rate 0.11 (0.04) 0.27 (0.10) 3-month T-bill rate 0.12 (0.03) 0.27 (0.12)
Term spread (10Y-3month) 0.08 (0.04) 0.27 (0.11)
CPI inflation, the idiosyncratic component is higher, but the two aggregate compo nents are also only slightly lower.
The last section of Table 2 summarizes the distribution of variance decomposi tions for the 187 sectoral inflation rates. Looking at the twenty-fifth and seventy-fifth
quartiles, the relative price index accounts for between 15 percent and 42 percent of
the business-cycle variability of sectoral inflation rates, and pure inflation between 2
percent and 8 percent. As expected, the idiosyncratic relative price shocks account for a much bigger share of sectoral price movements than they do for aggregate inflation
measures. More remarkable, at the median, almost one-third of relative price move ments at the sectoral level are accounted for by the aggregate measures of pure infla tion and the two-dimensional relative price index. Using sectoral price data, these
findings confirm a result found for different macroeconomic datasets, countries, and time periods. A few aggregate factors (in our case three) can account for a large share of the variability in the economy (Stock and Watson 1989, 2005; Forni et al. 2000).
B. Components of Inflation and Other Observables
Table 3 compares the two-dimensional index of relative prices with several con ventional measures of relative price changes. In the first row is the change in the
price of durables relative to the headline PCE. The squared canonical coherence of this measure of relative prices with the relative price factors is high, around 0.5, but this single indicator falls short of capturing all of the variability in relative prices. The next two rows look at the relative prices of nondurables and services. The link between these and the two relative price factors is higher, but they are still quite far from being a comprehensive indicator for relative price changes. The next two rows
This content downloaded from 94.228.80.50 on Sat, 10 May 2014 08:41:36 AMAll use subject to JSTOR Terms and Conditions

148 AMERICAN ECONOMIC JOURNAL: MACROECONOMICS JULY 2010
Panel A. Relative services inflation (thick line) and projection onto p (thin line)
-4 I_,_,_,_ _ _,_,_,_I 1960 1965 1970 1975 1980 1985 1990 1995 2000 2005
Panel B. Relative energy inflation (thick line) and projection onto p (thin line) 80 I-?-1-'- - - -
60 h
1960 1965 1970 1975 1980 1985 1990 1995 2000 2005
Figure 4. The Relative Price Index and Other Observables
show the relative price of food and energy, popular measures of relative-price shocks
in the macro literature. These are still statistically significant, but they perform
significantly worse. In spite of the attention devoted to the price of energy, Table 3
suggests that it can account for only roughly one-third of the relative price shocks
hitting the US economy at business cycle frequencies.
Figure 4 illustrates these results by showing the projection of the change in the relative prices of services and energy onto two leads and lags of R? the estimated
vector of relative price factors. For services, the regression's adjusted R2 is 0.56, but
for energy it falls to 0.22. Both series can deviate quite significantly from the relative
price index, but energy prices provide a particularly poor fit to the aggregate move
ments in relative prices. Table 3 indicates that combining food and energy captures a larger share of the
movements in relative prices, but still only comparable to the share accounted for by
This content downloaded from 94.228.80.50 on Sat, 10 May 2014 08:41:36 AMAll use subject to JSTOR Terms and Conditions

VOL. 2 NO. 3 REIS AND WATSON: RELATIVE GOODS' PRICES AND PURE INFLATION 149
services. Finally, the resulting four-dimensional index of relative prices (durables, nondurables, food and energy) can only account for, at most, 87 percent of the
variability of relative prices captured by the two relative price factors. These results
suggest that, given its parsimony and comprehensiveness, the two relative price fac
tors estimated from the statistical model provide a useful summary of relative price shocks in the US economy.
The bottom panel of Table 3 investigates the correlation of pure inflation with
measures of monetary policy and the term spread. Milton Friedman and Anna
Jacobson Schwartz (1963) famously observed that in the long run, money growth and inflation are tightly linked. Equally famously, Irving Fisher (1930) and many that followed showed that there is an almost as strong link between nominal inter
est rates and inflation in the long run. At business-cycle frequencies though, these
correlations are much weaker. The correlation between money growth and infla
tion is unstable and typically low (Stock and Watson 1999), while the correlation
between inflation and nominal interest rates is typically higher, but well below its
level at lower frequencies (Frederic S. Mishkin 1992). Panel B of Table 3 shows
the average squared coherence of pure inflation and measures of money growth
(MO, Ml, and M2) and different short-term nominal interest rates (the federal
funds rate and the 3-month Treasury bill rate). The correlation between money
growth and pure inflation is very close to zero for all measures. The correlation
between nominal interest rates and pure inflation is significantly higher and sta
tistically significant at conventional significance levels, especially at business
cycle frequencies. These correlations are much like correlations found by other
researchers using overall measures of inflation. The final row of Table 3 shows the
correlation of pure inflation with the term spread (the difference between yield on
10-year Treasury bonds and 3-month Treasury bills), where the results look much like the results for short-term rates.
In terms of the model of Section II, these estimates, again, provide useful infor mation on the relative size of different shocks. Identifying some sectors in the model with services, nondurables, food or energy, the results in panel A of Table 3 provide information on the relative size of the sectoral-specific productivity shocks. In turn, the results in panel B of the table indicate the relative weight of anticipated monetary shocks vis-a-vis unanticipated monetary shocks and fiscal shocks.
V. The Phillips Correlation
One of the most famous correlations in macroeconomics, due to Phillips (1958), relates changes in prices with measures of real activity. The first panel of Table 4 dis
plays the Phillips correlation using our measures of squared coherence. At business
cycle frequencies, measuring inflation with the PCE deflator and real activity with
GDP, the average squared coherence (R2) is 0.28, corresponding to a "correlation" of roughly 0.5. The Phillips correlations for industrial production, consumption, employment, or the unemployment rate are all similarly large.
The second and third panels of Table 4 show that the usual controls for relative
prices reduce the strength of this correlation. Controlling for intertemporal rela tive prices (using short-term interest rates and stock returns), for the relative price
This content downloaded from 94.228.80.50 on Sat, 10 May 2014 08:41:36 AMAll use subject to JSTOR Terms and Conditions

150 AMERICAN ECONOMIC JOURNAL: MACROECONOMICS JULY 2010
Table 4?Fraction of Variability of Real Variables Associated with PCE Inflation
(Average squared coherence over frequencies (standard errors in parenthesis))
Frequencies
Real variable_An_?r/32
< u < tt/6
Panel A. No controls GDP 0.11 (0.05) 0.28 (0.12)
Industrial production 0.13 (0.06) 0.27(0.14) Consumption 0.15 (0.06) 0.28(0.13)
Employment 0.19(0.06) 0.32(0.12) Unemployment rate 0.22 (0.07) 0.34 (0.15)
Panel B. Controls: interest rates, stock returns, wages GDP 0.09(0.05) 0.14(0.07)
Industrial production 0.13 (0.05) 0.12 (0.05) Consumption 0.07 (0.04) 0.12 (0.06)
Employment 0.15 (0.04) 0.24(0.09) Unemployment rate 0.14 (0.04) 0.18 (0.07)
Panel C Controls: interest rates, stock returns, wages, exchange rates (t > 1973) GDP 0.14(0.05) 0.17(0.08)
Industrial production 0.15 (0.05) 0.14 (0.06) Consumption 0.10 (0.05) 0.18 (0.08)
Employment 0.12(0.04) 0.24(0.10) Unemployment rate 0.13 (0.04) 0.20 (0.08)
Panel D. Controls: relative inflation rates of food and energy GDP 0.03 (0.02) 0.05 (0.04)
Industrial production 0.07 (0.03) 0.08 (0.05) Consumption 0.07 (0.03) 0.04 (0.04)
Employment 0.12(0.04) 0.10(0.06) Unemployment rate 0.10 (0.04) 0.12 (0.06)
Panel E. Controls: relative inflation rates of durable, non-durables, food and energy GDP 0.02 (0.02) 0.03 (0.03)
Industrial production 0.04 (0.02) 0.04 (0.04) Consumption 0.05 (0.02) 0.03 (0.03)
Employment 0.09 (0.03) 0.06 (0.04) Unemployment rate 0.07 (0.03) 0.08 (0.05)
Panel E Controls: relative-price index p, GDP 0.02 (0.02) 0.01 (0.02)
Industrial production 0.03 (0.02) 0.01 (0.02) Consumption 0.06 (0.03) 0.03 (0.02)
Employment 0.08 (0.03) 0.03 (0.03) Unemployment rate 0.08 (0.03) 0.03 (0.03)
Note: The results in panel C use only data from 1973 onward because of data availability for
the weighted US real exchange rate series.
of labor and consumption (using real wages), or for the relative price of domestic
and foreign goods (using the real exchange rate) cuts the Phillips correlations in
approximately half. Still, these correlations remain quantitatively large and statisti
cally significant. The fourth and fifth panels of Table 4 include two of the conventional measures
of relative prices that we discussed in the previous section. Controlling for food and
energy relative prices, the Phillips curve relation falls significantly, but the squared coherences remain sizeable and at least 0.10 for two of the five real series. Including all four relative price indicators drives down the Phillips relation to between 0.03 and
This content downloaded from 94.228.80.50 on Sat, 10 May 2014 08:41:36 AMAll use subject to JSTOR Terms and Conditions

VOL. 2 NO. 3 REISAND WATSON: RELATIVE GOODS' PRICES AND PURE INFLATION 151
0.08 (although with four relative price series included in the VAR used to estimate
the coherences, one might conjecture that some of this decline is associated with
over-fitting). The last panel of Table 4 introduces the two relative price factors from the estimated
model as controls. Strikingly, controlling for pf, the Phillips correlation disappears over business-cycle frequencies. The largest squared coherence point estimate between
PCE inflation and measures of real activity, controlling for our relative-price index, is
0.03, and the point estimates are statistically insignificant at the 10 percent level for
all measures of real activity. Apparently, the empirical regularity that Phillips first
brought attention to is essentially entirely explained by the two relative price factors.
Table 5 provides a different perspective by decomposing the Phillips relation into the inflation components that we have separated. The first panel shows that remov
ing the idiosyncratic sources of inflation variation makes the Phillips relation much
stronger than it was with headline PCE inflation. At business-cycle frequencies, the
squared coherence between the aggregate components of inflation and measures of
real activity is as high as 70 percent, and it is highly statistically significant at con
ventional significance levels. The second panel controls for the relative-price index, so it shows the squared coherence between pure inflation and measures of real activ
ity. Again, controlling for relative prices essentially eliminates the Phillips correla
tion, with the squared coherences falling by a factor of roughly seven. According to
the model in Section II, the little that remains of the relation between pure inflation
and real activity could be due to omitted relative prices like wages. Panels C and D control for real wages, asset prices, and exchange rates, which cuts the squared coherences a little further.
The results in these tables suggest that a large part of the Phillips correlation, that
has puzzled macroeconomists for half a century, is explained by changes in good's relative prices. Changes in the unit of account, as captured by pure inflation, do not seem to affect real variables, consistent with anticipated money shocks accounting for most of pure inflation. However, note that a few of the estimates in Table 5 are
statistically significant, even if small, even after controlling for other relative prices. This suggests that some money illusion may be present, although it seems to explain very little of the variability of real activity.
VI. The Robustness of the Results
Tables 6 and 7 investigate the robustness of the key empirical conclusions to four
aspects of the model specification: the number of estimated factors, the method for
estimating the factors (signal extraction using the parametric factor model (5)-(7) versus principal components on (4)), the imposition of unit roots in the factor VAR for the parametric model, and the number of lags and imposition of unit roots in the VAR spectral estimator used to compute the various coherence estimates. Table 6 summarizes results for the parametric factor model, and Table 7 summarizes results for the principal components estimates. The table focuses on seven key results described below.
Tables 6 and 7 share a common format. The first row shows results for the bench mark model, where the first column provides details of the factor estimates, and where
This content downloaded from 94.228.80.50 on Sat, 10 May 2014 08:41:36 AMAll use subject to JSTOR Terms and Conditions

152 AMERICAN ECONOMIC JOURNAL: MACROECONOMICS JULY 2010
Table 5?Fraction of Variability of Real Variables Associated with Inflation Components
(Average squared coherence over frequencies (standard errors in parenthesis))
Frequencies
Real variable All tt/32 < v < tt/6 Panel A. Aggregate inflation components, vt and p,
GDP 0.26 (0.05) Industrial production 0.28 (0.06) Consumption 0.28 (0.06) Employment 0.35 (0.05) Unemployment rate 0.42 (0.06)
0.60 (0.10) 0.59 (0.12) 0.62 (0.11) 0.65 (0.10) 0.70 (0.11)
Panel B. Pure inflation vt GDP Industrial production Consumption Employment Unemployment rate
0.05 (0.02) 0.06 (0.02) 0.08 (0.03) 0.07 (0.02) 0.12(0.03)
Panel C. Pure inflation vt, control for interest rates, stock returns, wages GDP 0.04 (0.02)
Industrial production 0.05 (0.02) Consumption 0.05 (0.02) Employment 0.06 (0.02) Unemployment rate 0.12 (0.03)
0.09 (0.05) 0.09 (0.06) 0.08 (0.04) 0.12(0.06) 0.14 (0.07)
0.05 (0.03) 0.04 (0.02) 0.06 (0.03) 0.10 (0.04) 0.07 (0.03)
Panel D. Pure inflation vt, control for interest rates, stock returns, wages, exchange rates (t > 1973) GDP 0.03 (0.02) 0.07 (0.04)
Industrial production 0.04 (0.02) 0.04 (0.03) Consumption 0.04 (0.02) 0.06 (0.04)
Employment 0.06 (0.02) 0.16 (0.07) Unemployment rate 0.10 (0.02) 0.09 (0.05)
Note: The results in panel D use only data from 1973 onward because of data availability for the weighted US real exchange rate series.
"(1,1,0)" denotes a parametric k = 3 factor model in which the first and second factor are 1(1) processes and the third is 1(0). The next column, labeled "VAR," summarizes the specification of the VAR used to compute the spectral estimates, which for the
benchmark model involves four lags of (a? R,) with at and the first element of R, entered as first differences (D,4).
Results shown in the column labeled 1 are for the fraction of the business cycle
variability of headline PCE inflation explained by the relative price factors (p) and pure inflation (v). For the benchmark model these are taken from the first row of
Table 2. Results shown in the column labeled 2 are the average squared canoni
cal coherences between the relative inflation factors Rt and relative inflation rates
for durables, nondurables, food, and energy (benchmark model from Table 3, panel A, final row). Columns 3 and 4 show the average squared coherence between pure inflation and the growth rate of M2 and the 3-month Treasury bill rate (benchmark
model from Table 3, panel B, rows 3 and 5). Column 5 shows the average coher
ence between real GDP and headline PCE inflation after controlling for the esti
mated relative inflation factors (benchmark model, Table 4, panel F, first row). The
final two columns show the fraction of business-cycle variability explained by the
factors (at9 Rf) (column 6) and the fraction explained by pure inflation, vt (bench mark models results from Table 5, row 1 of panels A and B).
This content downloaded from 94.228.80.50 on Sat, 10 May 2014 08:41:36 AMAll use subject to JSTOR Terms and Conditions

VOL. 2 NO. 3 REIS AND WATSON: RELATIVE GOODS' PRICES AND PURE INFLATION 153
Table 6?The Robustness of the Conclusions
(Average squared coherences over business cycle frequencies (standard errors in parenthesis))
Factor estimates VAR (1) (2) (3) (4) (5) (6) Benchmark model
(1,1,0) D,4 0.76
(0.10)
0.15
(0.07)
0.87
(0.05)
0.42
(0.10)
0.01
(0.02)
0.27
(0.12)
0.01
(0.02)
0.60
(0.10)
(7)
0.09
(0.05)
Alternative parametric factor estimates
(1,1,0) D,6
(0, 0, 0)
(0, 0, 0)
(1, 1, 0, 0)
(1, 1, 0, 0)
(1, 1,0)
(1,1,0)
(0, 0, 0)
(0, 0, 0)
(1, 1,0, 0)
(1, 1, 0, 0)
D,4
D,6
D,4
D,6
L,4
L,6
L,4
L,6
L,4
L,6
0.85
(0.06)
0.74
(0.10)
0.84
(0.06)
0.80
(0.08)
0.87
(0.05)
0.80
(0.08)
0.86
(0.05)
0.79
(0.08)
0.85
(0.05)
0.82
(0.07)
0.87
(0.05)
0.11
(0.04)
0.16
(0.08)
0.12
(0.05)
0.12
(0.06)
0.09
(0.03)
0.11
(0.05)
0.09
(0.04) 0.11
(0.05)
0.09
(0.04)
0.10
(0.05)
0.08
(0.04)
0.90
(0.04) 0.87
(0.04)
0.90
(0.04)
0.89
(0.04) 0.92
(0.03)
0.87
(0.05)
0.90
(0.05) 0.88
(0.05)
0.90
(0.04) 0.90
(0.04) 0.92
(0.03)
0.37
(0.12)
0.42
(0.10)
0.36
(0.12)
0.56 0.14
(0.08) (0.07)
0.50
(0.12)
0.53
(0.11)
0.50
(0.12) 0.52
(0.12)
0.49
(0.12)
0.61
(0.09)
0.56
(O.H)
0.13
(0.09)
0.15
(0.07)
0.16
(0.09)
0.06
(0.07)
0.01
(0.02) 0.05
(0.07)
0.01
(0.01)
0.05
(0.06)
0.02
(0.03)
0.03
(0.05) 0.02
(0.03)
0.03
(0.05)
0.02
(0.03)
0.03
(0.04)
0.20
(0.09)
0.30
(0.11)
0.20
(0.09)
0.21
(0.10)
0.15
(0.09)
0.20
(0.11)
0.20
(0.11)
0.19
(0.11)
0.19
(0.11)
0.24
(0.10)
0.22
(0.10)
0.07
(0.05)
0.02
(0.02)
0.06
(0.04)
0.01
(0.01)
0.06
(0.04)
0.01
(0.01)
0.05
(0.04)
0.00
(0.01)
0.05
(0.04)
0.01
(0.01)
0.05
(0.04)
0.67
(0.08)
0.61
(0.10)
0.68
(0.08)
0.62
(0.10)
0.70
(0.08)
0.62
(0.10)
0.71
(0.09)
0.62
(0.10)
0.72
(0.08)
0.64
(0.09)
0.72
(0.08)
0.11
(0.06)
0.09
(0.06) 0.11
(0.06)
0.08
(0.05)
0.12
(0.06)
0.12
(0.07)
0.17
(0.08) 0.12
(0.07)
0.16
(0.08)
0.11
(0.06)
0.16
(0.07)
Notes: The first column describes the factor estimates, where the parametric estimates are based on signal extrac tion applied to (5)-(7) with parameters estimated by Gaussian MLE, and the numbers in parentheses indicate the number of factors and whether the relevant factor is modeled as an 1(1) or 1(0) process. For example, "(1, 1,
0)" is a three factor model modeled as 1(1), 1(1), and 1(0) processes. The column labeled VAR shows the specifi cation of the VAR used to compute the VAR-spectral estimates, where "D" and "L" denote first differences and levels specifications and the numbers 4 and 6 denote the number of lags in the VAR. Results shown in column 1 are the average squared coherences between Headline PC and pt and vt (benchmark model results from Table 2 first row); (2) canonical coherences between the relative prices of (durables, nondurables, food, energy) and R? (benchmark model results from Table 3 row 7); (3) coherence between M2 and v (Table 3 row 10); (4) coherence between Federal Funds Rate and vt (Table 3 row 11); (5) coherence between PCE Inflation and GDP controlling for Rf (Table 4, panel F, row 1); (6) coherence between (vt, pt) and GDP (Table 5, panel A, row 1), and (7) between v, and GDP (Table 5, panel B, row 1).
Looking across the entries in the two tables, the key quantitative conclusions from Tables 2-5 appear to be robust to the changes in specification studied in Tables 6 and 7. From column 1, relative inflation factors explain a significant frac tion of the business-cycle variability of aggregate inflation (as measured by the headline PCE deflator), while pure inflation (v) explains a smaller, but nonnegligi ble fraction. Observable measures of relative price inflation are reasonably highly correlated with one of the relative inflation factors (the first canonical coherence is
roughly 0.90), but less highly correlated with the other factor (the other canonical coherences are generally less than 0.50). For all of the specifications, the estimates of pure inflation are very weakly correlated with M2, but more highly correlated with nominal interest rates. Finally, in all of the specifications, controlling for
This content downloaded from 94.228.80.50 on Sat, 10 May 2014 08:41:36 AMAll use subject to JSTOR Terms and Conditions
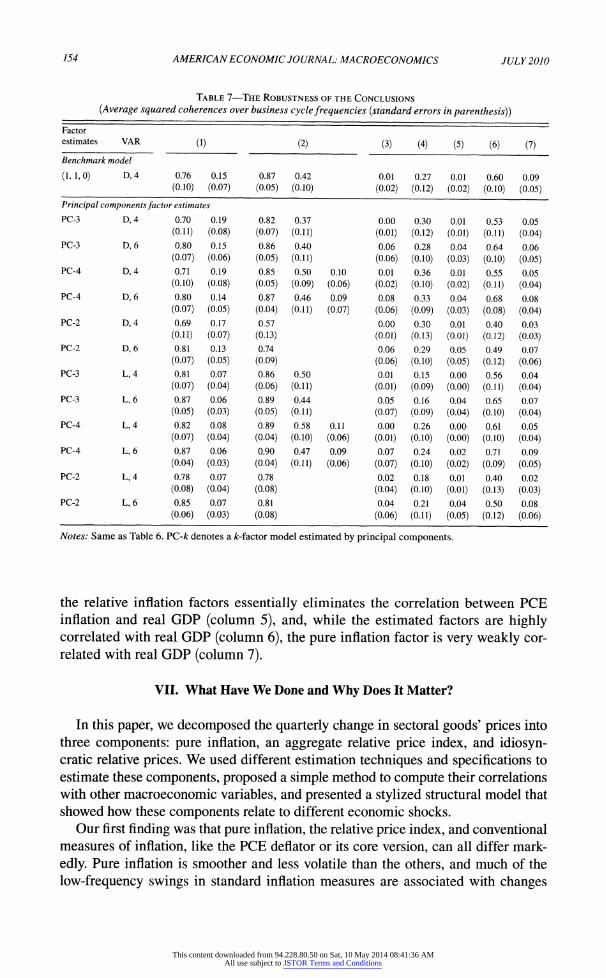
154 AMERICAN ECONOMIC JOURNAL: MACROECONOMICS JULY 2010
Table 7?The Robustness of the Conclusions
[Average squared coherences over business cycle frequencies [standard errors in parenthesis))
Factor estimates VAR (1) (2) (3) (4) (5) (6) (7) Benchmark model
(1,1,0) D,4 0.76 0.15
(0.10) (0.07)
0.87 0.42
(0.05) (0.10)
0.01 0.27 0.01 0.60 0.09
(0.02) (0.12) (0.02) (0.10) (0.05) Principal components factor estimates
PC-3
PC-3
PC-4
PC-4
PC-2
PC-2
PC-3
PC-3
PC-4
PC-4
PC-2
PC-2
D,4
D,6
D,4
D,6
D,4
D,6
L,4
L,6
L,4
L,6
L,4
L,6
0.70
(0.11) 0.80
(0.07) 0.71
(0.10) 0.80
(0.07) 0.69
(o.n) 0.81
(0.07) 0.81
(0.07) 0.87
(0.05) 0.82
(0.07) 0.87
(0.04) 0.78
(0.08) 0.85
(0.06)
0.19
(0.08) 0.15
(0.06) 0.19
(0.08) 0.14
(0.05) 0.17
(0.07) 0.13
(0.05) 0.07
(0.04) 0.06
(0.03) 0.08
(0.04) 0.06
(0.03) 0.07
(0.04) 0.07
(0.03)
0.82
(0.07) 0.86
(0.05) 0.85
(0.05) 0.87
(0.04) 0.57
(0.13) 0.74
(0.09) 0.86
(0.06) 0.89
(0.05) 0.89
(0.04) 0.90
(0.04) 0.78
(0.08) 0.81
(0.08)
0.37
(0.11) 0.40
(0.11) 0.50 0.10
(0.09) (0.06) 0.46 0.09
(0.11) (0.07)
0.50
(0.11) 0.44
(0.11) 0.58 0.11
(0.10) (0.06) 0.47 0.09
(0.11) (0.06)
0.00
(0.01) 0.06
(0.06) 0.01
(0.02) 0.08
(0.06) 0.00
(0.01) 0.06
(0.06) 0.01
(0.01) 0.05
(0.07) 0.00
(0.01) 0.07
(0.07) 0.02
(0.04) 0.04
(0.06)
0.30
(0.12) 0.28
(0.10) 0.36
(0.10) 0.33
(0.09) 0.30
(0-13) 0.29
(0.10) 0.15
(0.09) 0.16
(0.09) 0.26
(0.10) 0.24
(0.10) 0.18
(0.10) 0.21
(0.11)
0.01
(0.01) 0.04
(0.03) 0.01
(0.02) 0.04
(0.03) 0.01
(0.01) 0.05
(0.05) 0.00
(0.00) 0.04
(0.04) 0.00
(0.00) 0.02
(0.02) 0.01
(0.01) 0.04
(0.05)
0.53
(0.11) 0.64
(0.10) 0.55
(o.n) 0.68
(0.08) 0.40
(0.12) 0.49
(0.12) 0.56
(o.n) 0.65
(0.10) 0.61
(0.10) 0.71
(0.09) 0.40
(0.13) 0.50
(0.12)
0.05
(0.04) 0.06
(0.05) 0.05
(0.04) 0.08
(0.04) 0.03
(0.03) 0.07
(0.06) 0.04
(0.04) 0.07
(0.04) 0.05
(0.04) 0.09
(0.05) 0.02
(0.03) 0.08
(0.06)
Notes: Same as Table 6. PC-fc denotes a fc-factor model estimated by principal components.
the relative inflation factors essentially eliminates the correlation between PCE inflation and real GDP (column 5), and, while the estimated factors are highly correlated with real GDP (column 6), the pure inflation factor is very weakly cor
related with real GDP (column 7).
VII. What Have We Done and Why Does It Matter?
In this paper, we decomposed the quarterly change in sectoral goods' prices into three components: pure inflation, an aggregate relative price index, and idiosyn cratic relative prices. We used different estimation techniques and specifications to
estimate these components, proposed a simple method to compute their correlations with other macroeconomic variables, and presented a stylized structural model that showed how these components relate to different economic shocks.
Our first finding was that pure inflation, the relative price index, and conventional measures of inflation, like the PCE deflator or its core version, can all differ mark
edly. Pure inflation is smoother and less volatile than the others, and much of the
low-frequency swings in standard inflation measures are associated with changes
This content downloaded from 94.228.80.50 on Sat, 10 May 2014 08:41:36 AMAll use subject to JSTOR Terms and Conditions

VOL. 2 NO. 3 REIS AND WATSON: RELATIVE GOODS' PRICES AND PURE INFLATION 155
in relative prices. More concretely, a large part of the increase in inflation in the
early 1970s and the decrease in inflation in the 1990s was associated with changes in relative prices, while some of the increase in the late 1970s, and the decrease in
inflation in the early 1980s, was associated with changes in pure inflation.
Second, we found that aggregate shocks account for roughly 90 percent of the
variability of aggregate inflation, and a still sizable one-third of the variability of
sectoral inflation rates. Within aggregate shocks, the relative price index dominates, but pure inflation is also quantitatively significant, accounting for 15-20 percent of
the variability in inflation measured by conventional price indices, like the PCE
deflator, the GDP deflator, or the CPI. This finding has at least two implications for
the work of economic theorists building models to explain inflation. First, it shows
that comparing the predictions of one-good models with common measures of infla
tion is flawed. Changes in the relative prices of goods are large enough that they can
easily lead to mistakenly accepting or rejecting models that ignore this feature of the data. Second, our estimates provide statistics that can be used to calibrate the relative variances of anticipated versus unanticipated shocks, and aggregate versus
sectoral shocks.
Our third finding was that conventional measures of relative price inflation, such as the relative inflation of nondurables, food and energy, or combinations of several of them, all fall short of capturing most of the relative price inflation in the data. Our
two-dimensional relative price index provides a parsimonious yet comprehensive measure of relative price inflation that we hope will be useful in other studies that either need to statistically control for relative price changes, or that seek to provide economic models of the main sources of relative price movements. Pure inflation is only partly related to monetary policy variables. The link to the growth rate in
monetary aggregates is weak, but the correlation with nominal interest rates at busi ness cycle frequencies is stronger (approximately 0.5).
Our most striking finding was, perhaps, that once we controlled for the two relative price factors, the Phillips correlation became quantitatively insignificant. Therefore, the correlation between real quantity variables and nominal inflation vari ables observed in the data can be accounted for by changes in goods' relative prices. This implies that models that break the classical dichotomy via nominal rigidities in
good's price adjustment are likely more promising than models that rely on money illusion on the part of agents. Moreover, changes in the relative prices of labor and
intertemporal prices were less successful in explaining the Phillips correlation, sug gesting a less important role for rigidities in the labor and asset markets.
To conclude, the distinction between absolute and relative prices is a central one in economic theory. Models of inflation have strong predictions on the relative sizes of pure and relative price inflation and on what accounts for the Philips correlation.
However, separating absolute and relative price movements is naturally difficult, since the two concepts themselves are more a fruit of thought experiments than
something easily observed. As a result, there have been few systematic attempts to measure and separate them in the data. The goal of this paper was to make some
progress on this decomposition and on understanding its effects. Our estimates are
certainly not perfect. We hope, however, that they are sufficiently accurate that future research can look deeper into the time-series and the moments that we provide, and
This content downloaded from 94.228.80.50 on Sat, 10 May 2014 08:41:36 AMAll use subject to JSTOR Terms and Conditions

156 AMERICAN ECONOMIC JOURNAL: MACROECONOMICS JULY 2010
that by stating the challenges and putting forward a benchmark, we can motivate future research to come up with better estimators. Likewise, we are sure that our
findings will not settle the debates around the Phillips correlation. Our more modest
hope is that they offer a new perspective on how to bring data to bear on this long
standing question.
REFERENCES
Altissimo, Filippo, Benoit Mojon, and Paolo Zaffaroni. 2009. "Can Aggregation Explain the Persis tence of Inflation?" Journal of Monetary Economics, 56(2): 231-41.
Amengual, Dante, and Mark W. Watson. 2007. "Consistent Estimation of the Number of Dynamic Factors in a Large N and T Panel." Journal of Business and Economic Statistics, 25(1): 91-96.
Amstad, Marlene, and Simon M. Potter. 2007. "Real Time Underlying Inflation Gauges for Monetary
Policy Makers." Unpublished. Bai, Jushan. 2003. "Inferential Theory for Factor Models of Large Dimensions." Econometrica,
71(1): 135-71. Bai, Jushan, and Serena Ng. 2002. "Determining the Number of Factors in Approximate Factor Mod
els." Econometrica, 70(1): 191-221.
Bai, Jushan, and Serena Ng. 2006. "Confidence Intervals for Diffusion Index Forecasts and Inference
for Factor Augmented Regressions." Econometrica, 74(4): 1133-50.
Bai, Jushan, and Serena Ng. 2007. "Determining the Number of Primitive Shocks in Factor Models."
Journal of Business and Economic Statistics, 25(1): 52-60.
Bernanke, Ben S., Jean Boivin, and Piotr Eliasz. 2005. "Measuring the Effects of Monetary Policy: A Factor-Augmented Vector Autoregressive (FAVAR) Approach." Quarterly Journal of Econom
ics, 120(1): 387-422. Blanchard, Olivier J. 2009. Macroeconomics, 5th Edition. Upper Saddle River, NJ: Prentice-Hall.
Blanchard, Olivier Jean, and Nobuhiro Kiyotaki. 1987. "Monopolistic Competition and the Effects of
Aggregate Demand." American Economic Review, 77(4): 647-66.
Boivin, Jean, Marc P. Giannoni, and Ilian Mihov. 2009. "Sticky Prices and Monetary Policy: Evi
dence from Disaggregated Data." American Economic Review, 99(1): 350-84.
Broda, Christian, and David E. Weinstein. 2007. "Product Creation and Destruction: Evidence and
Price Implications." National Bureau of Economic Research Working Paper 13041.
Bryan, Michael F., and Stephen G. Cecchetti. 1993. "The Consumer Price Index as a Measure of
Inflation." Federal Reserve Bank of Cleveland Economic Review, 29(4): 15-24.
Bryan, Michael F., Stephen G. Cecchetti, and Rodney L. Wiggins II. 1997. "Efficient Inflation Esti
mation." National Bureau of Economic Research Working Paper 6183.
Bryan, Michael F., Stephen G. Cecchetti, and Roisin O'Sullivan. 2002. "Asset Prices in the Measure
ment of Inflation." National Bureau of Economic Research Working Paper 8700.
Cristadoro, Riccardo, Mario Forni, Lucrezia Reichlin, and Giovanni Veronese. 2005. "A Core Infla
tion Indicator for the Euro Area." Journal of Money, Credit, and Banking, 37(3): 539-60.
Del Negro, Marco. 2006. "Signal and Noise in Core PCE." Unpublished.
Doz, Catherine, Domenico Giannone, and Lucrezia Reichlin. 2008. "A Quasi Maximum Likelihood
Approach for Large Dynamic Factor Models." Unpublished.
Fisher, Irving. 1930. The Theory of Interest. New York: MacMillan.
Forni, Mario, Marc Hallin, Marco Lippi, and Lucrezia Reichlin. 2000. "The Generalized Dynamic Factor Model: Identification and Estimation." Review of Economics and Statistics, 82(4): 540-54.
Friedman, Milton, and Anna Jacobson Schwartz. 1963. A Monetary History of the United States:
1867-1960. Princeton: Princeton University Press.
Hallin, Marc, and Roman Liska. 2007. "Determining the Number of Factors in the General Dynamic Factor Model." Journal of the American Statistical Association, 102(478): 603-17.
Hume, David. 1752. Political Discourses. Reprinted in Essays, Moral, Political, and Literary, ed.
Eugene F. Miller. Indianapolis, IN: Liberty Fund, 1985.
Lucas, Robert E., Jr. 1973. "Some International Evidence on Output-Inflation Tradeoffs." American
Economic Review, 63(3): 326-34.
Mankiw, N. Gregory, and Ricardo Reis. 2002. "Sticky Information versus Sticky Prices: A Proposal to
Replace the New Keynesian Phillips Curve." Quarterly Journal of Economics, 117(4): 1295-1328.
Mishkin, Frederic S. 1992. "Is the Fisher Effect for Real? A Reexamination of the Relationship between Inflation and Interest Rates." Journal of Monetary Economics, 30(2): 195-215.
This content downloaded from 94.228.80.50 on Sat, 10 May 2014 08:41:36 AMAll use subject to JSTOR Terms and Conditions

VOL. 2 NO. 3 REIS AND WATSON: RELATIVE GOODS' PRICES AND PURE INFLATION 157
Phillips, A. W. 1958. "The Relation between Unemployment and the Rate of Change of Money Wage Rates in the United Kingdom, 1861-1957." Economics 25(100): 283-99.
Pivetta, Frederic, and Ricardo Reis. 2007. "The Persistence of Inflation in the United States." Journal
of Economic Dynamics and Control, 31(4): 1326-58. Quah, Danny, and Thomas J. Sargent. 1993. "A Dynamic Index Model for Large Cross Sections." In
Business Cycles, Indicators, and Forecasting, ed. James H. Stock and Mark W. Watson, 285-310.
Chicago: University of Chicago Press. Rao, C. Radhakrishna. 1973. Linear Statistical Inference and Its Applications, Second Edition. New
York: John Wiley and Sons.
Reis, Ricardo, and Mark W. Watson. 2007. "Measuring Changes in the Value of the Numeraire."
Unpublished. Selvanathan, E. A., and D. S. Prasada Rao. 1994. Index Numbers: A Stochastic Approach. Ann
Arbor: University of Michigan Press.
Stock, James H., and Mark W. Watson. 1989. "New Indexes of Coincident and Leading Economic
Indicators." NBER Macroeconomics Annual, 1989, ed. Olivier Jean Blanchard and Stanley Fischer, 351-94. Cambridge, MA: MIT Press.
Stock, James H., and Mark W. Watson. 1999. "Business Cycle Fluctuations in US Macroeconomic
Time Series." In Handbook of Macroeconomics, Volume 1A, ed. John B. Taylor and Michael
Woodford, 3-64. Amsterdam: Elsevier.
Stock, James H., and Mark W. Watson. 2002. "Forecasting Using Principal Components from a
Large Number of Predictors." Journal of the American Statistical Association, 97(460): 1167-79.
Stock, James H., and Mark W. Watson. 2005. "Implications of Dynamic Factor Models for VAR
Analysis." National Bureau of Economic Research Working Paper 11467.
Watson, Mark W. 1989. "Recursive Solution Methods for Dynamic Linear Rational Expectations Models." Journal of Econometrics, 41(1): 65-89.
Woodford, Michael. 2003. Interest and Prices: Foundations of a Theory of Monetary Policy. Princeton: Princeton University Press.
This content downloaded from 94.228.80.50 on Sat, 10 May 2014 08:41:36 AMAll use subject to JSTOR Terms and Conditions