Embed Size (px)
Citation preview
UAB SCHOOL OF ENGINEERING
Relative Comparison of NCHRP350 Accepted Guardrail Terminals
Kevin Schrum
10/28/2014

i
Abstract
Guardrail is installed along the length of a highway to shield motorists from life-
threatening objects. However, these safety features are, in and of themselves, a hazard. The ends,
in particular, can reap devastating consequences. Many different end treatments exist with almost
as many different working concepts behind their designs. Due to this variability, it is possible
that one or more systems may constitute an elevated level of risk to the public. Therefore, a
statistical analysis was conducted to compare the distribution of end treatments involved in
severe-injury or fatal crashes to an expected distribution, known as exposure. To date, Missouri
and Ohio have been included, and in both states, it was found that the ET-PLUS placed motorists
at a higher level of risk of both serious and fatal injuries relative to its predecessor, the ET-2000.
Acknowledgments
This research was conducted by the University of Alabama at Birmingham (UAB) School
of Engineering with funding from The Safety Institute (TSI) and the Missouri Highways and
Transportation Commission. The Safety Institute is a 501c3 non-profit organization whose focus
is on injury prevention and product safety. TSI employees and UAB staff collaborated to
conceptualize the study reported herein. TSI also provided financial support as part of its mission
to provide evidence-based research on safety matters that affect the public and specifically to
better understand the field performance of guardrail terminals. The author would like to thank
Missouri Highways and Transportation Commission and TSI for supporting this effort.
Special Note
This is a final report that has been revised to reflect comments from three independent
reviewers and the sponsoring agencies. One independent reviewer was solicited by the author,
and each sponsoring agency solicited their own independent review. After incorporating
reviewer comments, each reviewer concluded that this report is worthy of publication. Further,
one of the study sponsors recommended that because the study did not include all possible
aspects of an in-service performance evaluation, the title of the study should be revised from
“IN-SERVICE EVALUATION OF FHWA-ACCEPTED GUARDRAIL TERMINALS” to
“RELATIVE COMPARISON OF NCHRP 350 ACCEPTED GUARDRAIL TERMINALS”.

ii
iii
Table of Contents Chapter 1. Introduction ................................................................................................................... 1
Chapter 2. Research Approach ....................................................................................................... 3
Chapter 3. End Treatment Identification ........................................................................................ 5
Chapter 4. Data Collection .............................................................................................................. 8
Chapter 5. Statistical Analyses ..................................................................................................... 10
Chapter 6. Missouri ....................................................................................................................... 12
Chapter 7. Ohio ............................................................................................................................. 16
Chapter 8. Overall Conclusions .................................................................................................... 20
Chapter 9. References ................................................................................................................... 22

1
Chapter 1. Introduction
1.1. Problem Statement
Certain roadside hazards require shielding via longitudinal barriers, specifically when
they cannot be moved outside of the clear zone, which is an unobstructed traversable area next to
the roadside that can allow the driver to come to a safe stop [1]. This design practice is based on
the assumption that the barrier represents a lower probability of injury to the occupants of an
errant vehicle compared to the probability of injury associated with the shielded hazard. While
this is true for most scenarios, it does not mean that longitudinal barriers are without risk.
In the family of longitudinal barriers, W-beam guardrail is the most prevalent [2]. These
barriers are considered semi-rigid, providing resistance against lateral deflection while mitigating
accelerations experienced by the occupant.
When these systems were first instituted, their ends were not considered dangerous and
were often left exposed. This practice soon became obsolete due to high vehicle penetration
rates. Instead, the ends of guardrails became turned down or treated with a shoe or fish tail
shaped cap. For turn downs, a ramp was created and rollovers became prevalent. For shoes or
fish tails, penetrations were still too common. Therefore, end treatments continued to evolve
until the present day, where the most readily-accepted device (called a “guardrail terminal” for
the duration of this report) has the ability to absorb energy by deforming the rail in some manner
and/or has been crash tested to at least the National Cooperative Highway Research Program
(NCHRP) Report No. 350 guidelines. For almost all common energy-absorbing guardrail
terminals, this deformation occurs in response to compressive loading applied to the rail element.
As such, there is an inherent risk of compressive buckling in the rail. When this buckling occurs
early in the impact event, the errant vehicle has enough energy to cause impalement with the
newly formed elbow in the rail. Other risk factors may develop as well, including, but not limited
to, high deceleration rates, vehicle instability, and redirection into traffic. Each of these outcomes
can lead to increased probability of serious injury and fatal crashes.
The nomenclature of injury severity used throughout this report is based on the KABCO
scale. This scale categorizes injuries from fatal (“K”) down to property damage only (PDO or
“O”). Severe and/or incapacitating injuries were considered “A” and the combination of severe
injury and fatal crashes was called “A+K.” Continuing, “B” and “C” crashes typically result in
moderate, non-incapacitating injuries or minor injuries, respectively.
As previously noted, energy absorbing guardrail terminals deform the rail in different
ways. Some flatten the rail, some cut the rail, and some kink the rail. The mechanism of energy
management controls the forces transmitted to the vehicle, and therefore the rail. This in turn
influences the mode of failure, if there is one, in the rail element itself ahead of the end terminal.
Regardless of these various design approaches, if they performed as intended, they would all
have a similar success rate in mitigating fatalities and/or serious injuries (henceforth known as
2
“K” and/or “A+K” crashes). In order for States to proactively reduce the frequency of K and
A+K crashes involving end treatments, they should expect all of their qualified products to
perform at a relatively high level. Each successive generation of terminal design should improve
safety performance.
1.2. Objective
The objective of this study was to evaluate the safety performance of NCHRP Report No.
350-approved guardrail terminals. This information should prove valuable to highway agencies
attempting to determine which guardrail terminals provide a higher level of safety on their
highways.
1.3. Scope
Data was originally collected from the States of Ohio and Missouri. Therefore, the
statistical study was designed according to available data from these states. However, the
required data is not unique to these states, and as such, the process documented herein can be
applied to any state where the data is made available.
1.4. Organization
This report has been organized such that results for any state can be easily added to this
report in the future. In general, the process of collecting data and the process of conducting
statistical analyses on that data are described. Each state that has contributed data to this effort is
studied while following the outline described in the general overview. A summary of any
deviation from the general research approach, a summary of the collected data, a detailed
presentation of the statistical analyses, and a discussion of the results of the analyses are given in
a separate chapter for each state. Finally, a concluding chapter is provided to summarize the
conclusions made for each state and comment on possible regional differences and trends.

3
Chapter 2. Research Approach
A sortable, tabulated crash database was compiled for each State. Each entry included
data for the date, location, injury level, number of involved vehicles, and the events of the
impact. This latter inclusion typically consisted of one to four events, and the most harmful event
(MHE) was identified from this event field. This data was filtered to include only single-vehicle
ran-off-road (SVROR) crashes where a guardrail end was identified as the MHE. A request for
the police crash report was submitted for each identified crash.
Once the crash reports were received, they were screened according to the information
contained in the report. Only crashes where the upstream end terminal was involved were
included. Examples of crashes that were excluded are concrete barrier ends, downstream impacts
with guardrail terminals, very low-volume roads (such as unpaved roads), and extreme vehicle
types (e.g., tractor-trailers, single-unit trucks, and motorcycles). For this document, downstream
refers to the end of the barrier system on the opposite side of the direction of travel.
For the remaining crashes in the database, the scene photos provided by the State, if
available, were used to identify the end treatment via inspection according to the experience of
the research staff. In addition to scene photos, state photologs and street images were
investigated to approximately determine the type of end treatment located at the scene of the
crash. Regardless of the method used for determining the end treatment involved in the crash, the
date that the image was taken was recorded. The archived photolog or street images with the
closest date prior to the crash were used as long as the photo predated the crash. Otherwise, the
crash was filtered out of the database.
Next, exposure data was collected. Traditionally, the measure of effectiveness of a
roadside safety device is the percent of A+K or K crashes relative to the total number of crashes,
which would include less severe injuries and property damage only (PDO) crashes. A review of
crash reports demonstrated that it was often impossible to determine the impact conditions of the
crash. It was very likely that many of the crashes involved downstream impacts with the end
terminal or side impacts with the upstream terminal. Most crash reports of minor injuries of PDO
crashes excluded scene diagrams and almost never included photos or reconstruction reports.
Therefore, only severe injury and fatal crashes could be used, wherein the crash reports were
more fully documented and often accompanied with scene photos.
It was assumed that the occupants of the vehicle would have driven 10 miles on the
highway prior to the crash. Therefore, exposure was defined as the number and distribution of
end treatments observed in those 10 miles.
Assuming that the exposure data reflects the expected crash frequency, a comparison was
made between the observed number of crashes and the expected number of crashes for each
identified crashworthy end treatment. It was assumed that this proportion would be equal for all
terminals. In other words, no terminal would be more or less dangerous than the baseline

4
terminal. Here, “crashworthy” indicates that the system was crashed tested to at least NCHRP
Report No. 350 test standards and was approved for use on the National Highway System by the
Federal Highway Administration (FHWA) [3]. Only roadside barrier end treatments were
analyzed. This effectively eliminated median treatments because the design constraints were so
different that a fair comparison could not be made.
The significance of the difference between observed and expected frequencies was
determined by statistical analyses, specifically referencing the P-value (such as from Fisher’s
exact test) and the odds ratio (from a logistic regression).

5
Chapter 3. Guardrail Terminal Identification
In general, each state determines what guardrail terminals can be used on their highways,
and contractors pick from that list. Often times, the contractor has an affiliation with a
manufacturer and will use guardrail terminals exclusively from that manufacturer’s product line.
Other times, the contractor will simply choose the least expensive option. However, guardrail
terminals are not always called for by the state department of transportation. On low-speed, low-
volume roads, end treatments that do not absorb energy might be more efficacious. Lastly, some
of these end treatments are as old as the guardrail itself. These systems are often left in place
because of budgetary considerations, since there are possibly thousands of these locations
statewide, or because the relative risk for that section of roadway is low enough not to warrant an
upgrade to a higher performing end treatment. Owing to these complexities, the number of end
treatments was reduced by controlling the end treatment type. The end treatments had to be
considered a crashworthy device for a roadside longitudinal W-beam guardrail such that it was
approved by the FHWA for use on the National Highway System following compliance testing
with at least NCHRP Report No. 350. This list also excluded median treatments, concrete blunt
ends, cable end treatments, and crash cushions. Listed alphabetically, the five crashworthy
guardrail terminals in the following sections were studied.
3.1. ET-2000
The ET-2000 is an early-generation, energy absorbing end terminal. It is produced by
Trinity Highway Products, LLC. Its main distinguishing feature is the device placed on the end
of the guardrail, which is called a head. The guardrail is slid into the feeder chute of the head,
and upon impact, the guardrail is extruded through the head to flatten the rail and kick it out to
the non-traffic side of the road. This extrusion is facilitated by steel plates oriented in a way that
causes the rail element to deform (in this case, flatten). An example of the ET-2000 found in the
photologs of Ohio is shown in Figure 1.
Figure 1. ET-2000 on Interstate 90 in Ashtabula County
3.2. ET-PLUS
The ET-PLUS is a later generation of the ET-2000 and relies on the same basic
principles. It is produced by Trinity Highway Products, LLC. It was redesigned to remove
approximately 100 pounds of steel [4]. Visually, it can be distinguished by its rectangular face,
whereas the ET-2000 used a square face. Additionally, there is no steel plate behind the face on

6
the traffic side. An example of the ET-PLUS found in the photologs of Ohio is shown in Figure
2.
Figure 2. ET-PLUS on State Route 322 in Ashtabula County
3.3. Flared Energy Absorbing Terminal (FLEAT)
The Flared Energy Absorbing Terminal (FLEAT) was designed to be added to the end of
a flared guardrail system. It is produced by Road Systems, Inc. Upon impact, the guardrail is
forced through the head and sequentially kinked to dissipate energy. An example of the FLEAT
found in the photologs of Ohio is shown in Figure 3.
Figure 3. FLEAT on Interstate 77 in Guernsey County
3.4. Sequential Kinking Terminal (SKT)
The Sequential Kinking Terminal (SKT) is an energy-absorbing end terminal produced
by Road Systems, Inc. Upon impact, the guardrail is forced through the head and sequentially
kinked to dissipate energy. Unlike the FLEAT, the SKT is designed to attach to a tangent section
of guardrail. An example of the SKT found in the photologs of Ohio is shown in Figure 4.
Figure 4. SKT on Interstate 77 in Guernsey County

7
3.5. Slotted Rail Terminal (SRT)
The Slotted Rail Terminal (SRT) has strategically placed slots in the rail to reduce the
rail’s stiffness in the event of a head-on impact. It is produced by Trinity Highway Products,
LLC. It utilizes a slight flare to reduce its footprint and crash frequency. An example of the SRT
found in the photologs of Ohio is shown in Figure 5.
Figure 5. SRT on Interstate 77 in Guernsey County
3.6. Summary of EA Tangent Terminals
Energy absorbing (EA) terminals on tangent sections of highway included the ET-2000,
multiple versions of the ET-PLUS, and the SKT. These systems are common in many states
across the nation, and as such, a brief summary of the dimensions are given below. The FLEAT
and SRT were not included. The flared nature of the FLEAT makes it perform substantially
different from a kinematic point of view, and as such, its weight, length, and width are less
critical. The SRT is not an EA terminal, and so it was not included. The summary of the weight,
length of the feeder chute, and the width of the face plate for EA tangent terminals are shown in
Table 1.
Table 1. Summary of Dimensions of Tangent EA Terminals
ET-2000 ET-PLUS (1999) ET-PLUS (2012) SKT
Total Length (in.) 57.25 56.75 55.75 83.125
Feeder Chute (in.) 37 37 36 61
Impact Face Width (in.) 20 15 15 20
Weight (lb) 268 175 165 170
8
Chapter 4. Data Collection
4.1. Sources
Two prevailing types of data were collected: crash location data and exposure data. Crash
data relied primarily upon available information collected at the scene of the crash and included
scene photos and police crash reports. Occasionally, the end treatment involved in the crash
could not be determined from the scene photos, so photologs or street images were used to
supplement the crash location data. On the other hand, exposure data was collected exclusively
using the photologs that were recorded by the State. The following sections provide a detailed
description of scene data, photologs, and street images.
4.2. Crash Data
4.2.1. Scene Data
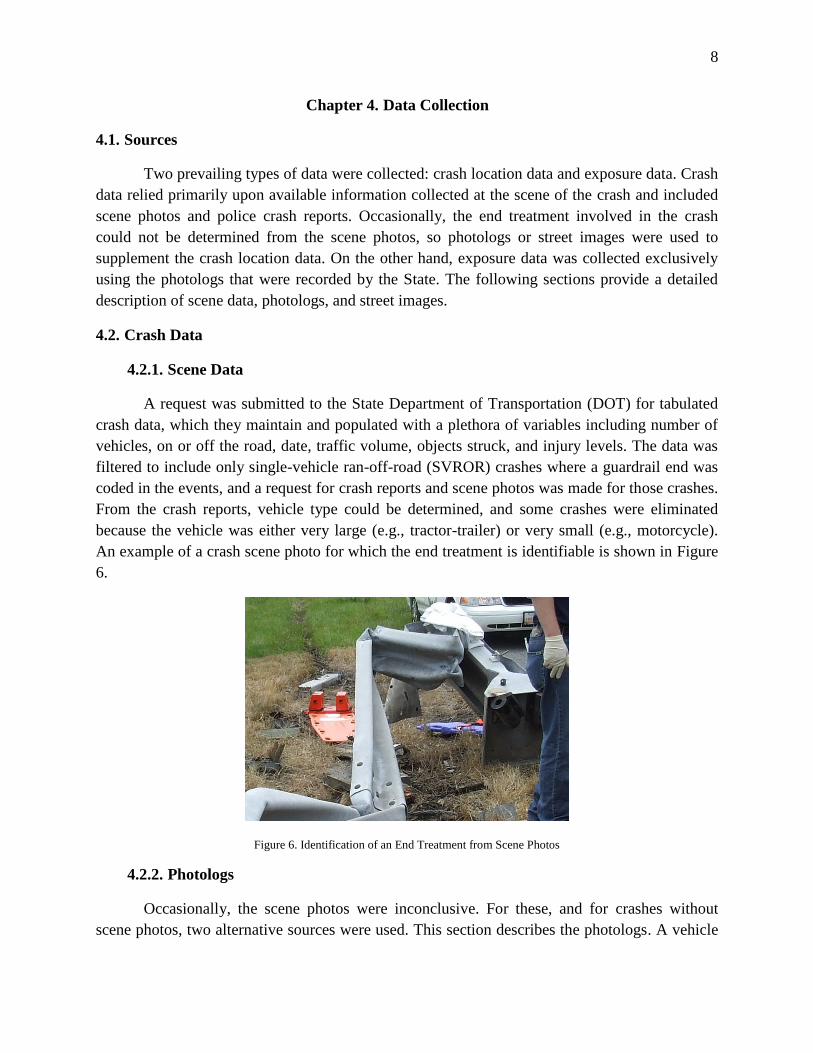
A request was submitted to the State Department of Transportation (DOT) for tabulated
crash data, which they maintain and populated with a plethora of variables including number of
vehicles, on or off the road, date, traffic volume, objects struck, and injury levels. The data was
filtered to include only single-vehicle ran-off-road (SVROR) crashes where a guardrail end was
coded in the events, and a request for crash reports and scene photos was made for those crashes.
From the crash reports, vehicle type could be determined, and some crashes were eliminated
because the vehicle was either very large (e.g., tractor-trailer) or very small (e.g., motorcycle).
An example of a crash scene photo for which the end treatment is identifiable is shown in Figure
6.
Figure 6. Identification of an End Treatment from Scene Photos
4.2.2. Photologs
Occasionally, the scene photos were inconclusive. For these, and for crashes without
scene photos, two alternative sources were used. This section describes the photologs. A vehicle
9
equipped with photography equipment drove on the entire state highway network capturing
photos at regular intervals. Each image was tagged with a date, county, route number, mile post,
and geographical coordinates. The latitude and longitude provided in the crash reports were used
to pinpoint the location of the crash, and when possible, nearby landmarks from the scene photos
were used to ensure accuracy in the site location. The photolog with the closest year to the crash
date was chosen, but the photolog had to predate the crash. If the oldest photolog was more
recent than the crash, then the crash was not included in the database.
4.2.3. Street Images
This was the second alternative source for end treatment identification when scene photos
were inconclusive or non-existent. In conjunction with the photologs, street images were
identified by first estimating the location based on coordinates. Then, when possible, landmarks
from the scene photos or photologs were used to precisely determine the location. Using
archived street photos, the closest year to the crash date was chosen, but the street image had to
predate the crash. If the oldest archived street image was newer than the crash date, the crash was
not included in the database.
4.3. Exposure Data
For this study, exposure was defined as the number of end treatments that a driver would
encounter in a 10-mile segment of the highway immediately prior to the crash location. Here,
“crash location” is a reference to the location of SVROR crashes with a guardrail end impact
coded as the MHE. To gather this exposure data, the state photologs were used. In these
photologs, the current segment could end when a county line is passed. In this event, the analyst
would have to manually reselect the highway on the opposite side of the county line and continue
gathering data until the 10-mile requirement was met. On very rare occasions, the road would
pass into another state. Since this study was pertinent to each state individually, and because the
photologs end at state lines, these segments were shorter than 10 miles.
Additional rules for gathering exposure data are listed as follows:
Only upstream ends were included.
For divided highways, only the direction of travel was considered.
Work zones were not excluded.
Urban areas were not excluded.
10
Chapter 5. Statistical Analyses
The software package NCSS 9 was used to determine the statistical significance of the
differences in distributions for each NCHRP Report No. 350-compliant end treatment. Also, it
was used to estimate the odds ratio of an A+K or K crash for each system relative to the ET-
2000, which represents the baseline system because it was the first energy-absorbing system
approved under NCHRP Report No. 350.
5.1. Probability and Odds Ratio
For each system, the number of crashes was divided by the number of those systems in
the exposure data. This quotient represented the probability of a system being involved in a
crash. Then, the odds ratio was calculated from these probabilities. First, the ET-2000 was
chosen as the baseline system. Then, the probability of each of the other systems was divided by
the probability of the ET-2000 to calculate the odds ratio between the ET-2000 and each of the
other guardrail terminals. In essence, this approach would estimate the likelihood that the system
was involved in the crash relative to the ET-2000. The probability and odds ratio equations are
shown below.
𝑃𝑆𝑦𝑠𝑡𝑒𝑚 𝑋 =𝑁𝑜. 𝑜𝑓 𝐶𝑟𝑎𝑠ℎ𝑒𝑠
𝐸𝑥𝑝𝑜𝑠𝑢𝑟𝑒
𝑂𝑅 =𝑃𝑆𝑦𝑠𝑡𝑒𝑚 𝑋
𝑃𝐸𝑇−2000
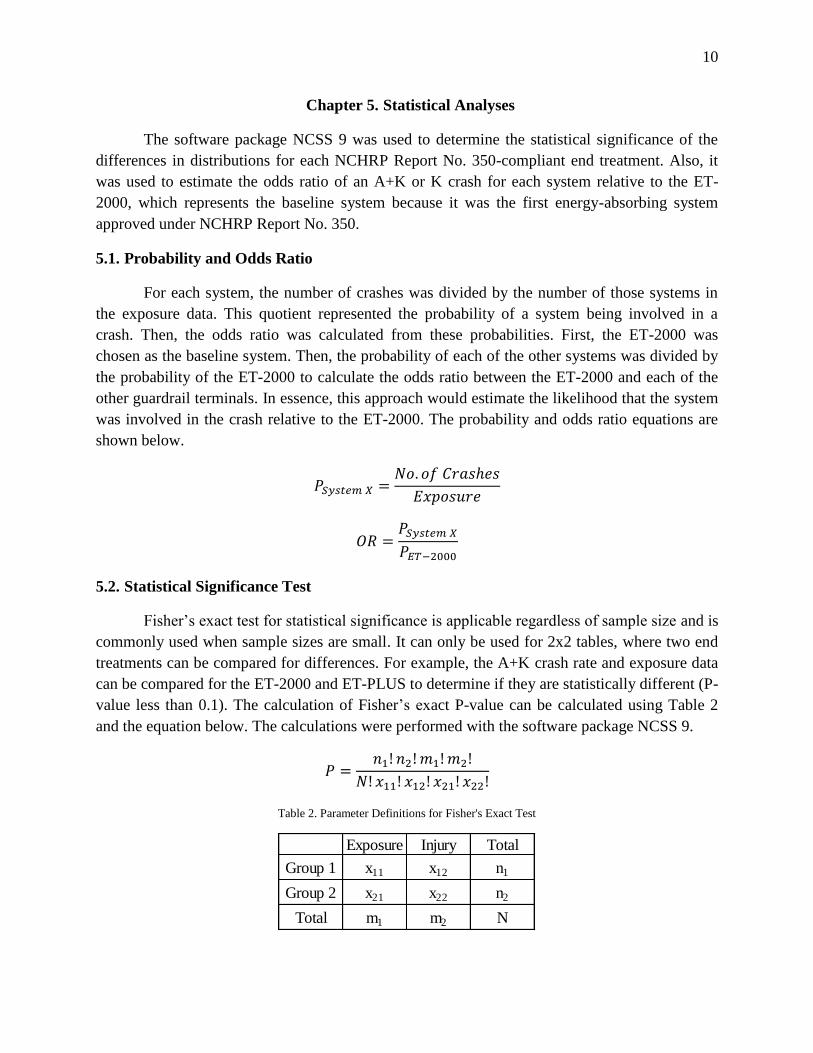
5.2. Statistical Significance Test
Fisher’s exact test for statistical significance is applicable regardless of sample size and is
commonly used when sample sizes are small. It can only be used for 2x2 tables, where two end
treatments can be compared for differences. For example, the A+K crash rate and exposure data
can be compared for the ET-2000 and ET-PLUS to determine if they are statistically different (P-
value less than 0.1). The calculation of Fisher’s exact P-value can be calculated using Table 2
and the equation below. The calculations were performed with the software package NCSS 9.
𝑃 =𝑛1! 𝑛2! 𝑚1! 𝑚2!
𝑁! 𝑥11! 𝑥12! 𝑥21! 𝑥22!
Table 2. Parameter Definitions for Fisher's Exact Test
Exposure Injury Total
Group 1 x11 x12 n1
Group 2 x21 x22 n2
Total m1 m2 N

11
Because the ET-2000 was the first crashworthy energy-absorbing end terminal, it was
used as a baseline for comparison to analyze the other systems. Essentially, this notion follows
the principle that all subsequent systems should perform at least as well as the first system.
5.3. Logistic Regression
A logistic regression was conducted in each state, using speed limit and the end treatment
type as variables. From the data, speed limit was typically shown to be statistically insignificant,
with P-values greater than 0.10, leaving only one variable in the logistic regression. Although
this type of analysis can be a useful tool, it was not considered appropriate when only one
variable remained in the model. Therefore, unless otherwise stated, only descriptive statistics,
such as the odds ratio and Fisher’s exact P-values, were used. In each state, the logistic
regression will be described, and either the statements made in this paragraph will be echoed or a
more in-depth analysis will be presented. A general description of a logistic regression follows.
Logistic regression studies the relationship between a dependent variable and a set of
independent variables, and in this case, the dependent variable had only two categories (injury
and exposure). A 1-way regression model was chosen, meaning that no interaction between end
treatments was studied. This was done because the installation of a system is not necessarily a
function of the installation of any other system. A general equation associated with the logistic
regression is shown below:
ln (𝑝
1 − 𝑝) = 𝛽0 + 𝛽1𝑋1 + ⋯ + 𝛽𝑛𝑋𝑛
Where, 𝑝 = proportion of observations
𝛽0 = intercept in the regression model
𝛽𝑛 = regression coefficient for the system 𝑛
𝑋𝑛 = independent variable from exposure for system 𝑛
This logistic regression was applied to each end treatment as the reference parameter. In
other words, the performance of all other crashworthy systems was studied via independent
logistic regression models. Independent variables included speed limit and end treatment type. If
speed limit was removed from the model due to a large P-value, only one independent variable
remained. This independent variable (end treatment involved in the crash) was modeled with the
exposure data, where the ET-2000 was held as a reference parameter. In other words, the odds
ratios from the separate models (one for each terminal in the crash database) were calculated
relative to the ET-2000, similar to the descriptive statistics described in Section 5.1. An OR of
1.0 would indicate that the corresponding system had the same odds of causing an injury or
fatality as the ET-2000. An OR larger than 1.0 indicated a higher risk of injury or fatality than
the ET-2000.

12
Chapter 6. Missouri
6.1. Deviation from Research Approach
More than 700 crashes were investigated as part of the study. Most of those crashes were
filtered out for basic reasons, such as the involvement of a semi tractor-trailer, or the upstream
end of the guardrail was struck. However, many other crashes were also filtered out because of a
lack of available data. They occurred predominantly on low-volume, low-speed roads where
crashworthy terminals are unlikely to be installed. When the oldest available photolog was newer
than the date of the crash, that crash was excluded from the analysis.
6.2. A+K Crash Data
In the State of Missouri, there were 156 A+K crashes involving a crashworthy end
terminal between January 4th
, 2005 and March 29th
, 2014. Scene photos were used to identify the
end treatment involved in the crash. When scene photos were not available, the online photologs
were used. The ET-PLUS was involved in nearly two-thirds of the crashes. The crash
distribution for the five crashworthy systems is shown in Table 3.
Table 3. Distribution of End Treatments in A+K Crashes
6.3. Fatal Crash Data
There were 23 fatal crashes in the data set. Almost three quarters of them involved an
ET-PLUS. The distribution of the identified systems for fatal crashes is shown in Table 4.
Table 4. Distribution of End Treatments in Fatal Crashes
System Total Distribution
ET-2000 49 31.4%
ET-Plus 93 59.6%
FLEAT 0 0.0%
SKT 0 0.0%
SRT 14 9.0%
Total 156 100.0%
System Total Distribution
ET-2000 4 17.4%
ET-Plus 17 73.9%
FLEAT 0 0.0%
SKT 0 0.0%
SRT 2 8.7%
Total 23 100.0%
13
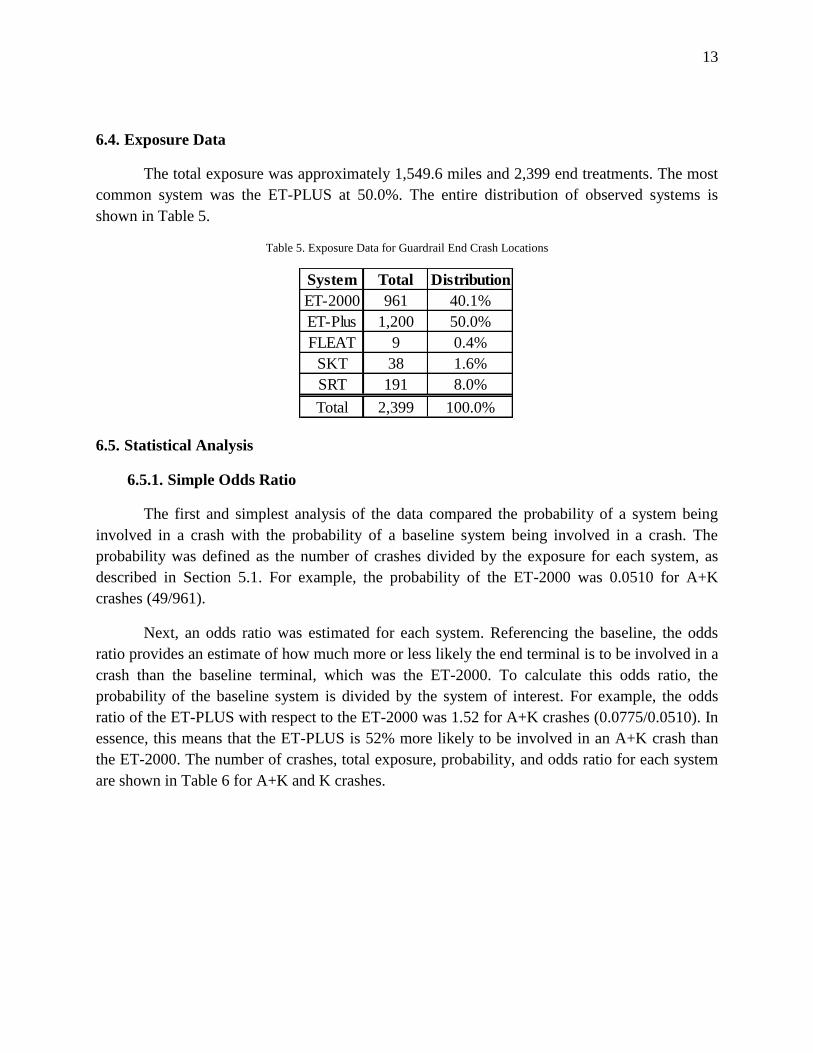
6.4. Exposure Data
The total exposure was approximately 1,549.6 miles and 2,399 end treatments. The most
common system was the ET-PLUS at 50.0%. The entire distribution of observed systems is
shown in Table 5.
Table 5. Exposure Data for Guardrail End Crash Locations
6.5. Statistical Analysis
6.5.1. Simple Odds Ratio
The first and simplest analysis of the data compared the probability of a system being
involved in a crash with the probability of a baseline system being involved in a crash. The
probability was defined as the number of crashes divided by the exposure for each system, as
described in Section 5.1. For example, the probability of the ET-2000 was 0.0510 for A+K
crashes (49/961).
Next, an odds ratio was estimated for each system. Referencing the baseline, the odds
ratio provides an estimate of how much more or less likely the end terminal is to be involved in a
crash than the baseline terminal, which was the ET-2000. To calculate this odds ratio, the
probability of the baseline system is divided by the system of interest. For example, the odds
ratio of the ET-PLUS with respect to the ET-2000 was 1.52 for A+K crashes (0.0775/0.0510). In
essence, this means that the ET-PLUS is 52% more likely to be involved in an A+K crash than
the ET-2000. The number of crashes, total exposure, probability, and odds ratio for each system
are shown in Table 6 for A+K and K crashes.
System Total Distribution
ET-2000 961 40.1%
ET-Plus 1,200 50.0%
FLEAT 9 0.4%
SKT 38 1.6%
SRT 191 8.0%
Total 2,399 100.0%

14
Table 6. Simple Probability and Odds Ratios
6.5.2. Statistical Significance Tests
There were 156 A+K crashes to go with the total of 2,399 end treatments in the exposure
data. To check if any one end treatment had a statistically significant contribution to this crash
rate, Fisher’s exact test was conducted for each treatment, comparing it to the ET-2000, which
was the original energy absorbing end terminal. This was done because of the expectation that
subsequent systems would show an improvement in safety performance. For example, there were
14 A+K crashes involving a SRT and 191 SRTs in the exposure data. By comparison, the ET-
2000 had 49 crashes and 961 units of exposure. The resulting Fisher’s exact value was 0.231,
which would indicate that the difference in the two systems was not statistically significant. The
Fisher’s exact values for each system compared to the ET-2000 for both A+K and K crashes are
shown in Table 7. The only statistical significance was in the A+K and K crashes when
comparing the ET-PLUS to the ET-2000, indicating that the ET-PLUS was statistically different
than the ET-2000.
Table 7. P-Values for Statistical Significance
System Accidents Exposure Probability Odds Ratio*
ET-2000 49 961 0.0510 1.00
ET-PLUS 93 1,200 0.0775 1.52
FLEAT 0 9 0.0000 0.00
SKT 0 38 0.0000 0.00
SRT 14 191 0.0733 1.44
System Accidents Exposure Probability Odds Ratio*
ET-2000 4 961 0.0042 1.00
ET-PLUS 17 1,200 0.0142 3.40
FLEAT 0 9 0.0000 0.00
SKT 0 38 0.0000 0.00
SRT 2 191 0.0105 2.52
A+K Crashes
K Crashes
*Odds of System X being involved in the accident compared to ET-2000
A+K K only
ET-PLUS 0.023 0.025
FLEAT 1.000 1.000
SKT 1.000 1.000
SRT 0.231 0.263
Comparing to ET-2000
SystemFisher Exact Values

15
6.5.3. Logistic Regression
The exposure collected for each crash was included with the end treatment involved in
the crash as one row in the data table used to conduct the logistic regression. Effectively, this
meant the logistic regression was conditioned upon the exposure at each location independently.
Doing so ensured that the probability of a system being involved in a crash was not masked by
the overall average exposure. For example, if a crash involved an ET-PLUS, but 95% of the
exposure in the 10-mile segment leading up to that crash consisted of ET-PLUS guardrail
terminals, then the involvement of the ET-PLUS was not unexpected.
Speed limit from the crash reports was also used in the logistic regression as an
independent variable. Along with the exposure for all 5 crashworthy systems, an initial model
was developed. However, the speed limit and exposure of the FLEAT, and SKT were not
statistically significant in the model or from Fisher’s exact values (for the guardrail terminals
only, excluding speed limit). Therefore, the final logistic regression model was conducted using
only exposure data for the ET-PLUS, ET-2000, and SRT. Since speed limit was eliminated from
the model, only the end treatment type remained as an independent variable. The logistic
regression confirmed odds ratios above 1.0 for the ET-PLUS relative to the ET-2000. Since this
analysis did not overturn the trends from the descriptive statistics, and because there was only
one independent variable in the final model, it was not used to derive conclusions and
recommendations. Instead, the descriptive statistics using odds ratios and Fisher’s exact P-values
were used.
6.6. Discussion and Recommendations
The probability of a guardrail terminal being involved in a crash was calculated using the
crash site and exposure data for each of the 5 crashworthy guardrail terminals. Then, using the
ET-2000 as a baseline, an odds ratio was calculated relative to the other systems (i.e., the odds of
a terminal being involved versus an ET-2000). For Missouri, the odds ratios of the ET-PLUS
were found to be 1.52 and 3.40 for A+K and K crashes, respectively, when compared to its
predecessor, the ET-2000. According to the Fisher’s exact P-values, each of these ratios was
statistically significant at the P < 0.03 level. Further, in Missouri, only the ET-PLUS was found
to be statistically different than the performance of the ET-2000.
Considering the small sample size for the FLEAT, SKT, and SRT, it is recommended that
further research and crash data collection be undertaken in order to provide a more complete
analysis of these additional guardrail terminal options.

16
Chapter 7. Ohio
7.1. Deviation from Research Approach
Ohio was the first state to contribute data to this project, and as such, most of the
processes developed for studying these end treatments correlated to the available data in Ohio.
However, the data set was considerably smaller than Missouri’s data set, and as such, the
statistical analysis was limited.
7.2. A+K Crash Data
Data between 2006 and 2013 was analyzed in the State of Ohio. Most crash scene photos
were detailed enough to determine the end treatment involved in the crash, like the one shown in
Figure 6. Of the 83 crashes with available scene photos, the end treatment could be identified in
74 of them. The data set was further reduced to include only crashworthy guardrail terminals,
leaving 60 crashes. The crash distribution for these five systems is shown in Table 8.
Table 8. Supplemented End Treatment Distributions
7.3. Fatal Crash Data
The prior tables of crash data all pertain to A+K crashes. However, fatal crashes represent
an especially severe category and warrant special consideration. The distribution of the identified
systems for fatal cases is shown in Table 9.
Table 9. Distribution of End Treatments in Fatal Crashes
End Treatment Sum Proportion
ET-2000 28 46.7%
ET-PLUS 26 43.3%
FLEAT 0 0.0%
SKT 0 0.0%
SRT 6 10.0%
Total 60 100.0%
End Treatment Sum Proportion
ET-PLUS 4 80.0%
ET-2000 1 20.0%
FLEAT 0 0.0%
SKT 0 0.0%
SRT 0 0.0%
Total 5 100.0%
17
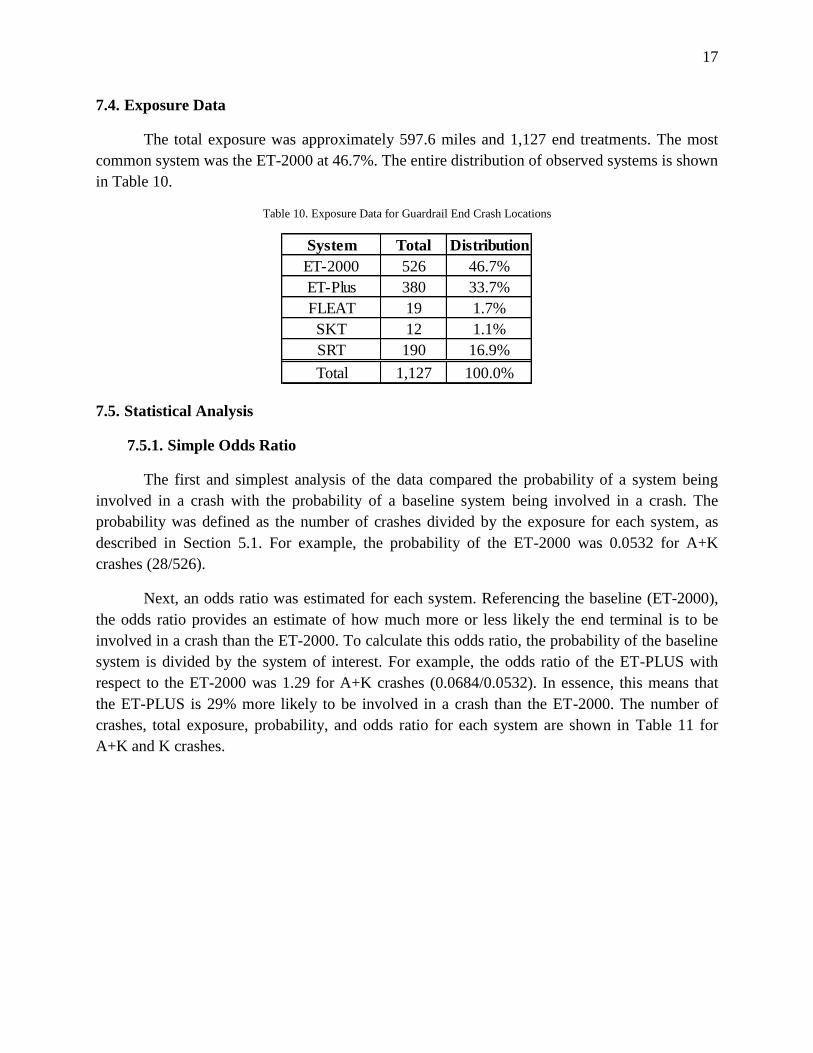
7.4. Exposure Data
The total exposure was approximately 597.6 miles and 1,127 end treatments. The most
common system was the ET-2000 at 46.7%. The entire distribution of observed systems is shown
in Table 10.
Table 10. Exposure Data for Guardrail End Crash Locations
7.5. Statistical Analysis
7.5.1. Simple Odds Ratio
The first and simplest analysis of the data compared the probability of a system being
involved in a crash with the probability of a baseline system being involved in a crash. The
probability was defined as the number of crashes divided by the exposure for each system, as
described in Section 5.1. For example, the probability of the ET-2000 was 0.0532 for A+K
crashes (28/526).
Next, an odds ratio was estimated for each system. Referencing the baseline (ET-2000),
the odds ratio provides an estimate of how much more or less likely the end terminal is to be
involved in a crash than the ET-2000. To calculate this odds ratio, the probability of the baseline
system is divided by the system of interest. For example, the odds ratio of the ET-PLUS with
respect to the ET-2000 was 1.29 for A+K crashes (0.0684/0.0532). In essence, this means that
the ET-PLUS is 29% more likely to be involved in a crash than the ET-2000. The number of
crashes, total exposure, probability, and odds ratio for each system are shown in Table 11 for
A+K and K crashes.
System Total Distribution
ET-2000 526 46.7%
ET-Plus 380 33.7%
FLEAT 19 1.7%
SKT 12 1.1%
SRT 190 16.9%
Total 1,127 100.0%

18
Table 11. Simple Probability and Odds Ratios
7.5.2. Statistical Significance Tests
There were 60 A+K crashes to go with the total of 1,127 end treatments in the exposure
data. To check if any one end treatment had a statistically significant contribution to this crash
rate, Fisher’s exact test was conducted for each treatment, comparing it to the ET-2000, which
was the original energy absorbing end terminal. This was done with the expectation that
subsequent systems would show an improvement in safety performance. For example, there were
6 A+K crashes involving a SRT and 190 SRTs in the exposure data. By comparison, the ET-
2000 had 28 crashes and 526 units of exposure. The resulting Fisher’s exact value was 0.319,
which would indicate that the difference in the two systems was not statistically significant. The
Fisher’s exact values for each system compared to the ET-2000 for both A+K and K crashes are
shown in Table 12. None of the systems yielded statistically significant results, and since the
data was collected retrospectively, this data would have to supplement with additional years of
data or with additional states.
Table 12. P-Values for Statistical Significance
System Accidents Exposure Probability Odds Ratio*
ET-2000 28 526 0.0532 1.00
ET-PLUS 26 380 0.0684 1.29
FLEAT 0 19 0.0000 0.00
SKT 0 12 0.0000 0.00
SRT 6 190 0.0316 0.59
System Accidents Exposure Probability Odds Ratio*
ET-2000 1 526 0.0019 1.00
ET-PLUS 4 380 0.0105 5.54
FLEAT 0 19 0.0000 0.00
SKT 0 12 0.0000 0.00
SRT 0 190 0.0000 0.00
A+K Crashes
K Crashes
*Odds of System X being involved in the accident compared to ET-2000
A+K K only
ET-PLUS 0.397 0.168
FLEAT 1.000 1.000
SKT 1.000 1.000
SRT 0.319 1.000
Comparing to ET-2000
SystemFisher Exact Values
19
7.5.3. Logistic Regression
The data set in Ohio was small, and as such, an extensive conditional logistic regression
could not be conducted. However, an unconditional logistic regression was attempted for the
limited data set. Possibly due to the small sample size, no statistical significance was observed in
the regression model. As such, it is recommended that more data be collected to conduct a
conditional logistic regression.
7.6. Discussion and Recommendations
Considering the small sample size, it is recommended that further research and crash data
collection be undertaken in order to provide a more complete analysis of these additional
guardrail terminal options in the State of Ohio.
20
Chapter 8. Overall Conclusions
Thus far, two states have contributed to the study by supplying crash data and access to
archived photologs. These states are listed below:
Missouri
Ohio
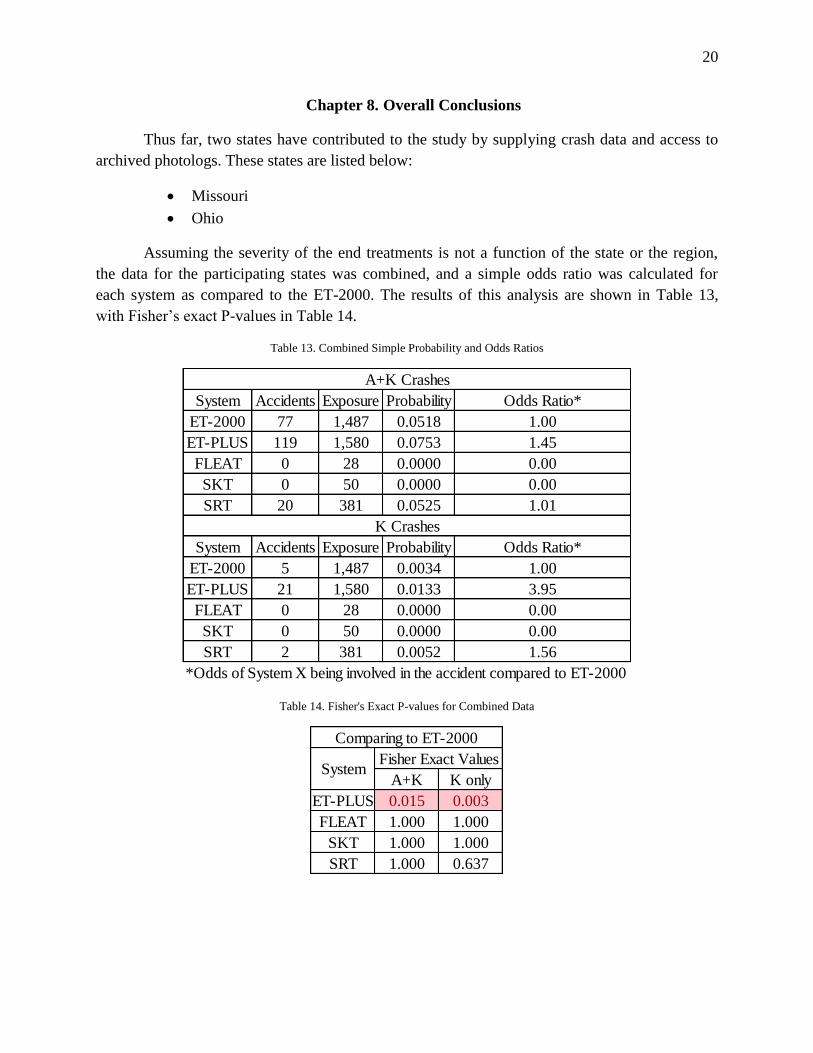
Assuming the severity of the end treatments is not a function of the state or the region,
the data for the participating states was combined, and a simple odds ratio was calculated for
each system as compared to the ET-2000. The results of this analysis are shown in Table 13,
with Fisher’s exact P-values in Table 14.
Table 13. Combined Simple Probability and Odds Ratios
Table 14. Fisher's Exact P-values for Combined Data
System Accidents Exposure Probability Odds Ratio*
ET-2000 77 1,487 0.0518 1.00
ET-PLUS 119 1,580 0.0753 1.45
FLEAT 0 28 0.0000 0.00
SKT 0 50 0.0000 0.00
SRT 20 381 0.0525 1.01
System Accidents Exposure Probability Odds Ratio*
ET-2000 5 1,487 0.0034 1.00
ET-PLUS 21 1,580 0.0133 3.95
FLEAT 0 28 0.0000 0.00
SKT 0 50 0.0000 0.00
SRT 2 381 0.0052 1.56
A+K Crashes
K Crashes
*Odds of System X being involved in the accident compared to ET-2000
A+K K only
ET-PLUS 0.015 0.003
FLEAT 1.000 1.000
SKT 1.000 1.000
SRT 1.000 0.637
Comparing to ET-2000
SystemFisher Exact Values

21
The odds ratios for the ET-PLUS, compared to the ET-2000, for both A+K and K crashes
were both statistically significant to the P < 0.02 confidence level. Therefore, the overall trend
for all states included in the analysis shows that the ET-PLUS is 1.45 times more likely to be
involved in a severe injury than the ET-2000. More poignantly however, the ET-PLUS is 3.95
times more likely to be involved in a fatal crash than the ET-2000.
The results and conclusions pertinent to one state are not necessarily pertinent to any
other state. In general, trends and regional effects would be observed amongst neighboring states
with similar populations and design standards.
Unfortunately, combining the two data sets still did not provide a large enough sample
size for statistical evaluation of the safety performance of the FLEAT, SKT, and SRT. It is
recommended that states with high exposure to these terminals should be added to this study in
order to provide objective guidance for use of these terminals.

22
Chapter 9. References
1. Roadside Design Guide, American Association of State Highway and Transportation
Officials (AASHTO), Washington, D.C., 2011.
2. Gabler, H.C., Gabauer, D.J., and Hampton, C.E., Criteria for Restoration of Longitudinal
Barriers, National Cooperative Highway Research Program (NCHRP) Report No. 656,
Transportation Research Board, Washington, D.C., 2010.
3. Ross, H.E., Sicking, D.L., Zimmer, R.A., and Michie, J.D., Recommended Procedures for the
Safety Performance Evaluation of Highway Features, National Cooperative Highway
Research Program (NCHRP) Report 350, Transportation Research Board, Washington, D.C.,
1993.
4. Home, D.A., Federal Highway Administration (FHWA), Acceptance Letter – NCHRP Report
350 Testing of the ET-2000 PLUS, HMHS-CC12G, January 18, 2000.