Embed Size (px)
Citation preview
RELATIVE CHIRALITY INDEX: A NOVEL APPROACH TO THE CHARACTERIZATION OF MOLECULAR CHIRALITY
A THESIS SUBMITTED TO THE FACULTY OF THE GRADUATE SCHOOL
OF THE UNIVERSITY OF MINNESOTA BY
Terrence Sherman Neumann
IN PARTIAL FULFILLMENT OF THE REQUIREMENTS FOR THE DEGREE OF MASTER OF SCIENCE
Subhash Basak
Paul Siders
January 2011
Copyright Terrence Sherman Neumann 2011
Reproduced in part with permission from
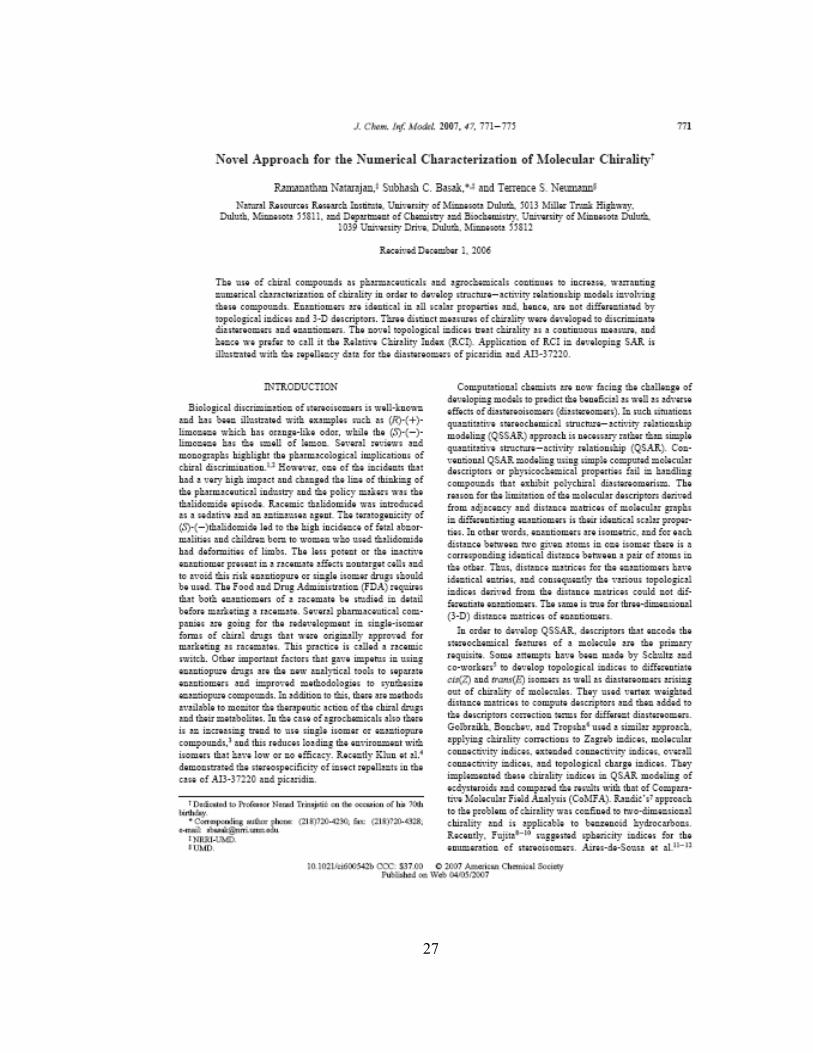
Natarajan R.; Basak S.C.; Neumann, T.S. Novel Approach for the Numerical Characterization of Molecular Chirality J. Chem. Inf. Model. 2007, 47, 771-775.
Copyright 2007 American Chemical Society.

i
Acknowledgements
I would like to thank Dr. Subhash Basak and Dr. Ramanathan Natarajan for their
integral help in the development of this thesis. The support given by Mr. Brian Gute and
Ms. Denise Mills also proved to be help in the advancement of my formal education.
A word of thanks to my family for their understanding and constant support in all
my endeavors. Finally, I must thank my wife, Andrea, without whose support; this
document would likely remain unfinished.
ii
Abstract
Chiral compounds are being increasingly used as pharmaceuticals and agrochemicals to
limit potential side effects of a drug, such as the thalidomide tragedy, and to limit the
chemical load on the environment. Therefore it is important to be able to model
properties of chiral compounds so such side effects can be avoided. A new method to
encode information about the chirality of molecules is described herein. The Relative
Chirality Index (RCI) was devised to encode chirality information. This index was
shown to be useful to encode information about different molecules. The index is able to
differentiate one stereoisomer from another in a logical manner. An application of this
index to experimental data is also described.
iii
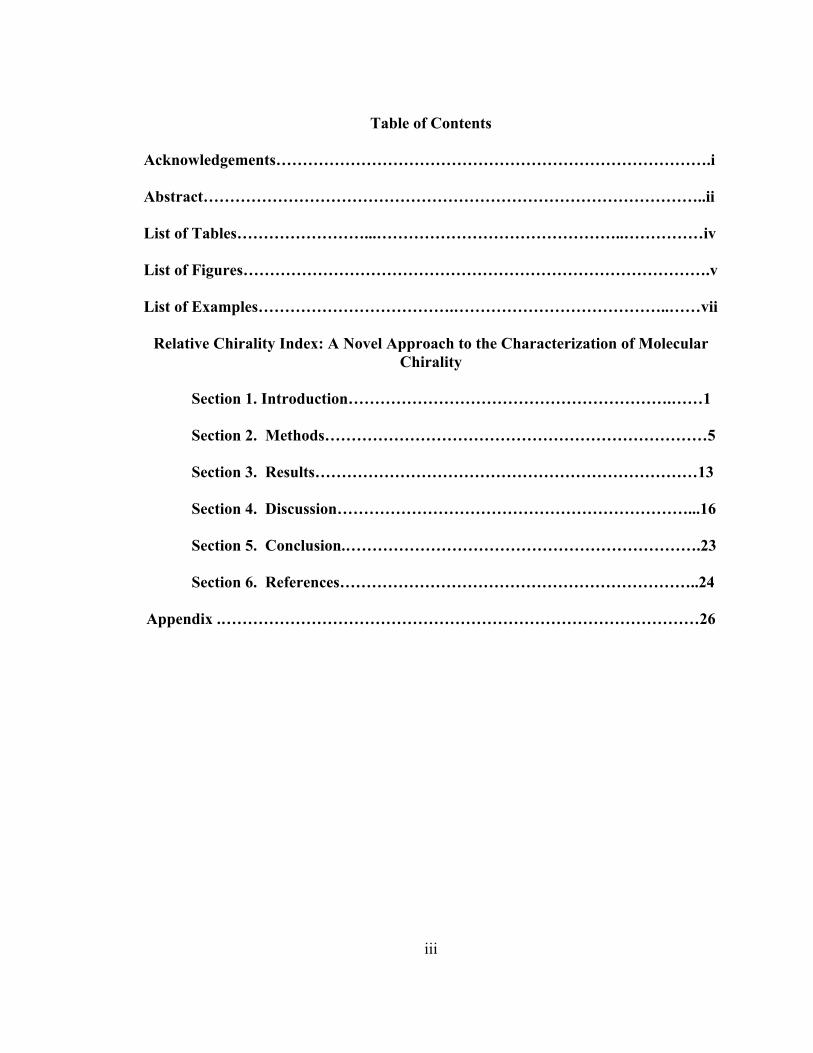
Table of Contents
Acknowledgements……………………………………………………………………….i
Abstract…………………………………………………………………………………..ii
List of Tables……………………...………………………………………..……………iv
List of Figures…………………………………………………………………………….v
List of Examples……………………………….…………………………………..……vii
Relative Chirality Index: A Novel Approach to the Characterization of Molecular Chirality
Section 1. Introduction…………………………………………………….……1
Section 2. Methods………………………………………………………………5
Section 3. Results………………………………………………………………13
Section 4. Discussion…………………………………………………………...16
Section 5. Conclusion.………………………………………………………….23
Section 6. References…………………………………………………………..24
Appendix .………………………………………………………………………………26
iv
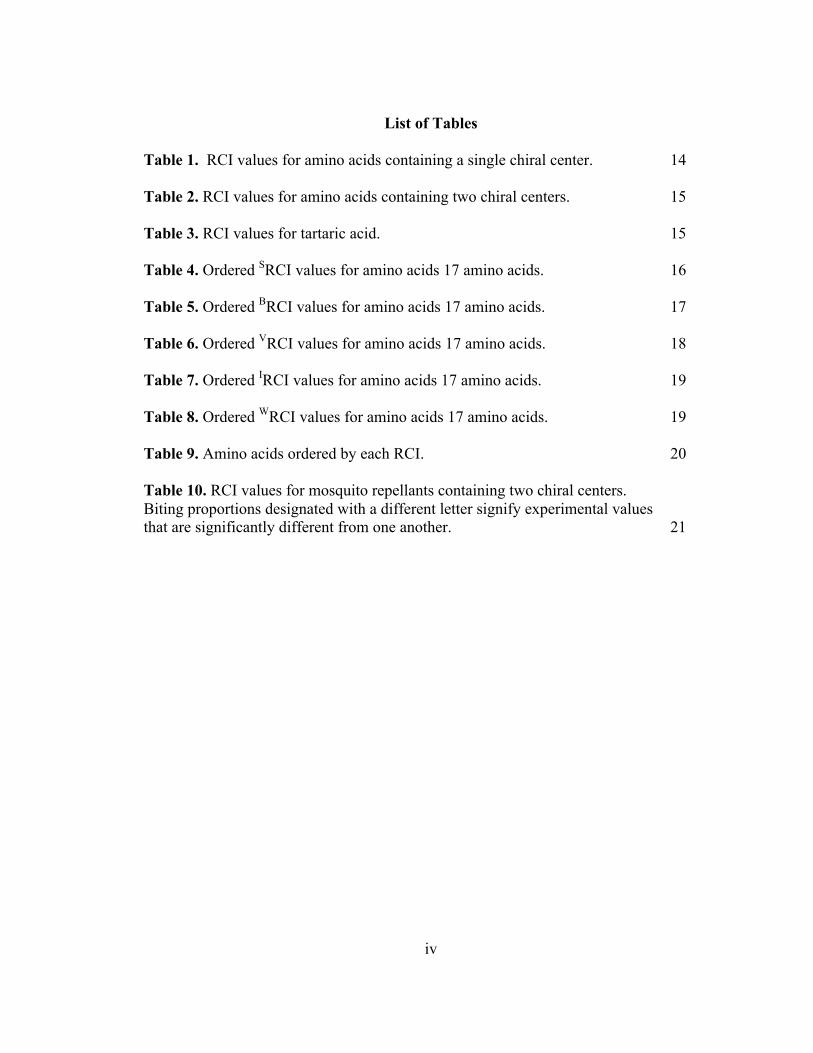
List of Tables
Table 1. RCI values for amino acids containing a single chiral center. 14
Table 2. RCI values for amino acids containing two chiral centers. 15 Table 3. RCI values for tartaric acid. 15 Table 4. Ordered SRCI values for amino acids 17 amino acids. 16 Table 5. Ordered BRCI values for amino acids 17 amino acids. 17 Table 6. Ordered VRCI values for amino acids 17 amino acids. 18 Table 7. Ordered IRCI values for amino acids 17 amino acids. 19 Table 8. Ordered WRCI values for amino acids 17 amino acids. 19 Table 9. Amino acids ordered by each RCI. 20 Table 10. RCI values for mosquito repellants containing two chiral centers. Biting proportions designated with a different letter signify experimental values that are significantly different from one another. 21
v
List of Figures
Figure 1. Depiction of simulation of the Cahn-Ingold-Prelog rules in calculating the RCIR. 6 Figure 2. Depiction of simulation of the Cahn-Ingold-Prelog rules in calculating the RCIS. 6 Figure 3. Hydrogen repressed graph of the amino acid alanine. 7 Figure 4. Hydrogen repressed graph of the amino acid threonine neglecting stereochemistry. The numbered carbons represent the chiral centers in the molecule. 11 Figure 5. Hydrogen-repressed standard α-amino acid structure representative of 18 of 19 molecules for the data set. 13 Figure 6. Hydrogen-repressed structure of proline. 14 Figure 7. Mosquito repellants that have two chiral centers. 21
vi
List of Examples
Example 1. Calculation of SRCI for the amino acid alanine. 7
Example 2. Calculation of BRCI for the amino acid alanine. 8
Example 3. Calculation of VRCI for the amino acid alanine. 8
Example 4. Calculation of IRCI for the amino acid alanine. 9
Example 5. Calculation of WRCI for the amino acid alanine. 10
Example 6. Calculation of VRCI for the molecule of D-allo-threonine. 11

1
Relative Chirality Index: A Novel Approach to the Characterization of Molecular
Chirality
Section 1. Introduction
The increased knowledge of biological systems has led to the realization that
chirality is often an important factor in the receptor/substrate interaction.1 Moreover,
regulating authorities are encouraging the use of chiral compounds to increase the effect
while reducing the dose or quantity of chemical needed to produce the effect. This has
made necessary the advancement of synthetic methods to produce enantiomerically pure
compounds as well as the technology to separate these compounds from their racemates.
The term chiral is used to describe a molecule that is not super-imposable on its mirror
image. These two mirror images are called enantiomers. Molecules containing two
stereocenters have four stereoisomers, which can be paired into two sets of two
enantiomers. Each stereoisomer that is not a mirror image of another stereoisomer is
called a diastereomer. An equal mixture of enantiomers is said to be racemic.
Molecular chirality has become an important topic recently as the Food and Drug
Administration (FDA) has begun regulating the production of racemic drugs due to
tragedies such the Thalidomide case of the 1950s and 1960s.2,3 Since each stereoisomer
can have its own biological activity, it is important to be able to separate the
stereoisomers from each other. The Thalidomide case is an example of this. One
stereoisomer provided the antiemetic therapeutic effect and the other stereoisomer caused
deformities in the fetus.1,4
2
Chemicals can be represented by molecular graphs from which various invariants
can be calculated or the matrices associated with the molecular graph.5,6 These
descriptors are based on molecular structure and use theories from organic chemistry,
quantum chemistry, information theory, graph theory, or other fields. Using these
descriptors, one can predict various molecular properties or biological activities. These
models have been used in a wide range of applications in fields like toxicology,
medicinal chemistry, environmental chemistry, and physical chemistry, to mention just a
few. One famous example of this was the use of the Wiener index to model the boiling
point of hydrocarbons. By using the Wiener index to turn the molecular structure of the
various hydrocarbons into numbers, Harry Wiener was able to develop a model for the
boiling point that greatly reduced the variance of previous models.5
The use of chiral compounds as pharmaceuticals and agrochemicals continues to
increase, warranting numerical characterization of chirality in order to develop structure-
activity relationship models involving these compounds.7 Conventional topological
indices that describe the molecular topology, 3-D descriptors, and quantum chemical
descriptors of energetics cannot differentiate enantiomers or diastereomers. There have
been some attempts to develop topological indices to differentiate stereoisomers and
enantiomers. The Schultz indices use a chiral factor (CF) of +1 for an R configuration
and a CF of -1 for an S configuration following the Cahn-Ingold-Prelog (CIP) convention
for designating absolute configuration.7 The CIP convention assigns priority to groups
attached to a stereocenter based on molecular weight of the substituent closest to the
stereocenter. The lowest priority group is rotated to the position away from the viewer.

3
The absolute configuration for the stereocenter is assigned by connecting the groups by
increasing priority in a clockwise manner for “R” or anti-clockwise manner for “S”.
Golbaikh, et al. have developed chirality descriptors from molecular topology. Using a
chirality correction (+ or – system) that is added to the vertex degrees of the asymmetric
atoms, these indices have adjusted existing indices to correct for asymmetric atoms.8
Randic has developed a chirality index involving atomic asymmetry contributions. This
approach assigns symmetric values with opposite signs for enantiomers and assigns a
value of zero for all achiral systems. 9 Treating chirality as a discontinuous measure,
however, has limitations in the application to quantitative structure-activity relationships
(QSAR). These indices have a bias because the values for the enantiomers may not
correctly follow the activity that is modeled. Also, the ordering of diasteromeric
compounds has been shown to be biased when using discontinuous measures. 10-11 Other
methods have been developed based on algebraic structure, but are not suitable for use in
quantitative structure activity relationships.12-14 Another approach using so called
“chirality factors” modified traditional molecular descriptors to predict properties.15
A new method for calculating chirality indices has been proposed. These indices
are called the Relative Chirality Indices (RCI). Using the Cahn-Ingold-Prelog rules as a
basis for the calculations of the new chirality indices afforded the use of a three-point
interaction model, which is often used in biodiscrimination models of enantiomers. A
single molecular representation results from the priority ranking of the substituents
attached to the chiral atom. In order to develop this index, the RCI was limited to the
4
representation of chirality around a carbon atom. Extension to 2D chirality and other
atomic chiral centers would require modification of the RCI algorithm.16
This thesis will describe the calculation of the RCI, discuss the application of the
RCI to a group of amino acids, and implement the RCI in a structure-activity relationship
(SAR) for a set of mosquito repellants.17,18
5
Section 2. Methods
Chirality Indices. Calculating the Relative Chirality Index (RCI) for a given molecule
includes multiple steps. First, the Cahn-Ingold-Prelog rules were applied to the molecule
to determine priority of substituents on the chiral carbon atom.16 Second, each
substituent was assigned its corresponding group descriptor (δi) value if a single atom or
calculated as a sum of descriptor values accounting for proximity to the chiral center via
shortest topological (integer, through bond) distance.
where n1 is the adjacent atom (nearest neighbor), n2 is separated by one atom, n3 by two
atoms, etc. This diminishing factor was included as atoms closer to the chiral center will
affect the chiral carbon atom more than atoms further away from the chiral center. The
scaling by 2ni-1 was an attempt to simulate this. Finally, relative chirality indices can be
calculated by applying the appropriate equation for the R-isomer or S-isomer,
respectively.
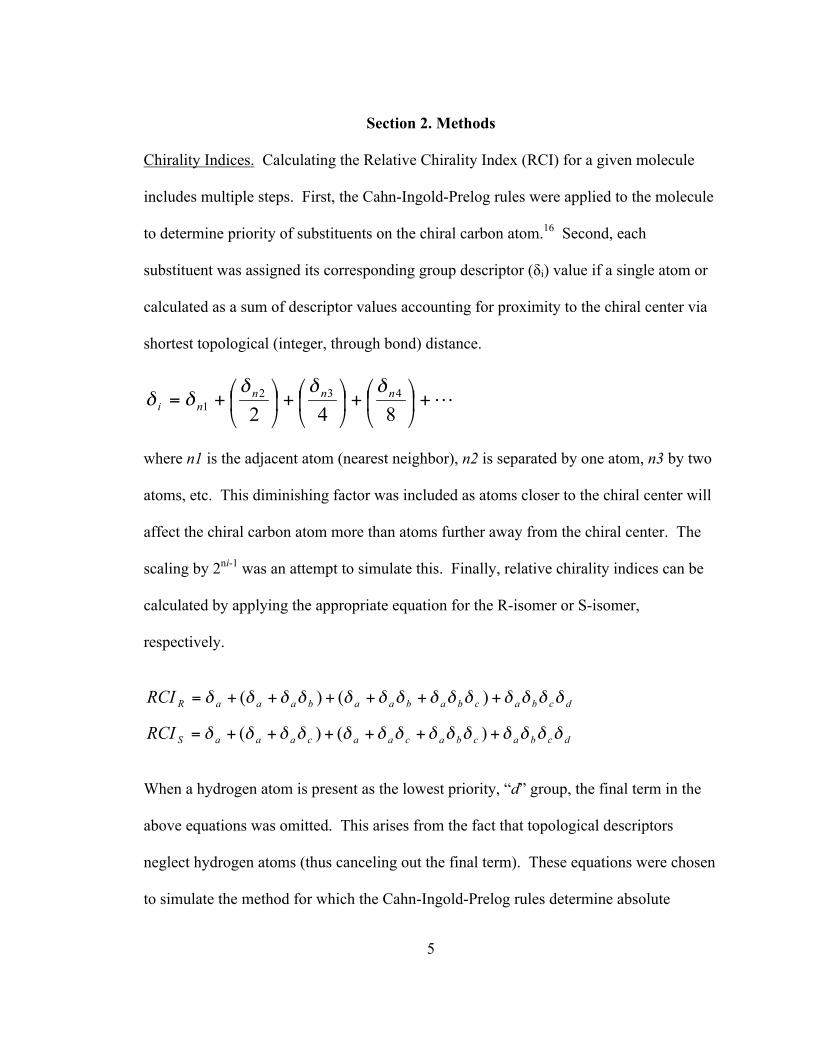
When a hydrogen atom is present as the lowest priority, “d” group, the final term in the
above equations was omitted. This arises from the fact that topological descriptors
neglect hydrogen atoms (thus canceling out the final term). These equations were chosen
to simulate the method for which the Cahn-Ingold-Prelog rules determine absolute
6
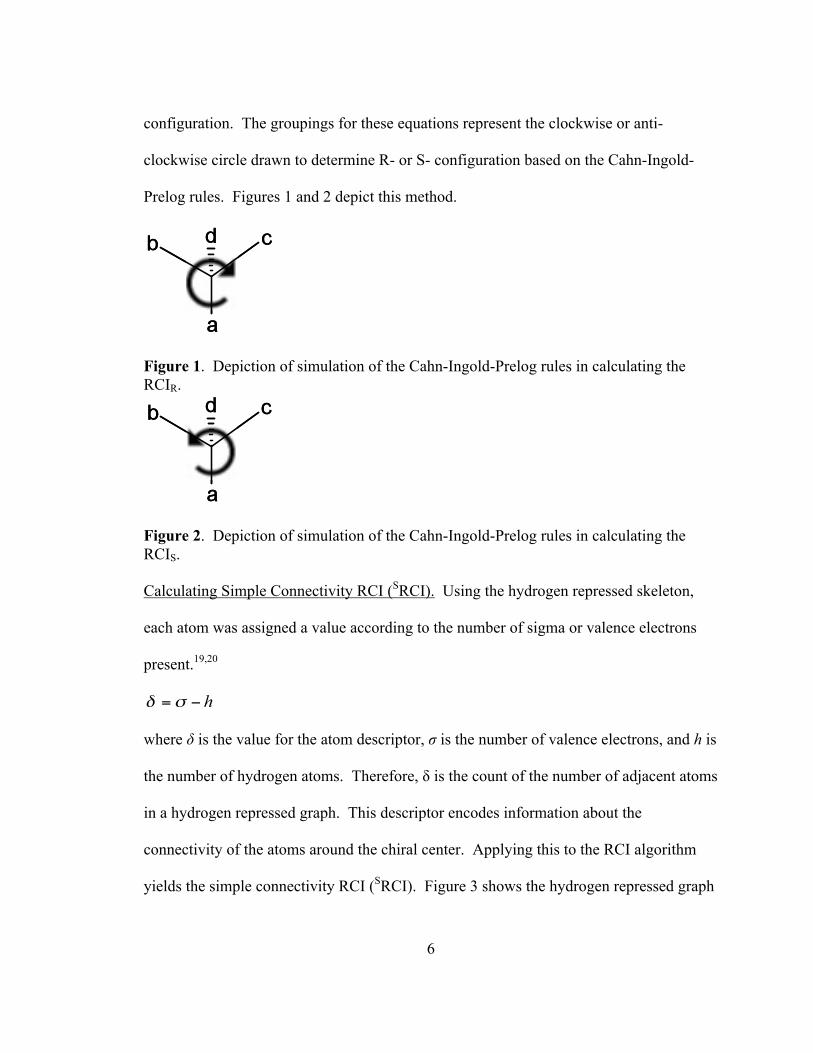
configuration. The groupings for these equations represent the clockwise or anti-
clockwise circle drawn to determine R- or S- configuration based on the Cahn-Ingold-
Prelog rules. Figures 1 and 2 depict this method.
Figure 1. Depiction of simulation of the Cahn-Ingold-Prelog rules in calculating the RCIR.
Figure 2. Depiction of simulation of the Cahn-Ingold-Prelog rules in calculating the RCIS. Calculating Simple Connectivity RCI (SRCI). Using the hydrogen repressed skeleton,
each atom was assigned a value according to the number of sigma or valence electrons
present.19,20
where δ is the value for the atom descriptor, σ is the number of valence electrons, and h is
the number of hydrogen atoms. Therefore, δ is the count of the number of adjacent atoms
in a hydrogen repressed graph. This descriptor encodes information about the
connectivity of the atoms around the chiral center. Applying this to the RCI algorithm
yields the simple connectivity RCI (SRCI). Figure 3 shows the hydrogen repressed graph

7
of alanine and its chiral carbon. Example 1 depicts an example of the calculation
involving the amino acid alanine.
Figure 3. Hydrogen repressed graph of the amino acid alanine with RCI labeling convention. Example 1. Calculation of SRCI for the amino acid alanine.
Calculating Bond Connectivity RCI (BRCI). Calculation of the bond connectivity for an
atom is the sum of all its σ and π bonds in a hydrogen repressed graph. 19,20 This
descriptor encodes information for the connectivity around the chiral center similar to
that of the simple connectivity descriptor, but also includes information about double and
triple bonds. Example 2 shows an example of the calculation for BRCI.
8
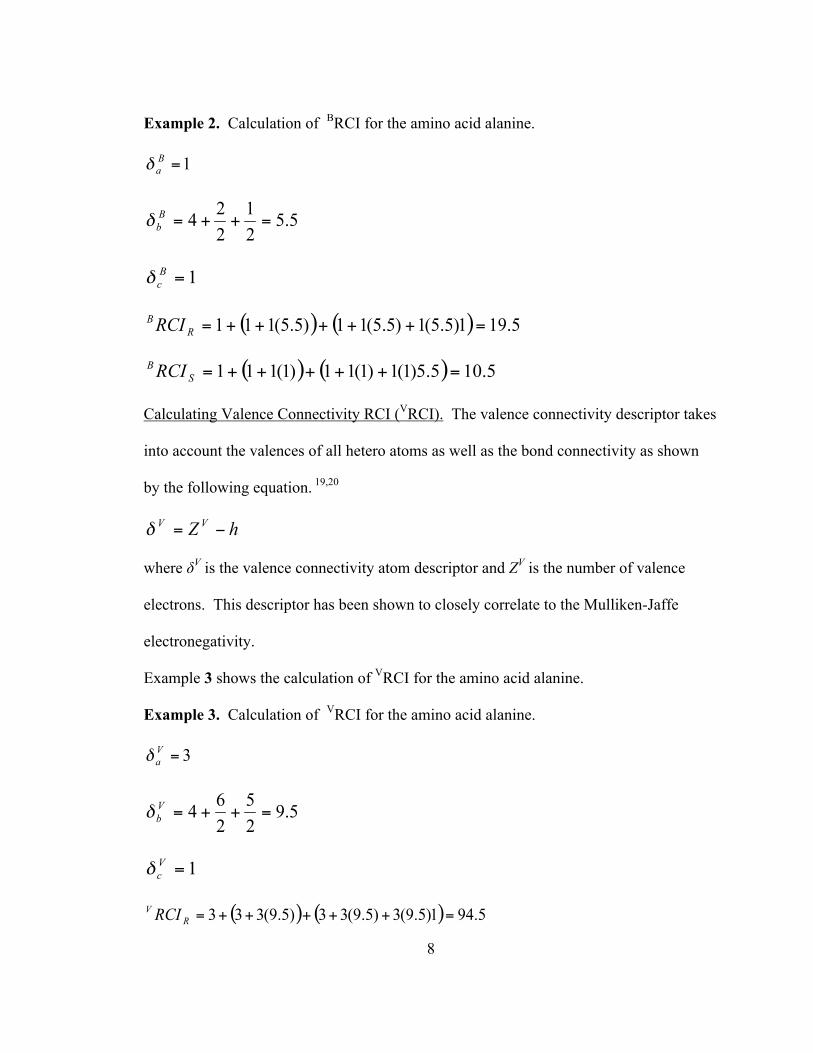
Example 2. Calculation of BRCI for the amino acid alanine.
Calculating Valence Connectivity RCI (VRCI). The valence connectivity descriptor takes
into account the valences of all hetero atoms as well as the bond connectivity as shown
by the following equation. 19,20
where δV is the valence connectivity atom descriptor and ZV is the number of valence
electrons. This descriptor has been shown to closely correlate to the Mulliken-Jaffe
electronegativity.
Example 3 shows the calculation of VRCI for the amino acid alanine.
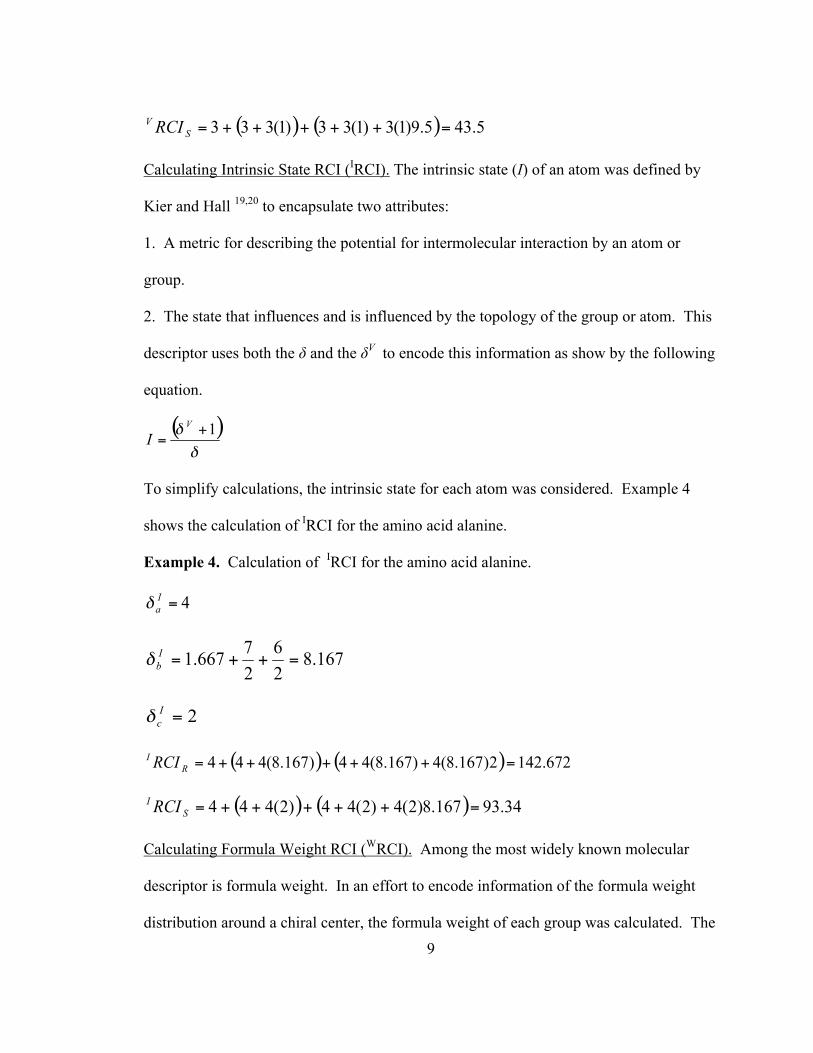
Example 3. Calculation of VRCI for the amino acid alanine.
9
Calculating Intrinsic State RCI (IRCI). The intrinsic state (I) of an atom was defined by
Kier and Hall 19,20 to encapsulate two attributes:
1. A metric for describing the potential for intermolecular interaction by an atom or
group.
2. The state that influences and is influenced by the topology of the group or atom. This
descriptor uses both the δ and the δV to encode this information as show by the following
equation.
To simplify calculations, the intrinsic state for each atom was considered. Example 4
shows the calculation of IRCI for the amino acid alanine.
Example 4. Calculation of IRCI for the amino acid alanine.
Calculating Formula Weight RCI (WRCI). Among the most widely known molecular
descriptor is formula weight. In an effort to encode information of the formula weight
distribution around a chiral center, the formula weight of each group was calculated. The
10
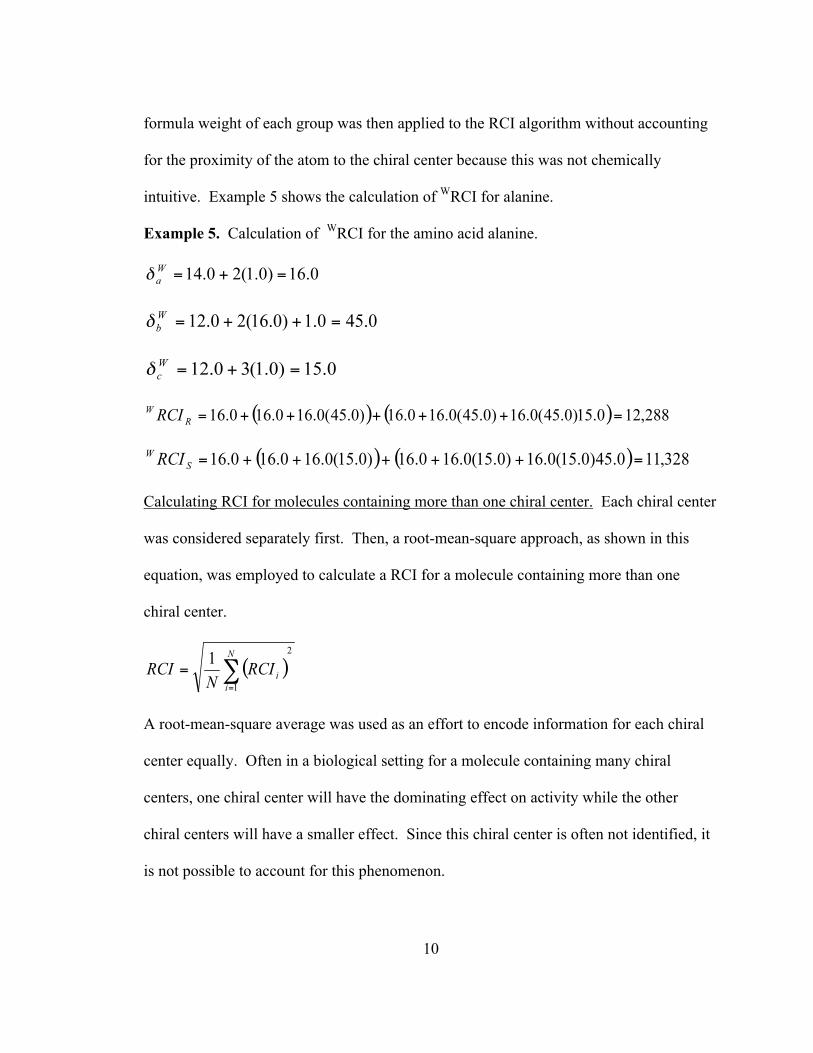
formula weight of each group was then applied to the RCI algorithm without accounting
for the proximity of the atom to the chiral center because this was not chemically
intuitive. Example 5 shows the calculation of WRCI for alanine.
Example 5. Calculation of WRCI for the amino acid alanine.
Calculating RCI for molecules containing more than one chiral center. Each chiral center
was considered separately first. Then, a root-mean-square approach, as shown in this
equation, was employed to calculate a RCI for a molecule containing more than one
chiral center.
A root-mean-square average was used as an effort to encode information for each chiral
center equally. Often in a biological setting for a molecule containing many chiral
centers, one chiral center will have the dominating effect on activity while the other
chiral centers will have a smaller effect. Since this chiral center is often not identified, it
is not possible to account for this phenomenon.
11
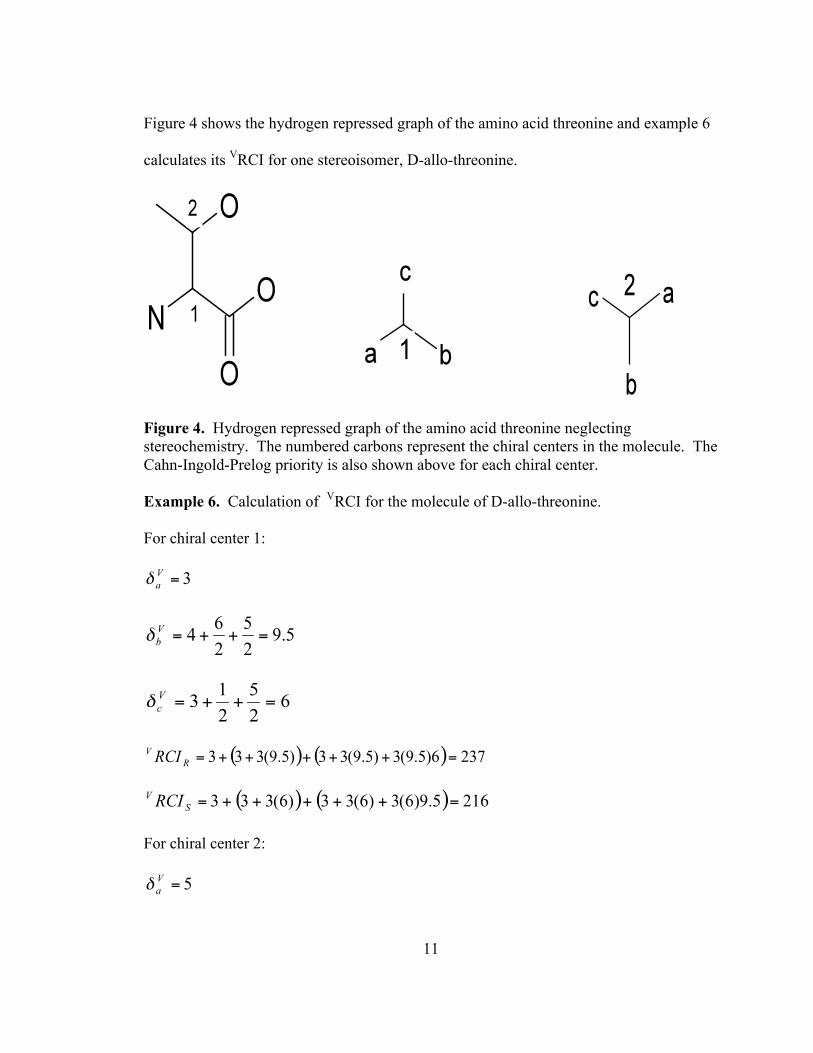
Figure 4 shows the hydrogen repressed graph of the amino acid threonine and example 6
calculates its VRCI for one stereoisomer, D-allo-threonine.
Figure 4. Hydrogen repressed graph of the amino acid threonine neglecting stereochemistry. The numbered carbons represent the chiral centers in the molecule. The Cahn-Ingold-Prelog priority is also shown above for each chiral center. Example 6. Calculation of VRCI for the molecule of D-allo-threonine.
For chiral center 1:
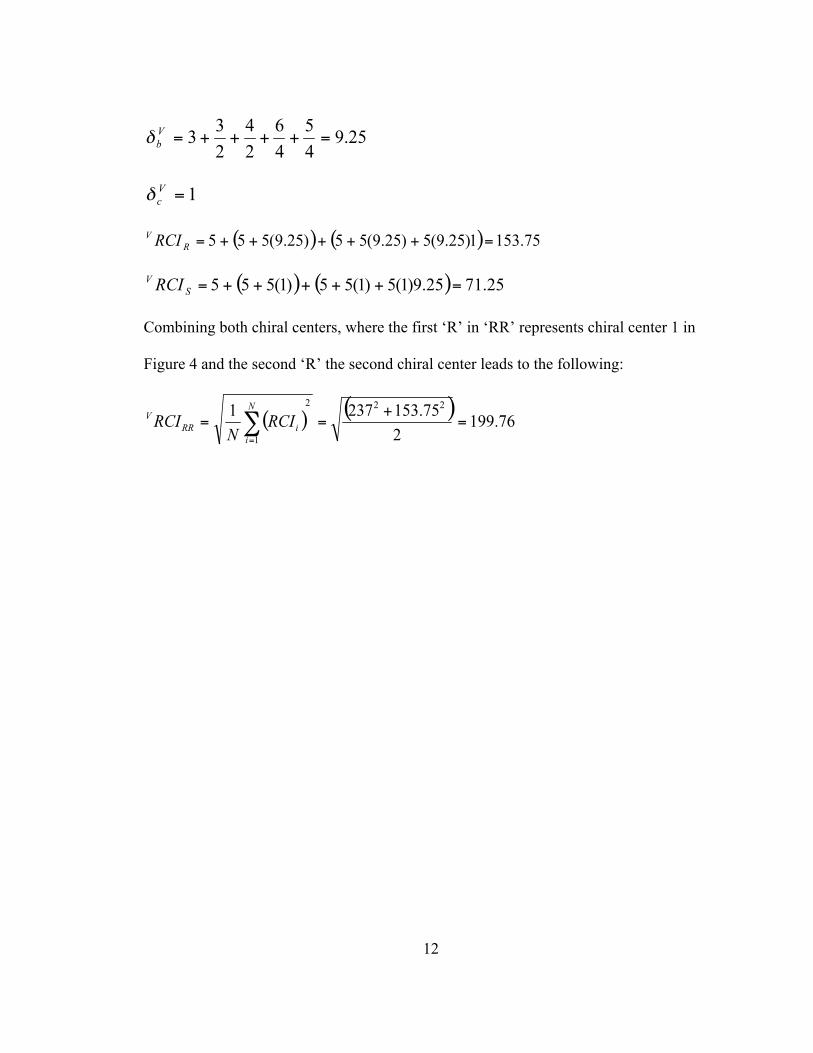
For chiral center 2:
12
Combining both chiral centers, where the first ‘R’ in ‘RR’ represents chiral center 1 in
Figure 4 and the second ‘R’ the second chiral center leads to the following:

13
Section 3. Results
Understanding RCI. While developing a novel molecular descriptor, important factors
must be considered. The descriptor should be able to discriminate molecules based on
the factor it is designed to discriminate, for this study, chirality. It should also encode
information about the molecule, in this case distribution of atoms around a chiral center.
Therefore, it was necessary to apply the RCI algorithm to a well-known set of chiral
molecules. The data set chosen was the 20 standard α-amino acids. Glycine was not
included as it does not contain a chiral center. The 19 remaining standard α-amino acids
represent an interesting data set for this particular study. Figure 5 shows the structure of
18 of 19 standard α-amino acids used for this study. Figure 6 shows the structure of
proline. Note the residue backbonding onto the main amino acid framework. Therefore,
the RCI algorithm was tested rigorously as many molecules were structurally similar.
Also, by only varying the residue portion of the molecule, a qualitative understanding of
the encoded information was gathered.
Figure 5. Hydrogen-repressed standard α-amino acid structure representative of 18 of 19 molecules for the data set.
14
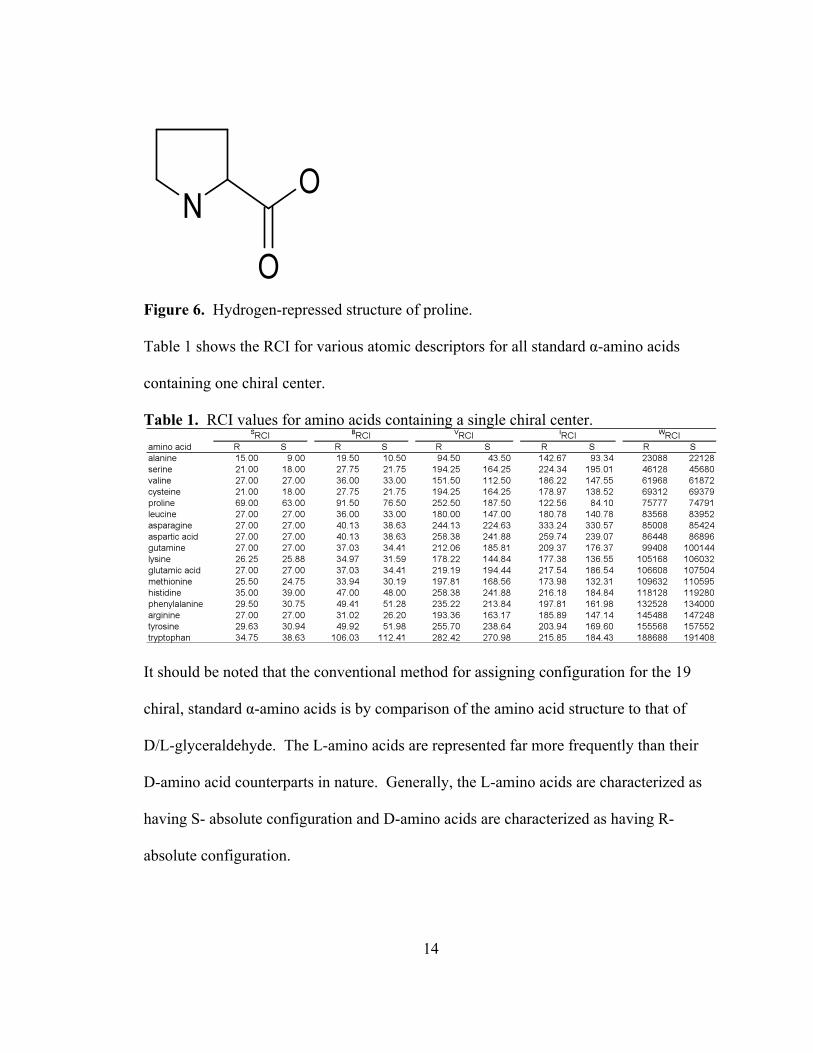
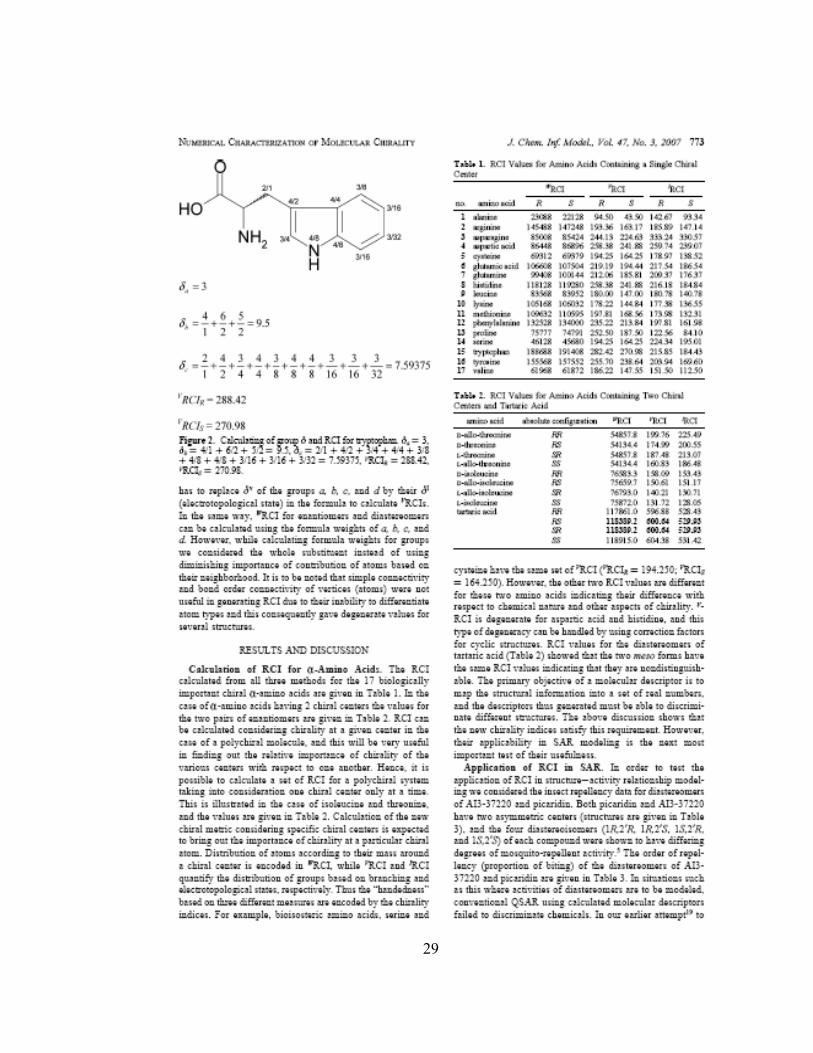
Figure 6. Hydrogen-repressed structure of proline. Table 1 shows the RCI for various atomic descriptors for all standard α-amino acids
containing one chiral center.
Table 1. RCI values for amino acids containing a single chiral center.
It should be noted that the conventional method for assigning configuration for the 19
chiral, standard α-amino acids is by comparison of the amino acid structure to that of
D/L-glyceraldehyde. The L-amino acids are represented far more frequently than their
D-amino acid counterparts in nature. Generally, the L-amino acids are characterized as
having S- absolute configuration and D-amino acids are characterized as having R-
absolute configuration.
15
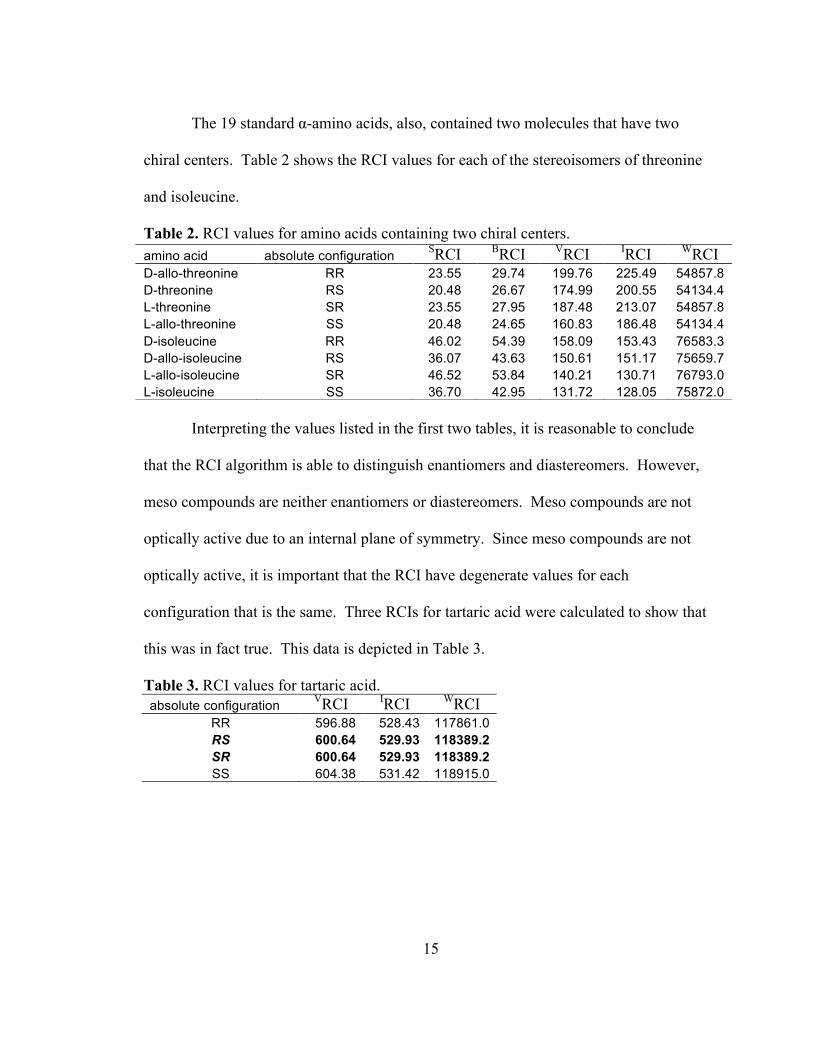
The 19 standard α-amino acids, also, contained two molecules that have two
chiral centers. Table 2 shows the RCI values for each of the stereoisomers of threonine
and isoleucine.
Table 2. RCI values for amino acids containing two chiral centers.
Interpreting the values listed in the first two tables, it is reasonable to conclude
that the RCI algorithm is able to distinguish enantiomers and diastereomers. However,
meso compounds are neither enantiomers or diastereomers. Meso compounds are not
optically active due to an internal plane of symmetry. Since meso compounds are not
optically active, it is important that the RCI have degenerate values for each
configuration that is the same. Three RCIs for tartaric acid were calculated to show that
this was in fact true. This data is depicted in Table 3.
Table 3. RCI values for tartaric acid. absolute configuration VRCI IRCI WRCI
RR 596.88 528.43 117861.0 RS 600.64 529.93 118389.2 SR 600.64 529.93 118389.2 SS 604.38 531.42 118915.0
amino acid absolute configuration SRCI BRCI VRCI IRCI WRCI D-allo-threonine RR 23.55 29.74 199.76 225.49 54857.8 D-threonine RS 20.48 26.67 174.99 200.55 54134.4 L-threonine SR 23.55 27.95 187.48 213.07 54857.8 L-allo-threonine SS 20.48 24.65 160.83 186.48 54134.4 D-isoleucine RR 46.02 54.39 158.09 153.43 76583.3 D-allo-isoleucine RS 36.07 43.63 150.61 151.17 75659.7 L-allo-isoleucine SR 46.52 53.84 140.21 130.71 76793.0 L-isoleucine SS 36.70 42.95 131.72 128.05 75872.0
16
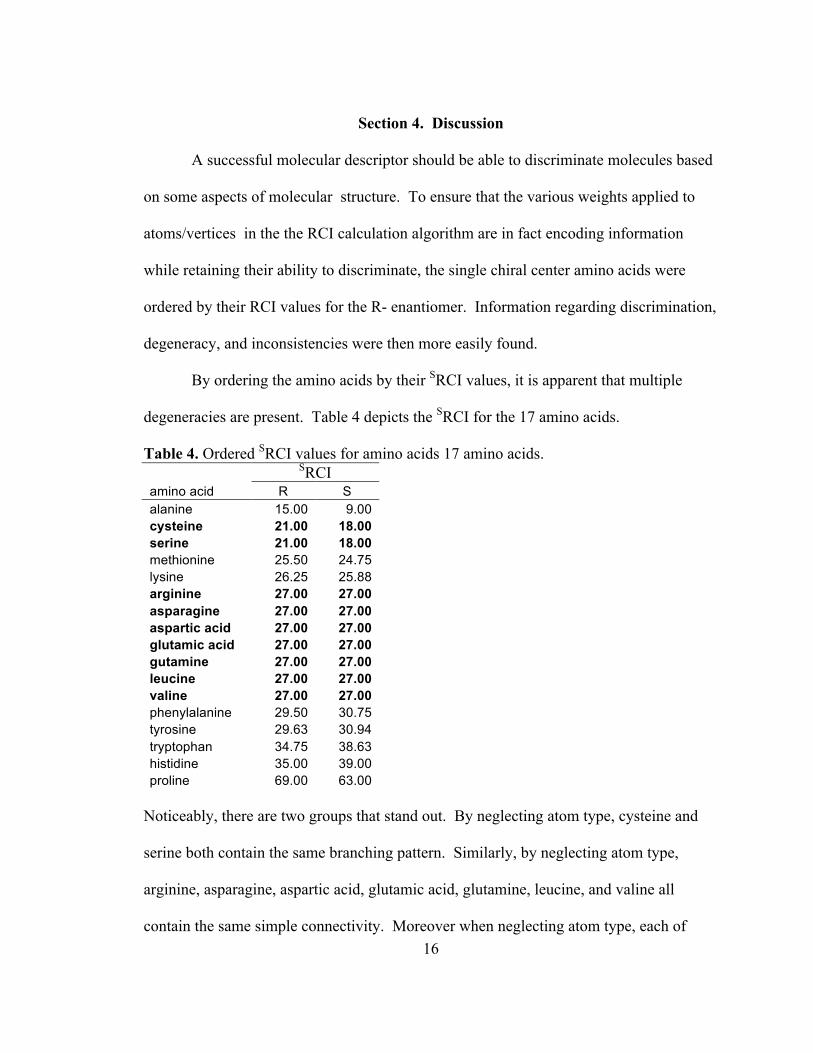
Section 4. Discussion
A successful molecular descriptor should be able to discriminate molecules based
on some aspects of molecular structure. To ensure that the various weights applied to
atoms/vertices in the the RCI calculation algorithm are in fact encoding information
while retaining their ability to discriminate, the single chiral center amino acids were
ordered by their RCI values for the R- enantiomer. Information regarding discrimination,
degeneracy, and inconsistencies were then more easily found.
By ordering the amino acids by their SRCI values, it is apparent that multiple
degeneracies are present. Table 4 depicts the SRCI for the 17 amino acids.
Table 4. Ordered SRCI values for amino acids 17 amino acids. SRCI amino acid R S alanine 15.00 9.00 cysteine 21.00 18.00 serine 21.00 18.00 methionine 25.50 24.75 lysine 26.25 25.88 arginine 27.00 27.00 asparagine 27.00 27.00 aspartic acid 27.00 27.00 glutamic acid 27.00 27.00 gutamine 27.00 27.00 leucine 27.00 27.00 valine 27.00 27.00 phenylalanine 29.50 30.75 tyrosine 29.63 30.94 tryptophan 34.75 38.63 histidine 35.00 39.00 proline 69.00 63.00
Noticeably, there are two groups that stand out. By neglecting atom type, cysteine and
serine both contain the same branching pattern. Similarly, by neglecting atom type,
arginine, asparagine, aspartic acid, glutamic acid, glutamine, leucine, and valine all
contain the same simple connectivity. Moreover when neglecting atom type, each of
17
these amino acids contains a pseudo plane of internal symmetry and are basically seen as
not being chiral. Therefore, the SRCI cannot reliably discriminate between amino acids
or enantiomers.
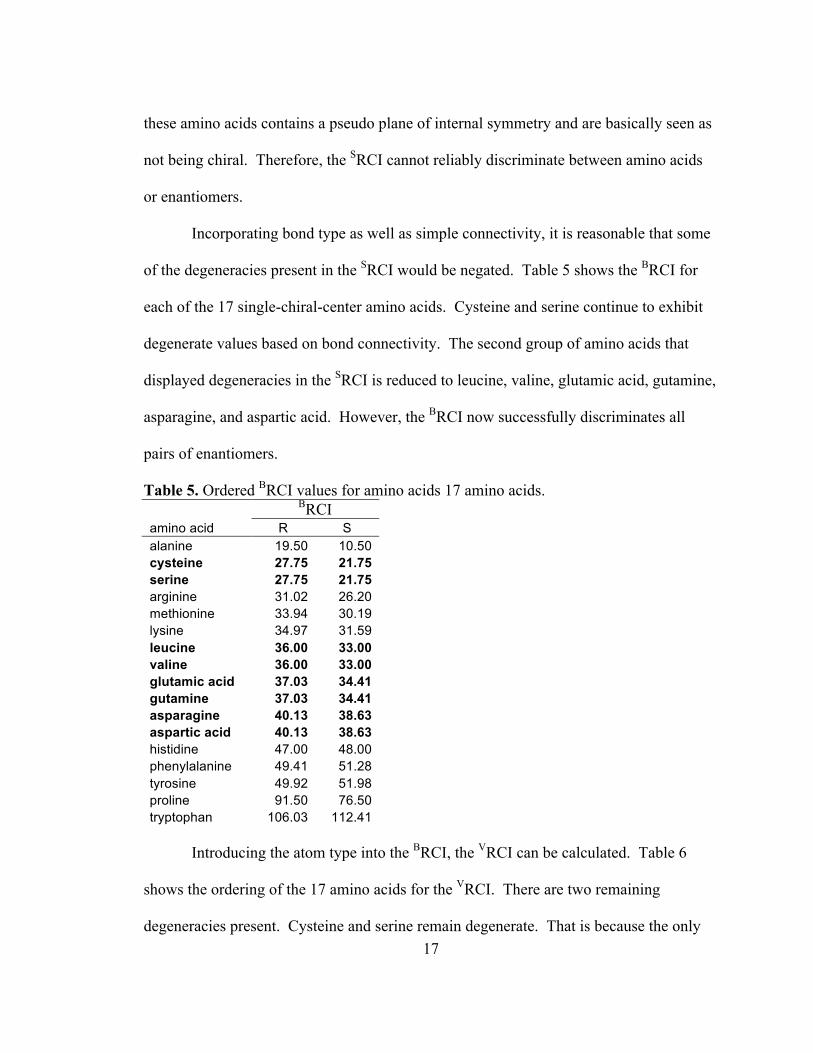
Incorporating bond type as well as simple connectivity, it is reasonable that some
of the degeneracies present in the SRCI would be negated. Table 5 shows the BRCI for
each of the 17 single-chiral-center amino acids. Cysteine and serine continue to exhibit
degenerate values based on bond connectivity. The second group of amino acids that
displayed degeneracies in the SRCI is reduced to leucine, valine, glutamic acid, gutamine,
asparagine, and aspartic acid. However, the BRCI now successfully discriminates all
pairs of enantiomers.
Table 5. Ordered BRCI values for amino acids 17 amino acids. BRCI amino acid R S alanine 19.50 10.50 cysteine 27.75 21.75 serine 27.75 21.75 arginine 31.02 26.20 methionine 33.94 30.19 lysine 34.97 31.59 leucine 36.00 33.00 valine 36.00 33.00 glutamic acid 37.03 34.41 gutamine 37.03 34.41 asparagine 40.13 38.63 aspartic acid 40.13 38.63 histidine 47.00 48.00 phenylalanine 49.41 51.28 tyrosine 49.92 51.98 proline 91.50 76.50 tryptophan 106.03 112.41
Introducing the atom type into the BRCI, the VRCI can be calculated. Table 6
shows the ordering of the 17 amino acids for the VRCI. There are two remaining
degeneracies present. Cysteine and serine remain degenerate. That is because the only

18
difference between the cysteine and serine are the thiol and hydroxyl groups,
respectively, and the δV formulation used in this study only encodes information
regarding valence shell electrons and disregards core electrons. The second degeneracy
is aspartic acid and histidine. This is a chance degeneracy since both aspartic acid and
histidine have drastically different structures and have not exhibited the same degeneracy
in either the SRCI or BRCI. Another interesting piece of data relates to proline. In Tables
4 and 5, both the R and S values for their respective RCI are listed in order. In Table 6,
the S value for proline does not fall in order with those around it. It should be pointed out
that since proline has a different structure than the other amino acids, namely the R group
binding back onto the amino acid group, that this could explain the amino acids’ order.
Table 6. Ordered VRCI values for amino acids 17 amino acids. VRCI amino acid R S alanine 94.50 43.50 valine 151.50 112.50 lysine 178.22 144.84 leucine 180.00 147.00 arginine 193.36 163.17 cysteine 194.25 164.25 serine 194.25 164.25 methionine 197.81 168.56 gutamine 212.06 185.81 glutamic acid 219.19 194.44 phenylalanine 235.22 213.84 asparagine 244.13 224.63 proline 252.50 187.50 tyrosine 255.70 238.64 aspartic acid 258.38 241.88 histidine 258.38 241.88 tryptophan 282.42 270.98
Using the intrinsic state the IRCI was calculated and the results are displayed in
Table 7. The problem encountered with proline in the VRCI no longer is present and all
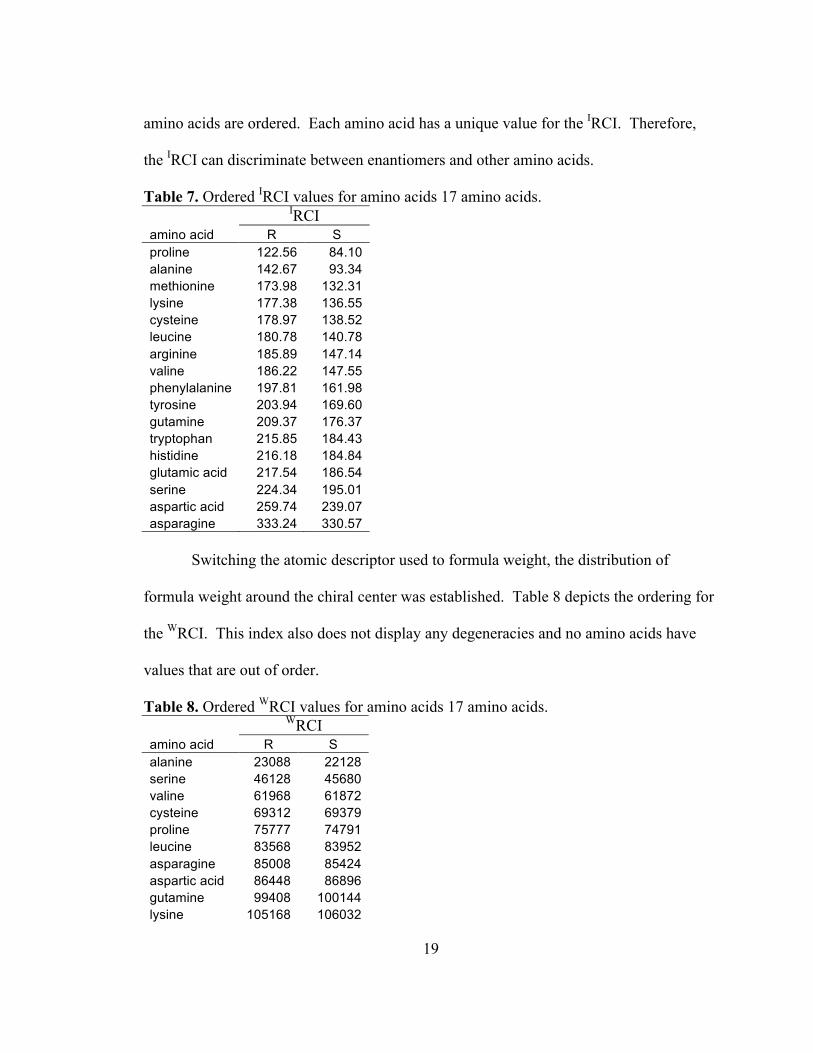
19
amino acids are ordered. Each amino acid has a unique value for the IRCI. Therefore,
the IRCI can discriminate between enantiomers and other amino acids.
Table 7. Ordered IRCI values for amino acids 17 amino acids. IRCI amino acid R S proline 122.56 84.10 alanine 142.67 93.34 methionine 173.98 132.31 lysine 177.38 136.55 cysteine 178.97 138.52 leucine 180.78 140.78 arginine 185.89 147.14 valine 186.22 147.55 phenylalanine 197.81 161.98 tyrosine 203.94 169.60 gutamine 209.37 176.37 tryptophan 215.85 184.43 histidine 216.18 184.84 glutamic acid 217.54 186.54 serine 224.34 195.01 aspartic acid 259.74 239.07 asparagine 333.24 330.57
Switching the atomic descriptor used to formula weight, the distribution of
formula weight around the chiral center was established. Table 8 depicts the ordering for
the WRCI. This index also does not display any degeneracies and no amino acids have
values that are out of order.
Table 8. Ordered WRCI values for amino acids 17 amino acids. WRCI amino acid R S alanine 23088 22128 serine 46128 45680 valine 61968 61872 cysteine 69312 69379 proline 75777 74791 leucine 83568 83952 asparagine 85008 85424 aspartic acid 86448 86896 gutamine 99408 100144 lysine 105168 106032

20
glutamic acid 106608 107504 methionine 109632 110595 histidine 118128 119280 phenylalanine 132528 134000 arginine 145488 147248 tyrosine 155568 157552 tryptophan 188688 191408
Combining the ordering of Tables 4, 5, 6, 7, and 8, some general trends can be
established and shown in Table 9. Alanine, due to the residue being a methyl group, has
the lowest values in four of the five indicies. Tryptophan with ten non-hydrogen atoms in
its residue has the largest values in three of the five indices shown.
Table 9. Amino acids ordered by each RCI. SRCI BRCI VRCI IRCI WRCI 1 alanine alanine alanine proline alanine 2 cysteine cysteine valine alanine serine 3 serine serine lysine methionine valine 4 methionine arginine leucine lysine cysteine 5 lysine methionine arginine cysteine proline 6 arginine lysine cysteine leucine leucine 7 asparagine leucine serine arginine asparagine 8 aspartic acid valine methionine valine aspartic acid 9 glutamic acid glutamic acid gutamine phenylalanine gutamine
10 gutamine gutamine glutamic acid tyrosine lysine 11 leucine asparagine phenylalanine gutamine glutamic acid 12 valine aspartic acid asparagine tryptophan methionine 13 phenylalanine histidine proline histidine histidine 14 tyrosine phenylalanine tyrosine glutamic acid phenylalanine 15 tryptophan tyrosine aspartic acid serine arginine 16 histidine proline histidine aspartic acid tyrosine 17 proline tryptophan tryptophan asparagine tryptophan
Overall, the RCI seems to discriminate enantiomers. The SRCI and BRCI have
deficiencies in discriminating which are taken care of in the VRCI by adding atom type
into the descriptor calculation.
21
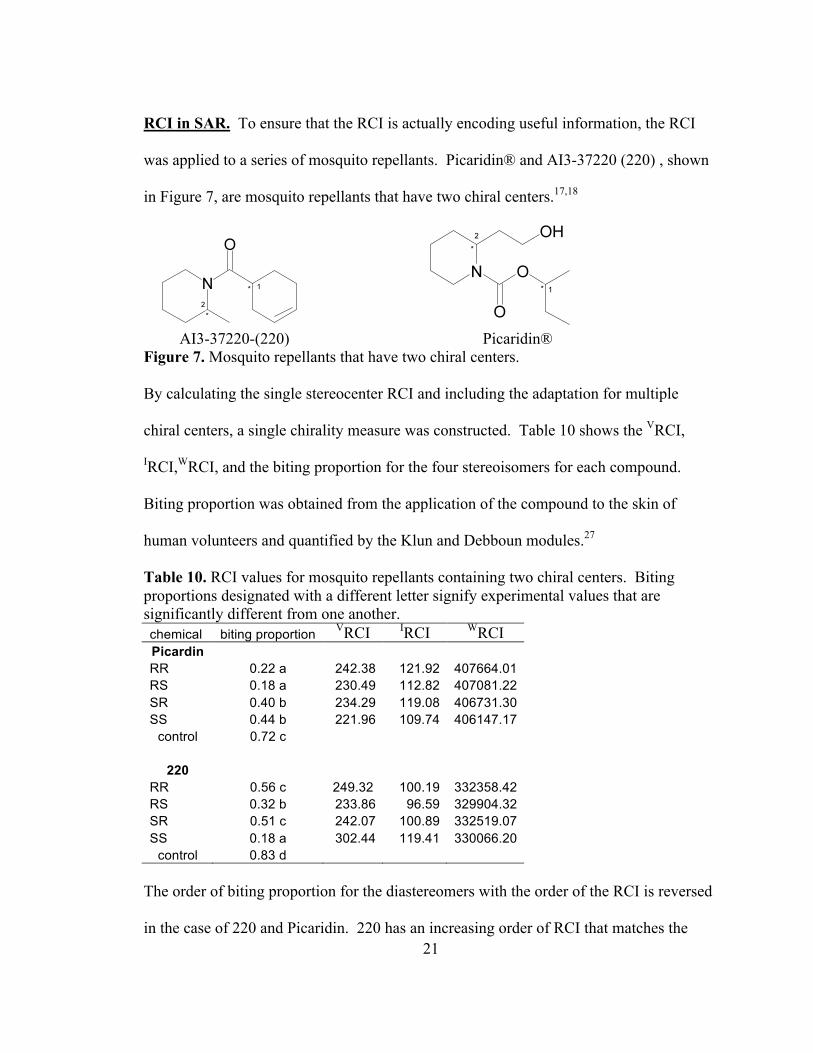
RCI in SAR. To ensure that the RCI is actually encoding useful information, the RCI
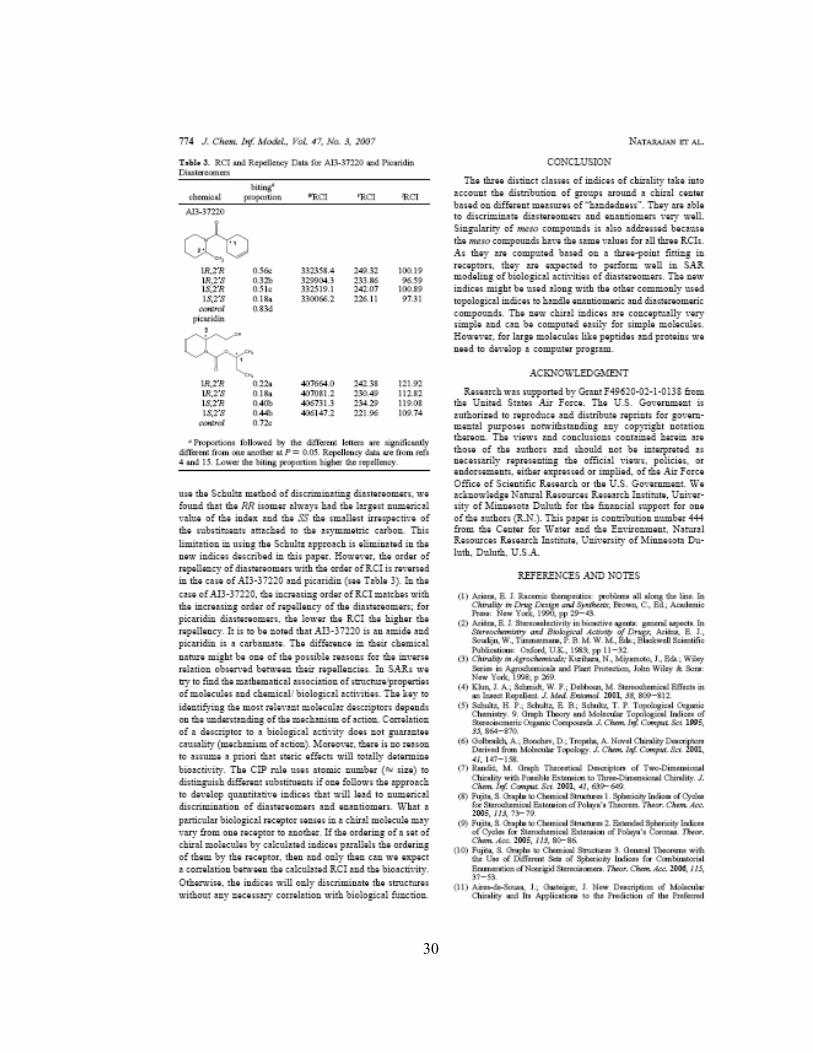
was applied to a series of mosquito repellants. Picaridin® and AI3-37220 (220) , shown
in Figure 7, are mosquito repellants that have two chiral centers.17,18
AI3-37220-(220) Picaridin® Figure 7. Mosquito repellants that have two chiral centers. By calculating the single stereocenter RCI and including the adaptation for multiple
chiral centers, a single chirality measure was constructed. Table 10 shows the VRCI,
IRCI,WRCI, and the biting proportion for the four stereoisomers for each compound.
Biting proportion was obtained from the application of the compound to the skin of
human volunteers and quantified by the Klun and Debboun modules.27
Table 10. RCI values for mosquito repellants containing two chiral centers. Biting proportions designated with a different letter signify experimental values that are significantly different from one another. chemical biting proportion VRCI IRCI WRCI Picardin RR 0.22 a 242.38 121.92 407664.01 RS 0.18 a 230.49 112.82 407081.22 SR 0.40 b 234.29 119.08 406731.30 SS 0.44 b 221.96 109.74 406147.17
control 0.72 c
220 RR 0.56 c 249.32 100.19 332358.42 RS 0.32 b 233.86 96.59 329904.32 SR 0.51 c 242.07 100.89 332519.07 SS 0.18 a 302.44 119.41 330066.20
control 0.83 d The order of biting proportion for the diastereomers with the order of the RCI is reversed
in the case of 220 and Picaridin. 220 has an increasing order of RCI that matches the
22
decreasing order of biting proportion for the diastereomers; for Picaridin diastereomers
the lower the RCI the lower the biting proportion.
23
Section 5. Conclusion
The RCI algorithm was developed to discriminate chiral carbon compounds based
on the Cahn-Ingold-Prelog rules for defining absolute configuration for these compounds.
To this end, this study proposed an attempt to encode information about the distribution
of the atoms surrounding a chiral center. The set of α-amino acids containing at least one
chiral center was used to test the various features of the RCI models. Using these
example calculations, the RCI established that it differentiates molecules from each other.
The RCI, also, seems to encode important information about molecules as seen by the
analysis of the order of the various RCI indices. By applying the RCI method to the
mosquito repellant experimental data, it was shown that this index could be useful in the
modeling of experimental data.
24
Section 6. References
1. Ariens, E. J.; Racemic therapeutics: problems all along the line. In Chirality in Drug Design and Synthesis, Brown, C., Ed.; Academic Press: New York, 1990; pp 29–43. 2. Ariëns, E. J.; Stereoselectivity in bioactive agents: general aspects. In Stereochemistry and Biological Activity of Drugs. Ariëns, E. J.; Soudijn, W.; Timmermans, P.B.M.W.M., Eds.; Balckwell Scientific Publications: Oxford, U.K., 1983; pp 11-32. 3. Kurihara, N.; Miyamoto, J., Eds. Chirality in Agrochemicals, Wiley Series in Agrochemicals and Plant Protection, John Wiley & Sons: New York, 1998; p 269. 4. Klun, J.A.; Schmidt, W.F.; Debboun, M. Stereochemical Effects in an Insect Repellent, J. Med. Entomol. 2001, 38, 809-812. 5. Trinajstic, N. Chemical Graph Theory, 2nd revised ed.; CRC Press: Boca Raton, FL 1992. ISBN: 0849342562. 6. Todeschini, R.; Consonni, V. Molecular Descriptors for Chemoninformatics. Vol. II; Wiley-VCH verlag GmbH & Co. KGaA: Weinheim, 2009; ISBN: 9783527318520. 7. Schultz, H.P.; Schultz, E.B.; Schultz, T.P. Topological Organic Chemistry. 9. Graph Theory and Molecular Topological Indices of Stereoisomeric Organic Compounds. J. Chem. Inf. Comput. Sci. 1995, 35, 864-870. 8. Golbraikh, A.; Bonchev, D.; Tropsha A. Novel Chirality Descriptors Derived from Molecular Topology. J. Chem. Inf. Comput. Sci. 2001, 41, 147-158. 9. Randic, M. Graph Theoretical Descriptors of Two-Dimensional Chirality with Possible Extension to Three-Dimensional Chirality. J. Chem. Inf. Comput. Sci. 2001, 41, 639-649. 10. Aires-de-Sousa, J.; Gasteiger, J. New Description of Molecular Chirality and Its Applications to the Prediction of the Preferred Enantiomer in Stereoselective Reactions. J. Chem. Inf. Comput. Sci. 2001, 41, 369-375. 11. Aires-de-Sousa, J.; Gasteiger, J.; Gutman, I.; Vidovi_, D. Chirality Code and Molecular Structure. J. Chem. Inf. Comput. Sci. 2004, 44, 831-836. 12. Capozziello, S.; Lattanzi, A. Algebraic Structure of Central Molecular Chirality Starting From Fischer Projections. Chirality. 2003, 15, 466-471. 13. Capozziello, S.; Lattanzi, A. Molecular Approach to Central Molecular Chirality: A Chirality Selection Rule. Chirality. 2003, 15, 227-230. 14. Capozziello, S.; Lattanzi, A. Description of chiral tetrahedral molecules via an Aufbau approach. Theochem. 2003, 671, 205-209. 15. Yang, C.; Zhong, C. Chirality Factors and Their Application to QSAR Studies of
25
Chiral Molecules, QSAR Comb. Sci. 2005, 24, 1047 – 1055. 16. Harris, A.B.; Kamien, R.D.; Lubensky, T.C. Molecular chirality and chiral parameters. Rev. Mod. Phys. 1999. 71, 1745-1757. 17. Basak, S.C., Natarajan, R., Nowak, W., Miszta, P, Klun, J.A, Three Dimensional Structure-activity Relationships (3D-QSAR) for Insect Repellency of Diastereoisomeric Compounds: A Hierarchical Molecular Overlay Approach. SAR QSAR Environ. Res. 2007 in press 18. Natarajan, R.; Basak, S.C; Balaban, A.T.; Klun, J.A.; Schmidt, W.F. Chirality Index, Molecular Overlay and Biological Activity of Diastereoisomeric Mosquito Repellents. Pest Manag. Sci. 2005, 61, 1193-1201. 19. Kier, L.B.; Hall, L. Molecular Connectivity Analysis, Research Studies Press: Letchworth, UK, 1986; pp 1-26. 20. Kier, L.B.; Hall, L.H Molecular Structure Description, Academic Press: New York, 1999; pp 13-36.

26
Appendix
27

28
29
30
31


![Induction of Planar Chirality Using Asymmetric Click ...€¦ · by a Novel Desymmetrisation of 1,3-Bisalkynyl Ferrocenes‡ AdamJ.Wright,[a] DavidL.Hughes,[a] PhillipC.BulmanPage,[a]](https://img.dokumen.tips/doc/110x75/5f102e947e708231d447d97a/induction-of-planar-chirality-using-asymmetric-click-by-a-novel-desymmetrisation.jpg)