Embed Size (px)
Citation preview
Annals of Rehabilitation Medicine
Original Article
Ann Rehabil Med 2021;45(2):123-130pISSN: 2234-0645 • eISSN: 2234-0653https://doi.org/10.5535/arm.20174
Relationships Between Relative Ankle Muscle Ratios, Severity of Symptoms, and Radiologic
Parameters in Adolescent Patients With Symptomatic Flexible Flat Feet
Youngju Shin, MD, So Young Ahn, MD, PhD, Soo-Kyung Bok, MD, PhD
Department of Rehabilitation Medicine, Chungnam National University Hospital, Chungnam National University College of Medicine, Daejeon, Korea
Objective To investigate differences in the relative sizes of the ankle-stabilizing muscles in individuals with versus without flexible flat feet and to determine predictors of symptom severity.Methods This cross-sectional study included 30 patients with symptomatic flexible flat feet and 24 normal controls. The following were evaluated: foot posture index, resting calcaneal stance position angle, radiographic findings (calcaneal pitch, Meary’s angle, talocalcaneal angle, talonavicular coverage angle [TNCA]), foot function index (FFI), and cross-sectional areas (CSA) of the tibialis anterior (TA), tibialis posterior (TP), and peroneus longus (PL) upon ultrasonographic examination. To address morphometric differences among participants, individual muscle measurements were normalized to proportions of total muscle CSA. Between-group differences were evaluated with independent t-tests. Correlations between muscle ratios, radiographic parameters, and FFI scores were investigated. Logistic regression analysis was performed to determine which parameters predicted severe symptoms.Results The relative size of the TP was significantly greater and those of the TA and PL were significantly smaller in patients with flat feet than in normal controls. Correlations were found among relative muscle CSA ratios, radiographic parameters, and FFI score. Linear regression analysis confirmed that the TNCA and the relative CSA of the PL were independent predictors of symptom severity.Conclusion This study found significant differences in the relative CSAs of the ankle muscles in patients with flexible flat feet versus individuals without flat feet; these differences were significantly correlated with anatomic abnormalities. Symptoms were more severe in patients with relatively greater forefoot abduction and relatively smaller PL.
Keywords Ankle, Comparative study, Flatfoot, Muscles, Ultrasonography
Received July 31, 2020; Revised September 14, 2020; Accepted October 14, 2020; Published online April 14, 2021Corresponding author: Soo-Kyung BokDepartment of Rehabilitation Medicine, Chungnam National University Hospital, 282 Munhwa-ro, Jung-gu, Daejeon 35015, Korea. Tel: +82-42-338-2460, Fax: +82-42-338-2461, E-mail: [email protected]: Youngju Shin (https://orcid.org/0000-0002-9574-8606); So Young Ahn (https://orcid.org/0000-0002-7447-0617); Soo-Kyung Bok (https://orcid.org/0000-0002-8957-2827).
This is an open-access article distributed under the terms of the Creative Commons Attribution Non-Commercial License (http://creativecommons.org/licenses/by-nc/4.0) which permits unrestricted noncommercial use, distribution, and reproduction in any medium, provided the original work is properly cited.
Copyright © 2021 by Korean Academy of Rehabilitation Medicine
Youngju Shin, et al.
124 www.e-arm.org
INTRODUCTION
The condition of flexible flat feet can develop in early childhood and usually improves, but may persist in adult-hood. The term “flexible” means that the foot is flat in weight-bearing, while the foot arch returns to normal when weight is removed [1]. Flat feet, pes planus, are known to cause pain and fatigue; however, some individu-als with flexible flat feet do not experience symptoms, and the condition may improve as they enter adulthood [2-4]. The causes of symptoms in individuals with flexible flat feet are not clearly understood and remain controversial; however, it is known that kinematics of the foot change during walking and depend on foot posture [5]. In addi-tion, using surface electromyography (EMG), ankle muscle activity has been shown to differ between normal individ-uals and those with pes planus because of adaptation to the changed kinematics; patients with flat feet have higher tibialis posterior (TP) activity and lower peroneus longus (PL) activity at midstance and propulsion and have higher tibialis anterior (TA) activity during the contact period [6,7]. This difference in muscle contraction causes a difference in muscle volume, and two studies [8,9] have used ultraso-nography to investigate differences in the ankle muscles of normal individuals versus those of patients with flat feet. In [8], the authors measured muscle and tendon thick-nesses and found that the TA tendon and PL muscle were thicker and the Achilles tendon was thinner in individuals with flat feet than those in normal individuals. Similarly, the authors in [9] reported that the cross-sectional areas (CSA) of the peroneal muscles were larger in individuals with flat feet than those in individuals without flat feet.
Ankle muscle imbalances caused by differences in foot posture may be the cause of pain and dysfunction in patients with flat feet. Imbalanced invertor and evertor forces cause ankle instability and ankle injury [10]. How-ever, to our knowledge there have been no studies on the relationship between ankle muscles and pain in patients with flat feet.
Therefore, the purpose of this study was to use ultra-sonography to confirm differences between the relative sizes of ankle-stabilizing muscles in normal individuals and those in individuals with flat feet and to investigate correlations between symptom severity and physiological parameters (the relative ratios of muscle CSA and radio-graphic parameters in patients with flexible flat foot).
MATERIALS AND METHODS
Study designThis cross-sectional study included a total of 54 partici-
pants between 10 and 20 years of age. Thirty participants, the patient group, were diagnosed with symptomatic flexible flat feet at the outpatient department of rehabili-tation medicine at Chungnam National University Hospi-tal. The diagnostic criteria were as follows: (1) clinically consistent with the definition of flexible flat foot; (2) foot posture index (FPI) >5; (3) resting calcaneal stance posi-tion angle (RCSPA) <-4° or >4°) the presence of foot pain (numeric rating scale ≥2) caused by flat feet.
The control group included 24 volunteers. The inclu-sion criteria were as follows: (1) absence of foot pain and dysfunction; (2) FPI ≥0 and ≤5; and (3) RCSPA ≥-4° and ≤4°. For both groups, individuals with neurological or orthopedic diseases that could cause gait disorder were excluded. Each participant provided informed consent prior to the study. This study was approved by the Insti-tutional Review Board of Chungnam National University Hospital (No. 2020-02-047).
Foot posture assessmentFPIParticipants were asked to stand still with an equal
weight load on both sides, and the following six items were evaluated: (1) presence of the talar head upon pal-pation, (2) curvature above and below lateral malleoli, (3) inversion/eversion of the calcaneus, (4) concavity or bulge in the region of the talonavicular joint, and (5) con-gruence of the medial longitudinal arch. The six individ-ual scores were then combined to give a composite score between -12 and +12. A total score of 0 to 5 indicated a normal foot; scores exceeding 5 indicated a flat foot.
RCSPAPatients stood relaxed with feet at the same angle made
during the contact phase of gait. The RCSPA, the angle between the calcaneal bisection and a vertical line, was determined between the line of the heel and the surface. If the measured RCSPA value was negative, it indicated the rear foot was valgus. A flatfoot was defined as an RC-SPA <-4°.
Relationships Between Ankle Muscles & Symptoms
125www.e-arm.org
Radiographic assessmentStanding anterior-posterior view and lateral X-rays
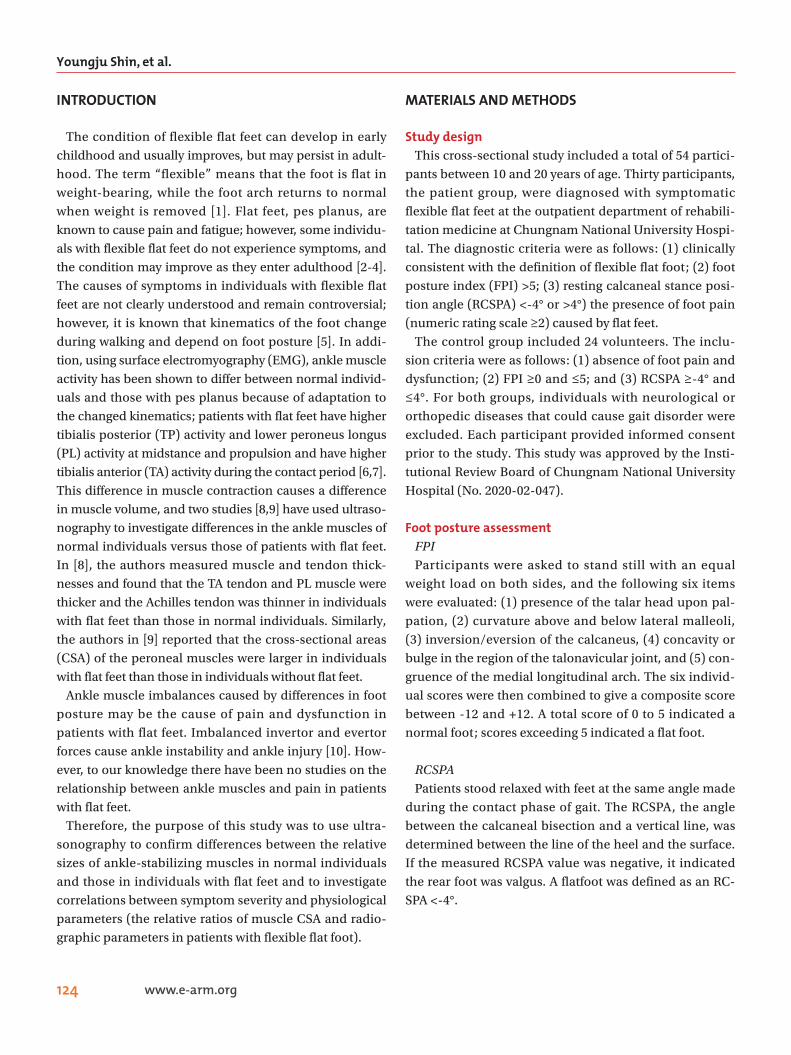
were taken to evaluate anatomical abnormalities in pa-tients with flat feet. The normal group did not undergo x-rays to avoid costs and potential radiation hazards. The following characteristics and the degree of flat foot were measured on plain films [11,12] (Fig. 1).
Calcaneal pitchThis was the angle between the calcaneus and the infe-
rior aspect of the foot on the lateral projection X-ray.
Meary’s angleThis was measured as the angle between the line origi-
nating from the center of the body of the talus, bisecting the talar neck and head, and the line through the longitu-dinal axis of first metatarsal. Positive angles indicated the apex of the angle was directed dorsally, while negative values indicated that the apex was directed plantarly.
Talocalcaneal angle (TCA)This was the angle between lines drawn along the axes
of the talus and calcaneus on the anterior-posterior pro-jection.
Talonavicular coverage angle (TNCA)This was the angle between the articular surface of the
talus and the articular surface of the navicular bone on the anterior-posterior projection.
All measurements were performed three times and the median value was used for analysis. An electronic pro-tractor was used to measure angles.
Sonographic assessmentThe CSAs of the ankle invertor and evertors were mea-
sured with ultrasound. Three trained physiatrists with >4 years of experience performed examinations with an ACUSON S2000 ultrasound unit (Siemens, Mountain View, CA, USA) linear probe with a 9–14 MHz bandwidth. The CSA of each muscle was measured at the muscle
A B
(a)
(b)
(c)
(d)
Fig. 1. (A, B) Radiographic pa-rameters: (a) Meary’s angle, (b) calcaneal pitch, (c) talonavicular coverage angle, and (d) talocalca-neal angle.
A B
C
E F
D
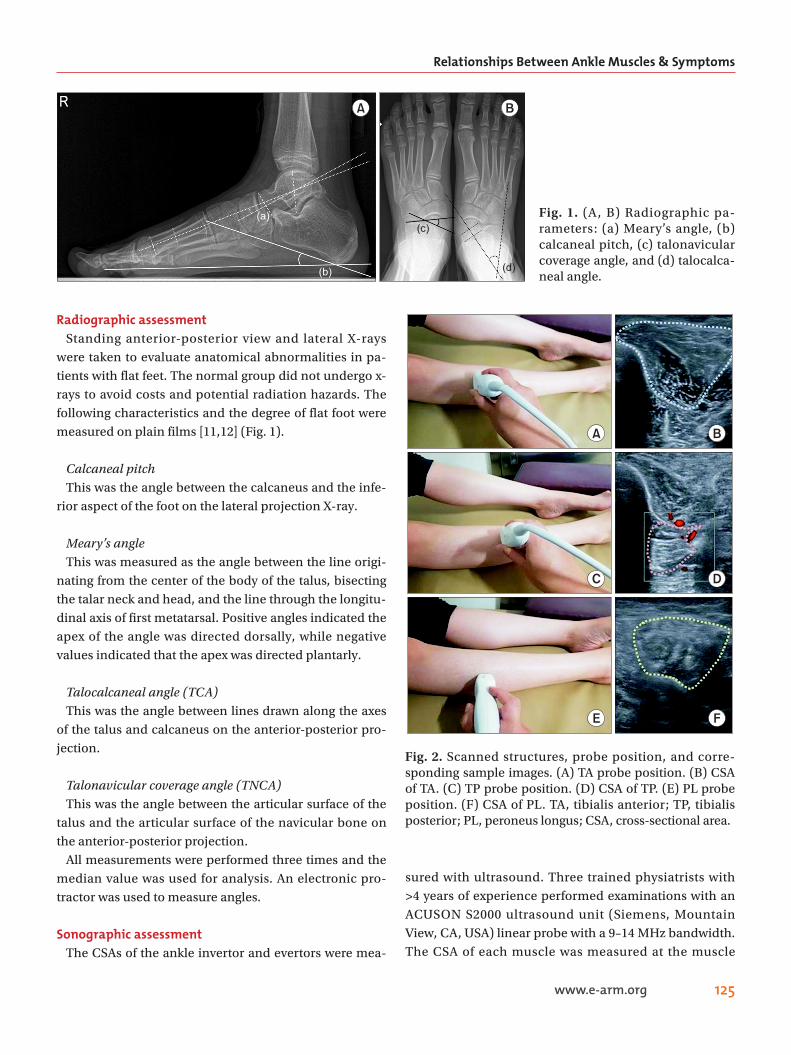
Fig. 2. Scanned structures, probe position, and corre-sponding sample images. (A) TA probe position. (B) CSA of TA. (C) TP probe position. (D) CSA of TP. (E) PL probe position. (F) CSA of PL. TA, tibialis anterior; TP, tibialis posterior; PL, peroneus longus; CSA, cross-sectional area.
Youngju Shin, et al.
126 www.e-arm.org
midpoint. The locations were based on those of a previ-ous study and were as follows [8]: TA, one-third of the distance from the tibial tuberosity to the medial malleo-lus; TP, midway between the medial malleolus and the tibial tuberosity; and PL, one-third of the distance from the tibial tuberosity to the lateral malleolus (Fig. 2).
To prevent muscle deformation resulting from pres-sure, a large amount of gel was applied to the probe and muscles were measured with as little force as possible. The area was determined by using a measuring tool set on the ultrasonic device, and the median value of three repeated measurements was taken for each muscle.
Pain and functional assessmentFFIThe foot function index (FFI) was used to evaluate foot
pain and disability in the patient group. This self-admin-istered index is designed to evaluate loss of function re-sulting from foot disease and includes a total of 23 items in the three sub-scales of pain, disability, and activity limitation. Each item is rated on a 10-point scale and is recorded as a percentage of the total score; a higher score indicates more severe functional limitation [13]. A Ko-rean version of the FFI, used in a previous study [14], was also used in this study.
Statistical analysisTo confirm the relationships among TA, TP, and PL
muscles and to exclude variables such as height, weight, age, and sex, the CSA of each muscle was evaluated as a proportion of the total muscle CSA.
The TA ratio was defined as the CSA of the TA as a pro-portion of total muscle CSA, the TP ratio was defined as the CSA of the TP as a proportion of the total muscle CSA, and the PL ratio was defined as the CSA of the PL as a proportion of the total muscle CSA.
Data collected for each foot were considered separately, so data were obtained for 60 feet in the patient group and for 48 feet in the control group. The independent t-test was used to analyze differences in the CSA ratios of the ankle muscles between the control and patient groups.
To confirm the effect of foot anatomical structure on ankle muscle composition in the patient group, corre-lations between radiographic parameters and the CSA ratios were analyzed. To confirm the effect of differences in foot structure and ankle muscle ratios on symptoms,
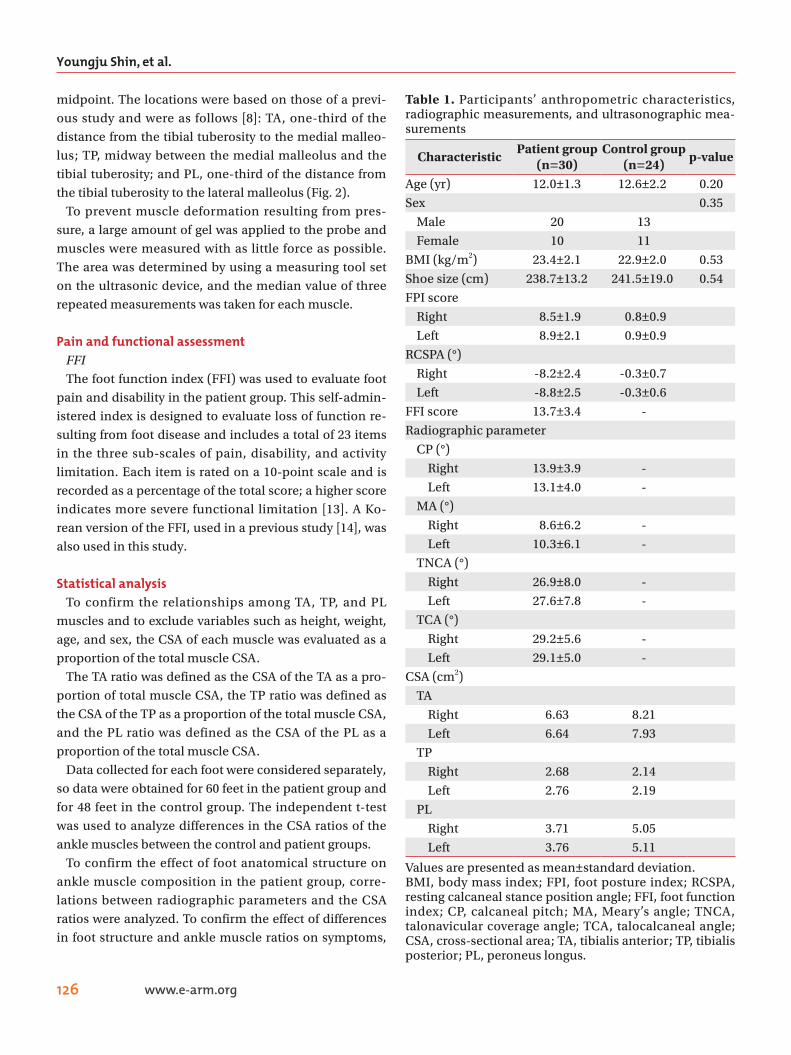
Table 1. Participants’ anthropometric characteristics, radiographic measurements, and ultrasonographic mea-surements
CharacteristicPatient group
(n=30)Control group
(n=24)p-value
Age (yr) 12.0±1.3 12.6±2.2 0.20
Sex 0.35
Male 20 13
Female 10 11
BMI (kg/m2) 23.4±2.1 22.9±2.0 0.53
Shoe size (cm) 238.7±13.2 241.5±19.0 0.54
FPI score
Right 8.5±1.9 0.8±0.9
Left 8.9±2.1 0.9±0.9
RCSPA (°)
Right -8.2±2.4 -0.3±0.7
Left -8.8±2.5 -0.3±0.6
FFI score 13.7±3.4 -
Radiographic parameter
CP (°)
Right 13.9±3.9 -
Left 13.1±4.0 -
MA (°)
Right 8.6±6.2 -
Left 10.3±6.1 -
TNCA (°)
Right 26.9±8.0 -
Left 27.6±7.8 -
TCA (°)
Right 29.2±5.6 -
Left 29.1±5.0 -
CSA (cm2)
TA
Right 6.63 8.21
Left 6.64 7.93
TP
Right 2.68 2.14
Left 2.76 2.19
PL
Right 3.71 5.05
Left 3.76 5.11
Values are presented as mean±standard deviation.BMI, body mass index; FPI, foot posture index; RCSPA, resting calcaneal stance position angle; FFI, foot function index; CP, calcaneal pitch; MA, Meary’s angle; TNCA, talonavicular coverage angle; TCA, talocalcaneal angle; CSA, cross-sectional area; TA, tibialis anterior; TP, tibialis posterior; PL, peroneus longus.
Relationships Between Ankle Muscles & Symptoms
127www.e-arm.org
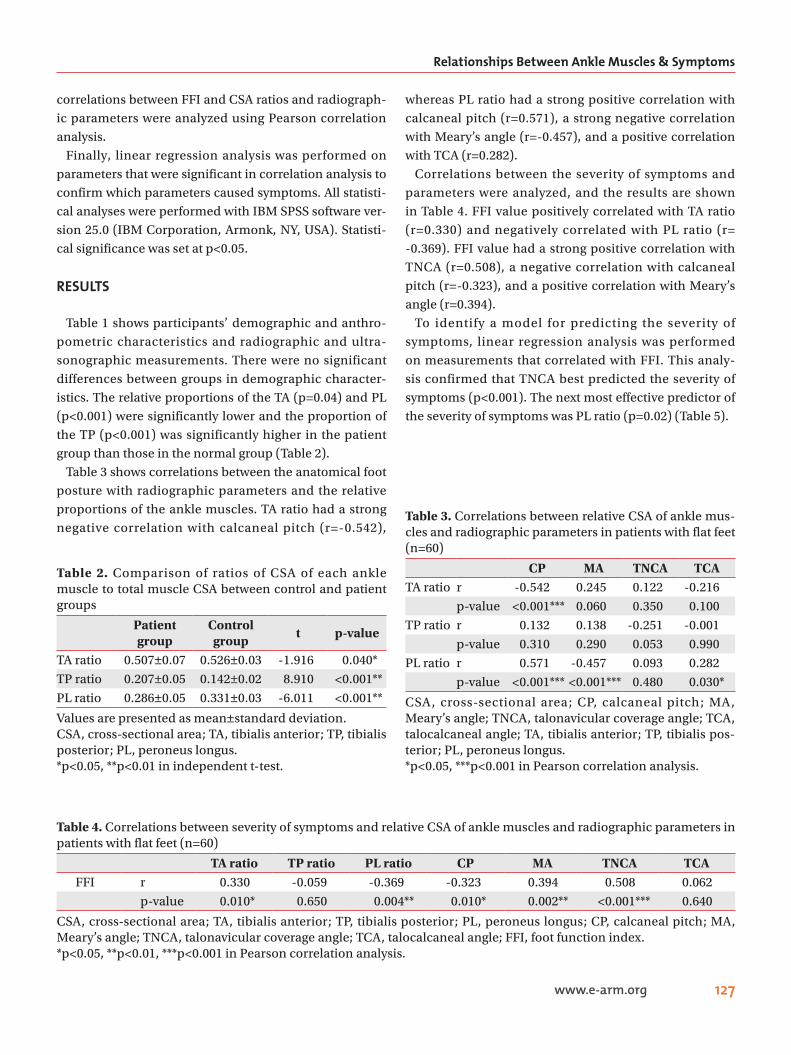
correlations between FFI and CSA ratios and radiograph-ic parameters were analyzed using Pearson correlation analysis.
Finally, linear regression analysis was performed on parameters that were significant in correlation analysis to confirm which parameters caused symptoms. All statisti-cal analyses were performed with IBM SPSS software ver-sion 25.0 (IBM Corporation, Armonk, NY, USA). Statisti-cal significance was set at p<0.05.
RESULTS
Table 1 shows participants’ demographic and anthro-pometric characteristics and radiographic and ultra-sonographic measurements. There were no significant differences between groups in demographic character-istics. The relative proportions of the TA (p=0.04) and PL (p<0.001) were significantly lower and the proportion of the TP (p<0.001) was significantly higher in the patient group than those in the normal group (Table 2).
Table 3 shows correlations between the anatomical foot posture with radiographic parameters and the relative proportions of the ankle muscles. TA ratio had a strong negative correlation with calcaneal pitch (r=-0.542),
whereas PL ratio had a strong positive correlation with calcaneal pitch (r=0.571), a strong negative correlation with Meary’s angle (r=-0.457), and a positive correlation with TCA (r=0.282).
Correlations between the severity of symptoms and parameters were analyzed, and the results are shown in Table 4. FFI value positively correlated with TA ratio (r=0.330) and negatively correlated with PL ratio (r= -0.369). FFI value had a strong positive correlation with TNCA (r=0.508), a negative correlation with calcaneal pitch (r=-0.323), and a positive correlation with Meary’s angle (r=0.394).
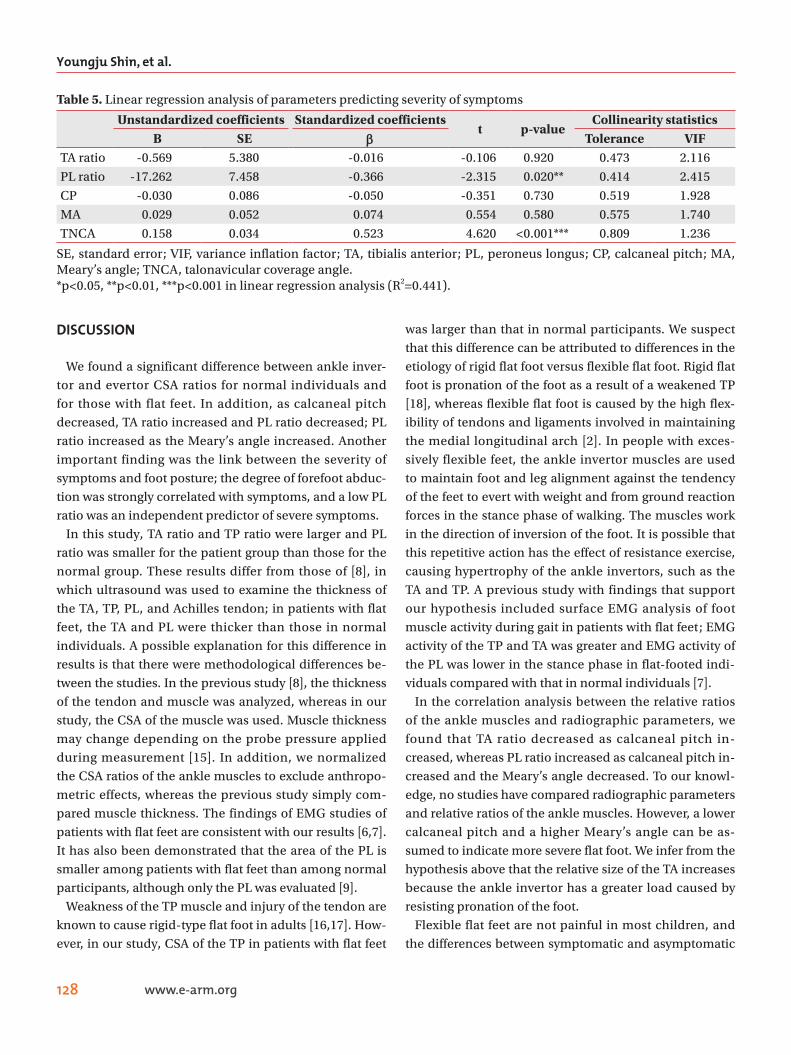
To identify a model for predicting the severity of symptoms, linear regression analysis was performed on measurements that correlated with FFI. This analy-sis confirmed that TNCA best predicted the severity of symptoms (p<0.001). The next most effective predictor of the severity of symptoms was PL ratio (p=0.02) (Table 5).
Table 4. Correlations between severity of symptoms and relative CSA of ankle muscles and radiographic parameters in patients with flat feet (n=60)
TA ratio TP ratio PL ratio CP MA TNCA TCAFFI r 0.330 -0.059 -0.369 -0.323 0.394 0.508 0.062
p-value 0.010* 0.650 0.004** 0.010* 0.002** <0.001*** 0.640
CSA, cross-sectional area; TA, tibialis anterior; TP, tibialis posterior; PL, peroneus longus; CP, calcaneal pitch; MA, Meary’s angle; TNCA, talonavicular coverage angle; TCA, talocalcaneal angle; FFI, foot function index.*p<0.05, **p<0.01, ***p<0.001 in Pearson correlation analysis.
Table 2. Comparison of ratios of CSA of each ankle muscle to total muscle CSA between control and patient groups
Patient group
Control group
t p-value
TA ratio 0.507±0.07 0.526±0.03 -1.916 0.040*
TP ratio 0.207±0.05 0.142±0.02 8.910 <0.001**
PL ratio 0.286±0.05 0.331±0.03 -6.011 <0.001**
Values are presented as mean±standard deviation.CSA, cross-sectional area; TA, tibialis anterior; TP, tibialis posterior; PL, peroneus longus.*p<0.05, **p<0.01 in independent t-test.
Table 3. Correlations between relative CSA of ankle mus-cles and radiographic parameters in patients with flat feet (n=60)
CP MA TNCA TCATA ratio r -0.542 0.245 0.122 -0.216
p-value <0.001*** 0.060 0.350 0.100
TP ratio r 0.132 0.138 -0.251 -0.001
p-value 0.310 0.290 0.053 0.990
PL ratio r 0.571 -0.457 0.093 0.282
p-value <0.001*** <0.001*** 0.480 0.030*
CSA, cross-sectional area; CP, calcaneal pitch; MA, Meary’s angle; TNCA, talonavicular coverage angle; TCA, talocalcaneal angle; TA, tibialis anterior; TP, tibialis pos-terior; PL, peroneus longus.*p<0.05, ***p<0.001 in Pearson correlation analysis.
Youngju Shin, et al.
128 www.e-arm.org
DISCUSSION
We found a significant difference between ankle inver-tor and evertor CSA ratios for normal individuals and for those with flat feet. In addition, as calcaneal pitch decreased, TA ratio increased and PL ratio decreased; PL ratio increased as the Meary’s angle increased. Another important finding was the link between the severity of symptoms and foot posture; the degree of forefoot abduc-tion was strongly correlated with symptoms, and a low PL ratio was an independent predictor of severe symptoms.
In this study, TA ratio and TP ratio were larger and PL ratio was smaller for the patient group than those for the normal group. These results differ from those of [8], in which ultrasound was used to examine the thickness of the TA, TP, PL, and Achilles tendon; in patients with flat feet, the TA and PL were thicker than those in normal individuals. A possible explanation for this difference in results is that there were methodological differences be-tween the studies. In the previous study [8], the thickness of the tendon and muscle was analyzed, whereas in our study, the CSA of the muscle was used. Muscle thickness may change depending on the probe pressure applied during measurement [15]. In addition, we normalized the CSA ratios of the ankle muscles to exclude anthropo-metric effects, whereas the previous study simply com-pared muscle thickness. The findings of EMG studies of patients with flat feet are consistent with our results [6,7]. It has also been demonstrated that the area of the PL is smaller among patients with flat feet than among normal participants, although only the PL was evaluated [9].
Weakness of the TP muscle and injury of the tendon are known to cause rigid-type flat foot in adults [16,17]. How-ever, in our study, CSA of the TP in patients with flat feet
was larger than that in normal participants. We suspect that this difference can be attributed to differences in the etiology of rigid flat foot versus flexible flat foot. Rigid flat foot is pronation of the foot as a result of a weakened TP [18], whereas flexible flat foot is caused by the high flex-ibility of tendons and ligaments involved in maintaining the medial longitudinal arch [2]. In people with exces-sively flexible feet, the ankle invertor muscles are used to maintain foot and leg alignment against the tendency of the feet to evert with weight and from ground reaction forces in the stance phase of walking. The muscles work in the direction of inversion of the foot. It is possible that this repetitive action has the effect of resistance exercise, causing hypertrophy of the ankle invertors, such as the TA and TP. A previous study with findings that support our hypothesis included surface EMG analysis of foot muscle activity during gait in patients with flat feet; EMG activity of the TP and TA was greater and EMG activity of the PL was lower in the stance phase in flat-footed indi-viduals compared with that in normal individuals [7].
In the correlation analysis between the relative ratios of the ankle muscles and radiographic parameters, we found that TA ratio decreased as calcaneal pitch in-creased, whereas PL ratio increased as calcaneal pitch in-creased and the Meary’s angle decreased. To our knowl-edge, no studies have compared radiographic parameters and relative ratios of the ankle muscles. However, a lower calcaneal pitch and a higher Meary’s angle can be as-sumed to indicate more severe flat foot. We infer from the hypothesis above that the relative size of the TA increases because the ankle invertor has a greater load caused by resisting pronation of the foot.
Flexible flat feet are not painful in most children, and the differences between symptomatic and asymptomatic
Table 5. Linear regression analysis of parameters predicting severity of symptoms
Unstandardized coefficients Standardized coefficientst p-value
Collinearity statisticsB SE ββ Tolerance VIF
TA ratio -0.569 5.380 -0.016 -0.106 0.920 0.473 2.116
PL ratio -17.262 7.458 -0.366 -2.315 0.020** 0.414 2.415
CP -0.030 0.086 -0.050 -0.351 0.730 0.519 1.928
MA 0.029 0.052 0.074 0.554 0.580 0.575 1.740
TNCA 0.158 0.034 0.523 4.620 <0.001*** 0.809 1.236
SE, standard error; VIF, variance inflation factor; TA, tibialis anterior; PL, peroneus longus; CP, calcaneal pitch; MA, Meary’s angle; TNCA, talonavicular coverage angle.*p<0.05, **p<0.01, ***p<0.001 in linear regression analysis (R2=0.441).
Relationships Between Ankle Muscles & Symptoms
129www.e-arm.org
patients remain unclear [19]. In the correlation analysis of the severity of symptoms, radiographic parameters, and relative ratios of ankle muscles, we found signifi-cant correlations between the severity of symptoms and TNCA, calcaneal pitch, Meary’s angle, TA ratio, and PL ratio. In particular, a strong correlation with TNCA, which indicates forefoot abduction, was confirmed. Linear re-gression analysis was performed with five measurements; our results showed that TNCA and PL ratio were the most effective in predicting the severity of symptoms. This result is consistent with the findings of a study in which kinematic data during walking for patients with flat feet were grouped according to the presence of symptoms; patients in the symptomatic group had more severe fore-foot abduction in the stance phase than patients without symptoms [20]. In general, nonsurgical treatment for symptomatic flexible flat feet involves foot orthotics [21] and exercise therapy, such as short-foot exercises [22]. The results of the present study suggest that orthotics to limit forefoot abduction or exercise therapy to strengthen the PL may improve symptoms in patients with flexible flat feet.
There are some limitations to our study. First, the num-ber of participants in the control group was relatively small, and the mean age was higher than that of the pa-tient group. It is possible that differences in the relative ratios of the ankle muscles between the groups resulted from age and foot growth.
Second, there may be an error in confirming the CSA of the TP by ultrasound. We used an anteroposterior approach to confirm the CSA of the TP by ultrasound, because when approaching from the posterior, the dis-tance between the probe and the target muscle is farther because of the thick gastrocnemius in between, and reso-lution is degraded. However, in the case of the anterior approach, there was a limitation in that part of the TP was covered by the tibia, so it was difficult to measure the exact area.
Third, since it is difficult to determine when the condi-tion developed, onset data could not be collected. Be-cause of its nature, there would be ambiguity concerning whether reported onset was when the patient first com-plained of symptoms or when the foot abnormality was discovered.
Fourth, most of the patients who participated in this study had symptoms of pain and slight restriction only
when walking long distances. Therefore, it is possible that the FFI was not sufficiently sensitive in evaluating the degree of pain and functional impairment caused by flex-ible flat feet in this group.
Fifth, this study used ultrasound, radiographs, and pa-tient’s medical records. The use of kinematic tools such as gait analysis would allow better comparison of the bio-mechanics of people with and without flexible flat feet. Because of ultrasound probe, data could not be collected for the medial gastrocnemius or soleus muscle; these muscles may contribute significantly to ankle stabiliza-tion.
Future studies using magnetic resonance imaging or computed tomography with 3D reconstruction will allow all leg muscles to be evaluated in patients with flat feet and will provide insight into the dynamic relationships between muscles.
In conclusion, patients with flexible flat feet had a high-er proportion of ankle invertors and a lower proportion of ankle evertors than those in individuals without flat feet. These differences significantly correlated with se-verity (flat foot parameters and symptoms). The finding of differences in the development of ankle muscles with differences in foot posture has diagnostic value in the treatment and evaluation of patients with symptomatic flexible flatfeet. In future studies, it will be interesting to compare the relative ankle muscle ratios before and after treatment in patients who were prescribed exercise or foot orthotics.
CONFLICT OF INTEREST
No potential conflict of interest relevant to this article was reported.
AUTHOR CONTRIBUTION
Conceptualization: Shin YJ, Bok SK. Methodology: Shin YJ, Bok SK. Formal analysis: Ahn SY. Funding acquisition: Bok SK. Project administration: Bok SK. Visualization: Ahn SY. Writing—original draft: Shin YJ. Writing—review and editing: Bok SK. Approval of final manuscript: all au-thors.
Youngju Shin, et al.
130 www.e-arm.org
REFERENCES
1. Harris EJ, Vanore JV, Thomas JL, Kravitz SR, Mendel-son SA, Mendicino RW, et al. Diagnosis and treatment of pediatric flatfoot. J Foot Ankle Surg 2004;43:341-73.
2. Garcia-Rodriguez A, Martin-Jimenez F, Carnero-Varo M, Gomez-Gracia E, Gomez-Aracena J, Fernandez-Crehuet J. Flexible flat feet in children: a real problem? Pediatrics 1999;103:e84.
3. Evans AM, Rome K. A Cochrane review of the evi-dence for non-surgical interventions for flexible pedi-atric flat feet. Eur J Phys Rehabil Med 2011;47:69-89.
4. Banwell HA, Paris ME, Mackintosh S, Williams CM. Paediatric flexible flat foot: how are we measuring it and are we getting it right?: a systematic review. J Foot Ankle Res 2018;11:21.
5. Buldt AK, Levinger P, Murley GS, Menz HB, Nester CJ, Landorf KB. Foot posture is associated with kinemat-ics of the foot during gait: a comparison of normal, planus and cavus feet. Gait Posture 2015;42:42-8.
6. Hunt AE, Smith RM. Mechanics and control of the flat versus normal foot during the stance phase of walk-ing. Clin Biomech (Bristol, Avon) 2004;19:391-7.
7. Murley GS, Menz HB, Landorf KB. Foot posture influ-ences the electromyographic activity of selected lower limb muscles during gait. J Foot Ankle Res 2009;2:35.
8. Murley GS, Tan JM, Edwards RM, De Luca J, Munte-anu SE, Cook JL. Foot posture is associated with morphometry of the peroneus longus muscle, tibialis anterior tendon, and Achilles tendon. Scand J Med Sci Sports 2014;24:535-41.
9. Angin S, Crofts G, Mickle KJ, Nester CJ. Ultrasound evaluation of foot muscles and plantar fascia in pes planus. Gait Posture 2014;40:48-52.
10. Pontaga I. Ankle joint evertor-invertor muscle torque ratio decrease due to recurrent lateral ligament sprains. Clin Biomech (Bristol, Avon) 2004;19:760-2.
11. Schon LC, Weinfeld SB, Horton GA, Resch S. Radio-graphic and clinical classification of acquired midtar-sus deformities. Foot Ankle Int 1998;19:394-404.
12. Youn KJ, Ahn SY, Kim BO, Park IS, Bok SK. Long-term effect of rigid foot orthosis in children older
than six years with flexible flat foot. Ann Rehabil Med 2019;43:224-9.
13. Budiman-Mak E, Conrad KJ, Roach KE. The Foot Function Index: a measure of foot pain and disability. J Clin Epidemiol 1991;44:561-70.
14. Lee DY, Kim YM, Lee JH, Kim J, Kim JB, Kim BS, et al. Validation of electronic foot function index in pa-tients with foot and ankle disease: a randomized, pro-spective multicenter study. J Korean Foot Ankle Soc 2019;23:24-30.
15. Ishida H, Watanabe S. Influence of inward pressure of the transducer on lateral abdominal muscle thickness during ultrasound imaging. J Orthop Sports Phys Ther 2012;42:815-8.
16. Hintermann B. Tibialis posterior dysfunction: a re-view of the problem and personal experience. Foot Ankle Surg 1997;3:61-70.
17. Ross MH, Smith MD, Mellor R, Vicenzino B. Exercise for posterior tibial tendon dysfunction: a systematic review of randomised clinical trials and clinical guide-lines. BMJ Open Sport Exerc Med 2018;4:e000430.
18. Pomeroy GC, Pike RH, Beals TC, Manoli A 2nd. Acquired flatfoot in adults due to dysfunction of the posterior tibial tendon. J Bone Joint Surg Am 1999;81:1173-82.
19. Kerr CM, Stebbins J, Theologis T, Zavatsky AB. Static postural differences between neutral and flat feet in children with and without symptoms. Clin Biomech (Bristol, Avon) 2015;30:314-7.
20. Kerr CM, Zavatsky AB, Theologis T, Stebbins J. Kine-matic differences between neutral and flat feet with and without symptoms as measured by the Oxford foot model. Gait Posture 2019;67:213-8.
21. Dars S, Uden H, Banwell HA, Kumar S. The effective-ness of non-surgical intervention (Foot Orthoses) for paediatric flexible pes planus: a systematic review: update. PLoS One 2018;13:e0193060.
22. Unver B, Erdem EU, Akbas E. Effects of short-foot ex-ercises on foot posture, pain, disability, and plantar pressure in pes planus. J Sport Rehabil 2019;29:436-40.