Embed Size (px)
Citation preview

1
Relationships between A level Grades and SAT Scores in a
Sample of UK Students
Catherine Kirkup
Jo Morrison
Chris Whetton
National Foundation for Educational Research
Please address all correspondence to:
Catherine Kirkup
National Foundation for Educational Research
Department of Assessment and Measurement
The Mere
Upton Park
Slough
Berkshire
SL1 2DQ
UK
Tel: +44 (0) 1753 574123
Fax: +44 (0) 1753 691632
Paper presented at the
Annual Meeting of the American Educational Research Association
New York City, March 24-28, 2008

2
Relationships between A level Grades and SAT Scores in a
Sample of UK Students
Catherine Kirkup
Jo Morrison
Chris Whetton
National Foundation for Educational Research
In the first phase of a study, examining the validity of the SAT for use in admissions to higher
education in the UK, relationships between SAT scores and UK national examination results
(“A levels”) were analysed. The correlation between SAT scores and A level scores was high
but the relationships between different components of the SAT and individual A level subjects
differed. Male students achieved higher SAT scores than female students, having taken into
account the subjects studied at A level and the grades achieved. Evidence suggests that
gender differences may be connected to the multiple-choice format of the questions and
higher omission rates by female students.
In September 2005 the National Foundation for Educational Research (NFER) in
association with the Department for Innovation, Universities and Skills (previously the
Department for Education and Skills), the Sutton Trust and the College Board, began a five-
year research study to examine the validity of an aptitude test in higher education admissions.
This paper reports on one of the early phases of the project in which the relationships
between SAT scores and attainment in national examinations were examined. Later phases of
the project will obtain degree outcomes and relate these to the earlier attainment and aptitude
measures. A fuller account of the first stages of this project is given in Kirkup et al. (2007).
1 Key findings
The mean SAT scores of the English sample were very similar to US mean scores and
individual items functioned in a similar way in comparable samples of students.
Female students had higher total GCSEi and A level
ii points scores and achieved
significantly higher scores on the SAT Writing component than male students. Male
students performed significantly better on the SAT Mathematics component and on
the SAT as a whole.
The correlation between A level scores and the SAT was 0.64 (i.e. high A level scores
were generally associated with high scores on the SAT). This correlation was higher
than correlations of between 0.33 and 0.50 in a previous pilot study (McDonald et al.,
2001a), most likely due to restructuring of both measures in the intervening years.
The levels of correlation between SAT scores and A level grades varied between A
level subjects. Science subjects and Mathematics tended to have a closer association
with SAT Mathematics , but subjects such as History and English Literature were
more closely related to SAT Writing and Critical Reading. This may mean that the
SAT has differential utility as an predictor of higher education outcomes according to
the degree subject involved and the A levels taken.

3
There were gender differences in the relationships between SAT scores and A level
grades in favour of male students. Such differences appear to be connected to the
multiple-choice format of the questions and higher omission rates by female students.
Gender differences may add to the complexity of interpreting and using SAT scores
for degree course selection. However, such relationships can only become clearer
when the degree outcomes have been collected and analysed.
2 Background to the Research
Higher education brings considerable benefits to graduates in terms of salary, job
security, employment opportunity, and so on. The government is committed to achieving
social inclusion within higher education. However, although the number of students entering
higher education in the UK has grown enormously in recent years, some groups are still
under-represented. In a report into the participation in higher education over the period 1994-
2000 (HEFCE, 2005) it was noted that young people living in the most advantaged 20 per
cent of areas were between five and six times more likely to go into higher education than
those from the least advantaged 20 per cent of areas. The benefits of higher education vary
according to the course studied and the institution attended. The demand for university places
generally exceeds the supply available, particularly for popular courses or popular
institutions. Where there are competing applicants, universities and other higher education
institutions have to assess the merit and potential of each student in order to decide who to
admit.
In its report, the Admissions to Higher Education Steering Group (DfES, 2004),
identified several issues to be addressed to bring about improvements to the admissions
system in England and to ensure a fair and transparent system for all students. As the system
stands at present, most of the offers of university places to prospective students are made on
the basis of predicted A level grades rather than the actual grades achieved. Although the
process is moving towards a post-qualification application system, admissions staff will still
need to select students from a increasingly large number of highly-qualified candidates, all of
whom have achieved three or more A grades in their A level examinations. This has led some
universities to introduce additional admissions tests to select candidates for courses were
there is heavy competition for places.
A further issue identified by the Schwartz report was that the information used to
assess university applicants may not be equally robust. Although ‘prior educational
attainment remains the best single indicator of success at undergraduate level’ it is recognised
that for some students, their true potential may not be reflected in their examination results
due to social or educational disadvantages. A recommendation of the group was that
assessment methods used within the admissions system should be shown to be reliable and
valid.
‘Admissions policies and procedures should be informed and guided by current
research and good practice. Where possible, universities and colleges using
quantifiable measures should use tests and approaches that have already been shown
to predict undergraduate success. Where existing tests are unsuited to a course’s entry
requirements, institutions may develop alternatives, but should be able to demonstrate
that their methods are relevant, reliable and valid.’ (p. 8)
A levels are central to the UK higher education admissions process and the ability of A level
grades to predict degree outcomes has been demonstrated using a large data set (Bekhradnia
and Thompson, 2002). Whilst some evidence regarding the validity of admissions tests within

4
the UK context has been published (Bell, 2005, Emery, 2007a, 2007b), to date such research
has generally only been possible with relatively small numbers of students. Amongst its
wider recommendations the Schwartz report encouraged the commissioning of research to
evaluate the ability of aptitude tests to assess the potential for higher education.
The principal previous study underpinning this current research is the pilot
comparison of A levels with SAT scores conducted by NFER for The Sutton Trust in 2000
(McDonald et al., 2001a, Whetton, 2001). SAT scores were collected together with A level
grades, prior attainment and a range of background information for 1295 students from a
sample of high-attaining, low-attaining and selective independent schools. The study revealed
that the SAT was only modestly associated with A level grades, which indicated that the SAT
was assessing a distinct construct from A levels. (There was a slightly stronger association
between the SAT and GCSE attainment.) However, there was no evidence that the
association differed according to background factors such as ethnicity, parental socio-
economic status or overall achievement of the school.
The 2000 study used a shortened version of the SAT, and further analyses explored
the functioning of this test with English students. These showed that the SAT provided a
coherent assessment of verbal and math reasoning ability, and that individual items appeared
to function similarly for English and American students. Although the SAT has been
relabelled as a ‘reasoning’ test rather than a test of ‘aptitude’, it is still generally perceived as
a test of academic aptitude. Implicit within the term ‘aptitude’ is the concept of the predictive
facet of validity. The purpose of an aptitude test is to measure an individual’s potential for
obtaining a certain goal. In this case, the goal is successful completion of a university course
and achievement (i.e. degree class). For a detailed discussion of aptitude testing for university
entrance see also the literature review conducted by McDonald et al. for the Sutton Trust
(2001b).
An important aspect of the research will be to consider whether the validity of the
SAT differs across different sub-groups of students and to consider the utility of such a test if
such differences occur. In the United States, although high school grades are often seen as the
slightly better predictor of college grades, it is reported that the SAT adds to their predictive
power to a statistically significant degree, and may be a more accurate predictor for some
groups of students with discrepancies between grades and SAT scores (Kobrin et al., 2002).
Female students often achieve higher high school grades than male students with similar SAT
test scores but suggestions that female high school grades might be inflated (e.g. because of
attitudes towards class work) are not supported by research that shows that the SAT (in
particular the Maths component) under-predicts female college grades, even after controlling
for the subjects studied (Pennock-Roman, 1994). However, it has been suggested that the
SAT more accurately predicts college grades for female students than it does for males
(Kobrin et al., 2006).
The issue as to whether the SAT is gender-biased is particularly pertinent in any
decision as to whether such a test should be used to inform admissions to higher education in
the UK. It is also a particularly complex issue because of current concerns in the UK about
gender differences in educational attainment, in particular, the under-performance of boys in
national examinations (DfES, 2007), and the decrease in the proportion of male students
entering higher education (Berliner, 2004). Other subgroup performance differences are
equally important and are reported where possible to inform the on-going debate. However,

5
they are difficult to examine in detail within the current research because of the relatively
small numbers of students in some sub-groups.
2.1 Objective of the research
The primary aim of the longitudinal study is to examine whether the SAT and A
levels together are better able to predict university participation and outcomes (degree
success) than A level results alone. Two specific issues also to be addressed are:
Can the SAT identify students with the potential to benefit from higher education whose
ability is not adequately reflected in their A level results because of their (economically or
educationally) disadvantaged circumstances?
Can the SAT distinguish helpfully between the most able applicants who achieve A
grades in all their A level subjects?
Although, it is not intended that the SAT or similar academic aptitude test would replace A
levels, the use of such a test might be considered alongside A levels, if the SAT and A levels
together were found to better predict performance in higher education than A levels alone.
Until degree outcomes for students in the sample become available in 2010, it will not be
possible to answer the main research questions. In the early phases of the research the
analysis is therefore focussed on the relationships between SAT scores, A level scores/grades,
prior attainment at age 16 and background characteristics of the student sample.
3 Methodology
The current research is based on approximately 8000 students in English schools and
Further Education colleges, who took the SAT Reasoning Test in autumn 2005 during the
final year of their two-year A level courses. (For most students this is the academic year in
which their 18th
birthday occurs.) The SAT comprises three main components: Critical
Reading, Mathematics and Writing; for a full description and the scoring metric see
www.collegeboard.com. In January 2007 the SAT data for students in the sample was
matched with the 2005/06 National Pupil Database supplied by the Department for Education
and Skills (DfES). The dataset included their A level results, prior attainment at age 16
(GCSE results) and, for students educated within the maintained sector, background
characteristics from the Pupil Level Annual School Census (PLASC) data. The number of
students with valid data on all three main variables (SAT scores, A levels and GCSEs) was
8041, hereafter referred to as the main sample. The ‘national population’ was derived from
the same National Pupil Dataset by extracting those students taking two or more A levels, i.e.
the population that would be likely to be affected should a test such as the SAT ever be
introduced. Additional background characteristics were also obtained from responses to two
optional questionnaire surveys carried out in spring and autumn 2006.
Background characteristics of the main sample are shown in Table 1. These details
were obtained by combining information from the PLASC data for students from maintained
schools with information supplied by individual FE colleges and independent schools.

6
TABLE 1
Background characteristics of the main sample
Main sample National
population*
N
Valid per
cent N
Valid per
cent
Sex Male 3692 45.9 98625 45.6
Female 4349 54.1 117718 54.4
Ethnicity Asian or Asian British 670 9.1 7799 6.9
Black or Black British 117 1.6 2243 2.0
Chinese 116 1.6 996 0.9
Mixed 145 2.0 1392 1.2
White 6212 84.4 93732 83.2
Other 104 1.4 6499 5.8
Special Educational
Needs (SEN)
No provision 7437 97.3 114818 97.9
School Action 137 1.8 1632 1.4
School Action Plus 35 0.5 474 0.4
Statement of SEN 32 0.4 384 0.3
Free school meals
eligibility
No 5953 96.1 114058 97.2
Yes 243 3.9 3250 2.8
Total 8041 100 216343 100
* Candidates entered for 2+ GCE A levels in 2005/06 (source: DfES)
Valid percentages exclude missing data. Due to rounding, percentages may not sum to 100.
As can be seen from Table 1, there were more female students in the main sample
than male students (54 per cent and 46 per cent respectively), in line with the national
population of A level entrants. For further details of the sample see Kirkup et al. (2007).
In the initial analyses the main study variables were A level total scores, GCSE total
scores and SAT scores. In addition to simple descriptive statistics of sub-group performance
and correlations between the main study variables, various regression models were employed
to explore more complex relationships. For example to explore what factors predicted higher
or lower than expected performance on the SAT, once overall A level performance was taken
into account. In other words, comparing students with similar A level performance, what
other factors were likely to impact positively or negatively on SAT scores.
Having examined the relationships between SAT scores and students’ overall A level
performance (total A level scores achieved across all subjects), subsequent analyses
examined differences between male and female students, grouped according to whether they
had studied particular subjects at A level, e.g. A level mathematics. Within particular subject
groups (e.g. all students who had taken A level mathematics), the SAT performance of

7
students grouped by the grade achieved was also examined. More detailed subject analyses
by other subsets of students (e.g. grouped by ethnicity) were not possible because of the very
small numbers of students in some subgroups.
4 Results
In the analyses that follow, the attainment data for students in the sample was taken
from a dataset supplied to the NFER by the (DfES). Further details of the scoring systems for
both A level and GCSE qualifications and information about the discounting process (used to
avoid double counting of qualifications such as A and AS levels) can be found on the DfES
website (DfES, 2006).
4.1 Descriptive Statistics
Table 2 shows the sample and national means for the key attainment measures. The
main sample spans a wide range of ability but with a score distribution slightly skewed
towards the upper range compared to the national population of A level entrants taking 2 or
more A levels. However, although skewed towards the high end (probably because of the
high number of students in the sample from grammar schools and independent schools) the
distribution of scores broadly covers the same range as the population. The sample therefore
contains sufficient cases from all areas of the population to enable reasonable conclusions to
be drawn.
TABLE 2
Mean attainment scores – main sample
Main sample National population
Mean s.d. Mean s.d.
Total A level point score 848.6 260.4 808.4 235.8
Total GCSE point score 489.9 80.1 469.0 107.6
Average GCSE point score 47.4 6.0 46.4 5.5
n = 8041 max n = 216343
Values significantly different at the 5 per cent level are shown bold and in italics.
Table 3 shows the means obtained on each of the main components of the SAT
(Critical Reading, Mathematics, Writing ) and Figures 1 to 3 show the total score
distributions. For comparison purposes, the means and score distributions for over 1.4 million
students in the US 2006 college-bound seniors cohort are given (College Board, 2006). The
means achieved in the English sample are roughly comparable with US means, which are
averaged over a number of administrations throughout the year using different versions of the
SAT.
TABLE 3
Mean SAT scores – main sample and US 2006 cohort
SAT component Mean s.d. US mean US s.d.
Critical reading 500 115 503 113
Mathematics 500 116 518 115
Writing 505 88 497 109
n = 8041 n = 1,465,744

8
SAT® Reading Score distributions for England and US
0
2
4
6
8
10
12
14
16
18
20
200-249 250-299 300-349 350-399 400-449 450-499 500-549 550-599 600-649 650-699 700-749 750-800
Score range
% o
f stu
den
tsMain sample
US
FIGURE 1. Total score distribution for critical reading
SAT® Mathematics Score distributions for England and US
0
2
4
6
8
10
12
14
16
18
20
200-249 250-299 300-349 350-399 400-449 450-499 500-549 550-599 600-649 650-699 700-749 750-800
Score range
% o
f stu
den
ts
Main sample
US
FIGURE 2. Total score distribution for mathematics
SAT® Writing Score distributions for England and US
0
5
10
15
20
25
30
200-249 250-299 300-349 350-399 400-449 450-499 500-549 550-599 600-649 650-699 700-749 750-800
Score range
% o
f stu
den
ts
Main sample
US
FIGURE 3. Total score distribution for writing

9
Where data was available analyses included comparisons with a sample of
approximately 290,000 US students who took exactly the same version of the SAT to see if
there were any differences in performance that might indicate that the SAT test was
unsuitable for use with the English sample. This included an examination of differential item
functioning (dif). Overall these results indicated that the individual SAT items functioned in a
similar way for the English and US samples. For details of these comparisons see Kirkup et
al. (2007).
Table 4 gives a breakdown of the main study variables by gender. Breakdowns by
other background variables are given in the 2007 report cited above.
TABLE 4
Main study variable means by gender
Male (n = 3692) Female (n = 4349) Total (n = 8041)
A level total score 825.2 868.5 848.6
GCSE total score 485.9 493.3 489.9
SAT reading 497.6 501.7 499.8
SAT mathematics 523.3 480.3 500.0
SAT writing 494.9 513.3 504.8
Values significantly different at the 5 per cent level are shown bold and in italics.
Female students had higher total GCSE and A level points scores and achieved
significantly higher scores on the SAT Writing component than male students. There was no
significant difference in the scores for male and female students on the SAT Reading
component, but male students performed significantly better on the SAT Mathematics
component. The differences between male and female students on the various SAT
components are similar to recent results for students in the USA, where male students
generally outperform female students in mathematics but do less well in writing (College
Board, 2006).
4.2 Exploring the relationships between the main study variables
Table 5 displays the correlations between the GCSE and A level scores and between
GCSE and A level scores and each of the SAT scores.
TABLE 5
Correlations between GCSE scores, A level scores and SAT scores
A level total score GCSE total score Average GCSE
score
Mean SAT score 0.64 0.54 0.70
SAT reading 0.55 0.46 0.59
SAT mathematics 0.54 0.48 0.60
SAT writing 0.57 0.48 0.64
Writing: multiple-choice 0.55 0.47 0.62
Writing: essay 0.32 0.25 0.34
A level total score 0.58 0.76
GCSE total score 0.70
Correlations significantly different from zero at the 5 per cent level are shown bold and in
italics.

10
In Table 5 it is clear that the correlation between total SAT score and A level total
score is somewhat higher than with GCSE total score, but that the highest correlation with
total SAT is average GCSE score. Correlations with the different components of the SAT are
similar, except for the essay element which has much lower correlations with GCSE and A
level outcomes (probably at least partly because of the relatively restricted range of the essay
score). The correlation of total A level points with average GCSE score is higher than with
the total GCSE score. It is likely that this is because the number of GCSEs entered can vary
widely and does not always reflect the ability of the student whereas at A level there is far
less variation in the number of A levels attempted. The higher correlation between SAT and
average GCSE score than between SAT and A levels is in accordance with previous findings
(McDonald et al., 2001a). In the pilot SAT study in 2000 the correlations between SAT score
and mean A level grade were 0.33, 0.45 and 0.50 for independent, low-achieving and high-
achieving schools respectively. However, the SAT as a whole has undergone some change
since 2000, particularly the introduction of the writing components, and therefore one would
expect a higher correlation between total SAT scores and A levels than previously. Also there
have been considerable changes to the A level system since the pilot; a greater number of
subjects are now studied at A level and the structure of such courses is modular.
The high correlations between SAT scores and attainment at GCSE and A levels are
not unexpected given that each of these is measuring overall educational ability, albeit
measuring different aspects and in different ways. The relationship between A levels and
SAT scores is complicated in that each of these measures is associated with prior attainment
at GCSE. Controlling for average attainment at GCSE, the partial correlation between SAT
and A levels was 0.23. This suggests that, although SAT and A levels are highly correlated,
the underlying constructs that are being measured are somewhat different. This may indicate
a potential for the SAT to add to the prediction of higher education outcomes from A levels,
although the increment is likely to be relatively small. Whether this is indeed the case, will
not be known until degree outcomes are available for students in the sample.
Regression analyses (Table 6) were used to determine if certain students performed
higher or lower in the SAT than was expected given their A level total scores and prior
attainment at GCSE. In these analyses a mean SAT score averaged over the three SAT scores
was used. The measure of prior attainment used was the GCSE average score (over the best
eight subjects) rather than the GCSE total score. As stated previously, this is because the
number of GCSEs taken may vary widely according to the school or college attended and is
not necessarily reflective of the ability of the student. In Table 6 (and also in Tables 9 to 11)
significant results (at the 5 per cent level) are presented in terms of ‘adjusted coefficients’ –
the expected change in SAT score due to an ‘average change’ in each background variable,
keeping all other variables constant. See Schagen (2004) for a fuller explanation.

11
TABLE 6
Significant adjusted coefficients for regression model to predict higher or lower than
expected SAT performance
Variable
Adjusted coefficient
(expected change in SAT score)
(A level only) (A level + average GCSE)
Total A level points score +77 +30
Average GCSE points score n/a +69
Female (v. male) -17 -22
Asian (v. white) -27 -26
Black (v. white) -22 -
Chinese (v. white) -47 -33
Ethnicity unknown (v. white) -14 -10
SEN (v. no SEN) -20 -10
EAL (v. no EAL) -13 -9
The analysis showed that female students, some ethnic minorities, students with
special educational needs (SEN) and students learning English as an additional language
(EAL) appeared to perform less well on the SAT than expected compared to the default
categories (i.e. boys, white students, etc). Black students did less well when A level results
were taken into account but did neither better nor worse than expected when prior attainment
at GCSE was also taken into account. For the model predicting overall SAT score, controlling
for A level results only, the explanatory power was such that 44.7 per cent of the variance in
the SAT outcome was explained (R2 = 0.447). When GCSE average score was also included
in the model 49.5 per cent of the variance was explained (R2 = 0.495). These analyses suggest
that the SAT is measuring something similar but not identical to A levels and GCSEs.
As one of the research questions is to explore the ability of the SAT to identify
students with the potential to benefit from higher education whose ability is not adequately
reflected in their A level results because of disadvantaged circumstances, a particular variable
of interest was the free school meals indicator. The free school meals eligibility indicator is
often viewed as a proxy for disadvantaged circumstances. However, this indicator was not a
significant variable in either of these analyses when attempting to predict average SAT
performance, i.e. there was no tendency for students eligible for free school meals to perform
better (or worse) in the SAT than in the other two attainment measures. However, when the
regression model controlling for both A level total score and mean GCSE score was run for
each of the three main SAT components separately, students known to be eligible for free
school meals did better than would be expected on the SAT Critical Reading component
compared to students that were not eligible. In other words students eligible for free school
meals tended to achieve higher reading scores than non-eligible students with similar GCSE
and A level attainment. However, in both regression analysis models to predict higher or
lower performance in the SAT Maths component, free school meals students did worse than
expected.
4.3 Relationships between SAT scores and subject attainment
Further analyses were carried out examining performance on the SAT by subgroups
of students according to the subjects studied at A level. With the overall large sample size,
the numbers of students taking specific subject A levels also remained substantial. This meant
that it was possible to explore the relationships of the individual A level subject grades with

12
the three SAT measures. Any such analysis is actually collating data from several A level
providers and rests on the assumption that the grades awarded are comparable and equated in
terms of level. This assumption underpins the universities’ use of grades and so is accepted
here.
4.3.1 Correlational analysis
An initial examination of the relationships between the SAT and the ten most popular
A level subjects (those taken by large numbers of students) was undertaken using a simple
correlational approach. This analysis showed that there is no one pattern of relationships
between A levels and the SAT scores. For several subjects, the Maths score of the SAT has
the strongest relationship with the A level outcome. These include Physics and Mathematics
A levels especially and Biology and Chemistry to a lesser extent. In contrast, for other
subjects, the Writing element of SAT has the strongest relationship. This includes the A
levels of English Literature, English Language and History. For these subjects Critical
Reading is also strongly related to the A level outcomes. For Geography, there is no real
differentiation and all three SAT scores are similarly related to A level outcome. The same is
true of Psychology, which has the weakest relationship between SAT scores and A level
grades. For a fuller account of this analysis see Whetton, 2007.
As an illustration, the results for A levels in Mathematics and English are shown in
Table 7. The table shows the sample size and then the correlation of the subject grade with
the three SAT scores of Maths, Critical Reading and Writing. The data is shown for the total
group and then for males and females separately. All the correlations shown are statistically
significant.
TABLE 7
Correlations between SAT Scores and A level grades for specific subjects
SAT Scores
A Level
subjects Cases Maths
Critical
Reading Writing
Mathematics
All 2202 .45 .28 .31
Male 1295 .48 .28 .29
Female 907 .45 .28 .33
English.
Language
All 915 .33 .47 .47
Male 306 .32 .41 .38
Female 609 .36 .51 .52
English
Literature
All 1730 .46 .55 .59
Male 536 .45 .52 .55
Female 1194 .48 .57 .61
As can be seen above there is little difference in the pattern of correlations for male
and female students in Mathematics and English Literature. However, the correlations
between the SAT scores of Critical Reading and Writing and A level English Language are
reasonably substantial for female students and are much lower for males.

13
4.3.2 Further exploration of gender differences in subject relationships
Following the correlational analysis, further examination was made of the
relationships between the SAT scores and individual A level outcomes for each subject, for
males and females. These relationships are illustrated using box and whisker plots, which
show the median score, the semi-interquartile range, the full range of scores and the outliers
for each grade obtained in a particular subject A level.
Mathematics. Approximately 2200 students in our sample had taken the full two-year A level
course and a further 500+ students had taken the one-year AS course (equivalent to half an A
level). Compared to the percentages of male and female students in the sample as a whole
(46% and 54% respectively) the proportion of male and female students within the
mathematics sub-group were reversed (58% male and 42% female), reflecting the proportions
of male/female students taking A level Mathematics in the national (England) population.
Male students achieved higher means in the SAT Maths component than female students
within both the mathematics and the non-mathematics groups and, as one might expect,
mathematics students achieved higher means than non-mathematics students, see Table 8. An
analysis of differential item functioning (dif) taking into account mean overall scores did not
identify any SAT Maths items that were disproportionately easy or difficult for male or
female students in our sample, suggesting that differences in performance were not due to
bias in individual items. Also there was no interaction between the sex of student and
studying A level Mathematics; the increase in SAT score due to studying A level
Mathematics was the same for both male and female students.
TABLE 8
SAT Maths scores for students with or without A level Mathematics
SAT
Maths score
No mathematics beyond GCSE
male (n = 2085) 454
female (n = 3184) 440
total (n = 5269) 446
A level (or AS) mathematics
male (n = 1607) 613
female (n = 1165) 591
total (n = 2772) 603
Total
male (n = 3692) 523
female (n = 4349) 480
total (n = 8041) 500
In the A level results, the percentage of female students who achieved the highest
grade (A) in either AS or A level Mathematics (43%) was higher than the percentage of male
students (37%). The SAT performance of students grouped by the A level grade achieved is
illustrated in Figure 4.

14
FIGURE 4. SAT Maths score by highest AS or A grade
Amongst students with Mathematics A level, male students achieved higher means in
the SAT Maths component than female students at every A level grade. As shown in Table 7
the correlation between Maths SAT score and Mathematics A level was 0.48 for males and
0.45 for females. This means that although the strength of the relationship between Maths
SAT scores and Mathematics A level grade is similar for both males and females, males have
higher SAT scores. Similar analyses looking at SAT Maths scores grouped by grades
achieved in a number of different subjects (Biology, Chemistry, Physics, Geography, History,
Psychology, English, English Literature, Modern Foreign Languages) showed similar results
– male students tended to achieve higher SAT Maths scores than females with the same A
level grade.
A regression model was used to examine which factors are the best predictors of the
SAT Maths score. This type of analysis makes it possible to compare the performance of
certain groups (e.g. male and female students), taking into account factors such as A level
performance, prior attainment at GCSE, school type and pupil background characteristics,
such as ethnicity and eligibility for free school meals. As in Table 6 (and also in Tables 10
and 11) significant results (at the 5 per cent level) are presented in terms of ‘adjusted
coefficients’ – the expected change in SAT score due to an ‘average change’ in each
background variable, keeping all other variables constant.

15
TABLE 9
Significant adjusted coefficients for regression model to predict SAT Maths performance
Variable
Adjusted coefficient
(expected change in
SAT score)
A level in mathematics 125
AS level in mathematics (not A2) 69
Average prior attainment (GCSE) 57
Total A level and equivalent point score 21
Boys v. girls 34
Asian -21
Mixed ethnic group -14
Missing ethnic group -6
n = 8041
The regression model showed that studying mathematics at A level, having higher
prior attainment points scores and higher A level total points were all associated with higher
SAT Maths scores. Being a male student was associated with higher scores whereas being
Asian or of mixed ethnic background was associated with lower scores. In other words male
students are likely to achieve higher SAT Maths scores than female students with similar
prior attainment and A level points scores and Asian students are likely to achieve lower
scores than comparable white students. The coefficients show the relative strength of the
various predictors. For example, whether a student has studied A level maths has a much
greater impact on the SAT Maths score than gender.
English. Thirty two per cent of students in the sample had studied an A level in an English
subject (including English, English Language and English Literature). This is very similar to
the figure of 33 per cent for the population in England as a whole. A further six per cent of
students in the sample had studied a one-year AS English course. Within the English A level
sub-group 68 per cent were female and 32 per cent were male students. Thirty two per cent of
the female students and 24 per cent of the male students achieving grade A. The equivalent
national figures for students achieving A grades in England in 2006 were 22 per cent and 21
per cent for female and male students respectively (JCQ, 2006).
Students with an AS or A level in English achieved significantly higher scores than
students without English A level in the Critical Reading and Writing components of the SAT,
see Table 10. For Critical Reading and Writing there was an interaction between the sex of
the student and studying English at A level, i.e. the difference in the SAT scores between
students studying English at A level and those not taking English was greater for male
students than for female students.
16
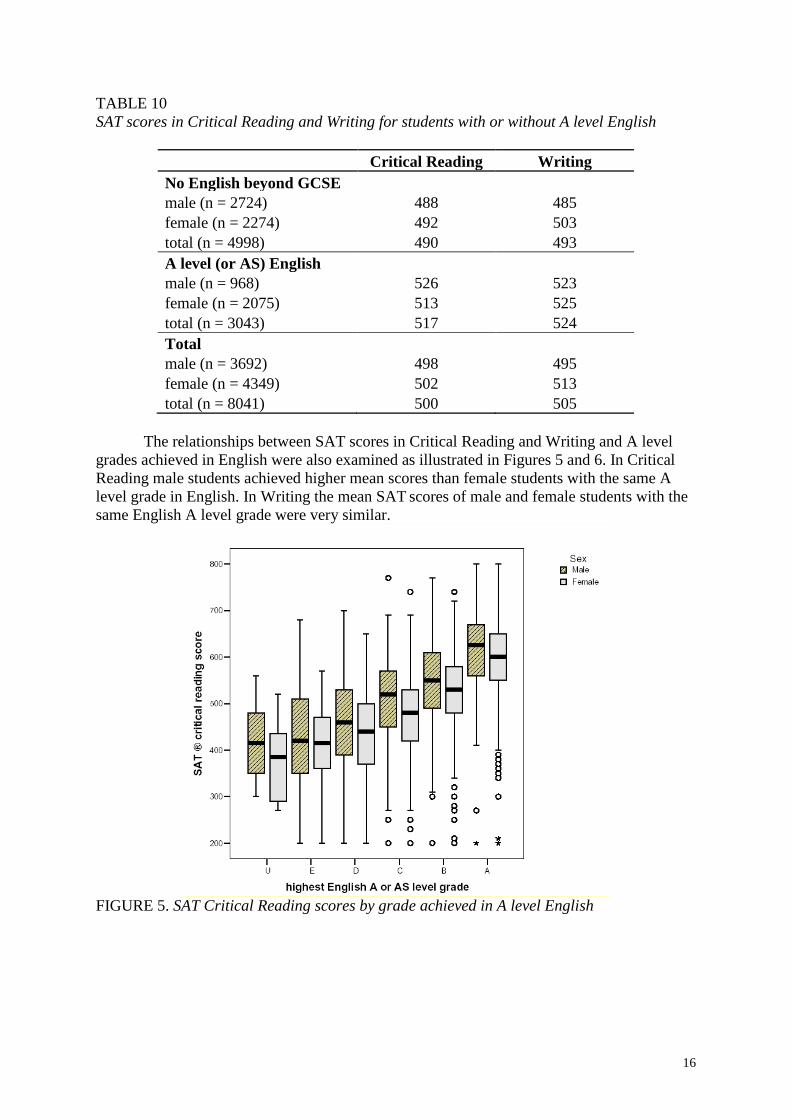
TABLE 10
SAT scores in Critical Reading and Writing for students with or without A level English
Critical Reading Writing
No English beyond GCSE
male (n = 2724) 488 485
female (n = 2274) 492 503
total (n = 4998) 490 493
A level (or AS) English
male (n = 968) 526 523
female (n = 2075) 513 525
total (n = 3043) 517 524
Total
male (n = 3692) 498 495
female (n = 4349) 502 513
total (n = 8041) 500 505
The relationships between SAT scores in Critical Reading and Writing and A level
grades achieved in English were also examined as illustrated in Figures 5 and 6. In Critical
Reading male students achieved higher mean scores than female students with the same A
level grade in English. In Writing the mean SAT scores of male and female students with the
same English A level grade were very similar.
FIGURE 5. SAT Critical Reading scores by grade achieved in A level English

17
FIGURE 6. SAT Writing scores by grade achieved in A level English
Although there appears to be less difference between male and female SAT Writing
scores amongst students with the same A level grade, when the essay sub-score is removed
(30 per cent of the SAT Writing score) a more pronounced gender effect is observed across
the lower A level grades although not at the highest grade (see Figure 7).
FIGURE 7. Multiple-choice SAT Writing sub-scores by grade achieved in A level English

18
As with the mathematics analysis, regression models were run to examine which
factors were the best predictors of SAT Critical Reading and Writing scores. The outcomes
shown in Tables 11 and 12 are again presented in terms of ‘adjusted coefficients’ – the
expected change in SAT score due to an ‘average change’ in each background variable,
keeping all other variables constant.
TABLE 11
Significant adjusted coefficients for regression model to predict SAT Critical Reading
performance
Variable
Adjusted coefficient
(expected change in
SAT score)
A level in English 26
AS level in English (not A2) 15
Average prior attainment (GCSE) 71
Total A level and equivalent point score 35
Boys v. girls 16
Asian -48
Black -19
Chinese -73
Missing ethnic group -16
Eligible for free school meals 18
n = 8041
TABLE 12
Significant adjusted coefficients for regression model to predict SAT Writing performance
Variable
Adjusted coefficient
(expected change in
SAT score)
A level in English 27
AS level in English (not A2) 17
Average prior attainment (GCSE) 58
Total GCE A level and equivalent point score 24
Asian -39
Black -12
Chinese -78
Missing ethnic group -12
Mixed ethnicity -11
Other ethnicity -17
n = 8041
Comparing Table 9 with Tables 11 and 12 there is a noticeable difference in the
impact of studying A level Mathematics on the SAT Maths score compared to the impact of
studying an English A level on either the SAT Critical Reading or Writing score; the effect of
19
the first being much larger than the other two. However, ethnic group differences tended to
be larger in SAT Critical Reading and Writing scores than in SAT Maths scores.
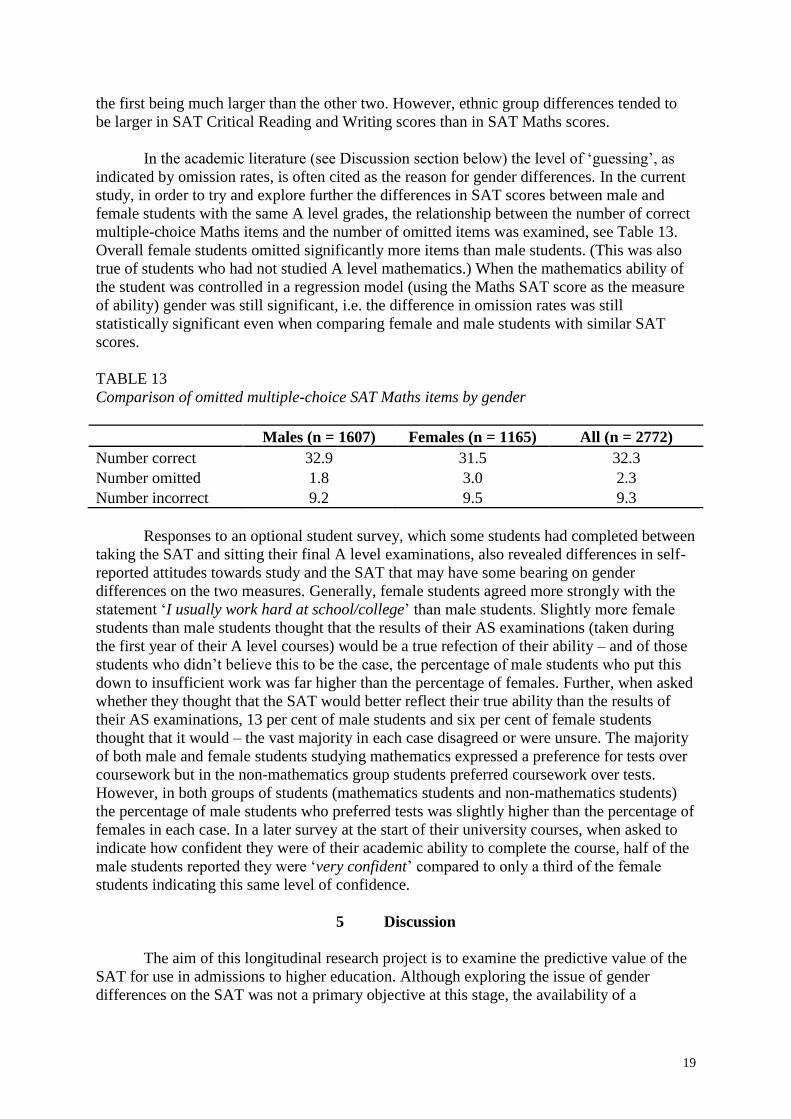
In the academic literature (see Discussion section below) the level of ‘guessing’, as
indicated by omission rates, is often cited as the reason for gender differences. In the current
study, in order to try and explore further the differences in SAT scores between male and
female students with the same A level grades, the relationship between the number of correct
multiple-choice Maths items and the number of omitted items was examined, see Table 13.
Overall female students omitted significantly more items than male students. (This was also
true of students who had not studied A level mathematics.) When the mathematics ability of
the student was controlled in a regression model (using the Maths SAT score as the measure
of ability) gender was still significant, i.e. the difference in omission rates was still
statistically significant even when comparing female and male students with similar SAT
scores.
TABLE 13
Comparison of omitted multiple-choice SAT Maths items by gender
Males (n = 1607) Females (n = 1165) All (n = 2772)
Number correct 32.9 31.5 32.3
Number omitted 1.8 3.0 2.3
Number incorrect 9.2 9.5 9.3
Responses to an optional student survey, which some students had completed between
taking the SAT and sitting their final A level examinations, also revealed differences in self-
reported attitudes towards study and the SAT that may have some bearing on gender
differences on the two measures. Generally, female students agreed more strongly with the
statement ‘I usually work hard at school/college’ than male students. Slightly more female
students than male students thought that the results of their AS examinations (taken during
the first year of their A level courses) would be a true refection of their ability – and of those
students who didn’t believe this to be the case, the percentage of male students who put this
down to insufficient work was far higher than the percentage of females. Further, when asked
whether they thought that the SAT would better reflect their true ability than the results of
their AS examinations, 13 per cent of male students and six per cent of female students
thought that it would – the vast majority in each case disagreed or were unsure. The majority
of both male and female students studying mathematics expressed a preference for tests over
coursework but in the non-mathematics group students preferred coursework over tests.
However, in both groups of students (mathematics students and non-mathematics students)
the percentage of male students who preferred tests was slightly higher than the percentage of
females in each case. In a later survey at the start of their university courses, when asked to
indicate how confident they were of their academic ability to complete the course, half of the
male students reported they were ‘very confident’ compared to only a third of the female
students indicating this same level of confidence.
5 Discussion
The aim of this longitudinal research project is to examine the predictive value of the
SAT for use in admissions to higher education. Although exploring the issue of gender
differences on the SAT was not a primary objective at this stage, the availability of a

20
concurrent measure of ability, students’ A level results, with relatively large samples of
students raises interesting questions for educational practitioners.
Differences in SAT Maths and Critical Reading scores were not found to be due to the
ceiling effect of the A level A grade as these gender effects were observed at each grade not
just among students with A grades. The fact that a gender difference occurs across all grades
suggests that there is a difference between male and female students that is not accounted for
by differences in A level attainment. The ability of the female test-takers is not in doubt, as
demonstrated in their A level achievements. The issue is whether such performance
differences between male and female students are due to differences in the content or format
of the questions and to what extent these are mediated by differences in terms of their
motivation, attitudes, learning styles, risk-taking, confidence levels, etc.
In respect of mathematics tests a common hypothesis is that standardised tests are
more likely to contain novel problems not previously encountered by students and that,
because of their more autonomous learning styles, male students are more adept at
transferring their mathematical knowledge and experience to solve these questions than
female students (Kimbal, 1989). It is possible that the questions included within the A level
examinations rely on applying the knowledge and skills learned over the two-year period of
the course and that female students do better on such examinations, whereas male students
perform better on the novel problems or unfamiliar questions encountered within the SAT.
However, the gender effect is not restricted to the SAT Maths component only. In the
relationship between SAT Writing and A level English grades the gender effect is much more
pronounced when the essay sub-score is removed. As the remaining section of the Writing
component is multiple-choice this would tend to support the notion that it is the multiple-
choice format of the test that favours male students.
Higher scores on the SAT for male students have often been attributed to the multiple-
choice format of the test. Evidence over a wide range of tests, would certainly suggest that
multiple-choice formats favour male students (Henderson, 2001; Wester & Henriksson, 2000;
DeMars, 2000). Where male students outperform female students on such tests, the reason for
the score gap is often attributed to a difference in the extent to which male and female
students are prepared to make informed guesses. Evidence has shown that female students
tend to guess less frequently than male students resulting in higher omission rates (Ben-
Shakhar & Sinai 1991). As higher omission rates by female students occurred in this study, it
appears likely that the differences observed are in some way connected to the multiple-choice
format of the SAT questions.
However it is possible that the situation is more complex than this. Other reasons that
have been put forward to explain gender differences in tests include the level of interest in the
subject, self-confidence (Lundberg et al., 1994) and the anxiety generated by the more
speeded competitive format of a multiple-choice test. Although the evidence is slight, the
responses from the optional student survey would suggest that male students in the sample
tend to have more confidence in their academic ability than female students. In some studies,
differences in test scores between males and females have been reduced when students
concurrently assess the correctness of their answers. It is the female scores which tend to
change, the suggestion being that reflecting on the extent to which they are sure of their
answers helps them to respond more accurately, possibly by reducing their test anxiety and
increasing their self-confidence (Hassmen & Hunt, 1994; Koivula, 2001). This lends support

21
to the view that self-confidence and anxiety are contributory factors and that it may not be the
multiple-choice format of itself that that causes the gender difference.
If female students are less confident when dealing with novel examination questions
or unfamiliar test formats and male students in turn are less motivated when confronted by
familiar material that they may perceive as less challenging, these are interesting pedagogical
issues, but ones in the main outside the scope of this research. There is insufficient evidence
to conclude definitively why differences on the SAT occur between male and students with
similar A level ability. However, what will be essential in the later stages of this research will
be to assess whether the ability of A level examinations to predict degree outcomes is
enhanced by the addition of the SAT scores and whether this predictive power is the same for
both male and female students.
If a test such as the SAT were to be used for admissions to higher education, it will
also be important to consider the impact of studying particular courses at A level on SAT
scores. Research by the College Board has highlighted that the inclusion of new mathematics
content in the SAT Maths component has made the test more sensitive to the mathematics
courses studied by students in the US (Deng & Kobrin, 2007). As highlighted by this research
the impact of studying mathematics at A level would potentially have a much greater impact
on the SAT Maths scores than the impact of studying A level English on Critical Reading and
Writing scores.
It is clear that evaluating the validity of the SAT will be a complex and difficult task.
The research to date shows that the SAT scores have different relationships to A level
outcomes for different subjects, and for male and female students. The implication of this for
the SAT as a selection instrument alongside A levels is that it may add greater or lesser
amounts of differentiated information for university entrance, depending both on the sex of
the student, the subjects taken at A level and the degree subject applied for. A full
investigation of this must of course wait until the degree outcomes are known and the
relationships between these and the various SAT components can be explored. As well as
establishing the value of the SAT in predicting performance the broader issues of the
implementation of such a test would have to be addressed. The findings will need to be
considered within a wider context, i.e. not only the usefulness of the SAT but the
appropriateness and consequences of its use, both intended and possibly unintended.

22
REFERENCE LIST
Bell, J. F. (2005). The case against the BMAT: not withering but withered? Available at
http://www.bmj.com/cgi/eletters/331/7516/555#120603 [25 February, 2008].
Bekhradnia, B. & Thompson, J. (2002). Who does best at university? Available at
http://www.hefce.ac.uk/learning/whodoes [25 February, 2008].
Ben-Shakhar, G. & Sinai, Y. (1991). Gender differences in multiple-choice tests: The role of
differential guessing. Journal of Educational Measurement, 28, 23-35.
Berliner, W. (2004). Where have all the young men gone? Available at
http://education.guardian.co.uk/gendergap/story/0,7348,1218768,00.html [20
February, 2008]
College Board (2006). 2006 college-bound seniors: Total group profile report. Available at
http://www.collegeboard.com/prod_downloads/about/news_info/cbsenior/yr2006/nati
onal-report.pdf [22 March, 2007].
Deng, H. & Kobrin, J. L. (2007). The impact of course-taking on performance on SAT items
with higher-level mathematics content. Available at
http://www.collegeboard.com/research/pdf/07594RDCBRpt06-8.pdf [20 February,
2008]
DeMars C.E. (2000). Test stakes and item format interactions. Applied Measurement in
Education, 13(1), 55-77.
Department for Education and Skills (2004). Fair admissions to higher education:
recommendations for good practice. London: DfES. Available at
http://www.admissions-review.org.uk/downloads/finalreport.pdf [25 March, 2007].
Department for Education and Skills (2006). School and college achievement and attainment
tables (formerly performance tables: Technical annex). London: DfES. Available at
http://www.dfes.gov.uk/performancetables/pilot16_05/annex.shtml [25 February,
2006].
Department for Education and Skills (2007). Gender and education: the evidence on pupils in
England. London. DfES. Available at
http://www.dfes.gov.uk/rsgateway/DB/RRP/u015238/index.shtml [25 February,
2008].
Emery, J. (2007a). A report on the predictive validity of the BMAT (2005) for 1st year
examination performance on the medicine and veterinary medicine courses at the
University of Cambridge. Available at
http://www.bmat.org.uk/downloads/BMAT%202005%20predictive%20validity%20re
port%20-%20Cambridge%20medics%20and%20vets%20(26-09-07).pdf [25
February, 2008].

23
Emery, J. (2007b). The predictive validity of the thinking skills assessment: A combined
analysis of three cohorts. Available at
http://tsa.ucles.org.uk/pdf/combined%20TSA%20validity%20report.pdf [25 February,
2008].
Henderson, D. L. (2001). Prevalence of gender DIF in mixed format high school exit
examinations. Paper presented at the Annual Meeting of the American Educational
Research Association (Seattle, WA, April 10-14, 2001), April 12.
Higher Education Funding Council for England (2005). Young participation in higher
education. London: HEFCE . Available at
http://www.hefce.ac.uk/pubs/hefce/2005/05_03/ [22 March, 2007].
Joint Council for Qualifications (2006). Results 2006. Available at
http://www.jcq.org.uk/attachments/published/256/A-
Level%20Results%20Booklet%202006%20Password%20Protected.pdf [21 February
2007].
Kimball, M. M. (1989). A new perspective on women's math achievement. Psychological
Bulletin, 105, 198-214.
Kirkup, C., Schagen, I., Wheater, R., Morrison, J. & Whetton, C. (2007). Use of an aptitude
test in university entrance - a validity study: Relationships between SAT© scores,
attainment measures and background variables (DfES Research Report 846).
London: DfES. Available at
http://www.dfes.gov.uk/research/data/uploadfiles/RR846.pdf [25 February, 2008].
Kobrin, J. L., Camara, W.J. & Milewski, G.B. (2002). Students with discrepant high school
GPA and SAT I scores. Available at
http://professionals.collegeboard.com/research/pdf/RN-15%20v4.pdf [20 February,
2008].
Kobrin, J. L., Sathy, V. & Shaw, E. J. (2006). A historical view of subgroup performance
differences on the SAT reasoning test. Available at
http://www.collegeboard.com/research/pdf/06-1868%20RDCBR06-5_070105.pdf [25
February,2008].
Koivula, N. (2001) Performance on the Swedish Scholastic Aptitude Test: Effects of self-
assessment and gender, Sex Roles: A Journal of Research, 44(11-12), 629-645.
Lundeberg, M. A., Fox, P. W, & Puncochar, J. (1994). Highly confident but wrong: Gender
differences and similarities in confidence judgments, Journal of Educational
Psychology, 86, 114-121.
McDonald, A.S., Newton, P.E. & Whetton, C. (2001a). A pilot of aptitude testing for
university entrance. Slough: NFER.
McDonald, A.S., Newton, P.E., Whetton, C. & Benefield, P. (2001b). Aptitude testing for
university entrance: A literature review. Slough: NFER.

24
Pennock-Roman, M. (1994). College major and gender differences in the prediction of
college grades [online]. Available at:
http://www.collegeboard.com/research/pdf/RR%2094-2.PDF [20 February 2008]
Schagen, I. (2004). Presenting the results of complex models - normalised coefficients, star
wars plots and other ideas. In: I. Schagen, I. & K. Elliot. (Eds.) But what does it
mean? The use of effect sizes in educational research. Slough: NFER.
Wester, A & Henriksson,W. (2000). The interaction between item format and gender
differences in mathematics performance based on TIMSS data, Studies in Educational
Evaluation, 26(1), 79-90.
Whetton, C. (2001). Aptitude testing for university entrance. Paper presented at the
International Association for Educational Assessment 27th Annual Conference ‘The
Future and Challenges of Educational Assessment in the 21st Century’, Rio de
Janeiro, 10
Whetton, C., Kirkup, C., Schagen, I., Wheater, R. & Morrison, J. (2007). Preliminary stages
of a validity study of the use of an aptitude test in university entrance. Paper
presented at the 33rd International Association for Educational Assessment
Conference, 16 – 21 September 2007, Baku, Azerbaijan.

25
NOTES
i GCSE (short for General Certificate of Secondary Education). GCSEs are the main
examinations taken by UK students aged 16 at the end of statutory secondary education.
These are subject based, with students studying eight or nine subjects typically.
ii A Level - short for Advanced Level. In England A Levels are studied between the ages of
16-18 years. The first year of A Level is called AS Level and the second year is called A2
and together they make up an A Level. Generally students take examinations at the end of
both years. The curriculum is set by the government but the examinations and specifications
(syllabuses) are set by individual boards. The examination is subject based with a separate
grade for each curriculum area. Typically students study only three or four subjects rather
than the broad curriculum typical of most other countries. All subjects are graded from A-E
and typically students need 3 or 4 good A level grades to gain entry to a top UK university.