Embed Size (px)
Citation preview

European Journal of Food Science and Technology
Vol.4, No.3, pp.52-65, June 2016
___Published by European Centre for Research Training and Development UK (www.eajournals.org)
52
ISSN 2056 - 5798(Print), ISSN 2056 - 5801(online)
RELATIONSHIP OF SODIUM CARBONATE SRC WITH SOME
PHYSICOCHEMICAL, RHEOLOGICAL AND GELATINIZATION PROPERTIES
OF FLOUR AND ITS IMPACT ON END QUALITY OF BISCUIT
Muhammad Shakeel Khan1,2 , Rahil Ahmed1,2, Rashida Ali1,2,3 and Syed Asad Sayeed1
1Department of Food Science & Technology, University of Karachi, Karachi, Pakistan 2English Biscuit Manufacturers (Private) Limited, Karachi, Pakistan
3Jinnah Women University, Karachi, Pakistan
ABSTRACT: Chemists are always in search of simple, rapid and inexpensive tests to replace
time consuming, uneconomical and complex instrumental analysis. The present paper
describes exploring possibilities of sodium carbonate Solvent retention capacity (SCSRC) test
association with some physicochemical and rheological properties of flour in view of their
sorption capacities. The results illustrated that SCSRC values based on flour's multiple
characteristics such as swelling power, water absorption, hydrophilicity and structural
diversity of hydrophilic polymers affected rheological behaviour that predict end quality of
biscuit. It was found that SCSRC was negatively correlated with flour moisture content and
positively associated with water absorption capacity. Flour particle size (<125µm) also
showed similar positive correlation. Farinograph’s other parameters were also significantly
predictive considering only SCSRC value. Glutomatic proteins were not found associated with
SCSRC. In conclusion it may be derived that SCSRC test stands parallel to some cumulative
results achieved from Farinograph, MVAG and Kernelyzer.
KEYWORDS: Chemist, Sodium Carbonate, Physicochemical, Rheological, Gelatinization
Flour, Biscuit
INTRODUCTION
It is well documented in this advance cereal technology world that every flour type is not
equally suitable for producing a specific desired end product or for the defined manufacturing
process. Insufficient knowledge about flour characteristics is a key factor in facing
unfavourable, undesired and troubleshooting behaviour of dough during processing. Solvent
retention capacity (SRC) tests have achieved a dependable status among simple chemical tests
to be used for prediction of flour quality for assessing it's suitability for a specific product
processing. Geng and co-workers (2012) has recently reported by, that the SRC method
highlights some physicochemical properties of the Chinese soft wheat flours which are closely
related to the rheological behaviour of the dough and end qualities of biscuits. The SRC method
was introduced by Slade and Levine (1994) in the late 1980's, later it was implemented as an
AACC approved method six year after (Gaines, 2004). Recently the suitability of SRC tests to
assess the European wheat flour for cookie and bread has been established by Duyvejonck and
colleagues (2012, 2011). The authors have demonstrated that the swelling capacity of
hydrophilic polymers such as damaged starch (DS) plays key role in predicting the baking
performance of the flour. (Rahida Ali et al., 2014). The water absorption apart from other
conditions depends on pH of the solution. The 5% SCSRC solution gives pH 11 where OH
groups are ionized and negatively charged. The solvent absorbed is related to content of DS
and water absorbed by flour both are inversely related to the diameter of cookies. The

European Journal of Food Science and Technology
Vol.4, No.3, pp.52-65, June 2016
___Published by European Centre for Research Training and Development UK (www.eajournals.org)
53
ISSN 2056 - 5798(Print), ISSN 2056 - 5801(online)
awareness about involving SRC tests to evaluate flour quality for producing biscuit is
increasing worldwide. Chinese soft wheat flours were explored during the same time when
European verities were under investigation for their chemical and rheological properties
suitable for cookies making quality using SRC profile (Geng et al., 2012). The SRC test were
found useful in development of soft cultivars (genotypes) in China as the tests were able to
identify the water SRC and sucrose SRC to be negatively correlated with the cookies diameter.
The water soluble pentosans and the other sucrose absorbing substituents, if present in flour,
decrease the speediness during baking and so reduce the diameter of biscuits (Zhang et al.,
2007). SRC tests were found successful as quality predictors for comparatively evaluating
physicochemical behaviour of Argentine wheat flours for cookie production (Colombo et al.,
2008).
SRC parameters are equally competent to assess processing activities in baking industries for
example some mixing properties of wheat flour such as dough development time, water
absorption and mixing tolerance index have been correlated with some SRC tests (Ram et al,
2005). SCSRC test that approximately estimates damaged starch is related to a number of
characteristics of wheat kernel, flour dough behaviour and end products. Tempering process is
desired to modify milling properties of kernel and SCSRC values were significantly reduced
when moisture during the tempering is increased (Kweon et al, 2009). The components of flour
obtained from SCSRC may be used to control tempering respective to product type. Adding of
water during tempering will improve flour quality for biscuit, cake and cracker making. SCSRC
values are negatively correlated to the width of the biscuits; less damaged starch is also required
in flour for cracker making. An excellent review has been published recently (Kweon et al,
2011) where SRC value were found very informative in predicting flour functionality in the
processing of wheat based products and also in selection of wheat breeding program.
In the present paper, we have investigated the usefulness of SRC tests in evaluating the baking
performance of Pakistani soft flours for production of biscuits. The SCSRC test particularly
was studied as a qualitative predictor of DS and its relationship to various parameters from
Farinograph, Micro Visco-Amylograph, Glutomatic and Kernelyzer indicating that lengthy
instrumental analysis may be replaced by simple SCSRC for immediate implementation during
processing.
MATERIALS AND METHODS
Flour
Eighteen commercial soft and semi hard wheat flour samples were obtained from two different
flour mills located at Karachi, Pakistan i.e. Masoom Flour Mills (Pvt.) Ltd (coded as M1 - M9)
and Qandhari Flour Mills (Pvt.) Ltd (coded as Q1 - Q9) which are regular suppliers of flour for
English Biscuits Manufacturers (Pvt.) Ltd.
Reagents
All reagents were obtained from Merck (KGaA 64271 Darmstadt, Germany). The 5% sodium
carbonate SRC solution was made (w/w) according to International Method No. 56-11 (AACC,
2000).
European Journal of Food Science and Technology
Vol.4, No.3, pp.52-65, June 2016
___Published by European Centre for Research Training and Development UK (www.eajournals.org)
54
ISSN 2056 - 5798(Print), ISSN 2056 - 5801(online)
Flour moisture
Flour moisture contents were determined with Brabender Moisture Analyzer (Brabander,
Duisburg, Germany) according to International Method No. 44-19 (AACC, 2000). The 9 - 11g
of flour samples were kept at 155°C for 20 min to get constant weight and weight loss is
calculated as moisture percent.
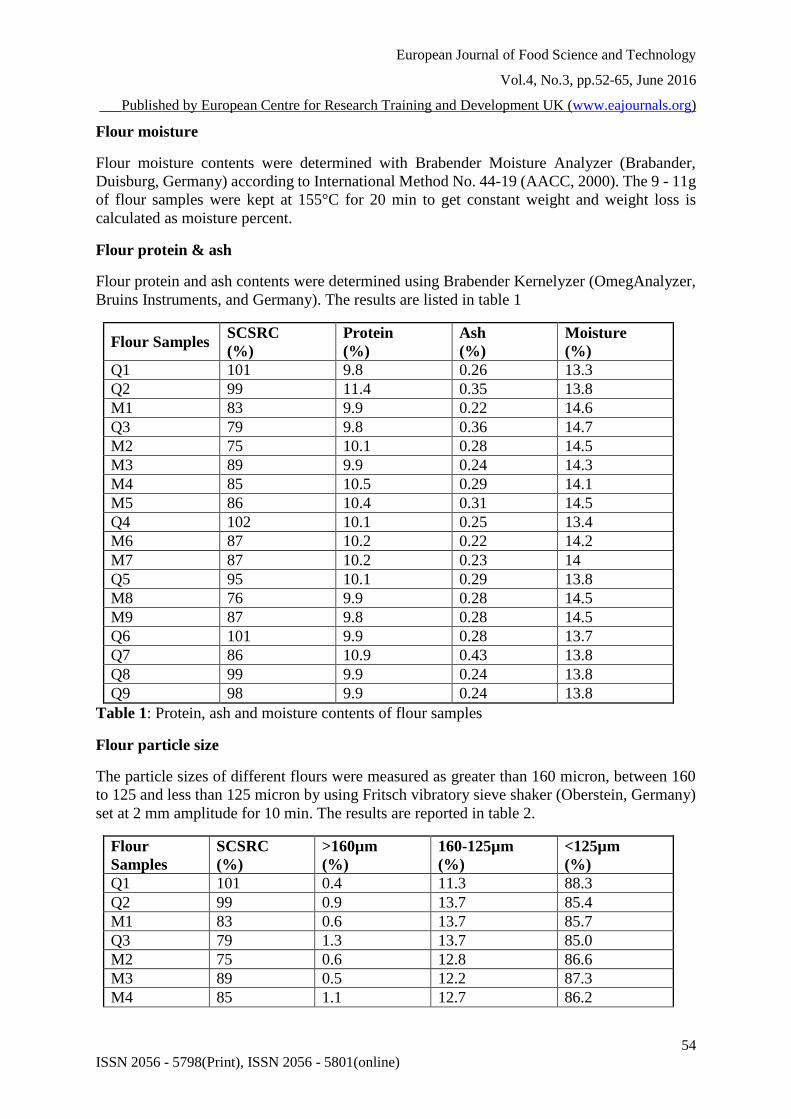
Flour protein & ash
Flour protein and ash contents were determined using Brabender Kernelyzer (OmegAnalyzer,
Bruins Instruments, and Germany). The results are listed in table 1
Flour Samples SCSRC
(%)
Protein
(%)
Ash
(%)
Moisture
(%)
Q1 101 9.8 0.26 13.3
Q2 99 11.4 0.35 13.8
M1 83 9.9 0.22 14.6
Q3 79 9.8 0.36 14.7
M2 75 10.1 0.28 14.5
M3 89 9.9 0.24 14.3
M4 85 10.5 0.29 14.1
M5 86 10.4 0.31 14.5
Q4 102 10.1 0.25 13.4
M6 87 10.2 0.22 14.2
M7 87 10.2 0.23 14
Q5 95 10.1 0.29 13.8
M8 76 9.9 0.28 14.5
M9 87 9.8 0.28 14.5
Q6 101 9.9 0.28 13.7
Q7 86 10.9 0.43 13.8
Q8 99 9.9 0.24 13.8
Q9 98 9.9 0.24 13.8
Table 1: Protein, ash and moisture contents of flour samples
Flour particle size
The particle sizes of different flours were measured as greater than 160 micron, between 160
to 125 and less than 125 micron by using Fritsch vibratory sieve shaker (Oberstein, Germany)
set at 2 mm amplitude for 10 min. The results are reported in table 2.
Flour
Samples
SCSRC
(%)
>160µm
(%)
160-125µm
(%)
<125µm
(%)
Q1 101 0.4 11.3 88.3
Q2 99 0.9 13.7 85.4
M1 83 0.6 13.7 85.7
Q3 79 1.3 13.7 85.0
M2 75 0.6 12.8 86.6
M3 89 0.5 12.2 87.3
M4 85 1.1 12.7 86.2
European Journal of Food Science and Technology
Vol.4, No.3, pp.52-65, June 2016
___Published by European Centre for Research Training and Development UK (www.eajournals.org)
55
ISSN 2056 - 5798(Print), ISSN 2056 - 5801(online)
M5 86 1.3 13.0 85.7
Q4 102 0.5 10.7 88.8
M6 87 0.6 13.0 86.4
M7 87 0.8 13.4 85.8
Q5 95 0.5 12.7 86.8
M8 76 0.6 15.0 84.4
M9 87 0.6 14.5 84.9
Q6 101 0.4 10.2 89.4
Q7 86 0.7 13.7 85.6
Q8 99 0.6 12.8 86.6
Q9 98 0.5 12.5 87.0
Table 2: Particle size characterization of flour samples (greater than 160µm, between 160 to
125µm and less than 125µm)
Glutomatic parameters
The Perten Glutomatic (Huddinge, Sweden) was used to determine the amount and nature of
various flour gluten proteins according to International Method No. 38-12 (AACC, 2000). The
results are reported in table 4.
Flour
Samples
SCSRC
(%)
PG
(%)
RG
(%)
WG
(%) GI
WB
(%)
DG
(%)
Q1 101 6.2 19.9 26.1 76 17.6 8.5
Q2 99 3.6 23.3 26.9 87 18.0 8.9
M1 83 6.2 19.8 25.9 76 17.5 8.4
Q3 79 3.3 20.1 23.4 86 15.8 7.6
M2 75 2.5 21.8 24.3 90 16.1 8.2
M3 89 6.4 19.9 26.3 76 17.8 8.5
M4 85 2.6 23.0 25.6 90 17.4 8.2
M5 86 2.7 22.6 25.3 89 17.0 8.3
Q4 102 5.8 20.4 26.2 78 17.6 8.6
M6 87 3.2 23.1 26.3 88 17.6 8.7
M7 87 2.6 23.3 25.9 90 17.3 8.6
Q5 95 5.9 19.5 25.4 77 16.9 8.5
M8 76 9.4 17.8 27.2 65 18.5 8.7
M9 87 9.0 18.1 27.0 67 18.4 8.6
Q6 101 7.2 18.5 25.7 72 17.2 8.5
Q7 86 6.9 21.4 28.3 76 18.9 9.4
Q8 99 5.7 20.8 26.5 78 17.9 8.6
Q9 98 7.2 20.0 27.2 74 18.4 8.8
Table 4: Relationship of SCSRC to Glutomatic parameters
Farinograph parameters
The rheological properties of dough such as Water absorption (WA), Dough development time
(DDT), Farinograph dough stability (FDS), Degree of softening (DoS) and Farinograph quality
number (FQN) were determined using Brabender Farinograph-E (Duisburg, Germany)
according to International method no 54-21 (AACC, 2000) on 14% moisture basis and 500 ±
20FU (Brabender Unit) consistency that shows the dough strength of the flour. Water

European Journal of Food Science and Technology
Vol.4, No.3, pp.52-65, June 2016
___Published by European Centre for Research Training and Development UK (www.eajournals.org)
56
ISSN 2056 - 5798(Print), ISSN 2056 - 5801(online)
absorption (WA) in Farinograph is calculated from the amount of water required to produce a
dough consistency of 500FU. The results are reported in table 3.
Flour
Samples
SCSRC
(%)
WA
(%)
DDT
(min)
FDS
(min) FQN
DoS
(BU)
Q1 101 62.4 1.9 6.5 85 62
Q2 99 61.6 5.5 6.0 83 80
M1 83 55.9 6.7 9.6 122 52
Q3 79 55.6 2.0 9.1 102 53
M2 75 57.5 7.7 10.3 143 47
M3 89 58.6 1.9 9.1 115 42
M4 85 59.4 6.8 8.6 112 60
M5 86 58.9 6.2 8.1 101 62
Q4 102 62.0 4.3 6.6 88 66
M6 87 58.7 6.0 5.9 103 59
M7 87 58.3 6.8 4.9 125 49
Q5 95 60.8 5.5 6.9 93 68
M8 76 57.4 6.2 7.8 101 61
M9 87 57.8 5.4 7.2 89 69
Q6 101 62.9 1.9 4.8 60 74
Q7 86 60.7 4.7 6.1 81 72
Q8 99 61.8 1.9 5.9 78 67
Q9 98 61.6 5.5 7.1 100 64
Table 3: Farinographic parameters of flour samples verses sodium carbonate SRC
Micro Visco-Amylograph parameters
The gelatinization, various viscosities and pasting properties of flour samples were measured
using Micro Visco-Amylograph (Brabender, Duisburg, Germany) according to International
Method No. 22-12 (AACC, 2000). A sample of 15g (on basis of 14% moisture) was transferred
to the cup and 100 ml of distilled water was added. The slurry formed was heated to 50°C and
stirred at 160 rpm for 10 s for thorough distribution of ingredients. The mixture was then held
at 50°C for 1 min and then heated to 95°C over a period of 7.3 min. The slurry was held at that
temperature for 5 min (holding time for evaluating the pasting strength) and finally the mixture
was cooled to 50°C over a period of 7.7 min. The various viscosities were measured from the
pasting curve and the results are given in table 5.
Flour
Sample
s
SCSR
C
(%)
Beginning of
Gelatinizati
on (°C)
Maximu
m
Viscosity
(MV)
Trough
Viscosit
y
(TV)
Final
Viscosit
y
(FV)
Breakdow
n
Viscosity
(BV =
MV - TV)
Setback
Viscosit
y
(SV =
FV -
TV)
Q1 101 60.1 1083 653 1219 430 566
Q2 99 60.4 1016 595 1104 421 509
M1 83 60.0 1076 730 1303 346 573
Q3 79 60.5 1097 686 1300 411 614
M2 75 60.8 1113 716 1289 397 573
M3 89 61.1 1064 692 1266 372 574

European Journal of Food Science and Technology
Vol.4, No.3, pp.52-65, June 2016
___Published by European Centre for Research Training and Development UK (www.eajournals.org)
57
ISSN 2056 - 5798(Print), ISSN 2056 - 5801(online)
M4 85 60.8 1050 695 1328 355 633
M5 86 60.3 1099 700 1270 399 570
Q4 102 59.9 1046 637 1167 409 530
M6 87 59.9 1067 691 1264 376 573
M7 87 60.1 1112 718 1298 394 580
Q5 95 59.0 1061 666 1257 395 591
M8 76 60.5 1081 679 1225 402 546
M9 87 60.0 1060 679 1258 381 579
Q6 101 59.2 1050 654 1219 396 565
Q7 86 60.4 1058 602 1110 456 508
Q8 99 59.8 1024 668 1255 356 587
Q9 98 60.4 1049 659 1222 390 563
Table 5: Relationship of SCSRC to Micro Visco-Amylograph parameters of flour samples
Sodium carbonate SRC profile
Sodium carbonate SRC profile obtained is based on the International Method No. 56 - 11
(AACC 2000) with some modifications. Flour samples (1g) were suspended in 5% sodium
carbonate to hydrate for 20 min (vortexed for 5 second each at 5, 10, 15, and 20 minutes) and
then centrifuged at 1,000 × g for 15 minutes. The supernatant was decanted and the tube was
drained at a 90° angle for 10 min on a paper towel. Each precipitate obtained was weighed and
the SCSRC value for each sample was calculated according to Haynes et al. (2009) as described
in International Method No. 56 - 11 (AACC, 2000).
All sodium carbonate SRC (SCSRC) analyses were at least performed in triplicate and the
coefficient of variation of the SRC values was less than 2.0%. The results are reported in all
tables from 1-5 for comparison.
Preparation of biscuits
The biscuits were prepared in lab according to International Method No. 10-31B (AACC, 2000)
with some modifications. Flour (228g, corrected to 14% moisture), sodium bicarbonate (3.4g),
mono calcium phosphate (4.1g) and salt (4.5g) were all mixed together in Kenwood chef Mixer
(Model Series: KM001, Kenwood Ltd, Britain). Then shortening (40g) was added to flour and
mixed at speed of 1 for 3 min. then 135g of milk solution (50g milk powder in 450g of distilled
water) was added and mixed again at speed 1 for 15s. The dough was sheet in lab with manual
sheeting unit of 1 mm thickness and the biscuits were cut on ungreased baking sheet through
round cutter having inner diameter as 49mm. the biscuits were baked for 10 min in Nardi lab
oven (Italy) at 230°C.
Evaluation of biscuit quality
The biscuit dimensional qualities were measured, including parameters such as the weight of
8 biscuits, total diameter and total thickness of eight biscuits were recorded as defined in
International Method No. 10-31B (AACC, 2000). The biscuits were picked up at random and
the diameter was measured by turning each biscuit three times at different angles and the mean
of eight biscuits were reported. While the thickness as estimated by stacking method taking the
mean of the height of eight biscuits. The spread factor or the cookies factor is the ratio between
the width (W) and height (H) was calculated according to the method of Colombo et al (2008).
It is used as an indicator of the baking quality of biscuit. The results are reported in table 6.

European Journal of Food Science and Technology
Vol.4, No.3, pp.52-65, June 2016
___Published by European Centre for Research Training and Development UK (www.eajournals.org)
58
ISSN 2056 - 5798(Print), ISSN 2056 - 5801(online)
Flour
Samples
SCSRC
(%)
Dry Weight
(g)
Total
Diameter
(W) (mm)
Total
Thickness
(H) (mm)
Spread
Factor
(W/H)
Q1 101 75 363 60 6.1
Q2 99 61 358 69 5.2
M1 83 62 354 76 4.7
Q3 79 60 357 76 4.7
M2 75 58 346 76 4.6
M3 89 64 368 71 5.2
M4 85 57 374 67 5.6
M5 86 67 359 74 4.9
Q4 102 65 366 71 5.2
M6 87 73 350 79 4.4
M7 87 71 351 82 4.3
Q5 95 65 347 73 4.8
M8 76 72 367 82 4.5
M9 87 80 361 86 4.2
Q6 101 79 366 78 4.7
Q7 86 79 365 81 4.5
Q8 99 74 371 73 5.1
Q9 98 72 366 72 5.1
Table 6: Relationship of sodium carbonate SRC and biscuit end quality parameters
Statistical Analysis:
The data collected were analysed according to standard statistical procedures using Microsoft
Excel (2007). Linear correlation coefficients among different quality factors were determined
through Microsoft Excel (2007) by making scattered graph between data of two different
parameters and finding their R square value (R2) through trend line.
RESULTS & DISCUSSIONS
Physicochemical properties
The flour samples were analysed for their moisture, protein and ash contents as shown in Table
1. A narrow variation range of ash and moisture was observed from 0.22 to 0.36% and 13.3 to
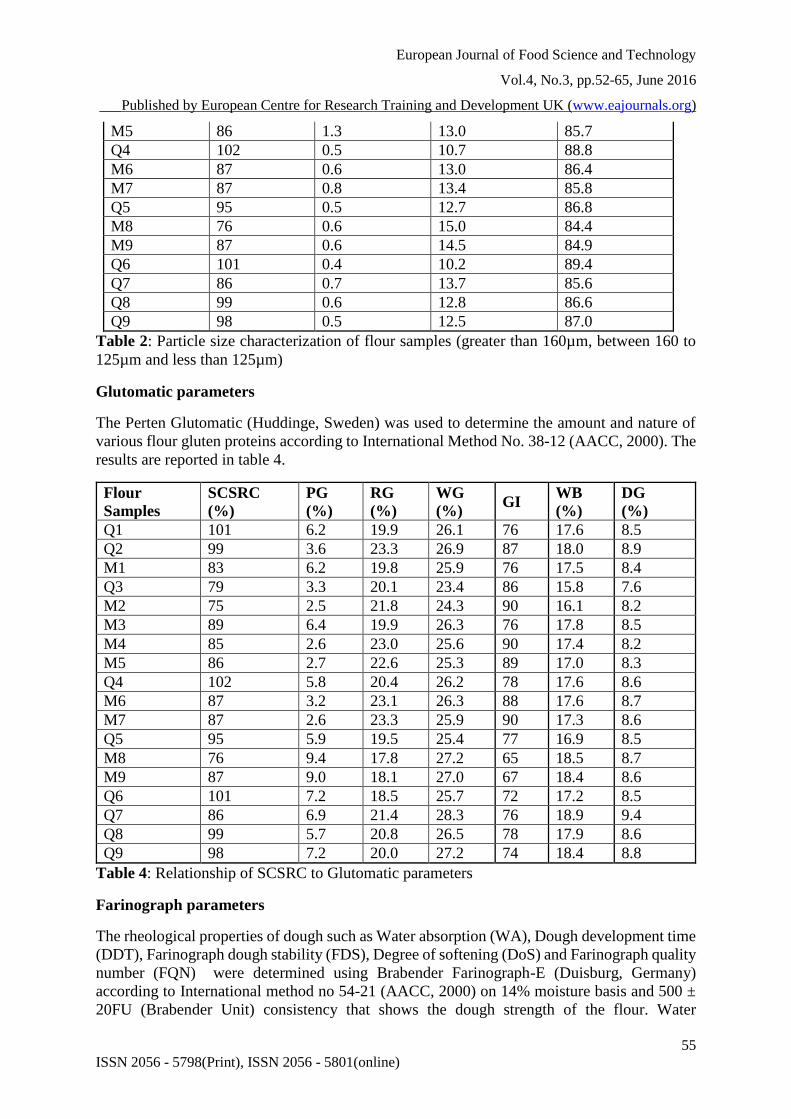
14.7% in the two parameters respectively. A strong but negative correlation was observed
between SCSRC values and the moisture content of the flour as indicated in Figure 1, which is
well expected. It does not represent the water absorbed by the flour or the water absorption as
determined by Farinograph or SRC test that is discussed later on. Higher SCSRC values
indicated higher amount of damaged starch (DS) that will only be produced if moisture in grain
is comparatively less, making the kernel harder. Hard wheat always produce more DS because
it requires more force and pressure for grinding and so yield more DS as compared to DS
produced in soft wheat (Kweon et al, 2009). Millers therefore use tempering in case of hard
wheat processing to make grain softer and to produce soft flour consisting less DS as
particularly desired for production of biscuit, cakes and crackers etc. Protein quality and
European Journal of Food Science and Technology
Vol.4, No.3, pp.52-65, June 2016
___Published by European Centre for Research Training and Development UK (www.eajournals.org)
59
ISSN 2056 - 5798(Print), ISSN 2056 - 5801(online)
quantity i.e. gluten quality may be more related to SCSRC rather than the total quantity of
protein. HMW glutenins which make the grain harder to produce more DS.
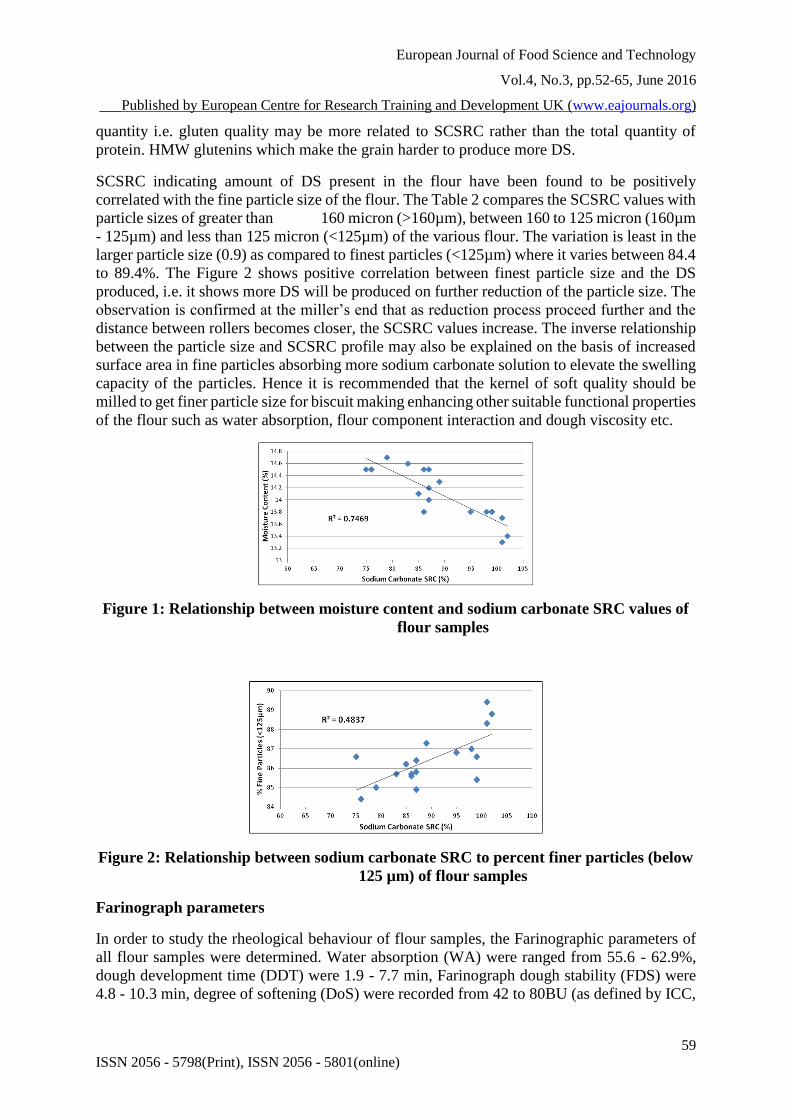
SCSRC indicating amount of DS present in the flour have been found to be positively
correlated with the fine particle size of the flour. The Table 2 compares the SCSRC values with
particle sizes of greater than 160 micron (>160µm), between 160 to 125 micron (160µm
- 125µm) and less than 125 micron (<125µm) of the various flour. The variation is least in the
larger particle size (0.9) as compared to finest particles (<125µm) where it varies between 84.4
to 89.4%. The Figure 2 shows positive correlation between finest particle size and the DS
produced, i.e. it shows more DS will be produced on further reduction of the particle size. The
observation is confirmed at the miller’s end that as reduction process proceed further and the
distance between rollers becomes closer, the SCSRC values increase. The inverse relationship
between the particle size and SCSRC profile may also be explained on the basis of increased
surface area in fine particles absorbing more sodium carbonate solution to elevate the swelling
capacity of the particles. Hence it is recommended that the kernel of soft quality should be
milled to get finer particle size for biscuit making enhancing other suitable functional properties
of the flour such as water absorption, flour component interaction and dough viscosity etc.
Figure 1: Relationship between moisture content and sodium carbonate SRC values of
flour samples
Figure 2: Relationship between sodium carbonate SRC to percent finer particles (below
125 µm) of flour samples
Farinograph parameters
In order to study the rheological behaviour of flour samples, the Farinographic parameters of
all flour samples were determined. Water absorption (WA) were ranged from 55.6 - 62.9%,
dough development time (DDT) were 1.9 - 7.7 min, Farinograph dough stability (FDS) were
4.8 - 10.3 min, degree of softening (DoS) were recorded from 42 to 80BU (as defined by ICC,

European Journal of Food Science and Technology
Vol.4, No.3, pp.52-65, June 2016
___Published by European Centre for Research Training and Development UK (www.eajournals.org)
60
ISSN 2056 - 5798(Print), ISSN 2056 - 5801(online)
12 min after peak time) and Farinograph quality number (FQN) was varied between 60 - 143
(Table 3).
Figure 3: Relationship between sodium carbonate SRC to Farinograph water
absorption of flour samples
Through graphical representations, it is found that of SCSRC and WA are closely interlinked
to each other and the flour with more SCSRC values will have higher WA (Figure 3) as reported
earlier in literature by several scientists (Barrera et al, 2007, Sudha et al, 2007, Ward et al,
2002). The WA determined through Farinograph is a sum of water needed by all hydrophilic
components of flour while sodium carbonate SRC mainly represents the solution needed due
to damaged starch (DS) content of flour. The reason for wide variation in the amount of DS in
flour samples may be attributed to initial moisture present in the kernel, amount of tempering
water, temperature of the tempering water and process of reduction during milling. DS content
or the SCSRC values also vary because of the total quality and type of proteins present in the
flour. The flour will low WA is preferred for biscuit processing as it spreads more during
baking producing large diameter. The DDT, FDS and FQN are inversely related to SCSRC
values as shown in Figure 4-A, B & C respectively, these values may be attributed to rise in
WA with increase in SCSRC values shown in Figure 3. Dough will naturally take longer time
to develop in presence of less water (less DS) as shown by lower SCSRC values. Higher DDT
may be explained on the basis of more mixing time required to distribute the water absorbed
uniformly. Farinograph dough stability will also decrease with increase in DS because more
water will be taken by DS to produce sticky dough, while less water will be available for
glutenins to make strong network and dough will get sticky. Similar behaviour of dough is
shown while comparing the FQN values with SCSRC (Figure 4-C). FQN shows the strength
of flour and differentiate between hard to soft flour, so FQN will decrease with rise in DS.
However the DoS is positively correlated with DS (Figure 4-D) as dough gets soft with increase
in the amount of DS.

European Journal of Food Science and Technology
Vol.4, No.3, pp.52-65, June 2016
___Published by European Centre for Research Training and Development UK (www.eajournals.org)
61
ISSN 2056 - 5798(Print), ISSN 2056 - 5801(online)
Figure 4: Relationships of sodium carbonate SRC to dough development time (A),
Farinograph dough stability (B), Farinograph quality number (C) and
degree of softening (D).
Glutomatic parameters
The Glutomatic parameters were also evaluated to find the relations of SCSRC to passed gluten
(PG), retained gluten (RG), wet gluten (WG), dry gluten (DG), water binding (WB) and gluten
index (GI) (Table 4). The gluten indexes of flour samples were ranged from 65 to 90 and dry
gluten was 7.6 to 9.4 percent of flour weight. The relationships of various proteins as
determined by Glutomatic, although, were not expected to be associated with SCSRC because
damaged starch is not measured through Glutomatic. However the test was performed to
evaluate the covalent linkages between starch and gluten proteins which on damage to starch
molecules during milling may effect the passage of starch bound proteins through the sieves.
Micro Visco-Amylograph parameters
The Micro Visco-Amylograph parameters were also investigated to understand the relationship
of SCSRC to various viscosities, gelatinization and pasting properties of flour inherent starches
(Table 5). Beginning of gelatinization temperature was found less with higher values of SCSRC

European Journal of Food Science and Technology
Vol.4, No.3, pp.52-65, June 2016
___Published by European Centre for Research Training and Development UK (www.eajournals.org)
62
ISSN 2056 - 5798(Print), ISSN 2056 - 5801(online)
(Figure 5). It indicates that the higher content of damaged starches i.e. higher SCSRC values
cause the starch to gelatinization at lower temperatures.
Figure 5: Relationship of sodium carbonate SRC to Beginning of gelatinization
temperature of flour samples determined through Micro Visco-
Amylograph.
Figure 6: Relationships of SCSRC to maximum viscosity (A), trough viscosity (B) and
final viscosity (C) of the flour samples

European Journal of Food Science and Technology
Vol.4, No.3, pp.52-65, June 2016
___Published by European Centre for Research Training and Development UK (www.eajournals.org)
63
ISSN 2056 - 5798(Print), ISSN 2056 - 5801(online)
The relationship of rising damaged starch or high SCSRC values found with maximum
viscosity (MV), trough viscosity (TV) and final viscosity (FV) were all found to be negatively
correlated. MV shows holding strength at highest temperature (95°C) which decreases with
rise in the amount of DS (Figure 6-A, B & C). No relation was found with breakdown (BV)
and setback (SV) viscosities indicating less interaction of DS with water molecules, also water
holding capacity of DS is decreased.
Baking evaluation of performance
The biscuits were baked as per method defined earlier, the group of eight biscuits of all flour
samples had total diameter between 346 - 374mm, total thickness between 60 to 86mm and
total weight varied from 56.8 to 80.1g (Table 6). No relation of sodium carbonate SRC values
were found to biscuit quality parameters, but slight relation was observed with total thickness
of biscuits (Figure 7). The relation revealed that the higher sodium carbonate SRC values leads
to decrease in thickness of biscuits.
Figure 7: Relationship of sodium carbonate SRC to thickness of the biscuits made from
flour samples
The spread factor or cookie factor was found to be related to sodium carbonate SRC values
(Figure 8). The cookies factor represents the ratio between width and height of four cookies
picked at random is related to SCSRC values and increase with DS as reported earlier.
Figure 8: Relationship of sodium carbonate SRC to spread factor (ratio between width
and height) of the biscuits
Implication to Research and Practice:
The implication of present research will generate a meaningful coordination between millers
and processors to consider SRC analysis as criteria for flour quality. SRC test being very

European Journal of Food Science and Technology
Vol.4, No.3, pp.52-65, June 2016
___Published by European Centre for Research Training and Development UK (www.eajournals.org)
64
ISSN 2056 - 5798(Print), ISSN 2056 - 5801(online)
economical will be implemented at the milling units where expensive instruments are not
acceptable especially in under developed countries.
CONCLUSION
The studies have revealed that SCSRC test may be used in place of Farinograph to give water
absorption; secondly SCSRC is a useful predictor of the quality of flour to identify the
dimensional properties of biscuit. For example, the range of SRC values will forecast the
diameter and thickness of the biscuit in a particular recipe. The hydrophilicity of DS will slow
the WA by other molecules. Water acts as the plasticizer in dough development, so water
uptake by other components will affect dough rheology and end quality (Hasan etal. 2013). It
seems that SCSRC test alone may play key role in evaluation and controlling the quality of
flour desirable for biscuit making.
Future Research
Problem shooting as a result of compositional variations in flour are very common at various
bakery industries. Seasonal changes in wheat kernels are bound to occur and unavoidable. The
future research will produce solutions by relating chemical properties as cause of problem
shooting and how to modify four accordingly.
Acknowledgment
The authors take this opportunity to thank English Biscuit Manufacturers (Private) Limited
(EBM) for all the financial support and special thanks are due to Dr. Zeelaf Munir and Ms.
Saadia Naveed for their encouragement. We would also like to thank the staff at Centre of
Excellence, EBM for their technical assistance.
REFERENCES
AACC, 2000. Approved Methods of American Association of Cereal Chemists, 10th ed. The
Association, St. Paul, MN, USA.
Ali, R., Khan, M. S., Sayeed, S. A., Ahmed, R., Saeed, S. M. G., Mobin, L., (2014).
Relationship of damaged starch with some physicochemical parameters in assessment
of wheat flour quality. Pakistan Journal of Botany, 46(6): 2217-2225.
Barrera, G. N., Perez, G. T., Ribotta, P. D., Leon, A. E., (2007). Influence of damaged starch
on cookie and bread making quality. Eur Food Res Technol, 225, 1-7.
Colombo, A., Pérez, G. T., Ribotta, P. D., & León, A. E. (2008). A comparative study of
physicochemical tests for quality prediction of Argentine wheat flours used as corrector
flours and for cookie production. Journal of Cereal Science, 48, 775e780.
Duyvejonck, E. A., Lagrain, B., Dornez, E., Delcour, J. A., & Courtin, C. M. (2012).
Suitability of solvent retention capacity tests to assess the cookie and bread making
quality of European wheat flours. LWT - Food Science and Technology, 47, 56-63.
Duyvejonck, E. A., Lagrain, B., Pareyt, B., Courtin, C. M., & Delcour, J. A. (2011). Relative
contribution of wheat flour constituents to solvent retention capacity profiles of
European wheat. Journal of Cereal Science, 53, 312e318.

European Journal of Food Science and Technology
Vol.4, No.3, pp.52-65, June 2016
___Published by European Centre for Research Training and Development UK (www.eajournals.org)
65
ISSN 2056 - 5798(Print), ISSN 2056 - 5801(online)
Gaines, C. S. (2004). Prediction of sugar-snap cookie diameter using sucrose solvent
retention capacity, milling softness and flour protein content. Cereal Chemistry, 81 (4),
549–552.
Geng, Z., Zhang, P., Yao, J., Yang, D., Ma, H., & Rayas-Duarte, P. (2012). Physicochemical
and Rheological Properties of Chinese Soft Wheat Flours and Their Relationships with
Cookie-Making Quality. Cereal Chemistry, 89 (5), 237-241.
Kweon, M., Martin, R., & Souza, E. (2009). Effect of Tempering Conditions on Milling
Performance and Flour Functionality. Cereal Science, 86 (1), 12-17.
Kweon, M., Slade, L., & Levine H. (2011). Solvent Retention Capacity (SRC) Testing of
Wheat Flour: Principles and Value in Predicting Flour Functionality in Different
Wheat-Based Food Processes and in Wheat Breeding - A Review. Cereal Chemistry, 88
(6), 537-552.
Ram, S., Dawar, V., Singh, R. P., & Shoran, J. (2005). Application of solvent retention
capacity tests for the prediction of mixing properties of wheat flour. Journal of Cereal
Science, 42, 261–266.
Slade, L., & Levine, H. (1994). Structureefunction relationships of cookie and cracker
ingredients. In H. Faridi (Ed.), The science of cookie and cracker production (pp.
23e141). New York, NY, USA: Chapman & Hall.
Sudha, M., Vetrimani, R., & Leelavathi, K. (2007). Influence of fiber from different cereals
on the rheological characteristics of wheat flour dough and on biscuit quality. Food
Chemistry, 100, 1365-1370.
Ward, F. M., & Andon, S. A., (2002). Hydrocolloids as film formers, adhesives and gelling
agents for bakery and cereal products. Cereal foods World, 47, 52-55.
Zhang, Q., Zhang, Y., Zhang, Y., He, Z., & Pena, R. J. (2007). Effects of solvent retention
capacities, pentosans content, and dough rheological properties on sugar snap cookie
quality in Chinese soft wheat genotypes. Crop Science, 47, 656e664.


![DESIGN of Sodium Carbonate PRODUCTION PLANT[Comprehensive Design Project]](https://img.dokumen.tips/doc/110x75/577c7ef31a28abe054a2afd4/design-of-sodium-carbonate-production-plantcomprehensive-design-project.jpg)