Embed Size (px)
Citation preview

Relationship Lending in Shadow Banking:
Impacts of Financial Firms’ Cross-Holding Relation
in Money Market Funds
Ai He∗
Emory University
First Version: August 2016
Current Version: September 2017
∗Ai He is a doctoral student in Finance at the Goizueta Business School, Emory University, Atlanta, GA 30322,USA; e-mail: [email protected]. I especially thank Grace Xing Hu for sharing a novel money market fundsdataset with me. I am grateful to Jennifer Dlugosz, Clifton Green, Narasimhan Jegadeesh, and Guofu Zhou fortheir encouragement and insightful comments. I am also thankful for suggestions from and discussions with ChandraSekhar Mangipudi and Cong Wang. I appreciate Raunaq Pungaliya (discussant), Yeguang Chi (discussant), UrsulaWiriadinata (discussant), and conference participants at the 29th Australasian Finance and Banking Conference andPhd Forum, and the London Business School’s 2017 Trans-Atlantic Doctoral Conference for helpful comments andsuggestions. Any remaining errors are my own.

Relationship Lending in Shadow Banking: Impacts of FinancialFirms’ Cross-Holding Relation in Money Market Funds
Abstract
This paper explores the nature and impacts of shadow banks’ relationship lending
by analyzing bilateral-connected financial firms who crossly hold each other’s debt
through their own affiliated money market funds (MMFs). Using novel MMFs’
monthly holdings data, I show that, in the context of 2011 Eurozone crisis, non-
European financial firms surprisingly increased their MMFs’ stakes on bilateral-
connected European financial firms, while MMFs generally reduced their exposure
to European issuers. I provide evidences that this bias represents reciprocity between
the bilateral-connected financial firms. In return, the European financial firms, through
their affiliated MMFs, accepted more insecure debt than secure ones from their non-
European partners during the same period. Issuer- or fund-characteristics do not
explain the results. A further investigation shows that the cross-holding relation affects
also issuers unconnected with MMFs, because they are unable to raise money from
new funds in a short time after their old lenders cut off the financing.
JEL classifications: G21, G32, G10, G14
Keywords: Shadow Banking, Financial Crisis, Relationship Lending, Money Market
Funds
1

1. Introduction
Relationship lending provided by financial intermediaries is one of the central issues in banking,
and has been extensively studied in the context of traditional banks to their borrowers (see, e.g.
Bharath et al., 2007; Bolton et al., 2016; Prilmeier, 2017). However, little attention has been paid
to relationship lending provided by non-bank financial intermediaries. These “shadow banks”
include the U.S. prime money market mutual funds (MMFs) that, with $1.7 trillion in assets
under management in 2011, provide important source of short-term financing for both financial
and nonfinancial firms. Chernenko and Sunderam (2014) show there are economically significant
frictions in the MMFs market. Although they do investigate relationship lending, they examine
it from only the lending perspective. Based on four proxies of long-term relation strength, they
find that leaders cut their lending more sharply to issuers with whom they have weak relationships
during the 2011 Euro crisis period.
In this paper, I study further relationship lending in shadow banking, especially in the MMFs
market. Given its size and importance, the MMFs market provides a good setting to study
relationship lending by non-bank financial intermediaries. Unlike the previous study of Chernenko
and Sunderam (2014), I identify the relation directly based on bilateral-connected holdings of each
other’s securities. This is clearly more precise than using proxies in general.
When Financial firms play in the MMFs market as both money market instruments’ issuers
and funds’ sponsors, they are able to crossly hold each other’s money market instruments through
affiliated MMFs. Therefore, a cross-holding relation is established by this bilateral bonding. Here,
following the assumption in recent literature (e.g., Kacperczyk and Schnabl, 2013) that a financial
firm can set its MMF’s risk, I treat a financial firm as a unity uniting its affiliated MMFs and
issuers.1.
To study how relation lending matters, endogeneity is a critical concern. MMFs’ higher
1Other studies in different empirical settings also jointly consider a financial institutions’ different departments.See, for example, Ritter and Zhang (2007),Massa and Rehman (2008),Ivashina and Sun (2011).
1

exposure to their bilaterally-connected issuers may also be the result of an endogenous decision
associated with these issuers’ good creditworthiness. Following Chernenko and Sunderam (2014),
among others, I apply the time window in the summer of 2011 to address this endogenous concern.
Securities held by MMFs are supposed to be high-liquidity and short-term public debt. But in
mid-2011, after Moody’s put several European banks under downgrade review, investors suddenly
lost their trust in the creditworthiness of European borrowers, and MMFs with high exposure to
European borrowers suffered large outflows. This shock on a group of money market instruments
issuers creates an ideal laboratory environment for my study. In this short special period, money
market instruments issued by European financial firms were generally viewed as risky, and hence
differences in MMFs’ stakes on different European financial firms should be independent of these
firms’ creditworthiness. The endogeneity issue may be still of concern if issuers with different
levels of creditworthiness were not equally affected by the Moody’s downgrade review. This
concern is largely addressed given the novel MMFs data, which allows the control for time-varying
variables and fixed effects from both the issuer side and the fund side.
I investigate three distinctive questions from literature. First, I examine whether MMFs
exposures to bilaterally-connected issuers and to unconnected European ones between the pre-
and the post-period are different. With a standard univariate analysis, I find that, if a European
issuer is bilaterally connected with a fund, the fund’s exposure to this connected partner increases
by 0.35% measured in portfolio weights after the Eurozone crisis. In contrast, the fund’s portfolio
weight on every other unconnected European issuer drops by 0.23%. Economically, it means an
average U.S. MMF financed every connected European partner $29.58 million more, but it cuts
off $19.66 million in lending to every other European borrower after mid-2011. These results are
robust to multivariate tests using difference-in-differences models with the control of issuer and
fund characteristics.
My data of fund-issuer pairs allow me to control for variates and fixed effects at both the
issuer-level and the fund-level, ensuring that MMFs’ bias in connected issuers is not simply a
mirror of the impacts from some observable or unobservable features on a certain issuer or a
2

certain fund. Based multivariate regressions that hold the issuer fixed, I find that, after Moody’s
review, MMFs finance less to unconnected European issuers, but lend more to their bilaterally-
connected European partners. Likewise, holding fixed the MMF, I find that European issuers
receive more finance support from the MMFs belonging to their bilaterally-connected financial
firms. Particularly, although issuers who can build a cross-holding relation with MMFs must
be conglomerates owning MMFs, My main findings are robust after controlling issuer types.
Therefore, the results are unlikely to be driven by the “too big to fail” phenomenon. A broader
comparison including non-European issuers proves further that the findings are not driven by some
unobservable changes on all bilaterally-connected fund-issuer pairs.
Moreover, in a comparison of different riskiness proxies across all fund-issuer pairs, I do not
find any evidence showing that securities issued by MMFs’ bilaterally-connected European issuers
are less risky than MMFs’ other holdings after mid-2011. The results are robust after controlling
the issuer-fixed effect and the fund- fixed effect. Therefore, MMFs’ holding bias on connected
issuers is unlikely to be driven by differences in money market instruments’ riskiness.
Second, I examine why there is the MMFs’ bias towards bilaterally-connected issuers, and find
reciprocity. To be specific, I analyze the reverse fund-issuer pairs of the bilateral connection. For
each fund-issuer pair, the fund belongs to a European financial firm and money market instruments
issued by this firm are simultaneously held by the issuer’ affiliated MMFs. Testing with difference-
in-difference regressions, I show that the Holding Risk – a risk measure proposed by Kacperczyk
and Schnabl (2013) which is the difference in portfolio weights of insecure and secure securities
– significantly increases by 10.85-14.26 basis points in reverse pairs than in any other fund-issuer
pairs during the post-period. This is a direct evidence of reciprocity between connected financial
firms: a European financial firm, through its affiliated MMFs, accept more insecure debt issued
by its connected partner. I interpret it as a compensation for these partners’ help of increasing
their MMFs’ stakes in the European financial firms. In return for this help, European partner’s
affiliated MMFs are willing to hold their bilaterally-connected partners’ low-quality debt, which
are unpopular in the MMFs market. Note that the reciprocity I document also offers a partial
3

explanation to the earlier finding of Chernenko and Sunderam (2014) that leaders cut their lending
more sharply to issuers with weak relationships.
Third, I examine how the cross-holding relationship may indirectly affect other issuers who also
borrow money from the same MMFs involved in the relationship with European firms. Funds only
have limited capital on hand, especially after mid-2011 when many of them suffered significant net
outflows. If a MMF decides to increase its stake on one issuer, it has to cut off financing to some
other issuers. In a market where relationship-based lending is prevalent, the other issuers may
have difficulties to borrow money from other lenders in a short period of time due to the lack of
a relationship. In my sample, more than half of money market instrument are hold by MMFs that
are involved in the bilateral relationship with European firms before mid-2011. According to a test
of the spillover effect, if these MMFs cut off financing to unconnected issuers in the post-period,
these issuers are prone to have trouble borrowing money from other MMFs.
My study links to different strands of literature. It contributes to studies in credit supply
of financial intermediaries. Relationship-based lending has long been discussed in the banking
literature (e.g., Boot, 2000; Bharath et al., 2007; Bolton et al., 2016), including an increasing
attention to shadow banking. “Relationship” is commonly mentioned as a general term, and the
relationship mechanism is measured by proxies based on prior lending activities rather than being
detected directly. This paper documents an important channel that financial institutions use to
build relationship. In this mechanism, relationship lending can be directly tested, and motivations
behind it can also be clearly explained. I also add to the findings of Chernenko and Sunderam
(2014) who apply the same empirical setting of MMFs and the same shock of the 2011 Eurozone
crisis, and find non-European issuers relying on funds exposed to Eurozone banks raised less short-
term debt financing because of frictions. The cross-holding relationship identified in this paper is
one important source creating frictions in shadow banking.
This paper also relates to literature of the conflict of interests (see Mehran and Stulz (2007)
for a summary), especially those concerning connections between different divisions of financial
4

conglomerates. For example, Ritter and Zhang (2007) find that investment banks allocates their
underwritten hot IPOs to their affiliated funds to boost funds’ performance and thus attract
more money; Massa and Rehman (2008) show that funds increase their stakes in the firms that
borrow from their affiliated banks in the period following the deal; Ivashina and Sun (2011)
find that institutional participants in loan renegotiations subsequently trade in the stock of the
same company. While these papers are about financial institutions’ two different divisions in two
markets, this paper is about them in the same market.
In addition, my paper belongs to the growing literature in recent years on MMFs’ yield-
reaching behavior. Kacperczyk and Schnabl (2013) initiate this line of research by documenting
that MMFs whose sponsors concern more on reputations take fewer risks. Chodorow-Reich (2014)
links “reaching for yield” to MMFs’ heterogeneity in administrative cost, and Di Maggio and
Kacperczyk (2017) relate “reaching for yield” to the macro environment with the zero-bound
interest rate. Other recent research in MMFs studies influences of sponsor support (Parlatore
(2016)) and tournament motivation of fund managers (La Spada (2014)).
The rest of the paper proceeds as follows. Section 2 provides the background information and
develops three main testing hypotheses. Section 3 describes the data. Section 4 explains how
financial firms are bilaterally connected through the cross-holding relation in MMFs. Section 5
analyzes the impact of this cross-holding relation on MMFs lending behavior. Section 6 explores
the potential reasons. Section 7 extends the discussion to spillover effects. Section 8 concludes.
2. Background and Hypothesis Development
This section explains financial firms’ bilateral connections in the MMFs market, reviews the
Eurozone crisis, and develops hypotheses that will be tested.
5

2.1 Financial Firms’ Bilateral Connection in the U.S. MMFs Market
The money market is where financial instruments with high liquidity and very short maturities are
traded. Money market funds offer baskets of these instruments, which are normally considered to
be safe, to institutional and individual investors. Unlike other mutual funds, money market funds
are allowed by the SEC’s Rule 2a-7 to use the amortized cost pricing method to keep a constant $1
per share NAV. Because they provide investors a stable asset value and cash on demand, they have
always been viewed as safe as cash until the 2008 crisis when money market funds experienced
extraordinary stresses originated from defaults of some short-term debt in their portfolio holdings.
To improve money market funds’ financial stability, a number of substantial reforms by the SEC
were adapted in 2010 and 2014 (see, e.g. Gallagher et al., 2015b; Hanson et al., 2015).
One important reform is that funds must report their portfolio details by filing form N-MFP
every month. The SEC’s N-MFP form classifies all U.S. money market funds into five categories:
prime, treasury, government/agency, single state fund and other tax exempt fund. The abbreviation
“MMFs” in this paper refers to prime money market funds because they mainly invest in non-
government securities.
As shown in Figure 1, multiples roles are played by different financial firms in the MMFs
market: some, such as American Century Investment and Waddell & Reed Financial, only stand
on the fund side and sponsor MMFs; some, such as Barclays and RBS, stand on the issuer side only
and issue different money market instruments; the rest of the few, such as JP Morgan and UBS,
stand on both the fund and the issuer sides: under the umbrella of one financial conglomerate,
affiliated MMFs provide funding to other money market instruments issuers, meanwhile, affiliated
investment banks or security companies receive funding from other MMFs. This market also
involves a small group of non-financial institutions: the U.S. government, who is the issuer of
Treasuries, agencies or municipals who issue agency or municipal debt, and non-financial firms,
whose non-financial commercial papers, account for a very small proportion in MMFs’ portfolio
holdings.
6

Serving the dual roles of both the fund and the issuer provides two financial firms opportunities
to establish bilateral connections. For example, as shown in Figure 2, through its affiliated MMF,
JP Morgan can hold short-term money market instruments issued by UBS’s banking department;
meanwhile, UBS’s affiliated MMF can also hold short-term money market instruments issued by
JP Morgan’s banking department.
Here, I assume the financial institution unites its affiliated MMFs and issuers as a unity. This
assumption is plausible: on the one hand, MMFs and issuers under the same umbrella serve
respectively as channels of capital outflows and inflows in the MMFs market for the financial
institution; on the other hand, a financial firm sets its MMFs’ risk based on its overall benefits
instead of funds’ individual interests, one evidence is the conglomerate effect in Kacperczyk and
Schnabl (2013) which says conglomerate sponsors will let MMFs take less risk even though their
MMFs business is small, because they concern about spillover effects of MMFs’ collapses on
firms’ other businesses. I also follow their assumption that a fund sponsor can set its funds’ risk
to abstract from the agency problem between financial firms and their affiliated MMFs’ managers
given: (1) risk limits in building portfolios and little space for manager skills in choosing securities,
(2) MMFs’ dependence on voluntary sponsor support to maintain a stable NAV (Brady et al., 2012;
Parlatore, 2016).
2.2 The Eurozone Crisis in 2011
Since the 2008 crisis, MMFs experienced their most rapid period of outflows during the Eurozone
crisis of 2011. This crisis’s cause can be traced back to 2009, when Greece’s sovereign debt
were revealed to be massively understated because of accounting issues. Investors’ panic was
driven by concerns of Greece’s and some other European countries’ high defaults chance, and
soon spread out. The other concern was about solvency of Eurozone banks, who not only were
exposed to Eurozone economy but also held a large amount of sovereign debt from countries in
trouble. On June 13, Standard and Poor’s downgraded Greek sovereign debt to CCC and, on June
7

15th, Moody’s placed large French banks BNP Paribas, Credit Agricole, and Societe Generale
on review for possible downgrade because of these banks’ exposures to Greece. Although the
European Central Bank (ECB) approved financing bailout plan for Greece on July 2, on July 5,
Moody’s downgraded Portuguese sovereign debt to “junk” status, followed by a similar downgrade
of Ireland on July 12. On July 21, the ECB approved a second rescue package for Greece, but
concerns of contagion kept spread until cover much of the European continent. As a result, CDS
premiums on banks in core European countries rose markedly.
This series of events created a big shock to European financial institutions’ creditworthiness in
that summer. The concern of these financial institutions’ credit quality motivated U.S. investors
to redeem from MMFs with high exposure to Eurozone risk. From June to July of 2011, prime
MMFs lost roughly $113 billion as outflows (Gallagher et al., 2015a); and by the end of August
2011, the assets under their management declined by 11% (Chernenko and Sunderam, 2014). In
the face of large redemptions, U.S. MMFs sharply reduced their investments in Eurozone banks.
2.3 Hypothese Development
My hypotheses concern the cross-holding relation described in Figure 2. My interest is whether and
how this bilateral bonding plays against the independence rule in arm’s length financing. However,
the bilateral connection and an issuer’s characteristics, especially its creditworthiness, could be
endogenously correlated, so it is ambiguous to simply conduct a direct test.
The time window around the Eurozone crisis in June, 2011 creates a laboratory environment
for the test. Money market instruments issued in Europe, which had been considered to be safe,
were suddenly under the shadow of investors’ doubt. Following this fact is an intuitive question: is
there any difference between a financial firm’s lending to its bilaterally-connected and unconnected
Eurozone issuers after this downgrade shock? Using the start of June 2011 as a breakpoint, I follow
Chernenko and Sunderam (2014) to separate the entire sample into two symmetric parts: March-
May and June-August 2011, which respectively represent the pre- and post-periods of Moody’s
8

grading reviews on European banks. Compared to the standard arm’s length financing, in which
lenders and borrowers are absolutely independent from each other, in the case when two financial
firms crossly hold each other’s debt, there is reciprocity existing in this relationship. The bilateral
bonding motivates a MMF’s sponsor to offer help to its connected European partner who found
it difficult to borrow money from other MMFs after Moody’s review; and also, this implicit
commitment would be beneficial to the sponsor.
Chernenko and Sunderam (2014) show that MMFs with greater exposure to Eurozone banks
suffer greater outflows after June, 2011. Thus, if following rules of fully arm’s length lending,
MMFs should have decreased their exposure to all European debt so that they would not intensify
further investor redemptions; in other words, European issuers would have seen universal decline
in MMFs’ funding due to investors’ continuous concern. However, under an alternative hypothesis
that financial firms’ cross-holding relation in the MMFs market creates a channel of relationship
lending, a MMF might treat Eurozone issuers bilaterally connected with its sponsors differently
than other Eurozone issuers. Whether or not having this bilateral connection with a MMF matters
to an Eurozone issuer whose securities are generally less likely be held by MMFs after the Eurzone
crisis. As shown in Figure 4, J.P. Morgan’s MMFs would treat Deutsche Bank and RBS who both
issue money market instruments differently.
Hypothesis One. The changes of MMFs’ exposure to bilaterally-connected and unconnected
European issuers between the pre- and the post-period are different.
This hypothesis should emphasize the control of the issuer-fixed effect and the fund- fixed
effect, in case of the endogenous concern, which says MMFs (issuers) bilaterally connected with
issuers (MMFs) are different from other MMFs (issuers) by nature, drives the difference in lending
between the pre- and post-periods. To be specific, after the Eurozone crisis: (1) the funding a
given Eurozone financial firm receives from MMFs would be different depending on its bilateral
connection with MMFs; (2) a given MMF’s portfolio weights on European issuers would be
different depending on its bilateral connection with issuers.
9

Second, I study why financial firms commit to relationship lending in the MMFs market.
I directly investigate whether MMFs’ bias towards bilaterally-connected issuers is driven by
reciprocity.
Given the nature that two parties involved in the cross-holding relationship have stakes in each
other, it is very likely that reciprocity is reflected in securities that are issued to each other. As
shown in Figure 5, when J.P. Morgan’s MMFs tilt their portfolio weight to Deutsche Bank, money
market instruments issued by J.P. Morgan to Deutsche Bank’s MMFs could also be different from
other money market instruments. This possibility gives rise to my second hypothesis:
Hypothesis Two. Comparing to other holdings in same portfolios of European financial firms’
MMFs, securities issued by their bilaterally-connected financial firms are different in the post-
period than in the pre-period.
Here is the implication of this hypothesis. For two connected financial firms in my empirical
setting, when the one in Europe has difficulty borrowing money after mid-2011, the reason why the
other one is willing to help is that the European side should provide some benefits to compensate its
connected partner, which is reflected in the portfolio holdings of European financial firms’ MMFs.
3. Data and Summary Statistics
I collect data from different sources. I have a novel dataset based on the SEC form N-MFP, which
all U.S. money market funds are required to report each month since November 2010.2 N-MFP
forms provide information on three levels: 1) fund-level data on gross yields, TNAs, maturities,
advisors, etc.; 2) class-level data on Nasdaq tickers, net yields, shareholder flow activities (gross
subscription and gross redemption) etc.; 3) holdings-level data on each security’s issuer, yield,
maturity date, value, maturity, type etc. The detailed classification of different types of securities
can be found in the Appendix A. This novel dataset covers the period from November 2010 to
2SEC requires funds to file N-MFP within five business day after each month ends, but forms would not be publiclyavailable until 60 days after. The same data are used by Chernenko and Sunderam (2014) and Hu et al. (2015)
10

August 2013.
N-MFP forms classify MMFs into five categories: “prime”, “treasury”, “government/agency”,
“single state fund” and “other tax exempt fund”. My focus is prime MMFs because they are major
MMFs investing in non-government securities. In addition, I filtered out 35 feeder funds that make
almost all of their investments through master funds.
More fund information is complemented with the CRSP Mutual Fund Database. 89.34% of
N-MFP class-level observations are able to be linked to CRSP,3 which gives class-level expense
ratios, types (institutional or retail), ages, etc. The study is conducted on the fund- series level so
that all class-level characteristics (e.g. net yield, age, expense ratio) are finally aggregated to the
fund level weighted by values of class assets.
MMFs do not follow a uniform standard to report fund names and securities’ issuer names in
N-MFP forms. To clear up this messy information, I search these names in Factset and Bloomberg
to get funds’ and issuers’ formal names and headquarter locations. For MMFs, I also double check
with SEC form N-SAR about their sponsors’ names.
Lastly, I collect European issuers’ CDS information from the Markit CDS pricing database as
a control measure of European borrowers’ credit risk. Throughout this paper I use five-year CDS
rates measured in USD and with the “Modified-Modified” restructuring clause.4
The final sample covers 345 financial firms. Figure 3 shows how funds and issuers are
distributed among these financial firms. From the last stacked columns in all the four panels,
we can see that, in total, there are 90 financial firms sponsoring funds and 299 financial firms
issuing money market instruments. The two sides’ overlapping are 43 financial firms serving dual
roles, their names are listed in the Appendix B. The fund-side financial firms own a total of 264
unique MMFs, which together manage $1.76 trillion in assets every month during my sample
period. Although only less than half of financial firms on the fund side serve dual roles, they
3I match N-MFP data with CRSP Mutual Fund Database by Nasdaq tickers first; then I manually match the restwhose Nasdaq tickers are wrong or missing in N-MFP by checking class names and fund advisor names.
4For those issuers only showing CDS rates in Euro in the Markit database, I convert the Euro CDS rates to USDones using real-time exchange rates.
11

sponsor almost two thirds of MMFs, and their total AUM occupy more than 88% of all MMFs’
AUM. The issuer-side financial firms issue securities with a monthly total value of $1.27 trillion.
About 15% of financial firms on the issuer side are also fund sponsors; securities issued by them
account for 32% in value of all issued securities in the MMFs market. These facts indicate that, no
matter on the fund side or on the issuer side, only big financial firms are capable to act dual roles.
This feature is even more pronounced for European firms. Only five out of them are both fund
sponsors and security issuers, but securities issued by these six firms take more than one fourth of
all European issuers’ security value. Comparing Panel A with Panel C, on the issuer side, European
financial firms are fewer than non-European financial firms in numbers, but they accounts for more
than 60% in the value of issued securities. This summary conforms with the documented fact by
Ivashina et al. (2015) that a large share of dollar liabilities are issued by foreign banking entities.
Comparing financial firms serving dual roles in Panel B and Panel C, on the fund side, European
firms have much less AUM than their non-European peers, but on the issuer side, both firms are
very close in total value of issued securities.
[Insert Table 1 about here]
Table 1 reports summary statistics of month-fund observations during the whole sample period.
The average fund has $7051.88 million in net asset (TNA) and is 18.62 years old; 33.24% of
its shares are for institutional investors and its portfolio maturity is 38.40 days. Comparing
stand-alone MMFs (lender only) and dual-role MMFs (whose sponsor also issue debt in the
MMFs market), dual-role MMFs have larger TNA, younger fund age, ownership tilted towards
institutional investors, and slightly lower expense ratios. The fund flow calculated as the difference
between Subscription and Redemption shows an average dual-role fund’s size decreases by 0.40%
monthly while an average stand-alone fund’s size increase by 0.16%; this difference can be
related to the former’s higher exposure to European debt (41.13%) which might be a main
trigger of investors’ redemption. Moreover, dual-role funds invest 14.40% of their assets on their
connected partners. Standard deviations of annualized Gross Yield and Net Yield shows MMFs
12

are heterogeneous in reaching for yield, and dual-role funds are more prone to reach for yield
than their stand-alone peers. In term of portfolio holdings, the average fund invests 25.53% in
ABCP(asset backed commercial paper) and Financial CP (financial commercial paper), 17.95% in
CD (certificate of deposit); portfolio holdings of dual-role funds and stand-alone funds are quite
similar in these three categories. However, dual-role funds hold far fewer secure debt issued by
government or agencies but more insecure debt such as other repurchase agreements.
[Insert Table 2 about here]
Table 2 reports summary statistics of securities in MMFs’ portfolio holdings. Panel A lists non-
government securities. On average, ABCP, CD, Financial CP and Other Repo pay higher yields
with larger maturities than Government/Agency Repo, Treasury Repo and Nonfinancial CP do. Of
special note is Other Repo, which is a special type of repo collateralized by equities, corporate
bonds or even financial derivatives, and therefore not considered as secure as normal repos which
are backed by very safe assets such as Treasuries or government debt. In terms of issuing sources,
there are more European issuers than U.S. issuers for repos, CD and Financial CP, and vice versa
for ABCP and Non-financial CP. Panel B shows that government or agency securities have lower
yields but longer maturities than those in Panel A.
4. The Cross-Holding Relation in MMFs
Although relationship-based lending has long been discussed in the banking literature,5 rather than
being detected directly, the relationship mechanism is measured based on prior long-term lending
activities. In a word, “relationship” is used as a general term instead of a specific one. Here,
however, I document an important channel financial institutions use to build relationship: a cross-
holding relation conducted through affiliated MMFs.
My detailed empirical analysis is conducted on the fund-issuer level, namely one fund-issuer
5See, for example, Bharath et al. (2007), Bolton et al. (2016).
13

pair in every month is one observation in the sample. Lending is measured by the exposure of fund
f to issuer i at month t:
Exposure f ,i,t =Outstanding f ,i,t
∑i Outstanding f ,i,t,
where Outstanding f ,i,t is the total value of money market instruments that are issued by issuer i
and held by fund f at time t, and ∑i Outstanding f ,i,t is the total value of fund f ’s portfolio holding
at time t. Therefore, Exposure represents a given fund f ’s portfolio weights to different issuers i
at time t.
According to the definition of the cross-holding relation, a pair ( f , i) has a dummy BConneced
equal to one if both Exposure f ,i,t and Exposurei, f ,t are larger than zero when t is one of the three
months in the pre-period. It means that, before mid-2011,when fund f holds securities issued by
issuer i, if i also has an affiliated MMF that simultaneously holds securities issued by f ’s sponsor,
then this fund-issuer pair is called “bilaterally connected”.
[Insert Table 3 about here]
Table 3 gives an overview of fund-issuer pairs in my sample during the whole March-August
2011 period. Panel A compares connected pairs with unconnected pairs. The observed number
of bilaterally connected pairs is far smaller than that of unconnected ones: only above 6% of
fund-issuer pairs (1947 month-pairs) are reflections of the cross-holding relation. This fact is
understandable given that the numbers in Figure 3 already show not every entity in this market has
the capacity to both sponsor MMFs and issue money market instruments. Generally speaking, a
fund weighs 3.07% of its portfolio holdings on every bilaterally-connected issuer, more than the
weight on unconnected ones; as a comparison, the lending value of $250.905 million per pair in
connected pairs is higher, while risk exposure proxies such as yield, net yield and days-to-maturity
are lower. The facts jointly imply that the cross-holding relation is associated with lending at a
larger dollar amount and lower risk exposure. It is worth noting that a fund’s portfolio weight on
14

a connected issuer can reach as high as 10.27%, which is far larger than the five percent issuer
diversification limit required by the SEC since the 2014 MMF reform (which launched later than
this paper’s testing period.)
Panel B in Table 3 compares fund-issuers pairs between European and non-European issuers.
Averagely, European issuers borrows more in terms of both fund weight and dollar amount, and
the distributions their borrowing is more volatile. European securities’ higher yields and net yields
in the MMFs market are in line with European banks’ feature of offering higher yields on their
borrowings as concerns about European sovereign debt simmered.
5. The Impact of the Cross-Holding Relation on MMFs’ Lend-
ing Behavior
Starting from this section, I show my empirical test results. As highlighted in Section 2, I separate
my analysis into two symmetric periods surrounding Moody’s review of Eurozone banks: March-
May 2011 (the pre-period) when MMFs still reached for high-yield securities, and June-August
2011 (the post-period) when MMFs suffered large redemptions because of investors’ worries about
MMFs’ exposure to European borrowers.
5.1 Univariate Analysis
I start my empirical analysis by testing the first hypothesis. I investigate how MMFs’ lending to
bilaterally-connected and unconnected European issuers changes around the Eurozone crisis.
[Insert Table 4 about here]
Panel A in Table 4 presents the univariate statistics and t-test of differences in MMFs’ European
exposure between the post- and pre-periods. On average, if a European issuer is bilaterally
connected with a fund, after the Eurozone crisis, the fund’s exposure to this connected partner
15

increases by 0.35% measured in portfolio weight; in contrast, a fund’s portfolio weight on
every unconnected European issuer drops by 0.23%. The corresponding economic implication is
surprising: after Moody’s review on European banks in June 2011, an average U.S. MMF financed
every connected partner in Europe $29.58 million more while cut off $19.66 million in lending to
every other European borrower. Both differences are statistically significant at 5% at least. The
other noteworthy fact is, in both the pre- and post-periods, the average exposure of connected pairs
almost doubles that of unconnected ones.
For comparison, I show results of the same univariate test for non-European issuers in Panel B
of Table 4. Generally speaking, exposure in fund-issuer pair here is less than that in Panel A, which
is in line with the fact that European securities take a large share in the dollar dominated MMFs
market. After the crisis, funds add weights on both connected and unconnected issuer, although
the difference of exposure in connected pairs is statistically insignificant and much smaller than
the difference in unconnected ones. This change is consistent with documented facts that MMFs
turned to non-European borrowers after the crisis in Europe broke out.
5.2 Multivariate Analysis
My first hypothesis focuses on real effects of the cross-holding relation on MMFs’ lending to
European issuers. The univariate analysis above provides preliminary evidence that MMFs’
lending to bilaterally-connected and unconnected European issuers changes differently after
the Eurozone crisis. However, this phenomenon may be driven by issuers’ or funds’ other
characteristics. To control for these factors, in the following section, I use multivariate regressions
to test the change in each fund-issuer pair’s Exposure.
5.2.1 Comparison among European Issuers
I first test how fund-issuer pairs’ Exposure changes in the subsample where all issuers are from
Europe and all MMFs are sponsored by non-European financial institutions. The results are
16

reported in Table 5. My analysis is based on the following multivariate regression model:
Exposure f ,i,t =α +β1BConnected f ,i ×Post +β2BConnected f ,i
+β3Post +λ1Control f ,t +λ2Controli,t + ε f ,i,t ,
(1)
where Exposure is the fund-issuer pairs’ exposure winsorizd at the 5th and 95th percentiles;6
BConnected is a dummy equal to one for all bilaterally connected fund-issuer pairs in the pre-
period; Post equals one when the month t is in the post-period; Control f ,t and Controli,t form
a group of control variables on the issuer side and the fund side respectively, including the
natural logarithm of fund size (Log(Fund Size) f ,t), fund net yield (Net Yield f ,t), fund expense
ratios (Expense Ratio f ,t) and fund-level institutional share proportions (Institutional Share f ,t),
fund flows (Fund Flow f ,t−1) and issuer’s five-year CDS rates (CDS Ratei,t). The month-fixed
effect accounts for any time differences that may drive risk differences across fund-issuer pairs.
Similarly, unobserved time-invariant differences among issuers, funds, fund sponsors or issuer
type are controlled by the issuer-, the fund-, the sponsor-fixed or the issuer-type-fixed effect. I
consider error terms to be within funds and within issuers, therefore standard errors are two-way
clustered at the fund level and the issuer level.
[Insert Table 5 about here]
From Column 1 to Column 5, consistent with the univariate analysis, I find a strong positive
relationship between the bilateral connection and the fund-issuer pairs’ exposure in the post-period:
after mid-2011, the cross-holding relation increases a MMF’s exposure to the corresponding
European issuer by 0.36%–0.47% of its portfolio holdings, which means the lending amount in
per connected fund-issuer pair is inflated by $34.76–$42.95 million. The results are statistically
and economically significant: in the post-period, the cross-holding relation corresponds to a
18.9%–23.35% increase in Exposure relative to the cross-sectional standard deviation of Exposure
to European issuers.
6The resutls are similar without winsorization and with it at different levels (1st and 99th, 10th and 90th).
17

An identification concern is that bilaterally connected issuers are less risky, and so that they
became more popular in the post-period when MMFs were prone to escape from risky issuers.
I address this problem by adding European issuers’ five-year CDS rates across all columns as a
control variable of issuers’ default risk. Results show that MMFs’ Exposure to European issuers is
less for issuers with higher CDS rate. Plus, it is also less for funds with larger size, higher expense
ratio and lower institutional share.
Moreover, the issuer-fixed effect is included in Column 2 to Column 4, where BConnected and
Post lose their statistical significance, indicating the positive (negative) relationship between the
bilateral connection (the post period) and Exposure mirrors some persistent nature from issuers.
However, the positive coefficient of BConnected×Post remains statistically significant, therefore,
MMFs’ tilt of portfolio weight to bilaterally-connected European issuers is very unlikely to be
associated with these issuers’ creditworthiness. As predicted by Hypothesis One, in the post-
period, holding fixed the issuer, MMFs finance less to unconnected European issuers but lend
more to their bilateral connected European partners.
A similar identification concern also exists on the fund side. Although funds’ key characterist-
ics have been controlled, my results might be also driven by unobserved time-invariant differences
among funds or fund sponsors. These fund-level or house-level characteristics may be associated
with funds’ building-up of bilateral connections. I address this problem by including the fund-fixed
effect in Column 1 and Column 3 to Column 5, as well as the sponsor-fixed effect in the last two
columns. These specifications do not change the quality of previous results but support Hypothesis
One which also predicts that, in the post-period, holding fixed the MMF, European issuers receive
more finance support from the MMFs belonging to their bilaterally-connected financial firms.
Undoubtedly, issuers who have the capacity of building the cross-holding relation with
MMFs are prone to be conglomerates with different departments running under their umbrellas.
Complying with the “too big to fail” intuition, one explanation of MMFs’ higher exposure
on bilaterally connected issuers after the crisis is these issuers are secured because they are
18

conglomerate. Although this feature of being conglomerate has been controlled by the issuer-fixed
effect, to further distinguish it from the bilateral connection, I control the issuer-type-fixed effect
in Column 4. All issuers are put into seven categories: “Conglomerate”, “Bank”, “Investment
Company”, “Insurance Company”, “Government”, “Agency”, “Non-financial Firms”. I also add
a dummy Conglomerate in Columns 5. My main findings are robust. Although the bilateral
connection of this paper’s focus is proven to be different from the conglomerate effect, Column
5 indicates that being a conglomerate also helps issuers to gain funding from MMFs in the post-
period.
5.2.2 Comparison among All Issuers
This section shows fund-issuer pairs’ Exposure changes in the entire sample including non-
European issuers. Table 6 presents results of the following multivariate regression model:
Exposure f ,i,t =α +β1BConnected f ,i ×Post ×European Issueri
+β2BConnected f ,i ×Post +β3BConnected f ,i ×European Issueri
+β4Post ×European Issueri +β5BConnected f ,i +β6Post
+β7European Issueri + γControl f ,t + ε f ,i,t ,
(2)
where Exposure, BConnected and Control f ,t are the same as these defined in the specification 1;
European Issuer is a dummy equal to one if the issuer i is from Europe. The month fixed effect
accounts for any time differences that may drive risk differences across fund-issuer pairs. Similarly,
unobserved time-invariant differences among issuers, funds or fund sponsors are controlled by the
issuer-, the fund- or the sponsor-fixed effect, and standard errors are two-way clustered at the fund
level and the issuer level.
[Insert Table 6 about here]
From Column 1 to Column 4, I find that, in the post-period, a MMF’s portfolio weight on
19

European issuer decreases by 0.13%-0.22%; however, the bilateral connection increase a fund’s
portfolio weight on an connected European issuer by 0.46%-0.54%. In comparison, the coefficients
of the interaction terms between BConneced and Post, and the one between BConneced and
EuropeanIssuer are both close to zero. Hence, the bias in MMFs’ portfolio weight is neither
universal across all issuers in the post period nor common for all European issuers during the
entire sample period.
5.2.3 Bilateral Connection and Past Relationship
“Relationship” in the banking literature usually refers to the one in a long time period. The
relationship strength is measured by proxies based on prior lending activities rather than being
detected directly. As a comparison, the cross-holding relation documented in this paper implies
an important channel that financial institutions use to build relationship. To show that my above
findings cannot simply be captured by indirect relationship measures in existing literature, I run
a multivariate regression model which is similar to the specification 1 but includes Past Relation,
which is measured by the following four measures at the fund-issuer pair level used in Chernenko
and Sunderam (2014):
• Frequency: a dummy equal to one if a fund lends more frequently to an issuer than the
median fund does;
• Maturity: a dummy equal to one if a fund-issuer pair’s maturity is longer than the issuer’s
median borrowing maturity;
• Quantity (Issuer Based): a dummy equal to one for the fund-issuer pair ( f , i) if its portfolio
share is above that issuer’s median portfolio share;
• Quantity (Fund Based): a dummy equal to one for the fund-issuer pair ( f , i) if its portfolio
share is above that fund’s median portfolio share.
20

These four measures are built based on prior lending activities in the MMFs market from
November 2010 to February 2011. The tests include month-fixed effects, issuer-fixed effect, fund-
fixed effects, sponsor-fixed effects, and issuer-type fixed effects. Standard errors are clustered at
both the issuer- and the fund- levels. Regression results are reported in Table 8.
[Insert Table 7 about here]
As shown in column (1), (3), (5) and (7), a strong Past Relation is associated with 0.26%-
1.39% increase in MMF’s exposure to an European issuer, but the coefficients of the interaction
term Past Relation×Post are statistically and economically insignificant except for column (7),
which means that MMFs’ lending difference around the Eurozone crisis is not conditional on
indirect relationship measures in existing literature. Moreover, in column (2), (4), (6) and (8),
the coefficients of BConnected ×Post remain positive and statistically significant after the control
of Past Relation, therefore confirms that similar results in Table 5 are not simply dominated by
indirect relationship measures in existing literature. These findings suggest that the cross-holding
relationship is not simply a reflection of documented relationship strength by previous researches
but helpful to deepen the understanding about the relationships mechanism.
5.3 Securities Comparison
A further look of relationship lending is to check if it is associated with differences in riskiness of
securities issued by connected and unconnected issuers.
To measure the riskiness of securities, I apply three risk measures suggested by Kacperczyk
and Schnabl (2013). The first one is Spread, namely a security’s gross yield net of one-month
T-bill rate. After adjusting for time varying interest rate, this measure can largely reflect a debt’s
risk. The second one is Maturity, namely a security’s days-to-maturity. Intuitively, the longer the
days-to-maturity, the larger the uncertainty. For each fund-issuer pair, both Spread and Maturity
are averaged weighed by each security’s value in the fund’s portfolio. The last one is Holdings
21

Risk, calculated as the weight of an issuer’s insecure securities net of its secure securities in a
fund’s portfolio. Secure securities include government repo, agency repo and Treasury repo, while
other types of securities belong to the insure category.
[Insert Table 8 about here]
For fund-issuer pairs with European issuers, Table 8 presents the univariate statistics and t-
test of differences in securities’ riskiness between the post- and pre-periods. In Panel A and
Panel B, both connected- and unconnected-pairs behave in the same pattern: surrounding the
Eurozone crisis, the change of Spread is close to zero, while Maturity is reduced by 9-10 days. A
slightly different pattern appears in Panel C: Holdings Risk does not change for connected pairs
but increases by 3.42 base points for unconnected pairs.
The following multivariate regression model tests changes of riskiness in depth.
Risk f ,i,t =α +β1BConnected f ,i ×Post +β2BConnected f ,i +β3Post
+λ1Control f ,t +λ2Controli,t + ε f ,i,t ,
(3)
where Risk is measured by Spread, Maturity and Holdings Risk at the fund-issuer-month level;
independent variables are the same as these defined in the specification 1. I consider error terms
to be within funds and within issuers, therefore standard errors are two-way clustered at the fund
level and the issuer level.
[Insert Table 9 about here]
Results of this difference-in-difference model are presented in Table 9. Except for Columns
(2), all estimates of β1 are close to zero, denoting that changes in riskiness of securities issued
by connected and unconnected European issuers surrounding the Eurozone crisis are the same.
In other words, although the corss-holding relationship make a difference in lending, there is no
differences in securities’ riskiness.
22

However, Table 9 conveys information about fund-issuer pairs’ other features that affect Risk:
(1) the bilateral connection is associated with lower Risk; (2) the post period is associated with
lower Risk. These two findings indicate that, securities in the connected fund-issuer pairs are less
risky across the entire sample period, and MMFs hold less risky securities after the Eurozone crisis.
6. The Reciprocity Effect
This section aims to answer why financial houses commit to relationship lending in the MMFs
market.
As shown above, MMFs were willing to increase stakes in bilaterally-connected European
partners after the Eurozon crisis, but this willingness is not related to securities’ riskiness.
Therefore, it is not because their connected European issuers provided less risky money market
instruments that makes MMFs tilt to these issuers in portfolio weights after mid-2011. Now a
further question is: what other benefits could MMFs get from helping their bilaterally-connected
European partners after the crisis?
There is reciprocity between two connected financial firms. The nature of the bilateral
connection is that both parties crossly hold each other’s debt, in other words, MMFs of the
European financial houses also have stakes in their bilaterally-connected partners, whose MMFs,
according to findings in Section 5, have increased their stake in European partners in the post-
period. To test the reciprocity effect, I turned my eyes to the reverse lending, which is portfolio
holdings of MMFs who are sponsored by European financial firms.
A fund-issuer pair ( f , i) is called “Reverse Pair” if the fund f is sponsored by a European
financial firm and, simultaneously, this firm’s money market instruments are also owned by the
issuer i’s affiliated MMFs. Obviously “Reverse Pair” is a bilaterally-connected pair in which
MMFs are under the umbrella of European financial houses.
[Insert Table 10 about here]
23

I compare “Reverse Pairs” with other fund-issuer pairs7 surrounding the Eurozone crisis. Four
different variables are applied: Exposure, Spread, Maturity and Holdings Risk. The first one
is defined in the specification (1) and the rest three are defined in the specification 3. The
corresponding univariate statistics and t-test of differences are presented in Table 10. In Panel
A, funds’ exposure in reverse pairs increases by 0.13% while that in other pairs does not change.
A stronger evidence is show in Panel D: Holdings Risk increases by 5.74 base points for reverse
pairs but decreases by 2.79 base points for other pairs. These findings suggest that, in the post
period and comparing with other fund-issuer pairs, MMFs sponsored by European financial firms
increase their portfolio holdings of money market instrument issued by their connected issuers
(namely those whose MMFs increase stakes in bilaterally-connected European financial firms),
moreover, they also accept more insecure securities than secure securities from their connected
issuers. This pattern is not found in Panel B and Panel C. both reverse and unconnected pairs
experience declines in securities’ Spread and Maturity.
A more detailed comparison is made by estimating the following regression model:
Lending f ,i,t =α +β1Reverse Pair f ,i ×Post +β2Reverse Pair f ,i +β3Post
+β4BConnected f ,i +β5European Issueri +β6European Fund Sponsor f
+ γControl f ,t + ε f ,i,t ,
(4)
where Lending is measured by Exposure, Spread, Maturity and Holdings Risk respectively.
European Issuer is a dummy equal to one if the issuer is an European firm. European Fund Sponsor
is a dummy equal to one if the fund’s sponsor is an European firm. Other independent variables
are the same as these defined in specifications 1, 2 and 3. I consider error terms to be within funds
and within issuers, therefore standard errors are two-way clustered at the fund level and the issuer
level.
[Insert Table 11 about here]7Bilateral connected pairs with European issuers are excluded.
24

Table 11 reports the results when Lending is measured by Holdings Risk. Across all columns,
estimates of β1 are positive and statistically significant at the level of 1%: Holdings Risk in reverse
pairs increases 10.85-14.26 basis points after the Eurozone crisis. This finding is robust after
controlling different fixed effects, especially the pair’s feature of being bilaterally connected, the
issuer’s feature of being a European firm (Column (4)), and the fund sponsor’s feature of being
a European firm (Column (5)). As a comparison, three out of five estimates of β3 are negative
and statistically significant at the level of 5%: Holdings Risk generally decreases 2.37-4.14 basis
points in the post period.
These findings imply that, after the Eurozone crisis, although MMFs hold less insecure
securities than secure ones, European financial firms that owns MMFs accept more insecure
securities than secure ones from their bilaterally-connected partners. According to Chernenko
and Sunderam (2014), insecure money market instruments were popular in the pre-period because
their high yields were what yield-reaching MMFs were chasing, but this popularity soon went
to the opposite side in the post-period when MMFs turned to less risky assets to avoid further
redemption. Clearly, getting a MMF to accept insecure securities is hard in the post-period. I
interpret the surprising change in Reverse Pairs’ Holding Risk as European firms’ compensation
for, as shown in Section 4, these bilaterally-connected partners’ MMFs’ willingness to continually
finance the corresponding European financial firms after mid-2011. Plus, the negative coefficient
of Post complies with the same fact that normally the portfolio weights gap between insecure and
secure securities in each fund-issuer pair decrease after mid-2011.
Results in Table 11 find evidence in favor of Hypothesis Two about reciprocity. To be specific,
the fact that financial firms tilt in their MMFs’ portfolios to bilaterally-connected European issuers
is associated with the corresponding European financial firms’ willingness, through their affiliated
MMFs, to accept more insecure debt from these financial firms after the Eurozone crisis, a period
when both European debt and insecure securities are unwelcome in the MMFs market.
[Insert Table 12 about here]
25

The results when Lending is measured by the other three measures are presented in Table 12. I
do not find any statistically significant coefficient of the interaction of Reverse Pair and Post.
7. Spillover Effects
Analyses in previous two sections are all about direct impacts of the cross-holding relation. Given
the small ratio that bilaterally-connected pairs takes (5%) in the full sample of fund-issuer pairs,
people may question how deeply and widely the cross-holding relation affects the overall MMFs
market. In this section, I start a discussion about how MMFs’ tilt to connected European issuers
may influence other issuers who also borrow money from these funds.
Due to the limited available capital on MMFs’ hand, especially in the post-period when a lot of
MMFs suffered big net outflows, if a MMF decides to increase its stake in one issuer, it has to cut
off financing to some other issuers, then these issuers may meet difficulties to borrow money from
other lenders in a short time due to the lack of relationship (Chernenko and Sunderam (2014)).
Now I introduce a variable SEuro Fund Share, which is decided as :
SEuro Fund Sharei,t =∑ f Outstanding f ,i,t ×SEuro Fund f
∑ f Outstanding f ,i,t,
where SEuro Fund is a dummy equal to one if the MMF has bilaterally-connected European
issuers. SEuro Fund Share reflects how heavily an issuer relies on these SEuro Funds to borrow
money. If SEuro Fund Share= 0, then this issuer is not held by any SEuro Fund. I put all issuers
in the sample into two groups: SEuro Fund Share = 0, and SEuro Fund Share > 0.
[Insert Table 13 about here]
In Table 13, we can see that 165 financial firms borrow money from SEuro Funds before mid-
2011, namely more than half of issuers can be indirectly affected by the cross-holding relation
in the post-period. On average, issuers in this group are big borrowers in terms of their debt
26

outstanding in the MMFs market, indicating influences on them may represent big impacts on the
entire issuer side. Plus, this group has more Eurpean issuers as well as riskier securities.
To further investigate how the spillover effect differs by issuers’ SEuro Fund Share, I apply
the following test in Chernenko and Sunderam (2014):
∆Outstandingi = α +β Issuer Euro Sharei + εi, (5)
where ∆Outstanding is the percentage change in the issuer’s average Outstanding between the pre-
and post-period; Issuer Euro Share measured an issuer’s indirect exposure to European financial
firms, calculated as :
Issuer Euro Sharei,t =∑ f Outstanding f ,i,t ×Fund Euro Share f ,t
∑ f Outstanding f ,i,t,
given Fund Euro Share is a fund’s total exposure to European issuers. In the regression, I
use each issuer’s average Issuer Euro Share in the pre-period. To release the identification
concern that issuers’ Issuer Euro Share and SEuro Fund Share are associated with their
creditworthiness, I also control for each issuer’s Yield and European Issuer dummy.
[Insert Table 14 about here]
As shown in Table 14, the negative effect of being financed by MMFs that have large European
issuer exposure on other issuers, as documented in Chernenko and Sunderam (2014), is only found
in issuers who borrow money from SEuro Funds. The inclusion of Yield and European Issuer
does not change this impact, suggesting the results are not driven by MMFs general aversion to
risk in the post-period. However, I do not find significant similar results for issuers not relying on
SEuro Funds. Plus, the distributions of Issuer Euro Share in the two groups are very similar.
These findings indicate the two groups of issuers are very different in whether or not they are
easily affected by their indirect exposure to European issuers. Those financial firms borrowing
money from MMFs who are bilaterally connected with European issuers are prone to have trouble
27

in borrowing money from other MMFs in the post-period if their old lenders cut off the financing.
8. Conclusion
In the context of the U.S. money market funds, this paper study the existence and influence of
relationship financing in shadow banking. In particular, I document a bilaterally-connected relation
that financial firms crossly hold each other’s debt through their affiliated MMFs.
Using the market turmoil in European banks in mid 2011 as an exogenous event, I show
that non-European financial firms increase their MMFs’ stakes on bilateral-connected European
financial firms after Moody’s downgrade review of some European banks in mid-2011 while
MMFs generally reduced their exposure to European borrowers at the same time. I provide
evidence that this change in funds’ portfolio holdings is driven by the motivation of reciprocity
between bilateral-connected financial firms. In return, the European financial firms, through their
affiliated MMFs, accept more insecure debt from their bilaterally-connected partners. Issuer or
fund characteristics do not explain the results. I further show the cross-holding relation also have
spillover effects on unconnected issuers when they fail to raise money from new MMFs shortly.
My findings improve the current understanding of the nature of relationship lending between
financial institutions, particularly “shadow banks” that act as intermediaries providing short-term
credit but are active in capital markets that are usually thought to be financed by “arm’s length”.
Broadly speaking, as non-bank financial intermediaries who also have the similar banking
function, financial institutions like MMFs may create panics spreading around the broader
economy. My results shed lights on how even a very large number of borrowers who don’t
have relationship with MMFs can be deeply affected by MMFs’ relationship lending to connected
borrowers.
28

Appendix A. Investment and Issuer Categories
Based on investment categories reported in N-MFP, I classify portfolio holdings into 12 investment
categories: “asset backed commercial paper (ABCP)”, “certificate of deposit (CD)”, “financial
commercial paper”, “non-financial commercial paper”, “government or agency repo”, “Treasury
repo”, “other repo”, “investment company”, “Treasury”, “government or agency debt”, “municipal
or agency debt”, and “other”.
As for issuers categories: firstly, I search in Factset and Bloomberg formal names and business
categories for issuers of securities in the first eight investment categories, 99.5% of which find
matched records. This group of issuers is classified into five types: “finance”, “consumer”,
“health”, “high tech”, and “manufacturing”. Except for cfinance”, the other four types of firms
only issue non-financial commercial paper in my sample.
Secondly, I name issuers of securities in the last four investment categories after the
corresponding investment’s category name. Measured in the value weight, across the entire
holdings sample 4.2% are “Treasuries”, 10.2% are “government or agency debt”, 18.8% are
“municipal or agency debt” and 7.6% are “other”.
29

Appendix B. Financial Firms Serving Dual-Roles in the MMFs
Market
The following lists the 38 Non-European financial entities who both sponsor dollar-dominated
MMFs and issue money market fund instruments.
American Beacon Advisors, Inc. Mitsubishi UFJ Financial Group, Inc.Bank of America Corp. Morgan StanleyBank of Montreal Nationwide Mutual Insurance CompanyBlackRock, Inc. New York Life Insurance Co.Brown Brothers Harriman & Co. Northern Trust Corp.Federated Investors, Inc. PNC Financial Services Group, Inc.Fidelity Investments Pacific Mutual Holding CompanyFifth Third Bancorp Prudential Financial, Inc.Franklin Resources Inc. Putnam InvestmentsGeneral Electric Royal Bank of CanadaGuggenheim Partners, LLC State Street CorporationHuntington Bancshares, Inc. The Bank of New York Mellon Corp.Invesco The Charles Schwab CorporationJP Morgan Chase & Co. The Goldman Sachs Group, Inc.M&T Bank Corp. The Toronto-Dominion BankMacquarie Group Limited U.S. BancorpMassMutual Financial Group UMB Financial CorporationMeeder Investment Management, Inc. Vanguard Group, Inc.MetLife, Inc. Wells Fargo & Company
The following lists the five European financial entities who both sponsor dollar-dominated
MMFs and issue money market fund instruments.
AXA SA HSBC Holdings PlcDeutsche Bank AG ING Bank NVUBS AG
30

References
Bharath, S., Dahiya, S., Saunders, A., Srinivasan, A., 2007. So what do I get? The bank’s view of
lending relationships. Journal of financial Economics 85, 368–419.
Bolton, P., Freixas, X., Gambacorta, L., Mistrulli, P. E., 2016. Relationship and transaction lending
in a crisis. Review of Financial Studies 29, 2643–2676.
Boot, A. W., 2000. Relationship banking: What do we know? Journal of Financial Intermediation
9, 7–25.
Brady, S. A., Anadu, K. E., Cooper, N. R., 2012. The stability of prime money market mutual
funds: Sponsor support from 2007 to 2011. Federal Reserve Bank of Boston, Risk and Policy
Analysis Working Papers 12-3.
Chernenko, S., Sunderam, A., 2014. Frictions in shadow banking: Evidence from the lending
behavior of money market funds. Review of Financial Studies 27, 1717–1750.
Chodorow-Reich, G., 2014. Effects of unconventional monetary policy on financial institutions.
Working paper.
Di Maggio, M., Kacperczyk, M., 2017. The unintended consequences of the zero lower bound
policy. Journal of Financial Economics 123, 59–80.
Gallagher, E., Schmidt, L., Timmermann, A., Wermers, R., 2015a. By force of flow: Investor
behavior and money market fund risk allocations during the eurozone crisis. Working paper.
Gallagher, E., Schmidt, L., Timmermann, A., Wermers, R., 2015b. The stability of money market
mutual funds: the effect of the 2010 amendments to rule 2a-7. Working paper.
Hanson, S. G., Scharfstein, D. S., Sunderam, A., 2015. An evaluation of money market fund reform
proposals. IMF Economic Review 63, 984–1023.
Hu, G. X., Pan, J., Wang, J., 2015. Tri-party repo pricing. Working paper.
31

Ivashina, V., Scharfstein, D. S., Stein, J. C., 2015. Dollar funding and the lending behavior of
global banks. The Quarterly Journal of Economics 130, 1241–1281.
Ivashina, V., Sun, Z., 2011. Institutional stock trading on loan market information. Journal of
Financial Economics 100, 284–303.
Kacperczyk, M., Schnabl, P., 2013. How safe are money market funds. The Quarterly Journal of
Economics 128, 1073–1122.
La Spada, G., 2014. Competition, reach for yield, and money market funds. Working paper.
Massa, M., Rehman, Z., 2008. Information flows within financial conglomerates: Evidence from
the banks–mutual funds relation. Journal of Financial Economics 89, 288–306.
Mehran, H., Stulz, R. M., 2007. The economics of conflicts of interest in financial institutions.
Journal of Financial Economics 85, 267–296.
Parlatore, C., 2016. Fragility in money market funds: Sponsor support and regulation. Journal of
Financial Economics 121, 595–623.
Prilmeier, R., 2017. Why do loans contain covenants? Evidence from lending relationships. Journal
of Financial Economics 123, 558–579.
Ritter, J. R., Zhang, D., 2007. Affiliated mutual funds and the allocation of initial public offerings.
Journal of Financial Economics 86, 337–368.
32

Figure 1.An illustration of different financial firms in the MMFs market.
33

Figure 2.An example of the bilateral connection of two financial firms in the MMFs market.
34

Figure 3.Financial firms in the MMFs market during the whole March-August 2011 period.
(a) Number of financial firms (b) Number of MMFs
(c) Total assets under management of MMFs ($ billions,monthly average)
(d) Securities’ total value ($ billions, monthly average)
35

Figure 4.An illustration of Hypothesis One
36

Figure 5.An illustration of Hypothesis Two
37
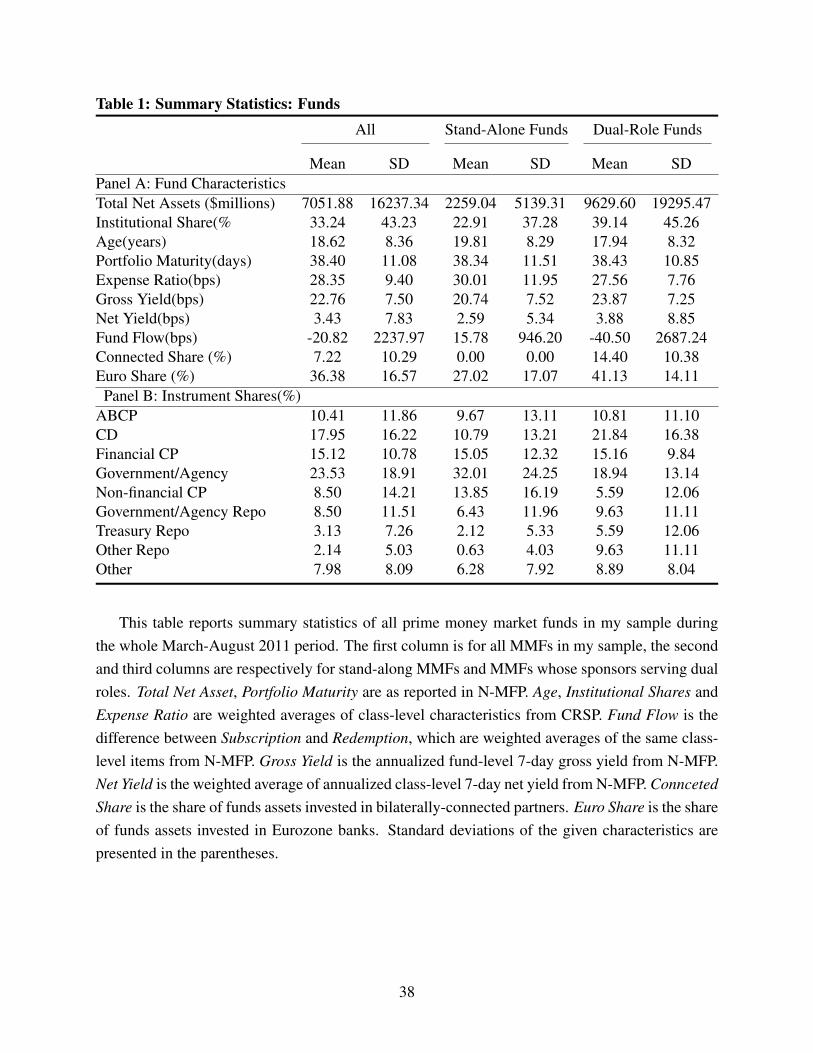
Table 1: Summary Statistics: FundsAll Stand-Alone Funds Dual-Role Funds
Mean SD Mean SD Mean SDPanel A: Fund CharacteristicsTotal Net Assets ($millions) 7051.88 16237.34 2259.04 5139.31 9629.60 19295.47Institutional Share(% 33.24 43.23 22.91 37.28 39.14 45.26Age(years) 18.62 8.36 19.81 8.29 17.94 8.32Portfolio Maturity(days) 38.40 11.08 38.34 11.51 38.43 10.85Expense Ratio(bps) 28.35 9.40 30.01 11.95 27.56 7.76Gross Yield(bps) 22.76 7.50 20.74 7.52 23.87 7.25Net Yield(bps) 3.43 7.83 2.59 5.34 3.88 8.85Fund Flow(bps) -20.82 2237.97 15.78 946.20 -40.50 2687.24Connected Share (%) 7.22 10.29 0.00 0.00 14.40 10.38Euro Share (%) 36.38 16.57 27.02 17.07 41.13 14.11Panel B: Instrument Shares(%)
ABCP 10.41 11.86 9.67 13.11 10.81 11.10CD 17.95 16.22 10.79 13.21 21.84 16.38Financial CP 15.12 10.78 15.05 12.32 15.16 9.84Government/Agency 23.53 18.91 32.01 24.25 18.94 13.14Non-financial CP 8.50 14.21 13.85 16.19 5.59 12.06Government/Agency Repo 8.50 11.51 6.43 11.96 9.63 11.11Treasury Repo 3.13 7.26 2.12 5.33 5.59 12.06Other Repo 2.14 5.03 0.63 4.03 9.63 11.11Other 7.98 8.09 6.28 7.92 8.89 8.04
This table reports summary statistics of all prime money market funds in my sample duringthe whole March-August 2011 period. The first column is for all MMFs in my sample, the secondand third columns are respectively for stand-along MMFs and MMFs whose sponsors serving dualroles. Total Net Asset, Portfolio Maturity are as reported in N-MFP. Age, Institutional Shares andExpense Ratio are weighted averages of class-level characteristics from CRSP. Fund Flow is thedifference between Subscription and Redemption, which are weighted averages of the same class-level items from N-MFP. Gross Yield is the annualized fund-level 7-day gross yield from N-MFP.Net Yield is the weighted average of annualized class-level 7-day net yield from N-MFP. ConncetedShare is the share of funds assets invested in bilaterally-connected partners. Euro Share is the shareof funds assets invested in Eurozone banks. Standard deviations of the given characteristics arepresented in the parentheses.
38

Table 2: Summary Statistics: SecuritiesSecurity Type Yield(bps) Maturity(days) U.S.(%) Europe(%)
Mean SD Mean SD Mean SD Mean SDPanel A: Non-Government SecuritiesABCP 25.46 3.31 43.74 7.49 52.52 6.04 40.06 8.22CD 27.52 3.67 62.7 18.67 31.02 6.19 40.12 12.87Financial CP 26.91 4.49 57.1 5.64 22.7 1.34 43.87 6.28Government/Agency Repo 15.12 5.20 3.82 1.73 43.25 3.81 53.77 5.69Treasury Repo 10.17 5.36 8.81 38.94 36.76 8.41 61.91 7.84Other Repo 38.19 3.76 18.87 13.70 43.76 2.36 50.72 4.20Non-financial CP 17.84 2.57 49.72 5.25 60.71 4.61 32.78 3.19Panel B: Government or Agency SecuritiesGovernment/Agency 15.45 2.02 117.36 74.10Treasury 16.53 2.06 120.58 10.95Municipal/Agency Debt 18.21 5.40 176.67 811.87
This table reports summary statistics of non-government securities in panel A and thatof government/agency securities in panel B. The sample period is the whole March-August2011 period. Yield and Maturity are value weighted average of corresponding security-levelcharacteristics. U.S. (%) and Europe (%) represents the dollar ratio of one type of security issuedin the U.S. and Europe respectively. Standard deviations of the given characteristics are presentedin the parentheses.
39

Table 3: Fund-Issuer Pairs OverviewPercentile
N Mean SD Min 25 50 75 MaxPanel A: Connected versus Unconnected pairs
Exposure (%) 1947 3.07 2.74 0.25 0.98 2.21 4.25 10.27Outstanding ($1M) 1947 204.91 300.31 1.94 16.50 72.01 250.06 1129.00
CON Yield (bps) 1674 19.99 8.67 5.00 13.58 19.97 26.23 35.44Net Yield (bps) 1674 15.07 8.46 0.00 9.00 15.00 21.14 30.82Maturity (days) 1947 34.77 38.14 1.00 3.53 20.64 52.75 133.00
Exposure (%) 32182 2.49 1.75 0.30 1.06 2.10 3.61 6.66Outstanding ($1M) 32182 160.70 253.76 0.79 10.00 43.00 185.71 956.86
UCON Yield (bps) 27724 25.98 10.63 6.86 18.90 26.00 32.42 47.81Net Yield (bps) 27724 21.03 10.33 2.64 14.00 20.88 27.30 42.60Maturity (days) 31971 52.38 49.95 1.00 12.06 37.41 76.00 178.58
Panel B: European Versus Non-European IssuersExposure (%) 17385 2.76 1.91 0.40 1.21 2.35 3.93 7.51
Outstanding ($1M) 17385 201.75 315.03 1.00 12.30 53.99 230.00 1185.71EU Yield (bps) 14924 27.87 10.92 8.53 20.16 27.56 34.66 50.10
Net Yield (bps) 14924 22.83 10.68 4.00 16.00 22.20 29.20 45.00Maturity (days) 17317 47.87 42.86 1.00 12.94 36.10 70.41 154.00
Exposure (%) 16744 2.28 1.66 0.22 0.93 1.90 3.30 6.24Outstanding ($1M) 16744 125.73 194.10 0.50 8.50 35.00 149.95 722.51
NEU Yield (bps) 14474 23.29 9.78 5.00 16.33 23.91 29.86 42.31Net Yield (bps) 14474 18.46 9.47 1.00 12.00 18.72 24.60 37.55Maturity (days) 16601 55.05 55.75 1.00 10.00 36.57 80.00 194.13
This table reports distributions of key variables across different fund-issuer pairs in my sampleduring the whole March-August 2011 period. A fund-issuer pair ( f , i) is called “connected” ifthe issuer i has an affiliated MMF that simultaneously holds securities issued by the financial firmwho owns fund f in the pre-period. For each pair, Exposure is the value weight of an issuer’ssecurities in a fund’s portfolio holdings, calculated as: Exposure f ,i,t =
Outstanding f ,i,t∑i Outstanding f ,i,t
, whereOutstanding f ,i,t is the total value of money market instruments that are issued by issuer i andheld by fund f at time t, and ∑i Outstanding f ,i,t is the total value of fund f ’s portfolio holding attime t. Yield is the weighted-average yield paid by an issuer. Net Yield is Yield net of one-monthT-bill rate. Maturity is the weighted-average days to maturity of an issuer’s securities.
40

Table 4: Changes of MMF’s Exposure between the Pre- and Post-PeriodsPair Post Pre
Number Mean(%) SD(%) Mean(%) SD(%) Diff(%) SD(%)Panel A: European IssuersConnected 148 4.013*** 3.906 3.660*** 3.465 0.352** 1.564Unconnected 3714 2.174*** 1.802 2.408*** 1.717 -0.234*** 1.408Panel B: Non-European IssuersConnected 278 2.112*** 1.928 2.021*** 2.032 0.091 1.350Unconnected 3583 1.990*** 1.600 1.811*** 1.547 0.179*** 1.214
This table reports changes of Exposure in fund-issuer pairs surrounding Moody’s downgradereview. For each fund-issuer pair, Exposure is the value weight of an issuer’s securities in a fund’sportfolio holdings, calculated as: Exposure f ,i,t =
Outstanding f ,i,t∑i Outstanding f ,i,t
, where Outstanding f ,i,t is thetotal value of money market instruments that are issued by issuer i and held by fund f at time t,and ∑i Outstanding f ,i,t is the total value of fund f ’s portfolio holding at time t. “Pre” is the periodfrom March to May in 2011, “Post” is the period from June to August in 2011. ***, **,* indicatestatistical significance at 1%, 5% and 10% respectively.
41

Table 5: Changes in MMFs’ Exposure to European Borrowers between the Pre- andPost-Periods
(1) (2) (3) (4) (5)BConnected × Post 0.379*** 0.446*** 0.403*** 0.403*** 0.361**
(0.134) (0.134) (0.132) (0.133) (0.140)BConnected 1.121* 0.063 0.215 0.215 0.923**
(0.585) (0.283) (0.279) (0.280) (0.387)Post -0.320** -0.056 -0.034 -0.112* -0.296*
(0.157) (0.083) (0.077) (0.061) (0.166)Conglomerate × Post 0.591**
(0.288)Conglomerate 0.075
(0.096)Log(Fund Size) -0.175 -0.176*** -0.203 -0.203 -0.178
(0.210) (0.043) (0.227) (0.227) (0.212)Net Yield (bps) -0.016 0.012 -0.013 -0.013 -0.015
(0.010) (0.017) (0.011) (0.012) (0.009)Age(years) -0.027 0.004 -0.033 -0.033 -0.031
(0.032) (0.007) (0.033) (0.033) (0.032)Expense Ratio(bps) -0.017* -0.003 -0.019* -0.019* -0.016
(0.010) (0.009) (0.010) (0.010) (0.010)Institutional Share(%) 3.806** 0.202 3.931*** 3.931*** 3.883**
(1.441) (0.156) (1.407) (1.411) (1.482)Fund Flow(bps) -0.002 -0.001 -0.001 -0.001 -0.002
(0.003) (0.006) (0.004) (0.004) (0.003)CDS Rate(%) 0.252*** -0.027 -0.060 -0.060 0.210***
(0.091) (0.062) (0.056) (0.056) (0.071)Month-Fixed Effects Y Y Y Y Y
Fund-Fixed Effects Y N Y Y YIssuer-Fixed Effect N Y Y Y N
Sponsor-Fixed Effects N N N Y YIssuer-Type-Fixed Effects N N N Y N
Observations 10835 10835 10835 10835 10835R2 0.268 0.276 0.421 0.421 0.289
The sample is fund-issuer pairs with European issuers for the whole March-August 2011 period. Thedependent variable is the fund-issuer pairs’ exposure winsorized at the 5th and 95th percentiles. BConnectedis a dummy equal to one for all bilaterally connected fund-issuer pairs in the pre-period; Post equals onewhen t represents a month in the post-period; Conglomerate is a dummy equal to one for issuers who areconglomerate; Other control variables include the natural logarithm of fund size (Log(Fund Size) f ,t), fundnet yield (Net Yield f ,t), fund expense ratios (Expense Ratio f ,t) and fund-level institutional share proportions(Institutional Share f ,t), fund flows (Fund Flow f ,t−1) and issuer’s five-year CDS rates (CDS Ratei,t). Allregressions are at the monthly level. Reported in the parentheses are two-way clustered standard errors atthe fund- and the issuer- level. ***, **,* indicate statistical significance at 1%, 5% and 10% respectively.
42

Table 6: Changes in Exposure to All Borrowers between the Pre- and Post-Periods(1) (2) (3) (4)
BConnected × Post × European Issuer 0.458* 0.510** 0.542** 0.542**(0.245) (0.231) (0.241) (0.241)
BConnected × Post -0.143 -0.101 -0.158 -0.158(0.186) (0.176) (0.186) (0.187)
BConnected× European Issuer 0.673 0.119 0.321 0.321(0.560) (0.481) (0.388) (0.389)
Post × European Issuer -0.130** -0.209*** -0.220*** -0.220***(0.057) (0.051) (0.052) (0.052)
BConnected 0.368 -0.022 -0.025 -0.025(0.249) (0.392) (0.289) (0.289)
Post 0.082* 0.165*** 0.146*** 0.146***(0.045) (0.049) (0.045) (0.045)
European Issuer 0.436***(0.156)
Log(Fund Size) -0.163 -0.213*** -0.115 -0.115(0.149) (0.034) (0.132) (0.132)
Net Yield (bps) -0.017** 0.008 -0.009 -0.009(0.007) (0.013) (0.006) (0.006)
Age (years) 0.011 0.005 -0.009 -0.009(0.027) (0.006) (0.024) (0.024)
Expense Ratio(bps) -0.002 -0.008 -0.003 -0.003(0.007) (0.007) (0.008) (0.008)
Institutional Share(%) 1.564 0.060 1.325 1.325(0.974) (0.130) (0.956) (0.957)
Fund Flow (%) -0.000 0.002 0.000 0.000(0.002) (0.004) (0.002) (0.002)
Month-Fixed Effects Y Y Y YFund-Fixed Effects Y N Y YIssuer-Fixed Effect N Y Y Y
Sponsor-Fixed Effects N N N YIssuer-Type-Fixed Effects N N N Y
Observations 23018 23018 23018 23018R2 0.246 0.282 0.405 0.405
The sample is all fund-issuer pairs for the whole March-August 2011 period. The dependent variableis the fund-issuer pairs’ exposure winsorized at the 5th and 95th percentiles. European Issuer is a dummyequal to one for issuers who are from Europe. Other variables follow the same definition in Table 5. Allregressions are at the monthly level. Reported in the parentheses are two-way clustered standard errors atthe fund- and the issuer- level. ***, **,* indicate statistical significance at 1%, 5% and 10% respectively.
43

Table 7: Bilateral Connection and Past RelationFrequency Maturity Quantity Quantity
(Issuer Based) (Fund Based)
(1) (2) (3) (4) (5) (6) (7) (8)BConnected × Post 0.407*** 0.408*** 0.416*** 0.470***
(0.146) (0.126) (0.125) (0.175)BConnected 0.216 0.207 0.194 0.164
(0.220) (0.295) (0.310) (0.179)Post 0.112 0.094 -0.009 -0.030 0.033 0.016 0.147 0.129
(0.096) (0.090) (0.099) (0.094) (0.084) (0.080) (0.095) (0.088)Past Relation× Post -0.137 -0.142 0.087 0.089 0.034 0.026 -0.293*** -0.309***
-0.093 -0.094 -0.064 -0.063 -0.079 -0.078 -0.082 -0.083Past Relation 1.083*** 1.085*** 0.271*** 0.269*** 0.940*** 0.943*** 1.385*** 1.391***
-0.097 -0.097 -0.087 -0.088 -0.115 -0.116 -0.098 -0.099Log(Fund Size) -0.164 -0.173 -0.138 -0.146 -0.178 -0.189 -0.143 -0.153
(0.240) (0.232) (0.239) (0.230) (0.248) (0.239) (0.248) (0.239)Net Yield (bps) -0.015 -0.014 -0.013 -0.012 -0.011 -0.010 -0.014* -0.013
(0.009) (0.010) (0.011) (0.012) (0.009) (0.010) (0.008) (0.009)Age (years) -0.031 -0.029 -0.032 -0.030 -0.032 -0.030 -0.027 -0.025
(0.033) (0.033) (0.031) (0.031) (0.033) (0.032) (0.037) (0.036)Expense Ratio(bps) -0.020* -0.020* -0.020* -0.020* -0.018* -0.018* -0.021* -0.021*
(0.011) (0.011) (0.011) (0.011) (0.010) (0.010) (0.011) (0.011)Institutional Share(%) 4.234*** 4.213*** 3.926*** 3.899*** 4.121*** 4.103*** 3.651** 3.616**
(1.425) (1.402) (1.419) (1.398) (1.459) (1.432) (1.551) (1.526)Fund Flow (%) -0.002 -0.001 -0.002 -0.002 -0.002 -0.001 -0.002 -0.001
(0.003) (0.003) (0.004) (0.003) (0.004) (0.004) (0.003) (0.003)CDS Rate (%) -0.065 -0.058 -0.063 -0.056 -0.068 -0.061 -0.039 -0.030
(0.056) (0.056) (0.056) (0.056) (0.058) (0.057) (0.056) (0.056)Observations 10833 10833 10833 10833 10833 10833 10833 10833
R2 0.463 0.464 0.422 0.424 0.440 0.442 0.494 0.495
The sample is fund-issuer pairs with European issuers for the whole March-August 2011 period. Thedependent variable is the fund-issuer pairs’ exposure winsorized at the 5th and 95th percentiles. PastRelation f ,i is measured in the October 2010-February 2011 period using different measures: Frequencyis a dummy equal to one if a fund lends more frequently to an issuer than the median fund does; Maturity isa dummy equal to one if a fund-issuer pair’s maturity is longer than the issuer’s median borrowing maturity;Quantity (Issuer Based) is a dummy equal to one if a fund-issuer pair’s portfolio share is above that issuer’smedian portfolio share; Quantity (Fund Based) is a dummy equal to one if a fund-issuer pair’s portfolioshare is above that fund’s median portfolio share. Other variables follow the same definition in Table 5.All regressions are at the monthly level, include month-fixed effects, issuer-fixed effect, fund-fixed effects,sponsor-fixed effects, and issuer-type fixed effects. Reported in the parentheses are two-way clusteredstandard errors at the fund- and the issuer- level. ***, **,* indicate statistical significance at 1%, 5%and 10% respectively.
44

Table 8: Changes of Securities’ Riskiness between the Pre- and Post-PeriodsPair Post Pre
Number Mean SD Mean SD Diff SDPanel A: Spread (bps)Connected 148 17.670*** 13.318 17.675*** 12.028 -0.005 6.730Unconnected 3714 22.628*** 11.479 22.694*** 11.742 -0.066 6.568Panel B: Maturity (days)Connected 148 24.854*** 25.096 34.552*** 28.920 -9.698*** 29.875Unconnected 3714 42.452*** 45.234 53.037*** 50.218 -10.585*** 36.182Panel C: Holding Risk (bps)Connected 148 -7.808 61.080 -7.034 63.261 -0.774 32.837Unconnected 3714 24.813*** 54.062 28.237*** 52.328 3.424* 27.725
This table reports changes of securities’ riskiness in fund-issuer pairs surrounding Moody’sdowngrade review. The sample is fund-issuer pairs with European issuers for the whole March-August 2011 period. Spread is a security’s gross yield net of one-month T-bill rate. Maturity isa security’s days-to-maturity. For each fund-issuer pair, both Spread and Maturity are averagedweighed by each security’s value in the fund’s portfolio. Holdings Risk is the weight of an issuer’sinsecure securities net of its secure securities in a fund’s portfolio. Secure securities includegovernment repo, agency repo and Treasury repo, while other types of securities belong to theinsure category. “Pre” is the period from March to May in 2011, “Post” is the period from June toAugust in 2011. ***, **,* indicate statistical significance at 1%, 5% and 10% respectively.
45

Table 9: Changes in Securites’ Risk among Different Fund-Issuer Pairs between the Pre- and Post-PeriodsSpread Maturity Holding Risk
(1) (2) (3) (4) (5) (6) (7) (8) (9)BConnected × Post 0.018 -1.250* -1.175 -1.052 -0.127 0.879 7.892 5.294 5.949
(0.779) (0.658) (0.803) (7.192) (7.029) (6.974) (5.632) (5.359) (5.298)BConnected -5.413*** -0.431 0.097 -18.411** -7.550* -0.498 -48.791*** -22.500*** -20.731***
(1.709) (0.928) (1.639) (8.353) (4.061) (6.107) (14.506) (5.494) (7.236)Post 0.549 -1.496*** 0.518 -5.538 -12.966** -5.371*** -1.858 -2.818 1.306
(1.156) (0.478) (0.599) (4.136) (5.764) (1.312) (4.301) (2.420) (2.815)Log(Fund Size) -3.494*** 0.596** -4.022*** -22.242*** 1.676* -20.605** -4.315 -3.582*** -6.500
(1.047) (0.290) (0.817) (8.250) (0.990) (8.248) (6.107) (1.105) (6.188)Net Yield (bps) 0.066 0.441** 0.072 -0.104 0.444 -0.017 0.499 -0.488 0.483*
(0.088) (0.199) (0.103) (0.380) (0.475) (0.356) (0.315) (0.495) (0.281)Age (years) -0.283 -0.015 -0.274 -1.619 0.079 -1.271 -0.066 0.218 -0.019
(0.248) (0.051) (0.259) (1.377) (0.151) (1.285) (0.848) (0.204) (0.916)Expense Ratio(bps) 0.086 0.392*** 0.086 0.178 0.479* -0.007 0.000 -0.193 0.069
(0.079) (0.098) (0.068) (0.356) (0.279) (0.347) (0.414) (0.267) (0.343)Institutional Share(%) 3.072 0.689 5.329 26.705 -0.200 16.951 9.401 3.813 5.878
(10.204) (1.683) (10.635) (36.666) (3.040) (42.034) (37.309) (4.654) (38.807)Fund Flow(bps) -0.004 -0.090** -0.009 0.054 -0.124 0.074 0.024 -0.028 -0.006
(0.025) (0.040) (0.025) (0.078) (0.145) (0.072) (0.095) (0.132) (0.099)CDS Rate(%) 1.571*** -0.541 -0.785 -8.233*** -5.061** -5.871** -3.819 -3.686** -3.554**
(0.582) (0.556) (0.483) (3.052) (2.209) (2.248) (2.480) (1.640) (1.693)Month-Fixed Effects Y Y Y Y Y Y Y Y Y
Fund-Fixed Effects Y N Y Y N Y Y N YIssuer-Fixed Effect N Y Y N Y Y N Y Y
Sponsor-Fixed Effects N N Y N N Y N N YObservations 9065 9063 9063 10812 10811 10810 10835 10834 10833
R2 0.304 0.285 0.454 0.161 0.238 0.332 0.190 0.330 0.444
The sample is fund-issuer pairs with European issuers for the whole March-August 2011 period. As defined in Table 8, the dependent variables are Spread incolumns (1) to (3), Maturity in columns (4) to (6), and Holdings Risk in columns (7) to (9). Other variables follow the same definitions in Table 6. All regressionsare at the monthly level. In the parentheses are two-way clustered standard errors at the fund- and the issuer- level. ***, **,* indicate statistical significance at 1%,5% and 10% respectively.
46

Table 10: The Comparison between Reverse Pairs and Other Fund-Issuer PairsPair Post Pre
Number Mean SD Mean SD Diff SDPanel A: Exposure (%)Reverse Pairs 500 1.577*** 1.803 1.445*** 1.860 0.132* 1.533Other Pairs 6474 2.124*** 2.382 2.110*** 2.429 -0.014 2.194Panel B: Spread (bps)Reverse Pairs 500 15.221*** 7.943 16.000*** 8.880 -0.779* 4.853Other Pairs 6474 18.655*** 12.068 19.581*** 12.284 -0.926* 6.125Panel C: Maturity (days)Reverse Pairs 500 43.642*** 53.506 51.364*** 64.691 -7.722*** 37.835Other Pairs 6474 43.208*** 48.348 50.396*** 54.084 -7.188*** 38.509Panel D: Holding Risk (bps)Reverse Pairs 500 25.109 61.080 19.372 63.261 5.737*** 30.797Other Pairs 6474 19.756*** 54.062 22.544*** 52.328 -2.788** 24.094
This table compares securities in reverse fund-issuer pairs and those in other fund-issuerpairs (excluding bilateral connected pairs with European issuers) surrounding Moody’s downgradereview. A fund-issuer pairs is called a reverse pair if, in the pre-period, the fund is sponsored byan European financial firm, and money market instruments issued by this firm are also held by theissuer’s affiliated MMFs. Exposure follows the same definition in Table 4, Spread, Maturity andHolding Risk follow the same definitions in Table 8. “Pre” is the period from March to May in2011, “Post” is the period from June to August in 2011. ***, **,* indicate statistical significanceat 1%, 5% and 10% respectively.
47

Table 11: Reciprocity: Changes in Holdings Risk(1) (2) (3) (4) (5)
Reverse Pair × Post 14.258*** 11.320*** 10.852*** 11.796*** 11.316***(4.418) (3.842) (3.685) (3.984) (3.846)
Reverse Pair -11.452 -0.672 -5.295 -4.247 -5.576(11.082) (3.734) (5.200) (7.775) (5.079)
Post -4.139** -2.379** -1.384 -0.346 -2.367**(1.799) (1.103) (1.181) (1.030) (1.101)
BConnected -27.462** -4.443 -4.483 -25.909** -5.305(13.085) (5.421) (5.465) (12.900) (5.028)
European Issuer 5.375(7.058)
European Fund Sponsor 5.369(4.525)
Log(Fund Size) 2.873 -2.601*** -0.484 2.487 -2.553***(4.306) (0.683) (3.755) (4.101) (0.684)
Net Yield (bps) 0.296 -0.518* 0.056 0.205 -0.521*(0.296) (0.276) (0.259) (0.284) (0.267)
Age (years) 0.081 0.090 0.529 0.130 0.093(0.730) (0.135) (0.717) (0.730) (0.135)
Expense Ratio(bps) 0.027 -0.176 0.012 0.035 -0.163(0.276) (0.152) (0.219) (0.266) (0.151)
Institutional Share(%) 25.141 2.681 21.836 26.900 3.391(25.697) (2.875) (22.990) (24.357) (2.873)
Fund Flow (%) 0.014 0.013 0.012 0.032 0.008(0.061) (0.087) (0.053) (0.060) (0.087)
Month-Fixed Effects Y Y Y Y YFund-Fixed Effects Y N Y Y NIssuer-Fixed Effect N Y Y N Y
Sponsor-Fixed Effects N N N Y NIssuer-Type-Fixed Effects N N N Y Y
Observations 25345 25325 25325 25345 25325R2 0.099 0.449 0.502 0.174 0.450
The sample is fund-issuer pairs (excluding bilateral connected pairs with European issuers) for the wholeMarch-August 2011 period. The dependent variables are the ratio of difference between risky and risk lessassets holdings (Holdings Risk) per fund-issuer pair. European Issuer is a dummy equal to one if theissuer is an European firm. European Fund Sponsor is a dummy equal to one if the fund’s sponsor is anEuropean firm. Other variables follow the same definitions in Table 9 and Table 10. All regressions are atthe monthly level. Reported in the parentheses are two-way clustered standard errors at the fund- and theissuer- level. ***, **,* indicate statistical significance at 1%, 5% and 10% respectively.
48

Table 12: Reciprocity: Changes in Exposure, Spread, and MaturityExposure Spread Maturity
(1) (2) (3) (4) (5) (6) (7) (8) (9)Reverse Pair × Post 0.014 0.018 0.019 0.258 -0.847 -0.701 -3.028 0.797 0.010
(0.090) (0.083) (0.083) (0.655) (0.602) (0.547) (5.193) (6.184) (5.924)Reverse Pair -0.484 -0.460** -0.052 -5.556*** -0.730 -0.851 6.821 -0.730 -3.954
(0.299) (0.194) (0.250) (1.818) (0.925) (1.232) (11.076) (6.577) (8.055)Post -0.007 -0.015 0.019 -0.436 1.323** -2.483*** -8.412*** -3.939 -3.496***
(0.056) (0.036) (0.032) (0.393) (0.545) (0.214) (2.819) (2.447) (1.318)BConnected 0.163 -0.145 -0.082 -5.674*** -1.006 -0.769 -17.746** -3.344 -0.279
(0.169) (0.245) (0.176) (1.410) (1.148) (1.113) (7.530) (3.339) (3.403)Log(Fund Size) -0.245** -0.197*** -0.180* -3.474*** 0.566** -3.434*** -13.292* 1.895** -11.340
(0.122) (0.031) (0.099) (0.893) (0.219) (0.682) (7.733) (0.770) (8.243)Net Yield (bps) -0.012* 0.006 -0.004 0.031 0.331** 0.050 0.305 0.388 0.365
(0.006) (0.011) (0.006) (0.066) (0.147) (0.057) (0.254) (0.359) (0.249)Age (years) 0.004 0.005 -0.015 -0.070 0.026 -0.092 -0.302 0.011 -0.788
(0.027) (0.005) (0.024) (0.235) (0.041) (0.187) (1.219) (0.132) (1.391)Expense Ratio(bps) -0.001 -0.006 -0.003 0.047 0.319*** 0.060 -0.105 0.602** -0.208
(0.007) (0.006) (0.006) (0.057) (0.063) (0.044) (0.351) (0.239) (0.322)Institutional Share(%) 1.514 0.129 1.322 6.833 1.409 6.306 25.654 0.817 42.845
(0.998) (0.122) (0.963) (8.553) (1.212) (8.285) (29.922) (2.412) (34.018)Fund Flow (%) -0.001 0.001 0.000 -0.009 -0.059** -0.002 0.096 0.075 0.116
(0.002) (0.004) (0.002) (0.016) (0.023) (0.015) (0.069) (0.109) (0.073)
Month-Fixed Effects Y Y Y Y Y Y Y Y YFund-Fixed Effects Y N Y Y N Y Y N YIssuer-Fixed Effect N Y Y N Y Y N Y Y
Sponsor-Fixed Effects N N Y N N Y N N YControls N N Y N N Y N N Y
Observations 25345 25325 25325 21789 21770 21770 25282 25262 25262R2 0.225 0.277 0.399 0.322 0.431 0.533 0.098 0.299 0.356
The sample is fund-issuer pairs (excluding bilateral connected pairs with European issuers) for the whole March-August 2011 period. Following the samedefinition in Table 10, the dependent variables are Exposure in columns (1) to (3), Spread in columns (4) to (6), and Maturity in columns (7) to (9). Othervariables follow the same definition in Table 11. All regressions are at the monthly level. Reported in the parentheses are two-way clustered standard errors at thefund- and the issuer- level. ***, **,* indicate statistical significance at 1%, 5% and 10% respectively.
49

Table 13: Characteristics of Issuers in Different Issuer GroupsSEuro Fund Share=0 SEuro Fund Share=1
Outstanding ($millions) 106.728 7917.022Yield 0.016 0.023
European Issuer 21 65Conglomerate 15 29
Number 130 165
This table reports characteristics of issuers in different SEuro Fund Share groups, where SEuroFund Share is decided as: SEuro Fund Share f ,i,t =
∑ f Outstanding f ,i,t×SEuro Fund f
∑ f Outstanding f ,i,t. Outstanding is the value
of each issuer’s total shares across all MMFs. Yield is the value-weighed average yield of each issuer’ssecurities. European Issuer is a dummy equal to one if the issuer comes from Europe. Conglomerate is adummy equal to one if the issuer’s financial house is a conglomerate that also owns MMFs. Number is thenumber of financial houses in each group.
50
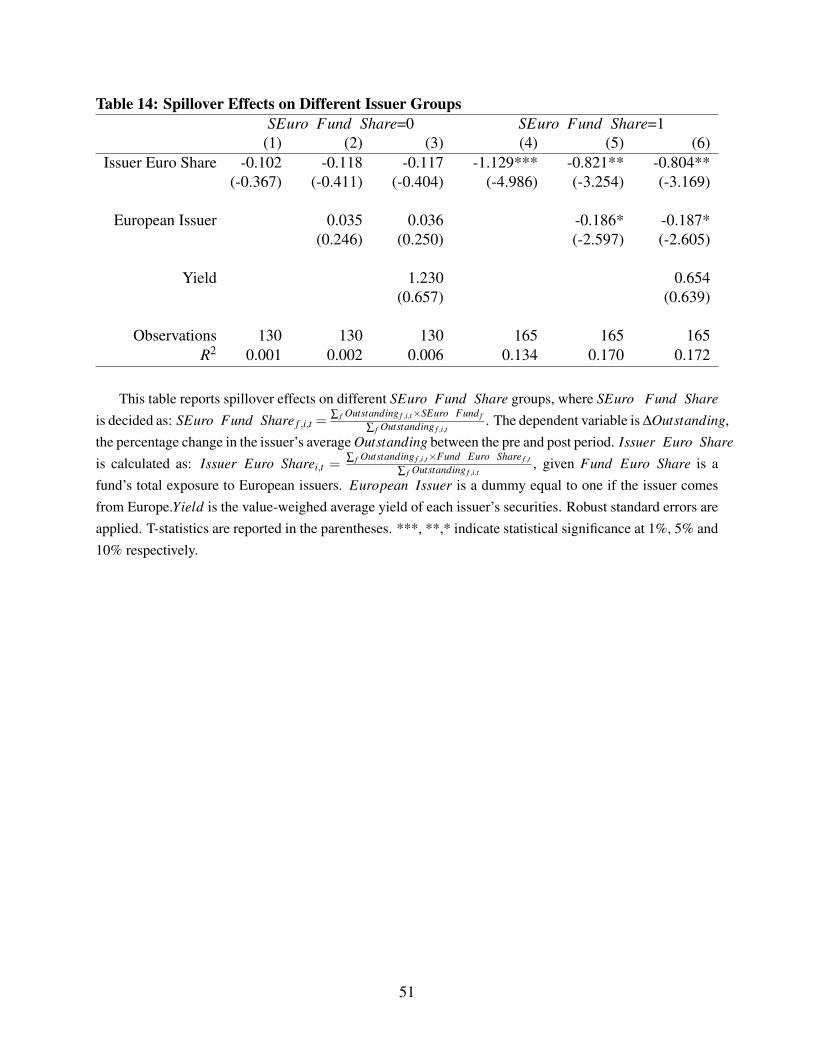
Table 14: Spillover Effects on Different Issuer GroupsSEuro Fund Share=0 SEuro Fund Share=1
(1) (2) (3) (4) (5) (6)Issuer Euro Share -0.102 -0.118 -0.117 -1.129*** -0.821** -0.804**
(-0.367) (-0.411) (-0.404) (-4.986) (-3.254) (-3.169)
European Issuer 0.035 0.036 -0.186* -0.187*(0.246) (0.250) (-2.597) (-2.605)
Yield 1.230 0.654(0.657) (0.639)
Observations 130 130 130 165 165 165R2 0.001 0.002 0.006 0.134 0.170 0.172
This table reports spillover effects on different SEuro Fund Share groups, where SEuro Fund Shareis decided as: SEuro Fund Share f ,i,t =
∑ f Outstanding f ,i,t×SEuro Fund f
∑ f Outstanding f ,i,t. The dependent variable is ∆Outstanding,
the percentage change in the issuer’s average Outstanding between the pre and post period. Issuer Euro Shareis calculated as: Issuer Euro Sharei,t =
∑ f Outstanding f ,i,t×Fund Euro Share f ,t
∑ f Outstanding f ,i,t, given Fund Euro Share is a
fund’s total exposure to European issuers. European Issuer is a dummy equal to one if the issuer comesfrom Europe.Yield is the value-weighed average yield of each issuer’s securities. Robust standard errors areapplied. T-statistics are reported in the parentheses. ***, **,* indicate statistical significance at 1%, 5% and10% respectively.
51