Embed Size (px)
Citation preview

International Journal of Marketing Studies; Vol. 5, No. 5; 2013 ISSN 1918-719X E-ISSN 1918-7203
Published by Canadian Center of Science and Education
1
Relationship between Word-of-Mouth Network and Behavioral Tendency—Preliminary Research for Local Downtown Activation
Gaowa1, Yoichi seki1 & Takayuki takarada1 1 Gunma University Faculty of Science and Technology, Kiryu, Gunma, Japan
Correspondence: Yoichi seki, Division of Electronics and Informatics, Gunma University Faculty of Science and Technology, Tenjin-cho 1-5-1, Kiryu, Gunma, Japan. Tel: 81-277-30-1806. E-mail: [email protected]
Received: June 10, 2013 Accepted: July 5, 2013 Online Published: August 6, 2013
doi:10.5539/ijms.v5n5p1 URL: http://dx.doi.org/10.5539/ijms.v5n5p1
Abstract
Considering the conversational transmission of a specific topic in human circles as a word-of-mouth (WOM) network, we enumerate two hypotheses. First, the structure of a WOM network is strongly related to the network members’ behavioral tendency concerning the topic of WOM communication. Second, if new information is acquired by some network members, it will be spread in the network. In this research, to verify these hypotheses, we conduct questionnaire surveys of two communities of students in a university, and we investigate members’ conversational relations on the topic of eating-out destinations. To understand the WOM networks, we propose some indexes—n-density, effective edge rate of word-of-mouth, and others—and the spread rate of new information is evaluated based on the results. The results will be used as preliminary data for activation of downtown Kiryu City, including restaurants.
Keywords: network graph structure, n-density, effective edge rate of word-of-mouth
1. Introduction
These days, the downtowns in most provincial cities in Japan have lost their bustle, and these circumstances have greatly impaired the regional economy. This is true of Kiryu City in Gunma prefecture, whose shopping streets downtown are an emblem of the city. In order to activate the shopping streets, we are trying to find an effective method of disseminating information to citizens to make them recognize the charm of the shopping streets again. According to our investigation of the population composition of Kiryu City, most shop owners and their customers are aging (see note 1). On the other hand, we also found that there are about 7000 high school students and about 3000 university students in Kiryu City. It means that many teenagers who are free in the daytime are in Kiryu City. Therefore, effective information dissemination for both elders and teenagers should be found. Though the internet is popular in the society of today, we believe that face-to-face word of mouth (henceforth WOM), the traditional way of disseminating information, will be more effective in this case, in which elders and teenagers are the key persons in the community. Therefore, in this research, we examine the capability of the WOM network.
The purpose of our research is to evaluate the effect of WOM in relation to the graph structure of a WOM network. First, we evaluate the relationship between the behavioral tendency of the members of the network and the WOM graph structure. Next, we evaluate the spread of new information based on the WOM graph structure. The understanding of WOM in a student community will be used as preliminary data for the activation of the shopping streets of Kiryu City.
1.1 Related Research
Problems concerning interpersonal relationship networks are addressed in many fields—such as informatics, sociology, psychology, business administration, and economics—from different viewpoints. We introduce related studies in the following two areas: interpersonal relationship networks and WOM marketing, which is an effect of those networks.
1.1.1 Interpersonal Relationship Network
Research that analyzes social networks has been conducted for a long time, for example, the famous Small World study by Milgram (1967). Lada et al. (2003) devised techniques and tools to mine internet information in two data sets and extracted social networks and the exogenous factors underlying the networks’ structure. This

www.ccsenet.org/ijms International Journal of Marketing Studies Vol. 5, No. 5; 2013
2
study found that some factors are better indicators of social connections than others and that these indicators vary between user populations.
1.1.2 WOM Marketing
In the field of marketing, WOM is examined chiefly in comparison with the mass media influence on an individual’s decision making. Rogers (2003) compares advertisement to WOM, and shows that the former has a great influence on an individual at the information-gathering stage but the latter has a big influence at the decision-making stage. Herr et al. (1991) investigated the effects of WOM communications and specific attribute information on product evaluations and found that a face-to-face WOM communication was more persuasive than a printed format but the effect was reduced or eliminated when a prior impression of the target brand was available from memory or when extremely negative attribute information was presented.
1.2 The Meaning of WOM Network in This Paper
WOM was defined by Arndt (1967) as oral person-to-person communication between a receiver and a communicator whom the receiver perceives as noncommercial, concerning a brand, product, or service. Brown et al. (1987) added that “the communicator and the receiver have a social tie.”
In this study, we use the definition of WOM mentioned above. It can be expected that the networks differ depending on the topic of the WOM. Therefore, as the social tie of the communicator and the receiver, we use the existence of conversation concerning meals in daily life as a WOM network. We investigate how information about the shopping streets spreads on this network. In this study, we check just two points. The first point is whether communicators and receivers are interested in the topic. The second point is whether each constituent of the community has a chance to have conversations exchanging information concerning the topic. Meals are a topic of concern for all students, so the network satisfies both these points. Furthermore, the network about meals can be expected to function as a WOM network concerning the shopping streets.
1.3 The Hypothesis to Be Examined
In this study, we survey the network of interpersonal relationships that exists in the real community, analyze its structure, and investigate its relation to the behavioral tendency of the constituent members. As a result, we examine the utility of WOM as an information dissemination method to activate the shopping streets. Concretely, a questionnaire survey was designed to examine the following hypothesis: First, there is a strong relationship between the structure of a WOM network and similarity of the members’ behavior concerning the topic of the network. Second, when new information is acquired by some members of the network, it will spread in the network. The usability of WOM as an information dissemination method for shopping streets activation is evaluated by assessing the degree of information spreading in a WOM network of a student community.
2. Method
2.1 The Questionnaire Survey
Questionnaire surveys with the same content were administered to 189 junior students at the Department of Computer Science (henceforth C1) and the Department of Mechanical System Engineering (henceforth C2) of Gunma University two times, in April and July. We selected junior students as the investigation object because the groups of students are clear and easy to study. Moreover, steady interpersonal relationship networks are expected for these communities because the students have been in the same department for two years. The analysis was based on the students whose answers were effective in both investigations, and the sample size is 53 for C1 and 58 for C2. The data of C1from the first and second investigations are abbreviated as C11 and C12, respectively. The data of C2from the first and second investigations are abbreviated as C21 and C22, respectively.
The survey carried a signature, and its content is as follows:
1) Eating style at the university in the daytime.
2) The names of other students that the student talked with or emailed about which restaurant to go to for meals, excluding drinking parties, in the preceding week.
3) The name of the restaurant that became the topic.
4) Living conditions, such as where the student’s home is and whether he or she has a car.
5) Whether does he or she recognize the restaurant Basho (see note 2).
After the first investigation, information about the restaurant Basho was given in a lecture to some of the investigated students of C1. Then, the appearance of the spread of the information was observed in the second investigation (Figure 1).

www.ccsenet.org/ijms International Journal of Marketing Studies Vol. 5, No. 5; 2013
3
Figure 1. Method of research
2.2 The Definition of the Graph Structure of a WOM Network
In this study, we represent a WOM network, using graph theory (for example, Gross et al. (1998)), as a directed graph whose vertexes are persons, and a directed edge from vertex A to vertex B means that person A talked to person B. We define adjacent level for a pair of vertexes in order to indicate the level of information sharing between a pair in the WOM network. Adjacent level of vertexes A and B is defined as the minimum length of paths from A to B or reverse. If there are no such paths, the adjacent level is defined as ∞.An n-path graph is defined as a graph in which all vertex pairs of adjacent level n or less are connected (Figure 2). An n-path graph of a mutually connected graph becomes a complete graph for a large enough n. If a subset of vertexes and their edges becomes a clique—a subgraph that becomes a complete graph—these persons possibly share all the information in n conversations or less. As an index of the information sharing ease of a WOM network, we define the n-density of a network as the ratio of the number of edges in an n-path graph to the number of edges in a complete graph that has the same vertexes as the original graph. Furthermore, we define transitivity and reciprocality as the auxiliary indexes of a directed network. The former is defined as the ratio of the number of shortcut edges to the number of pairs of vertexes that have a path of length 2. It means the ratio of the relations “a friend of a friend is a friend.” The latter is defined as the ratio of the number of reciprocal pairs of vertexes to the number of connected pairs. It means the ratio of relations “a friend thinks of me as a friend.” That is to say, the allowable conversation frequency means the quality of the information sharing relation.
Figure 2. N-Path graph
3. Results
3.1 The Result of WOM Network
3.1.1 Characteristics of the WOM Network Graph
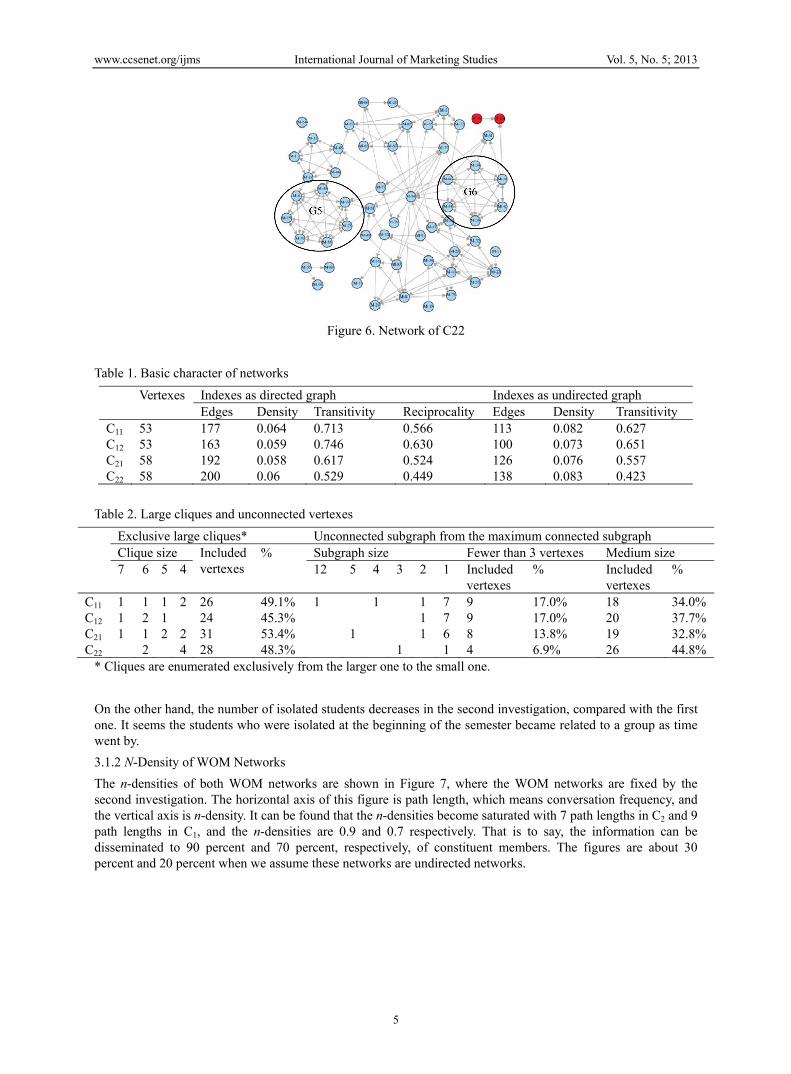
WOM networks concerning meals in each department were identified by the two investigations (Figures 3 to 6), and the characteristics of them are summarized in Table 1 and Table 2. We found that all of the 1-densities of the four networks are about 0.06 when we consider the graphs as directed graphs. There are more large cliques (size of 7) and more isolated students in C1 thanC2. Moreover, C1 has high transitivity and high reciprocality. The students in C1 divide into several groups that are highly independent of each other and are intimate in the group.

www.ccsenet.org/ijms International Journal of Marketing Studies Vol. 5, No. 5; 2013
4
Thus, C1 has a higher transitivity than C2, considered as an undirected graph. The reason for the difference between the two departments can be thought of as a result of the different types of study. The students of C1 have more one-person jobs, such as programming, and discussion, if it exists, is limited to the one-to-one type. However, the students of C2 are assigned more experiment practice, and they need to collaborate with different students. Therefore, various interpersonal relationships are composed and a uniform network is established.
Figure 3. Network of C11
Figure 4. Network of C12 (G1–G4 are 4 cliques)
Figure 5. Network of C21
www.ccsenet.org/ijms International Journal of Marketing Studies Vol. 5, No. 5; 2013
5
Figure 6. Network of C22
Table 1. Basic character of networks
Vertexes Indexes as directed graph Indexes as undirected graph Edges Density Transitivity Reciprocality Edges Density Transitivity
C11 53 177 0.064 0.713 0.566 113 0.082 0.627 C12 53 163 0.059 0.746 0.630 100 0.073 0.651 C21 58 192 0.058 0.617 0.524 126 0.076 0.557 C22 58 200 0.06 0.529 0.449 138 0.083 0.423
Table 2. Large cliques and unconnected vertexes
Exclusive large cliques* Unconnected subgraph from the maximum connected subgraph Clique size Included
vertexes% Subgraph size Fewer than 3 vertexes Medium size
7 6 5 4 12 5 4 3 2 1 Included vertexes
% Included vertexes
%
C11 1 1 1 2 26 49.1% 1 1 1 7 9 17.0% 18 34.0%C12 1 2 1 24 45.3% 1 7 9 17.0% 20 37.7%C21 1 1 2 2 31 53.4% 1 1 6 8 13.8% 19 32.8%C22 2 4 28 48.3% 1 1 4 6.9% 26 44.8%
* Cliques are enumerated exclusively from the larger one to the small one.
On the other hand, the number of isolated students decreases in the second investigation, compared with the first one. It seems the students who were isolated at the beginning of the semester became related to a group as time went by.
3.1.2 N-Density of WOM Networks
The n-densities of both WOM networks are shown in Figure 7, where the WOM networks are fixed by the second investigation. The horizontal axis of this figure is path length, which means conversation frequency, and the vertical axis is n-density. It can be found that the n-densities become saturated with 7 path lengths in C2 and 9 path lengths in C1, and the n-densities are 0.9 and 0.7 respectively. That is to say, the information can be disseminated to 90 percent and 70 percent, respectively, of constituent members. The figures are about 30 percent and 20 percent when we assume these networks are undirected networks.

www.ccsenet.org/ijms International Journal of Marketing Studies Vol. 5, No. 5; 2013
6
Figure 7. Possibility of information transmission
We consider conversations symmetric among receivers and communicators, and we assume that a reverse edge could not be investigated if there is an edge. Therefore, in the following discussion, directed graphs will be treated as undirected graphs if there is no specification.
3.2 Relationship between WOM Network and Behavioral Tendency
Table 3 and Table 4 show the results for the method of taking a meal. Main methods for lunch are using the refectory, purchasing a lunch box, and cooking in both C1 and C2. However, for dinner, most students of C1 cook by themselves, but there are a variety of methods in C2, even though cooking is the main method.
Table 3. Method for lunch (%)
Cooking Purchasing lunch box
Using refectory
Eating at a restaurant
Eating nothing
Other
C1 23.6 26.4 43.4 3.4 1.9 1.3 C2 18.9 33.5 44.2 0.9 2.5 0.0 Average 21.3 30.0 43.8 2.2 2.2 0.7
Table 4. Method for dinner (%)
Cooking Purchasing lunch box
Using refectory
Using at a restaurant
Eating nothing
Other
C1 76.2 3.2 4.7 11.9 2.5 1.5 C2 53.6 12.2 18.7 12.4 2.2 0.9 Average 64.9 7.7 11.7 12.2 2.4 1.2
3.2.1 Relationship between WOM Network and Meal Characteristics
Principal component analysis of the ratio of the methods of taking a meal was conducted based on the second investigation. Figure 8 shows an individual factor score scatter plot. Most members of the same clique, indicated by the same mark, have positions in the same quadrant in this figure. That shows a tendency for the persons to have the same eating style. This configuration may indicate that students who have a similar eating style composed the clique on a WOM network, or it may indicate that some intimate members have a high possibility of taking a meal together and so their eating styles became nearly the same. It was clarified that a strong relationship existed between the WOM network concerning meals and similarities in the behavior of taking a meal.

www.ccsenet.org/ijms International Journal of Marketing Studies Vol. 5, No. 5; 2013
7
3.2.2 Relationship between Method of Taking a Meal and Adjacent Level
Figure 9 shows the average Euclidean distance of lunch behavior and dinner behavior among individuals who are adjacent in the n-path graph of a WOM network. The horizontal axis means the effective range of information exchanging of the adjacent relationship in the network, and the vertical axis is the average behavior distance defined by
d(i, j)=
N
kjkik xx
1
2)(
Where xik is a kth factor score of eating style of the ith individual in C1 or C2. The average is taken for all edges (i, j) that compose the n-path graph.
There is a high correlation among the lunch behavior of constituent members whom the adjacent level is near in a WOM network. It is especially remarkable in C1. However, the correlation of dinner behavior was not clear. It is understood that the influence of conversation at the university on dinner behavior is restrictive.
Figure 8. Factor scores of the two department’s students methods of taking a meal
Note: ▲is G1, ■ is G2, ● is G3, ◆ is G4, ▼ is G5, × is G6, and · is the others of Figure 5.
The 1st, 2nd, and 3rd principal components are lunch box, cooking, and restaurant, respectively.

www.ccsenet.org/ijms International Journal of Marketing Studies Vol. 5, No. 5; 2013
8
Figure 9. Relationship between adjacent level and distance of lunch/dinner behavior
3.3 Change in Recognition by Spreading of Specific Information
Seven students of C1 and no students of C2 participated in an information design class between the two investigations, and information concerning a restaurant named Basho was given to them in this class, in order to find the change in recognition caused by information spreading. Basho had once been a topic in the local newspaper, so the WOM network of the students is not the only information source. If some students got to know of Basho, the cause of the change is uncertain. However, it can be determined that the difference in the recognition change between the two departments is the effect of our intervention. Table 5 summarizes the change in recognition of Basho. When we compare the improvement of recognition between the two investigations, the improvement in C2, in which there was no intervention, is only about 7%. On the other hand, in C1, in which there was positive intervention, the improvement is about 20%. The 13% difference between the two departments is thought to be an effect of the intervention.
Table 5. Change of recognition rate between two investigations
1st investigation Class participants (who already knew it)
2nd investigation Difference Number of persons who knew it
% Number of persons who knew it
% Number of persons (Class participants)
%
C2 6 10% 0 (0) 10 17% 4 (0) +67% C1 7 14% 6 (1) 17 34% 10 (5) +143%
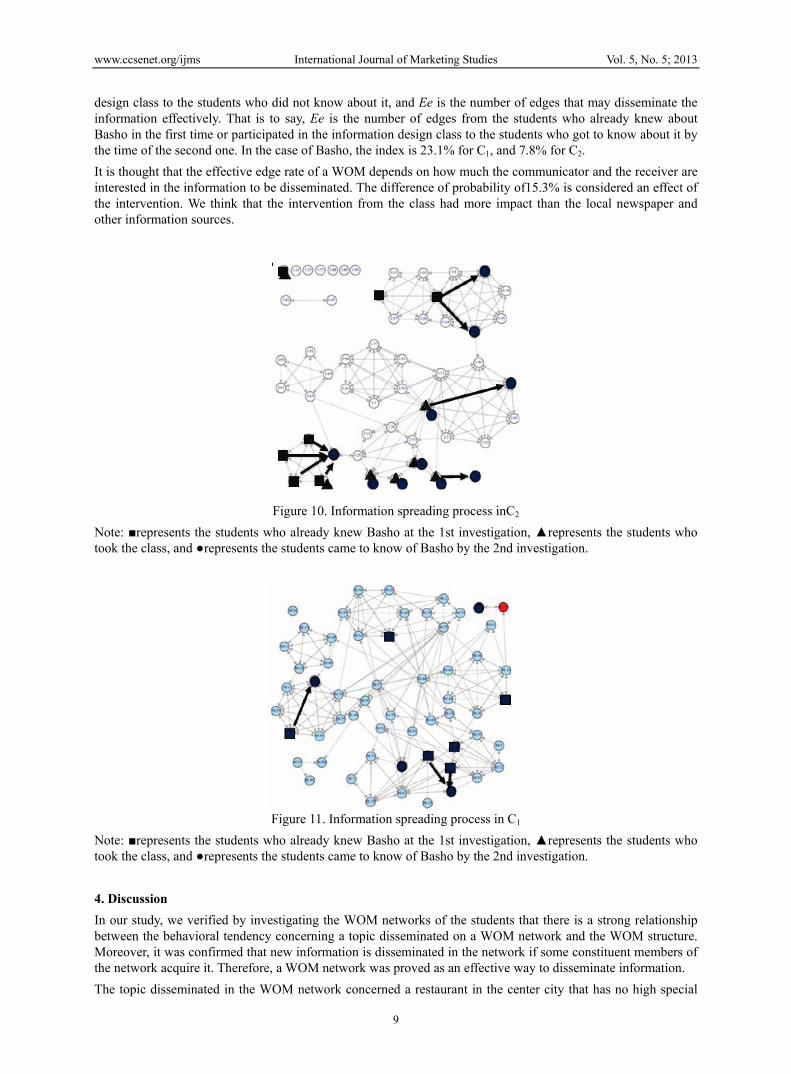
Moreover, five students—that is, half the number of students who got to know of Basho between the two investigations of C1—are not the students who participated in the information design class. It is expected that that is the result of information spreading. The detail of spreading processes is shown in Figures 10 and 11. All five students who recognized Basho newly in C1 are connected with adjacency level 1to students who had already known about Basho in the first investigation or took the information design class. On the other hand, only four students newly recognized Basho in C2. Two of them are connected to a student who had already known about Basho in the first investigation. It is highly likely that all of the students who got to know of Basho between the two investigations acquired information about it through the WOM network.
We now define the effective edge rate of WOM—that is, the rate at which new information spread to the person of adjacency level 1. The effective edge rate of WOM is defined as Ee/E in our case. E is the number of edges from the students who already knew about Basho in the first investigation or participated in the information
www.ccsenet.org/ijms International Journal of Marketing Studies Vol. 5, No. 5; 2013
9
design class to the students who did not know about it, and Ee is the number of edges that may disseminate the information effectively. That is to say, Ee is the number of edges from the students who already knew about Basho in the first time or participated in the information design class to the students who got to know about it by the time of the second one. In the case of Basho, the index is 23.1% for C1, and 7.8% for C2.
It is thought that the effective edge rate of a WOM depends on how much the communicator and the receiver are interested in the information to be disseminated. The difference of probability of15.3% is considered an effect of the intervention. We think that the intervention from the class had more impact than the local newspaper and other information sources.
Figure 10. Information spreading process inC2
Note: ■represents the students who already knew Basho at the 1st investigation, ▲represents the students who took the class, and ●represents the students came to know of Basho by the 2nd investigation.
Figure 11. Information spreading process in C1
Note: ■represents the students who already knew Basho at the 1st investigation, ▲represents the students who took the class, and ●represents the students came to know of Basho by the 2nd investigation.
4. Discussion
In our study, we verified by investigating the WOM networks of the students that there is a strong relationship between the behavioral tendency concerning a topic disseminated on a WOM network and the WOM structure. Moreover, it was confirmed that new information is disseminated in the network if some constituent members of the network acquire it. Therefore, a WOM network was proved as an effective way to disseminate information.
The topic disseminated in the WOM network concerned a restaurant in the center city that has no high special

www.ccsenet.org/ijms International Journal of Marketing Studies Vol. 5, No. 5; 2013
10
fascination for the students. However, new recognition of it was found as a result of the intervention in the WOM network. Therefore, a new way to increase recognition of the shopping streets could be to make known to some students the fascination of the shopping streets by letting them join some event or cooperate with a shop owner. Then information about the shop should be expected to be disseminated to the students who are adjacent to the ones who already know about it through a WOM network. That is to say, using the WOM network effectively can be expected to affect the consumption behavior of a young person. In addition, the shopping streets will be bustling with visits of young persons, and that will be a way to create downtown activity.
Only dissemination to students of adjacent level 1 from the students who experienced intervention was observed in our study. We might observe wider dissemination if the topic has a more interesting style.
The following are problems for analysis. First, in this study, all of the observed conversational relations were treated as the same closeness for dissemination of information. However, it is thought that the possibility of information dissemination is greatly influenced by the strength of the interpersonal relationship. Therefore, the next step is to make a model of the effective edge rate of WOM by measuring the conversational relationship quantitatively and the impact of topics. Second, it can be thought that a topic is saturated in the entire WOM network if the effective edge rate of WOM for a topic is high and the WOM network has high density. Thus, another topic is finding the conditions to produce a large prevalence in a WOM network, applying percolation theory.
Acknowledgments
The research described here was conducted as part of a project named “Construction of the Town of Kiryu for the Future with Anti-Global-Warming through Regional Power” supported by the Japan Science and Technology Agency (JST).
We would like to thank Kosaku Kojima for his data analysis. We would also like to thank Professor Kenji Amagai, Professor Seiichi Shiga, and Professor Yoshihide Hosokawa for their support and the students for their cooperation in the survey.
References
Adamic, L. A., & Eytan, A. (2003). Friends and neighbors on the web. Social Networks, 25(3), 211–230. http://dx.doi.org/10.1016/S0378-8733(03)00009-1
Arndt, J. (1967). Role of product related conversations in the diffusion of new product. Journal of Marketing Research, 4, 291–293. http://dx.doi.org/10.2307/3149462
Brown, J. J., & Reingen, P. H. (1987). Social ties and word-of-mouth referral behavior. Journal of Consumer Research, 14(3), 350–362. http://dx.doi.org/10.1086/209118
Czepiel, J. A. (1974). Word-of-mouth processes in the diffusion of a major technological innovation. Journal of Marketing Research, 11(2), 172–180. http://dx.doi.org/10.2307/3150555
Gross, J., & Yellen, J. (1998). Graph Theory and Its Applications. CRC Press.
Herr, P. M., Kardes, F. R., & Kim, J. (1991). Effects of word-of-mouth and product-attribute information on persuasion: An accessibility-diagnosticity perspective. Journal of Consumer Research, 17(4), 454–462. http://dx.doi.org/10.1086/208570
Milgram, S. (1967). The small world problem. Psychology Today, 1(1), 62–67.
Rogers, E. M. (2003). Diffusion of Innovations. New York: Free Press.
Notes
Note 1. Several questionnaire surveys were administered as part of the project “Construction of the Town of Kiryu for the Future with Anti-Global-Warming through Regional Power” and supported by Kiryu City and the Kiryu Chamber of Commerce and Industry. One of them, in order to know the condition of the shopping streets, was given to owners in 11 shop unions and resulted in 208 valid responses with a41% recovery percentage. It gathered data about each shop, its customers, the shopping street, the management situation, and other conditions and found problems that included the aging of the owners in the shopping street. A detailed analysis will be given in another paper.
Note 2. Basho is a European-food restaurant with a long history. It is an unobtrusive presence for the locals because it is in an alley in the city centre. But it became a topic nationwide when a wall painting by Shiko Munakata, a famous painter in Japan, was foundhidden in the wall several years ago. Yet, local young people are not aware of the restaurant although customers come from far away. Also, it is not a good choice for lunch for

www.ccsenet.org/ijms International Journal of Marketing Studies Vol. 5, No. 5; 2013
11
university students because its distance from the university is more than 1 kilometer.
Copyrights
Copyright for this article is retained by the author(s), with first publication rights granted to the journal.
This is an open-access article distributed under the terms and conditions of the Creative Commons Attribution license (http://creativecommons.org/licenses/by/3.0/).