Embed Size (px)
Citation preview

Deanship of Graduate Studies
Al-Quds University
Relationship between Helicobacter pylori infection and
ABO/Lewis blood groups and secretor status in Palestine
Ola TalalAbdallahKarmi
M. Sc. Thesis
Jerusalem - Palestine
1434 Hijri/ 2013 AD

II
Relationship between Helicobacter pylori infection and
ABO/Lewis blood groups and secretor status in Palestine
Prepared by:
Ola TalalAbdallaKarmi
B. Sc. Medical Technology, Al-Quds University, Palestine
Supervisor: Dr. Mahmoud A. Srour
Co-Supervisor: Dr. Samir Barghouthi
A thesis submitted in partial fulfillment of requirements for the
degree of Master in Medical Laboratory Sciences/ Hematology
Track, Faculty of Health Professions – Al-Quds University.
1434 Hijri / 2013 AD

III
Al-Quds University
Deanship of Graduate Studies
Department of Medical Laboratory Sciences
Thesis Approval
Relationship between Helicobacter pylori infection and
ABO/Lewis blood groups and secretor status in Palestine
Prepared by: Ola TalalAbdallaKarmi
Registration Number: 20913734
Supervisor: Dr. Mahmoud A. Srour
Co-Supervisor: Dr. Samir Barghouthi
Master thesis submitted and accepted, Date:
The names and signatures of examining committee members are as follows:
1. Head of committee: Dr. Mahmoud Srour ………………………..
2. Internal Examiner: Dr. Khalid Younis ………………………..
3. External Examiner: Dr. JohnyAmer ………………………..
4. Committee member: Dr. Samir Barghouthi ………………………..
Jerusalem - Palestine
1434 Hijri /2013 AD

IV
Declaration:
I certify that this thesis submitted for the degree of Master, is the result of my
own research, except where otherwise acknowledged, and that this study (or
any part of the same) has not been submitted for a higher degree to any other
university or institution.
Signed:
Ola TalalAbdallahKarmi.
Date: 01-06-2013

V
Dedication:
I dedicate my work to my beloved parents who supported me all the way long, and to my
lovely sisters Abeer, Areen, Ahd and Iman.
Also I dedicate this to all my teachers and supervisors who lightened the way with their
wisdom, patience and knowledge.

VI
Acknowledgments:
I am very thankful for everyone who helped in finishing this work and collecting the
subject samples.
Many thanks for Augusta Victoria Hospital who provided the working place for testing the
samples.
I extend my thanks to Dr. Soliman Al-Tarifi who provided access and facilitated collection
of samples from his patients at his clinic at the Out-patients clinics, Palestine Medical
Complex in Ramallah.
Many thanks to Dr. RiadShreem at the Pathology Laboratory at Biet-Jala Hospital who
provided us with thehistopathology results for patients participating in this study.
Sincere thanks to Dr. RaedTiety who provided access and facilitated collection of samples
from his patients at his clinic in Hebron city.
Especial thanks for Dr. Niveen Abu Rmeileh; From Beir-Zeit University, Epidemiology
Department who helped in the statistical analysis of the research results.

VII
Abstract:
The red blood cell membrane antigens have been associated with several diseases as well
as susceptibility for specific pathogens. Since Helicobacter pylori (H.pylori)infections
have been noted to be associated with different red blood cell antigens, several reports
have been conducted to identify potential host factors that may increase the risk for
symptomatic infection with this pathogen.
This study aimed to investigate the relationship between symptomatic/successful H. pylori
infections and ABO/Rh(D), Lewis antigens and secretor status in infected patients.
This is a case-control study. Eighty three patients who experienced symptomatic H. pylori
infection and eighty five control subjects were analyzed for their gender, body mass index
(BMI), smoking habits, drug intake, different environmental pollutants, water source and
quantity of water intake, spicy food intake, ABO blood group, Rh(D) type, Lewis blood
phenotype, and secretor status. The association of the different variables with H. pylori
infection was analyzed statistically by Chi-square test.
Analysis of the control subjects for H. pylori specific IgG, revealed that 98% of them were
positive, although they have never experienced symptoms of infection (asymptomatic).
Comparison of the patients’ and control groups, showed a statistically significant
association between H. pylori infection and BMI, drug intake, amount of water intake,
Lewis phenotype and secretor property. While comparison of the study groups, showed no
statistically significant association between H. pylori infection and gender, drinking water
source, spicy and chilly food intake, smoking, exposure to environmental pollution and
ABO/Rh group.

VIII
In conclusion, there is a high rate of asymptomatic infection with H. pylori among
Palestinian subjects. H. pylori infection is influenced by host and environmental factors.

IX
Table of Contents:
Pages:
Thesis Approval ............................................................................................................................. III
Declaration: ..................................................................................................................................... IV
Dedication: ....................................................................................................................................... V
Acknowledgments: ......................................................................................................................... VI
Abstract: ........................................................................................................................................ VII
Table of Contents: .......................................................................................................................... IX
List of Tables: ............................................................................................................................... XII
List of Figures: ............................................................................................................................ XIII
List of Appendices ....................................................................................................................... XIV
List of Abbreviations .................................................................................................................... XV
Chapter One: ................................................................................................................................ 1
1. Introduction: ......................................................................................................................... 1
1.1. Red blood cell antigens: ............................................................................................... 2
1.1.1. ABO blood group system: .................................................................................... 4
1.1.2. Rh blood group system: ....................................................................................... 7
1.1.3. Lewis (Le) blood group system: .......................................................................... 7
1.1.4. ABH soluble substances: ...................................................................................... 8
1.2. Frequency of blood group antigens: ........................................................................... 8
1.3. Blood group antigens and disease association: .......................................................... 9
1.4. Literature Review: ...................................................................................................... 10
1.5. Objectives of the Study: ............................................................................................. 14
Chapter Two: .............................................................................................................................. 16
2. Materials and Methods: ..................................................................................................... 16
2.1. Materials: .................................................................................................................... 16
2.2. Methods: ...................................................................................................................... 17
2.2.1. Questionnaire: ..................................................................................................... 17
2.2.2. Study Samples: .................................................................................................... 18
2.2.3. Blood and Saliva Samples: ................................................................................. 19
2.2.4. Blood Grouping: ................................................................................................. 19

X
2.2.4.1. Procedure: ....................................................................................................... 19
2.2.4.2. Interpretation of results: ................................................................................ 20
2.2.4.3. Stability of the Reactions: .............................................................................. 20
2.2.5. Determination of the Secretor Property: .......................................................... 21
2.2.5.1. Procedure: ....................................................................................................... 21
2.2.5.2. Interpretation: ................................................................................................ 21
2.2.6. H. pylori IgG ELISA: .......................................................................................... 22
2.2.6.1. Principle of the assay: ..................................................................................... 23
2.2.6.2. Assay Procedure: ............................................................................................ 24
2.2.6.2.1. ELISA testing: .......................................................................................... 24
2.2.6.2.2. Assay Validation: ..................................................................................... 24
2.2.6.2.3. Calculation of IgG titer: .......................................................................... 25
2.2.6.2.4. Interpretation of Results: ........................................................................ 25
2.2.6.2.5. Specific Performance Characteristics:................................................... 26
2.2.6.2.5.1. Precision: ........................................................................................... 26
2.2.6.2.5.2. Diagnostic Specificity: ...................................................................... 26
2.2.6.2.5.3. Diagnostic Sensitivity: ...................................................................... 26
2.2.6.2.5.4. Analytical Sensitivity: ....................................................................... 26
2.2.6.2.5.5. Interferences: .................................................................................... 27
2.2.7. Statistical analysis: ............................................................................................. 27
Chapter Three: ........................................................................................................................... 28
3. Results: ................................................................................................................................ 28
3.1. Study samples: ............................................................................................................ 28
3.1. Age: ................................................................................................................................... 30
3.2. Gender: ........................................................................................................................ 31
3.3. Body Mass Index (BMI): ............................................................................................ 32
3.4. Smoking Habits: ......................................................................................................... 34
3.5. Drugs intake: ............................................................................................................... 35
3.6. Exposure to pollution: ................................................................................................ 36
3.7. Water source and intake: ........................................................................................... 37
3.8. Consumption of spicy Food: ...................................................................................... 38
3.9. Correlation of ABO and Rh(D) phenotypes to H. pylori infection: ........................ 39
3.10. Lewis Antigens and Secretor status: ..................................................................... 41

XI
3.10.1. Inheritance of Lewis Antigens: .......................................................................... 41
3.10.2. Inheritance of secretor gene: ............................................................................. 42
3.11. H. pylori IgG:........................................................................................................... 45
Chapter Four: ............................................................................................................................. 46
4. Discussion: ........................................................................................................................... 46
4.1. Serological Detection of anti- H. pylori IgG: ............................................................ 47
4.2. Age: .............................................................................................................................. 49
4.3. Gender: ........................................................................................................................ 50
4.4. Source of drinking water: .......................................................................................... 50
4.5. Water intake: .............................................................................................................. 50
4.6. Pollution and Smoking Habits: ................................................................................. 51
4.7. Consumption of Spicy food: ....................................................................................... 52
4.8. Drug intake: ................................................................................................................ 52
4.9. Body Mass Index (BMI): ............................................................................................ 53
4.10. ABO and Rh: ........................................................................................................... 53
4.11. Lewis Antigens and Secretor Status: .................................................................... 54
4.12. Conclusion: .............................................................................................................. 55
4.13. Future Work: .......................................................................................................... 56
5. References: .......................................................................................................................... 57
Appendices ...................................................................................................................................... 65
Abstract in Arabic: ......................................................................................................................... 69

XII
List of Tables:
Pages:
Table 2.1.: Materials used in this study……………………………………………………….....17
Table 2.2: ABH Substances in Saliva……………………………………...…………………..…22
Table 3.1.: Distribution of patient and control subjects by place of residence…………...…...30
Table 3.2.: Correlation of BMI values with weight status……………………………………...33
Table 3.3.: Patients’ and control subjects distributed according to their BMI groups………33
Table 3.4.: Water intake patients and control groups…………………………………..………38
Table 3.5.: Consumption of spicy food by patients’ and control groups………………………39
Table 3.6.: Prevalence of ABO and Rh (D) phenotypes among patients and control
groups………………………………………………………………………………………….......40
Table 3.7.:Prevalence of Rh (D) phenotypes among patients and control
groups……………………………………………………………………………………..……….41

XIII
List of Figures:
Pages:
Figure 1.1: Type 1 and 2 H precursor chain……………………………………….…………......5
Figure 1.2: The composition of O blood group on the RBC membrane…………………...……5
Figure 1.3: Formation of Blood Group A antigen and formation of Blood Group B
in..……………………………………………………………………………………………………6
Figure 2.1: H. pyloriIgG ELISA Calibration Curve……………………………………………25
Figure 3.1.: Age distribution for patients and control groups…………..…….…….………….31
Figure 3.2.: Gender distribution for patients and control groups…….………..….…………..32
Figure 3.3.: Patients’ group versus control group percentages distributed according to BMI
(Kg/m²) values………...…………………………………………………….……………………..34
Figure 3.4.: Distribution of patients’ and control groups by smoking habits…………………35
Figure 3.5.: Distribution of patients and control groups based on their drug intake………...36
Figure 3.6.: Exposure of patients’ and control groups (%) to environmental pollution……..37
Figure 3.7.: Distribution of Lewis system phenotypes for patients’ and control groups…......42
Figure 3.8.: Comparison of the secretor status between patients’ and control groups……….43
Figure 3.9.: Secretor status versus ABO/Rh(D) groups of patients’ and control groups...…..44

XIV
List of Appendices
Pages:
Appendix A: Study Questionnaire………………………...…………………………….65
Appendix B: Consent Form……………………………………………..……………….67
Appendix C: Comparison of patient and control group with age match……………..68

XV
List of Abbreviations
Abbreviations:
Abbreviation Word
RBCs Red Blood Cells
Rh Rhesus
LW Landsteiner-Wiener
K Kell
Le Lewis
Se Secretor
OMPs Outer Membrane Proteins
H. pylori Helicobacter pylori
HRP Horse Radish Peroxidase
TMB Tetramethylbenzidine
χ² Pearson’s Chi-Square
BMI Body Mass Index
CDC Centers for Disease Control and Prevention
WHO World Health Organization
ELISA Enzyme Linked Immuno- Sorbent Assay

1
Chapter One:
1. Introduction:
Cells are the basic structural units in all living organisms. Although cells may share many
common characteristics, they may perform different functions due to the difference in their
protein-synthesizing ability and their different surrounding environment which may affect
their gene expression. The cell membrane is concerned with accurately and sensitively
identifying molecules involved in cell compartmentalization especially controlling the
interface between the cell and the environment (Gallagher, 2007, Erica et al., 2010).
Red blood cells (RBCs) are the primary cells in the human body and are essential in gas
transportation process. Scientists grouped humans into four blood groups depending on the
presence of one (A) or another (B) or both (AB) or none (O) of the antigens on their RBCs.
The importance of most blood group antigens had been recognized by the immunological
complications of blood transfusion or pregnancies. However; the molecular structure and
function of the RBC antigens remained undefined for many decades. Recently due to the

2
advances in molecular genetics and cellular biochemistry resulted in an abundance of new
information of the structure and function of the RBC surface molecules (Lichtman et al.,
2007;Pourazar, 2007; Lin et al., 2009).
During the twentieth century many researchers including membrane biochemists and
molecular geneticists showed interest in studying the membrane proteins expressed on the
surface of the RBCs. These studies have revealed the structure and the function of some of
these antigens. Additionally, several studies have revealed that some of the RBC antigens
are used as cellular receptors for different pathogens and support their life cycles and
pathogenesis. Viruses, bacteria and parasites were found using certain RBC antigens as
receptors for these pathogens and support their cycle to cause different diseases such as
examples of pathogens that bind RBCs include Escherichia coli, Parvovirus B19,
Helicobacter pylori and Plasmodium falciparum (Pourazar, 2007; Anstee, 2010;
Yamamoto et al., 2012).
1.1. Red blood cell antigens:
The RBC membrane is about 1% of the total weight of the cell. The membrane has a
primary role in RBC integrity and together with its skeleton provides the RBCs with their
flexibility, durability and tensile strength (Lichtman et al., 2007). RBCs have drawn the
attention of scientists for hundreds of years; a major discovery regarding these cells was
the elucidation of the RBC surface antigens and their role in blood transfusion (Pasini etal.,
2010). Since the discovery of human blood groups by Landsteiner in 1901, the genetics,
serology, and biochemistry of the RBCs and blood group antigens were extensively
studied. Recently the biological functions of some of these antigens were discovered
(Lewis et al., 2006).

3
The cell membrane of human cells contains a large assortment of molecules including
specific receptors responsible for cell-cell signal transduction and the interaction of each
cell with its surrounding environment (Leninger, 2003).Since 1980 efforts were directed
towards gene cloning and sequencing of the genes encoding known blood groups and
identifying proteins anchoring them in the cell membrane (Anstee, 2011). Many of the
RBC membrane glycoproteins express certain blood group activity as a result of variation
in their oligosaccharides or amino acid sequences. The clinical relevance of blood group
antigens in the practice of blood transfusion has led to extensive analysis of the red cell
surface. Additionally; most genes encoding the different blood group systems have been
cloned (Burton et al., 2011).
There are about 30 blood antigen systems recognized on the RBCs (Anstee, 2011). A
group of red cell antigens is determined either by a single genetic locus or closely linked
loci, such loci are directly or indirectly responsible for forming protein or carbohydrate
epitopes presented as glycoproteins or glycolipids (e.g. ABO, Lewis, P). Protein-defined
antigens aredirectly encoded by genesthat follow Mendelian inheritance. These proteins
are inserted into cell membrane in one of three ways; single pass, multipass, or linked to
phosphatidylinesitol (GPI-linked). Antigens defined as blood group antigens are generally
found on RBCs and many other tissues except for the erythroid specific antigens including
Rhesus (Rh), Landsteiner-Wiener (LW), Kell (K) and MNSs (Lewis et. al., 2006).
Over the years RBC antigens were identified and blood group gene products can be
schematically divided into five functional categories: i) receptors for exogenous ligands
like viruses, bacteria and parasites e.g. P glycolipid is the receptor for Parvovirus B19 on
the surface of the erythroid progenitors, also glycoconjugates carrying Lewis antigen (Leᵃ)
specificity bind Bordetella pertussis and Staphylococcus aureus toxins; ii) adhesion
molecules e.g. Knops antigens that are responsible for binding and transporting of
C3B/C4b coated immunocomplexes; which is also a specific binding of IgG; iii)
membrane transporters and channels e.g. the product of Diego blood group gene which is

4
the exchanger of HCO3-/Cl- and Kidd protein that mediates urea transport or the Colton/
aquaprorin-1 protein which mediates water transport; iv) enzymes e.g. Kell glycoprotein
antigens that play a role in erythropoiesis, also have a part in Zn- metalloproteinases; and
v) structural proteins e.g. the Diego blood group gene product have a role as a membrane
skeleton linkage and Gerbich antigen that have a role in RBC shape and integrity
(Pourazar, 2007; Lin et al., 2009).
1.1.1. ABO blood group system:
The ABO antigens are formed as a result of interaction of three independent loci (ABO, Hh
and Sese). These genes code for specific glycosyltransferases that in turn add an
immunodominant sugar to a precursor substance type 1 or type 2. Precursor substance type
1 refers to a β 1-3 linkage between galactoseand N-acetylglucosamine while it is in type 2,
the bond between galactose and N-acetylglucosamine is β 1-4 linkage. Structures of ABO
antigens are illustrated in Figure 1.1. In red cell precursors, the Hh gene (FUT1) is located
on chromosome 19 and codes for the α-2-L fucosyltransferase which adds fucose to
precursor substance type 2 generating the H antigen (Figure 2). While in the epithelial the
Sesegene (FUT2) codes for α-2-L fucosyltransferase that adds fucose to precursor
substance type 1 converting it to H substance (Figure 1.2) (Harmening, 2005; Lewis et al.,
2006). The expression of A and B antigens (Figure1.3) is determined by the H gene that
along with type 2 precursor give rise to the basic structure that is needed to form the A or
B antigens. A and B genes are located onto chromosome 9, the A gene encodes for the
enzyme α-3-N-acetyl-D-galactosamine which adds the N-acetylgalactoseamine onto the H
antigen, while the B gene encodes for the enzyme α-3-D-galactosyltransferase which adds
the D-galactose onto the H antigen. This modification converts the H antigen into A or B
antigens or even A and B antigens together in a heterozygous individual; when both genes
are inherited along with the FUT1 gene. When both alleles are inactivated, this will give
the O blood group phenotype marked by the expression of H antigen on the cells.
Mutations inFUT1 gene give rise to the Oh Bombay phenotype (Figure 1.2), in which the
red cells show the O blood group phenotype and their plasma contains Anti-H antibodies.

5
On the other hand, this may prevent the expression of A or B antigens since there is no H
precursor, consequently, anti-A and/or anti-B antibodies will be seen in the Bombay
phenotype plasma (Harmening, 2005; Lewis et al., 2006).
Figure 1.1: Type 1 and 2 H precursor chain.
Figure 1.2: The composition of O blood group on the RBC membrane.
Moreover, von Dungern (1911) described the presence of two different A antigens which
are A1 and A2, later this classification into A1 and A2 was found to account for almost
99% of all A group individuals. A1 blood group accounts for about 80% of all group A
while A2 accounts for around 19% of group A. Other weakAsubgroups are rare and
contribute less than 1% of A group. The A1 and A2 groups differ in the extent to which
their respective enzymes change the H antigen, which in turn is found in four different
structures differing in their branching patterns. There are also different subgroups of the B
antigen; but they are considered to be less important than the A subgroupsthe antigens can

6
be arranged according to their immunogenicity in the following order:
O>A2>A2B>B>A1>A1B(Harmening, 2005; Lewis et al., 2006).
Figure 1.3: Formation of Blood Group A antigen in (a) and formation of Blood Group B in
(b).
The A, B and H antigens are expressed in the early fetal development but they are not
being fully developed at birth and they reach their adult levels one year postpartum and
remain constant for life with slight reduction in the elderly (Harmening, 2005; Lewis et al.,
2006).

7
Defining the nucleotide sequences of the cloned genes and predicting the amino acid
sequences of the encoded proteins helped in determination of the three-dimensional
structures which are vital for understanding the nature of the blood group epitopes and
their cellular functions in cell-cell interaction (Burton et al., 2011).
1.1.2. Rh blood group system:
The Rhesus (Rh) blood system is encoded by three closely linked loci (RHD, RHCE,
RHAG) present on chromosome 1. The RHCE gene encodes the Rh C/c and Rh E/e
antigens and the RHD gene encodes the Rh D antigen. There is no “d” allele and the letter
“d” is used to indicate the absence of Rh D antigen. Since the most immunogenic antigen
is the D antigen, it is convenient and practical to classify individuals as D positive or D
negative (Harmening, 2005; Lewis et al., 2006).
1.1.3. Lewis (Le) blood group system:
Another important blood group system is the Lewis (Le) system which is considered a
unique system since it is the only one that is not manufactured by the red blood cells but
manufactured by tissue cells. The Le gene is located on chromosome 19 at the FUT3 locus;
and it is linked to the Hh and Secretor (Se) genes. This Le gene encodes for α-4-L-
fucosyltransferase, which transfers L-fucose to a special precursor chain oligosaccharide
on glycoprotein or glycolipid structures. Leᵃ phenotype is produced when Le gene is
segregated from Se gene. The Leᵇ phenotype is produced when both Le and Se genes are
present. Le gene is required for the production of either Leᵃ or Leᵇ phenotypes. The
inheritance of the Le gene acts in competition with ABO genes adding L-fucose to the
special sugar precursor that is manufactured by tissue cells. The final structure which is a
soluble antigen is secreted and adsorbed or acquired by RBCs, lymphocytes, and platelet
membrane. The antigen is also found on cells of pancreas, stomach, intestine, skeletal
muscles, renal cortex, and adrenal glands. The frequency of Lewis phenotypes is: (72%)

8
forLe(a-,b+), (22%) for Le(a+,b-) and (6%) for Le(a-,b-). Additionally, the
phenotypeLe(a+,b+) is rarely produced as a result of a mutation in the FUT2 gene which is
SewA385T. The phenotype associated with the SewA385T mutation is partially secretor
(Henry et al., 1996; Harmening, 2005; Lewis et al., 2006).
1.1.4. ABH soluble substances:
In 1930, the classification of individuals into secretors and non-secretors has been
established according to the ability of an individual to secret soluble ABH blood group
antigens. The ABH antigens and their precursor on blood cells and platelets are present on
other tissue cells and are differentially found in secretor body fluids such as saliva, urine,
tears, semen, breast milk and gastric juice. The FUT2 or Secretor (Se) gene on
chromosome 19 is used to classify individuals as secretors when they have the genotype
(SeSe or Sese) or non-secretors when they have the genotype (sese). The FUT2 gene codes
for a α-1, 2-L-fucosyltransferase which adds L-fucose to a precursor substance to generate
the H substance. The H substance is then modified by the A or B enzymes generating the
A and B soluble antigens, respectively. The secretor enzyme is active in mucus membranes
and glands and is responsible for the secretion of blood group antigens in the different
body fluids. The majority of the population (80%) expresses the secretor phenotype, while
the remaining 20% expresses the non-secretor phenotype (Harmening, 2005; Lewis et al.,
2006; Jaff, 2010).
1.2. Frequency of blood group antigens:
Determining the frequency of each blood group antigen is very important for clinical
aspects so there are many studies to determine them all over the world. In Palestine, the
frequency of ABO blood groups in West Bank region were found to be as follows: O
41.2%, A 39.5%, B 11.4% and AB 7.9% (Al-Kawasmi, 2011). Similar results were
reported in the West bank region by Shtayeh et al., (1988), and in Gaza Strip by Skaiket. al.

9
(2007). These results are closely similar to frequency of ABO blood groups in different
countries worldwide with slight variation between the A and O blood groups (Bashwari et
al., 2001; Hassan, 2010; Eweidah et al., 2011). However, the frequency of Rh(D) positive
is about 80% and the frequency of Rh(D) negative is about 20% worldwide (Magen David
Adom, 2013; Bashwari et al., 2001; Skaik et al., 2007;Eweidah et al., 2011).
1.3. Blood group antigens and disease association:
Many studies have found strong correlations between individual’s susceptibility to some
diseases and secretor status. There are clear relationship between infectious diseases and
inherited polymorphism in genes encoding and regulating the expression of ABH and
Lewis antigens in the body secretions. The most important pathogens that may have this
correlation are Helicobacter pylori (H. pylori), norvovirus, cholera infections, and malaria
(Anstee, 2010; Yamamoto et al., 2012; Valliani et al., 2013). H. pylori is considered a
major human pathogen, it is a gram negative spiral bacterium. It’s estimated that H. pylori
has infected one half of the world’s population. H. pylori infections are most likely
affected by host and environmental factors. Diseases described by H. pylori and related
species include peptic ulcer, chronic gastritis, adenolymphoma, lymphoma, stomach
malignancies, gastric, hepatic and colon cancers. Some of H. pylori strains are associated
with gastroesophageal reflux disease (Appelmelk, 2000; Jonge et al., 2004; Barghouthi,
2009).
The clinical outcome of H. pylori infection is determined by the complex interaction
between the bacterium and the host (Torres et al., 2008). Bacterial adherence to gastric
epithelial cells may protect the bacterium against peristalsis and mucosal shedding and
warrants access to nutrients that are released from damaged epithelia. Putative outer
membrane proteins (OMPs; AlpA, AlpB, BabA, SabA, Oip A and HopZ) are associated
with adhesion of the bacterium to host cells (Jonge et al., 2004; Torres et al., 2008). H.
pylori developed its ability to adhere to different host receptors; some of its OMPs bind to

10
fucosylated blood group antigens e.g. BabA, while others may bind to sialytated Le blood
group antigens (located on epithelial cells). There is evidence that the dynamics of mucosal
glycosylation is a response to this bacterial infection that may cause a modulation in the
expression of adhesion molecules as a response to the changes in the host mucosa
(Mcguckin et al., 2007; Sheu et al., 2007; Linden et al., 2008; Torres et al., 2008;
Yamamoto et al., 2012; Valliani et al., 2013). In the early stages of colonization, OMPs of
the bacterium bind to certain cellular antigens in the mucosa, this is followed by changing
the environment and antigen expression which may increase binding (Mcguckin et al.,
2007; Torres et al., 2008).
The mechanism of persistent infection of H. pylori is not clearly understood. Molecular
mimicry between bacteria and human gastric environment, adaptation to host, the
induction of autoreactive antibodies, or gastric damage may all be involved in colonization.
One of the most important antigens that are expressed by human cells and play a major
role in the host-parasite interaction is the Le blood group antigens that are normally present
on the human gastric mucosa cells and on the lipopolysaccharide chains of H. pylori (Sheu
et al., 2007).
1.4. Literature Review:
Hirszfeld and Hirezfeld in 1919 were the first to point out the differences in the
distribution of blood groups among different populations. The ABH antigens were shown
to be widely expressed by all body cells including RBCs as described (Anstee, 2010).
One of the most obvious and significant associations between blood group type and
diseases are A, B and AB groups which have a higher risk to arterial and venous
thromboembolisms while the O-group population has a lower risk. These studies are
supported by the finding that non-group O patients have higher levels of von Willebrand
factor and coagulation factor VIII. The O blood group was noticed to have reduced

11
Plasmodium falciparum infections compared to non-O blood groups; on the other hand
Vibreocholerae and Escherichia coli infections were found to be more severe in O blood
group patients than non-O blood groups (Anstee, 2010). Although some diseases are more
induced by secretors such as influenze viruses, rhinoviruses, respiratory syncytial virus and
echoviruses (Raza et al., 1991), there are other pathogens that are more sensitive in non-
secretor population such as Haemophilusinfluenzae, Neisseria meningitidis, Streptococcus
pneumoniae and urinary tract infections caused by Escherichia coli (Sheinfled et al.,
1989).
One of the first observed associations between blood group phenotypes with disease was
blood group O and peptic ulceration. H. pylori which is considered to be the causative
agent for peptic ulceration and gastric cancer was strongly associated with blood group O,
Lewis antigens especially Le(a-b+) phenotype and secretor property, especially that there
are evidence demonstrated that Leᵇ antigen acts as a receptor for H. pylori, this antigen is
most frequently found on O blood group compared to other groups (Anstee, 2010; Jaff et
al., 2011; Yamamoto et al., 2012; Valliani et al., 2013). Another study showed a
correlation between this infection and blood group O with a nonsecretor phenotype
property (Jaff et al., 2011).
Worldwide,H. pylori cause the most common chronic infections; despite the advances in
understanding its biology, the factors that determine the outcome of infection are still
poorly understood. Host factors might seem to be very important in the outcome of these
infections since only a proportion of infected subjects develop ulcers, while the bacterial
factors have a role in influencing the inflammatory response and the development of a
more severe infection (Wu et al., 2003; Jafarzadeh et al., 2007).
Several studies found that the lipopolysaccharides of certain strains of H. pylori outer
membrane contains molecules that share molecular similarity with different antigens
expressed on the human gastric mucosa. For example, H. pylori synthesize polysaccharides

12
that have close similarity to the Le blood group antigens especially Lex and Leʸ
(Magdalena et al., 1998; Hynes et al., 2000; Monteiro et al., 2000).
When H. pylori colonize the human host it binds to the gastric mucin, rather than directly
to muocosal epithelium protecting itself from luminal acidity and shedding. Le antigens
expressed by H. pylori may mediate the adhesion and colonization of bacteria by
suppressing the immune response against the bacterium so it may play a role in certain
autoimmune aspects of pathogenesis. These similarities could potentially allow the
bacterium to escape immunity and mediate the bacterial attachment by depending on the
expression of Le antigens on the human gastric epithelium. Due to structural similarity of
bacterial Le antigens and that of the host Le antigens, production of cross reacting immune
response with human gastric mucosa and with different gastric proton pumps is manifested
as an autoimmune disease (Magdalena et al., 1998; Hynes et al., 2000; Monteiro et al.,
2000; Harvey et al., 2010) that may relate to carcinogenesis.
Alternatively, H. pylori may induce a humoral response in infected subjects, however this
humoral response does not protect against the pathogen (Magdalena et al., 1998).
For more than four decades the association between H. pylori and blood antigens is known
but received little attention (Harvey et al., 2010). Lewis associated antigens that may have
a primary role in H. pylori adherence are carbohydrates related biochemically to the ABO
blood groups and carried on both glycoproteins and glycolipids and comprise type 1 (Lea ,
Leᵇ) and type 2 (Lex, Leʸ) carbohydrates. The determinants of Le antigens are
oligosaccharides synthesized by the sequential addition of sugar units to oligosaccharide
chains by fucosyltransferases that are synthesized by Hh, Se, and Le genes. Lea and Leᵇ
antigens synthesized on type 1 precursor’s oligosaccharides chains that are expressed on
the digestive and respiratory tracts and in secretions. Lex and Leʸ antigens synthesized on

13
type 2 are expressed on erythrocytes and vascular endothelial cells (Lee et al., 2006;
Harvey et al., 2010; Yamamoto et al., 2012; Valliani et al., 2013).
This antigen expression in the digestive organs is biologically more important than the
expression on the erythrocytes, due to its role in mediating bacterial adherence and
attachment that is considered to be essential steps in the initiation, establishment and
maintenance of the infection and monoclonal antibodies to Leᵇ inhibit this adhesion (Lee et
al., 2006; Valliani et al., 2013).
Martiuset al. (2006) observed a significant increase of blood group phenotypes O, A2 and
Le(a-,b+) in Brazilian patients with H. pylori infections. Increased H. pylori infection was
more observed among secretors compared to non-secretors. In contrast, Rio Preto et al.
(2002) found that there is no correlation between H. pylori infection and O blood group,
neither Lewis antigens nor secretor status among Brazilian patients.
Kanbay et al. (2005) found a strong correlation between A and O blood groups, and the
Le(a-,b+) phenotype and H. pyloriinfection. The presence of Le(a-,b+) in A, B and AB
blood groups was associated with failure of H. pylori to bind to the gastric mucosa, while
the association of A blood group with the gastric ulcer and carcinoma was not explained.
Furthermore patients with AB blood group were less positive for H. pylori infections and
this was the first indication of a negative relationship between H. pylori infections and AB
blood group. The authors also found a correlation between age and the seroprevalance
infections of H. pylori. Additionally, H. pylori infection among females was higher
compared to males. In addition smokers were found to be more susceptible than non-
smokers (Kanbay et al., 2005). In another study by Jaff et al. (2011) female gender was
also found to have more risk factor for this infection rather than males and B blood group
have more protective effect than other groups, and age of infection is mainly during
14
childhood and early adolescence increasing to reach its peak at 31 years old (Jaff et al.,
2011).
In Turkey, Bayan et al. (2009) reported a relationship between blood group O, Le(a-,b+)
and adherence of H. pylori by using its adhesion protein BabA (Bayan et al., 2009). A
study by Linden et al. (2008) was performed on Rhesus monkeys originating from south
Asia found that monkeys were susceptible to H. pyloriinfection when their bloodgroup was
B along with secretor gene status (Linden et al., 2008). These results were also confirmed
by several other studies using different a methodologies (Loffeld et al., 1991; Clyne et al.,
1997; Keller et al., 2002; Turkolmez et al., 2007).
On the other hand,some studies did not observe any relationship between blood group
phenotype and H. pylori infections (Loffeledet al., 1991; Clyneet al., 1997; Keller et al.,
2002; Seydaet al., 2007) and concluded that H. pylori infection neither depends on the
expression of different blood groups nor on the expression of Le antigens on the RBCs or
on epithelial cells of the gastric mucosa.
Several studies have investigated the association between ABO/ Rh blood groups, Lewis
system and secretor status and H. pylori infection. The finding of these studies showed
contradictory results in different countries and races. However, such information
concerning the Palestinian patients are not yet available.
1.5. Objectives of the Study:
H. pylori infection is common among most populations. Several studies have been
conducted to investigate the correlation between H. pylori infection and blood groups.
However, these studies have reported controversial results and did not yield a conclusive

15
result about this issue, which may be attributed in part to the ethnicity of the studied
population, the different frequencies of blood groups and other environmental factors. In
Palestine, there is a lack of local studies on this issue although high prevalence of H. pylori
infection was reported. The investigation of the relationship between H. pylori infection
and certain blood groups may help to shed some light on the susceptibility of Palestinian
population to this infectious agent and the severity of infection and consequently improve
prevention and management of infection.
Therefore, the main objective of this study is:
To investigate the relationship between symptomatic/successful H. pylori infections on one
hand and ABO/Rh(D), Lewis antigens, A1 and A2 subgroups, and secretor status in the
Palestinian patients compared to other studies on the other hand.

16
Chapter Two:
2. Materials and Methods:
2.1.Materials:
All materials used in this study are listed in Table 2.1.

17
Table 2.1: Materials used in this study.
Item Catalog
number Manufacturer/ Country
Plain Tubes
EDTA Tubes
0.9% Saline
Baxter- BAC II(Blood Bank)
Centrifuge
Plastic Test Tubes 75X12 mm
Volumetric Pipettes Thermo Finepipette
Human Anti-A 600010 Lorne Laboratories Limited
Human Anti-B 610010 Lorne Laboratories Limited
Human Anti-D 740010 Lorne Laboratories Limited
Human Anti-A1 116005 Lorne Laboratories Limited
Human Anti-H 115002 Lorne Laboratories Limited
Human Anti-Leᵃ 630002 Lorne Laboratories Limited
Human Anti-Leᵇ 631002 Lorne Laboratories Limited
Swinging Centrifuge (Kubota
5100)
Clean Cups
Washed RBCs A-cells
Washed RBCs B-cells
Washed RBCs O-cells
Nova Tec Anti- IgG H. pylori
ELISA Kit HELG0220
ImmunodiagnosticaGmbh
Germany
BioTech ELISA Reader
2.2.Methods:
2.2.1. Questionnaire:
A questionnaire was prepared for this study and aimed to collect information from the
study samples (patients and controls) concerning socioeconomic information,
anthropometric indices, and medical history. The questionnaire form is shown in Appendix
A. The questionnaire form also contained a consent form in Appendix B; each subject
participating in the study was asked to read and sign this form.

18
2.2.2. Study Samples:
Subjects were grouped into two groups, the patients’ group and control group.
Patients’ group: The patients’ group contained individuals who were diagnosed to have
Helicobacter pylori infection due to symptomatic disease, and were receiving medication
to treat their disease. In this group the diagnosis of H. pylori infection was confirmed by
histopathology examination of gastric biopsy.
Patients presenting at the Gastroscopy clinics at Hebron and Ramallah Hospital/ Palestine
Medical Complex in Ramallah, either for assessment or confirmation of H. pylori infection
were asked for participation in the study and have given a written consent form. Gastric
biopsies were sent to the Pathology department at BietJala Hospital in BietJala for
Histopathology examination. Samples that tested positive for H. pylori infection by
Histopathology examination were retained for further analysis (patient’s group) while
those which tested negative were excluded from the study. All subjects were non-relatives
in order to eliminate other genetic correlations. The patients’ group contained 83 subjects
from different Palestinian cities. Samples of blood and saliva were collected between
January 2012 and November 2012.
Control group: This group contained individuals who never contracted symptoms of H.
pylori infection, never had stomachache for a long period of time, or never been tested for
H. pylori infection.
These individuals were from different institutes and they were not related to each other or
to the patients in order to eliminate any other genetic correlations. The control group
contained 85 subjects from different Palestinian cities.Samples of blood and saliva were

19
collected during the same period as for the patients’ group. All subjects who accepted to
participate in this study were asked to give a written consent.
2.2.3. Blood and Saliva Samples:
All subjects (patients’ and controls) who accepted to participate in this study were asked to
fill the study questionnaire, sign the consent form and donate a blood and saliva samples.
Blood was collected into one EDTA and one plain tube, and saliva into clean cups. To
enhance secretion of saliva, subjects were given a sugarless gum (Orbit) and asked to chew
it for 3 minutes before collecting the saliva sample. Saliva was collected into wide mouth
clean cups, kept at 4ºC and was processed within 24 hours. EDTA whole blood was kept
at 4ºC and used for blood grouping within 24 hours. Blood samples collected in plain
tubes, were allowed to stand at room temperature for 1 hour and then centrifuged at 5000
rpm for 5 minutes in a fixed-angle centrifuge; serum was harvested and stored at -25ºC
until use.
2.2.4. Blood Grouping:
2.2.4.1.Procedure:
Typing for the ABO, Rh(D) and Lewis antigens was performed using the tube method.
Four drops of EDTA whole blood were washed 3X in sterile saline (0.09% NaCl), then
washed RBCs were resuspended in sterile saline to give 2-5% RBCs suspension. Five test
tubes were labeled with A, B, D, Lea and Le
b and one drop of blood grouping sera (anti-A,
anti-B, anti-D, anti-Leᵃ and anti-Leᵇ) was placed in the appropriately labeled tubes then an
equal volume of 2-5% RBCs suspension was added to each tube. Contents were mixed
gently and for Lewis blood antigens typing, the respective test tubes (anti-Leᵃ and anti-Leᵇ)
were incubated at room temperature for 15 minutes. All tubes were centrifuged using the

20
immediate spin program (1000 rpm for 20 seconds, Baxter, BAC II blood bank centrifuge).
Every individual that was positive for anti-A was retyped with Anti-A1 to differentiate A1
antigens from A2 antigens.
2.2.4.2.Interpretation of results:
1. Positive: Agglutination of RBCs within the accepted limitations of the test
procedure indicated the presence of the particular antigen on the tested RBCs.
2. Negative: No agglutination of test RBCs constitutes a negative result and within
the accepted limitations of the test procedure, this will indicates the absence of
the particular antigen on the tested RBCs.
2.2.4.3.Stability of the Reactions:
1. RBCs were tested for antigens within 24 hours in order to have good results, as
long storage may cause poor detection of certain antigens especially Leᵃ and
Leᵇ.
2. Testing of blood group antigens was done using the recommendations of the
manufacturer of the typing sera.
3. Tests were read immediately after centrifugation because delays result in
dissociation of antigen- antibody complexes leading to false negative or weak
positive reactions.
4. Every negative macroscopically result of the Rh testing was confirmed
microscopically, because certain antigens show very weak reaction that
couldn’t be identified macroscopically.

21
2.2.5. Determination of the Secretor Property:
2.2.5.1.Procedure:
The secretor property was determined using the Hem-agglutination method. Human
polyclonal ani-A, anti-B and anti-H sera were diluted by titration against appropriate cells
at immediate spin using saline. The appropriate dilution that gave +2 agglutination was
selected for further use in this procedure. For anti-A and anti-B the appropriate dilution
was 1:40, while for anti-H it was 1:2. Two to three mL Saliva sample was placed into a
clean test tube. Saliva tubes were centrifuged at 900-1000 rpm for 8-10 minutes.The
supernatantwas transferred into a clean glass test tube; cap was closed properly, and then
placed into a boiling water bath for 10 minutes. Boiling is used to inactivate enzymes that
might destroy blood group substances.Then all tubes were re-centrifuged at 900-1000 rpm
for 8-10 minutes and the supernatant was collected into a clean tube.Then the supernatant
was then diluted 1:5 with saline. Undiluted saliva contains nonspecific glycoproteins that
can inhibit antisera and leads to incorrect results.One drop of diluted saliva was mixed with
one drop of the diluted antisera (anti-A, anti-B and anti-H) in the appropriately labeled
tube. Tubes were mixed well and incubated at room temperature for 8-10 minutes.To the
saliva-antisera mixture, one drop of the appropriate indicator cells (2-5% washed cell
suspension of A, B or O cells) was added to the properly labeled tube.All tubes were
mixed well and incubated at room temperature for 30- 60 minutes, after this tubes were
centrifuged using immediate spin program (1000 rpm for 20 seconds) using the blood bank
centrifuge, and all agglutination results were examined macroscopically.
2.2.5.2.Interpretation:
1- Non-Secretor: Agglutination of RBCs by antiserum- saliva mixture in all three
tubes (Table 2.2.).

22
2- Secretor: No agglutination of RBCs by antiserum and saliva mixture. The
antiserum has been neutralized by the soluble blood group substances or antigens in
the saliva. Therefore, no free antibody is available to react with the antigens on the
reagent RBCs used in the testing. This negative reaction is a positive test for the
presence of ABH-soluble antigens and indicates that the individual is a secretor
(Table 2.2.).
Table 2.2: ABH Substances in Saliva.
ABH substances in saliva
ABO Group A B H
Secretors
A Much None Some
B None Much Some
O None None Much
AB Much Much Some
Non-Secretors
A, B, O and AB None None None
2.2.6. H. pyloriIgG ELISA:
The IgG antibody against H. pylori was determined in the serum of control group using the
Nova Tec kit (ImmunodiagnosticaGmbh), a commercially available ELISA (Enzyme
Linked Immuno-Sorbent Assay) kit, was used for the determination of the IgG class
antibodies against H. pylori in serum samples. This kit can be used for qualitative and
quantitative determination of the IgG class against this bacterium. In the present study it

23
was used for quantitative determination of the antibody.The anti-H.pyloriIgG was
determined in the serum of control subjects only to test for their previous asymptomatic
exposure to the bacterium.
2.2.6.1.Principle of the assay:
The quantitative determination of the H. pyloriIgG antibody was performed according to
the manufacturer’s instructions. In the Nova Tec ELISA kit the H. pylori antigens are
coated on the microtiter wells and are used to bind the anti- H. pyloriIgG antibodies in the
serum. After washing the wells to remove all unbound sample material, horseradish
peroxidase (HRP) labeled anti-human IgG conjugate is added. This conjugate binds to the
captured Helicobacter specific antibodies. The immune complex formed by the bound
conjugate is visualized by adding Tetramethylbenzidine (TMB) substrate which gives a
blue reaction product.
The intensity of this product is proportional to the amount of Helicobacter specific IgG
antibodies in the specimen. Sulphuric acid is added to stop the reaction. This produces a
yellow endpoint color. Absorbance at 450 nm is read using ELISA microwell plate reader.
All reagents and materials required for the ELISA wereprovided with the kit and were
prepared per the manufacturer recommendations.

24
2.2.6.2.Assay Procedure:
2.2.6.2.1. ELISA testing:
Serum samples of control group were thawed at room temperature, diluted 1+100 with IgG
diluent and mixed using a vortex mixer.Substrate Blank well was kept as a reference for
the assay.One-hundred ul of each standard (A, B, C and D) and diluted samples were
dispensed into the respective wells. Wells were covered with foil and incubated at 37°C for
one hour. After incubation the foil was removed and the fluid in the wells were aspirated
and discarded.Each well was washed three times with 300 ul of washing solution and
soaking of wells each time for more than 5 seconds. Then one-hundred ul of H. pylori anti
IgG conjugate was dispensed into all wells except the blank well. Wells were covered with
foil and incubated at room temperature for 30 minutes. Wells were washed three times as
described in the previous step. One-hundred ul of TMB substrate solution was dispensed
into all wells and microtiter plate was incubated for 15 minutes at room temperature in the
dark. To stop the reaction, 100ul of the stop solution (sulphuric acid) was added onto the
wells in the same order and rate of the TMB substrate solution. The absorbance of the
specimens was measured at 450/620 nm within 30 minutes after addition of the stop
solution. The absorbance was read using the BioTech ELISA reader.
2.2.6.2.2. Assay Validation:
In order to consider the assay valid, the following criteria were applied per the
manufacturer’s instructions:
- Substrate Blank absorbance < 0.100.
- Standard A concentration= 0 NTU/mL, has absorbance < 0.200.
- Standard B concentration= 15 NTU/mL, has absorbance > 0.200.
- Standard C concentration= 75 NTU/mL, has absorbance > 0.500.
- Standard D concentration= 150 NTU/mL, has absorbance > 1.100.

25
Standard A< Standard B< Standard C< Standard D.
2.2.6.2.3. Calculation of IgG titer:
To obtain a quantitative result measured by NTU/mL, the mean of standards’ absorbance
(A, B, C and D) was blotted on a Linear/ Linear graph, the standard calibration curve
(Figure 2.1).
Figure 2.1: H. pyloriIgG ELISA Calibration Curve.
2.2.6.2.4. Interpretation of Results:
Values provided by the kit as guidelines:
Reactive: >20 NTU/mL.
Gray zone (equivocal): 15- 20 NTU/mL.
Non-reactive: < 15 NTU/mL.
0, 0.009
15, 0.268
75, 0.724
150, 1.103
0
0.2
0.4
0.6
0.8
1
1.2
0 20 40 60 80 100 120 140 160
Ab
sorb
ance
Concentration (NTU/mL)

26
2.2.6.2.5. Specific Performance Characteristics:
2.2.6.2.5.1.Precision:
a- Interassya: CV%= 5.1%.
b- Intraassay: CV%= 6.5%.
2.2.6.2.5.2.Diagnostic Specificity:
The diagnostic specificity is defined as the probability of the assay to score negative in the
absence of the specific analyte. For this kit it is 92.0% (95% confidence interval 0.84-
0.99).
2.2.6.2.5.3.Diagnostic Sensitivity:
The diagnostic sensitivity is defined as the probability of the assay to score positive in the
presence of the specific analyte. For this kit it is 94.4% (95% confidence interval 0.87- 1).
2.2.6.2.5.4.Analytical Sensitivity:
The analytical sensitivity is defined as the apparent concentration of the analyte that can be
distinguished from the Zero calibration. For this kit it is 3 NTU/mL.

27
2.2.6.2.5.5.Interferences:
Interferences with hemolytic, lipemic or icteric serum are not observed up to a
concentration of 10 mg/mL hemoglobin, 5 mg/mL Triglycerides and 0.2 mg/mL bilirubin.
These interferences were considered while running the assay for the control group.
2.2.7. Statistical analysis:
All data are shown as mean ± SD. Statistical analysis was performed using the SPSS
software (version IBM SPSS statistics 20.Ink).
All variables were tested by Pearson’s Chi-square (χ²) test which calculates the goodness
of fit and independency between variables, and were evaluated using the P-value.P-value
less than 0.05 was considered statistically significant.

28
Chapter Three:
3. Results:
3.1.Study samples:
Several host and environmental factors influence the outcome of Helicobacter
pyloriinfection. Some of the complex factors of interaction between the bacterium and the
host (Torres et al., 2008) were targeted in this study to show their correlation and
interaction with the bacterial colonization and disease complications. These factors were
tested statistically for their significant association with H. pylori infection. Patients and
control groups were analyzed for their age, gender, body mass index (BMI), smoking
habits, chronic drug intake, different environmental pollutants, water source and quantity
of water intake, spicy food intake, ABO blood group, Rh system type, Lewis blood
phenotype, and secretor status. Two groups of patients (symptomatic) and control
(asymptomatic), were compared for different variables, statistical correlation of these

29
variables were tested. Data analyses were performed using Pearson’s Chi-Square test to
study the association between the study variables and H. pylori infection.
Subjects (n=83) of the patients’ group were diagnosed to have the infection mainly by
histopathological examination of stomach biopsies(60 samples, 72.3%), testing for serum
H. pylori specific IgA (20 samples, 24.1%) or bytesting for H. pylori specific antigens in
stool (3 samples, 3.6%). Patients are thoseexperienced symptomatic H. pylori infection and
have received or were receiving the triple antibiotic therapy that contains tetracycline,
metronidazole and bismuth subsalicylate as a treatment at the time of sample collection
(Graham et al., 1992). On the other hand, controls were selected from different institutes
and had volunteered to participate in the study; they were healthy and did not experience
symptoms of H. pylori infection such as abdominal pain or continuous burning abdominal
pain(Hawkey et al., 2005). This group was tested for asymptomatic exposure to H. pylori
by serological testing for anti-H. pyloriIgG antibodies in their sera.None of the control
group subjects had been previously tested positive for H. pylori nor did they receive any
treatment for this purpose.
Both study groups were collected from different Palestinian geographic areas (Jenin,
Nablus, Qalqelia, Ramallah, Jerusalem, Bethlehem and Hebron. These subjects were
categorized into three geographic groups; north, central and south regions of West Bank,
Palestine, as shown in Table 3.1. Patients and control groups were non-kin (not related) in
order to exclude genetic variables.

30
Table 3.1: Distribution of patient and control subjects by place of residence.
Residence place Patients’ group Control group
No. % No. %
North region (Jenin, Nablus,
Qalqelia) 13 15.7 6 7.1
Central region (Ramallah,
Jerusalem) 38 45.8 46 54.1
South region (Bethlehem,
Hebron) 32 38.6 33 38.8
Total 83 100 85 100
3.1. Age:
The average age of the patients’ group was 37.6 years (SD= 14.4), while that of the control
group was 27.3 years (SD= 10.5). The main deviation in the age mean was due to the low
response rate in older age subjects to participate in this study. Although, this difference
was statistically significant (P=0.000), it had no association with the level of exposure to
H. pylori (H. pylori infection). This difference in age between the whole study groups has
no effect on all variable investigated in this study except for the amount of water intake
and source of water. Statistical analysis of a subset of 43 subjects matched for age and
gender showed no difference among analyzed variables except for water intake (amount
and source) see Appendix C.
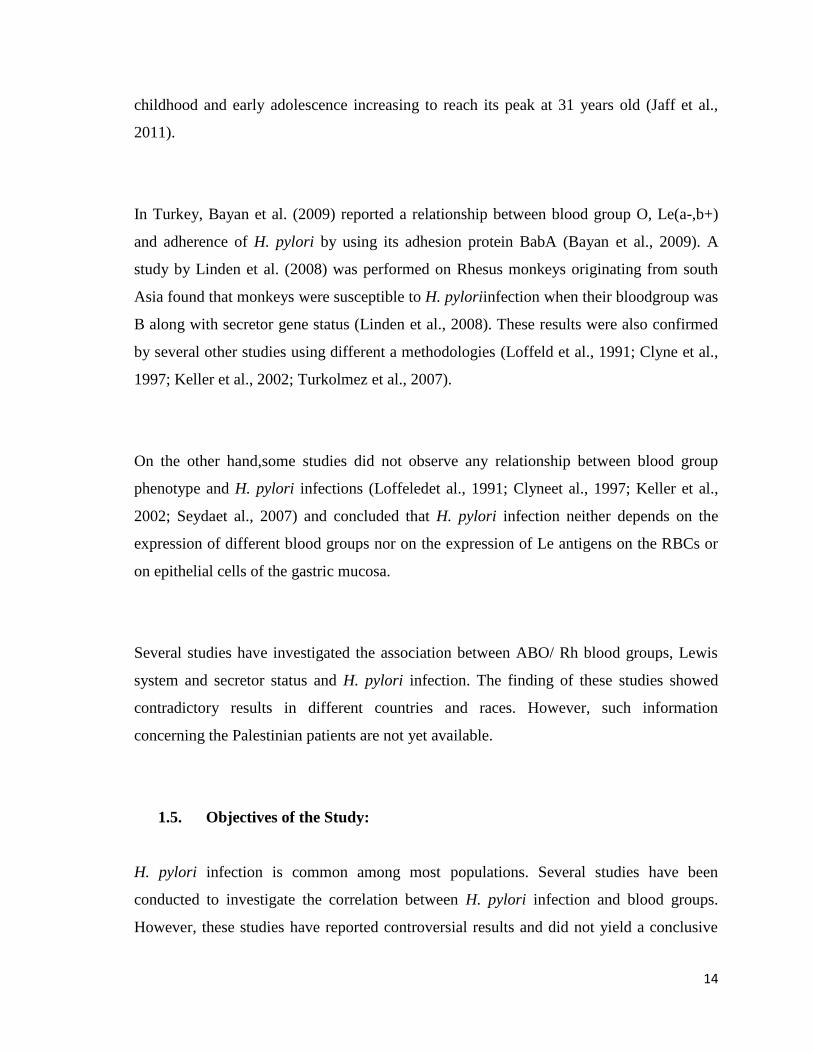
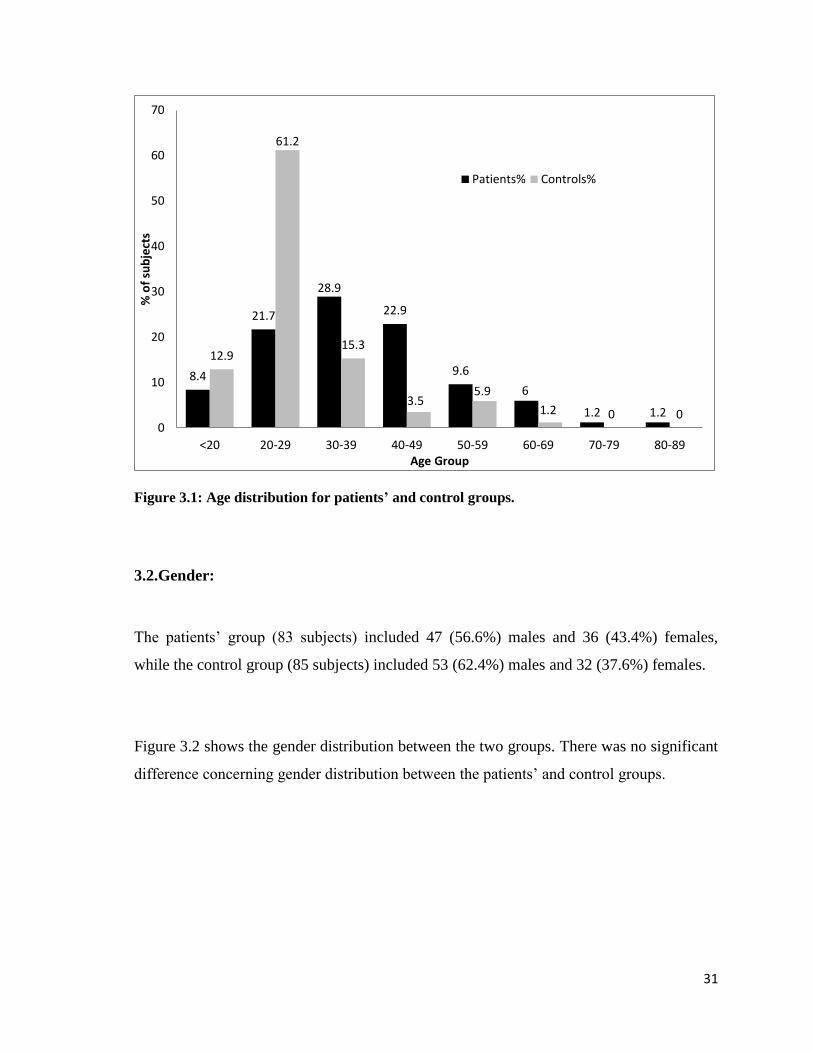
The age distribution for patient and control subjects is illustrated in Figure 3.1.
31
Figure 3.1: Age distribution for patients’ and control groups.
3.2.Gender:
The patients’ group (83 subjects) included 47 (56.6%) males and 36 (43.4%) females,
while the control group (85 subjects) included 53 (62.4%) males and 32 (37.6%) females.
Figure 3.2 shows the gender distribution between the two groups. There was no significant
difference concerning gender distribution between the patients’ and control groups.
8.4
21.7
28.9
22.9
9.6
6
1.2 1.2
12.9
61.2
15.3
3.5 5.9
1.2 0 0 0
10
20
30
40
50
60
70
<20 20-29 30-39 40-49 50-59 60-69 70-79 80-89
% o
f su
bje
cts
Age Group
Patients% Controls%

32
Figure 3.2: Gender distribution for patients and control groups.
3.3.Body Mass Index (BMI):
Body mass index (BMI) is the main indicator used to describe the weight problems in
humans, overweight and obesity may reflect certain life style for individuals and may
increase risk for certain factors to induce diseases and health problems. To calculate the
BMI for subjects in this study, height and weight measures were collected for each
contributor then BMI was calculated according to the following Rowland’s formula
(Rowland et al., 1990):
BMI (kg/m2) = weight (Kg)/ [Height (m) X Height (m)].
Values of BMI were grouped as recommended by the Centers for Disease Control and
Prevention (CDC), Atlanta, Georgia, USA and the World Health Organization (WHO) as
reproduced in Table 3.2 (WHO, 2004; CDC, 2013; WHO, 2013). The BMI for the
patients’ and control group is shown in Table 3.3.
57%
43%
Patients' group Male Female
62%
38%
Control group Male Female

33
Table 3.2: Correlation of BMI values with weight status. (WHO, 2004; CDC, 2013; WHO,
2013).
BMI Values Weight Status
≤ 18.4 Underweight
18.5- 24.9 Normal
25.0- 29.9 Overweight
≥30 Obese
Table 3.3: Patients and control subjects distributed according to their BMI groups.
When comparing both groups, using Pearson’s Chi-Square test, a significant difference
was observed (P= 0.033), specifically in the normal weight category. Indeed, although the
mean BMI (27.2 kg/m2) of the patients’ group was in the overweight category, while the
mean BMI (24.7 kg/m2) of the control group was in the normal weight category; this
reflects the fact that more than half (57.6%) of the control subjects are in the normal
weight category,there was no significant difference obtained from the patients versus
control groups. Figure 3.3 shows the different percentages of both groups distributed
according to BMI.
BMI Values Weight Status Patient No. (%) Control No. (%) P- value
≤ 18.4 Underweight 3 (3.7%) 6(7.1%) >0.05
18.0- 24.9 Normal 30 (36.6%) 49 (57.6%) 0.033
25.0- 29.9 Overweight 28 (34.1%) 19 (22.4%) >0.05
≥30 Obese 21 (25.6%) 11 (12.9%) >0.05

34
The relative reduction in the number of patients from normal BMI category in favor of
overweight and obese categories reflects the increased risk of H. pylori infecting among
overweight and obese subjects.
Figure 3.3: Patients’ group versus control group percentages distributed according to BMI
(Kg/m²) values.
3.4.Smoking Habits:
Every subject participated in this study was categorized as smoker or non-smoker. A
smoker was defined as one who smoked any type of smoking materials for more than two
months within the last two years. Among the patients’ group 26 (31%) subjects were
smokers and 57 (69%) subjects were non-smokers. While in the control group25 (29.4%)
subjects were smokers and 60 (70.6%) subjects were non-smokers (Figure 3.4). Using
3.7
36.6 34.1
25.6
7.1
57.6
22.4
12.9
0
10
20
30
40
50
60
70
≤18.5 18.5-24.9 25-29.9 ≥30
% o
f su
bje
cts
BMI Values
Patient % Control %
P= 0.033

35
Person’s Chi-square, no statistically significant difference was observed between the
patients’ and control groups when compared for smoking habits.
Figure 3.4: Distribution of patients’ and control groups by smoking habits.
3.5.Drugs intake:
Each subject in this study was evaluated for different drug intake other than the triple-
antibiotic therapy for H. pylori. Drugs that were considered in the questionnaire include
those that were used by the study subjects for more than 2 months before the appearance of
symptoms of H. pylori infection such as blood pressure controlling drugs, diabetes drugs,
and others. From the patients’ group, 45 subjects (54.2%) were taking drugs and 38
subjects (45.8%) were not. In the control group only 5 subjects (5.9%) were using drugs
and 80 (94.1%) were not (Figure 3.5).
31%
69%
Patients' group
Smoking Non-Smoking
29%
71%
Control group
Smoking Non-Smoking

36
Figure 3.5: Distribution of patients and control groups based on their drug intake.
Comparison of the patients’ and control groups for their drug intake using Person’s Chi-
Square analysis showed a statistically significant difference (P< 0.001) between the two
groups.When patients on drugs were further sub-grouped based onto their BMI, ABO
blood group, Lewis phenotype and secretor status, and analyzed statistically, no statistical
differences among the subgroups were observed (data not shown).
3.6.Exposure to pollution:
Exposure to pollution in the living or working environment e.g. factories, waste
incinerator, microbiology laboratories, chemical institutes is a serious health problem.
54.2
45.8
5.9
94.1
0
10
20
30
40
50
60
70
80
90
100
Drugs No Drugs
% o
f Su
bje
cts
Patients % Control %
P< 0.001
P<0.001

37
Polluted environment may expose subjects to different elements that predisposes or
promotes infectious and non-infectious diseases by increasing exposure to microbial
pathogens, immunosuppressing agents or toxic chemicals (i.e. pesticides). Analysis of the
questionnaire data revealed that the patients’ group included 16 subjects (19.3%) who were
exposed to environmental pollution, and 67subjects (80.7%) were not. On the other hand,
16 subjects of the control group (18.8%) were exposed to environmental pollution and 69
(81.2%) were not exposed (Figure 3.6). Comparison of the study groups for exposure to
environmental pollution revealed no statistically significant difference between the two
groups (P> 0.05).
Figure 3.6: Exposure of patients’ and control groups (%) to environmental pollution.
3.7.Water source and intake:
Water may be one of the primary sources by which the bacterium is transmitted. Intake of
H. pylori contaminated water may contribute to establishing the infection. Water intake
was evaluated in the questionnaire as “Low intake” when subjects were taking less than
19.3
80.7
18.8
81.2
0
10
20
30
40
50
60
70
80
90
Expossed Not Exposed
% o
f Su
bje
cts
Patient % Control %

38
one liter a day, “Moderate” when the intake was between 1-2 liters a day, and
“Adequate” when water intake exceeded two liters a day (Robinson et al., 1989). The
intakes of other fluids like juice or tea were also included in calculating water intake. The
distribution of study subjects according to water intake is shown in table 3.4. Analysis of
data concerning water intake, showed that more than half of the patients (56.6%) fell in the
moderate water intake category, while more than half (52.9%) of the control group fell in
the adequate water intake category. A statistically significant difference was observed
between the patients’ and control group concerning the water intakein the low category
(P= 0.003) and adequate category (P=0.005).
The source of drinking water (well or municipality tap water) was also recorded for the
study subjects. From the patients’ group, 26 subjects (31.3%) were drinking well water and
57 subjects (68.7%) were drinking municipality tap water. While from the control group 23
subjects (27.1%) were drinking well water and 62 subjects (72.9%) were drinking
municipality tap water. No statistically significant difference was observed between the
two study groups concerning the source of drinking water (P> 0.05).
Table 3.4: Water intake patients and control groups.
Water intake
quantity
Patients’ group,
No. (%)
Control group,
No. (%) P- value
Low (<1L/day) 14 (16.9%) 2 (2.4%) 0.003
Moderate (1-2L/day) 47 (56.6%) 38 (44.7%) >0.05
Adequate (>2L/day) 22 (26.5%) 45 (52.9%) 0.005
3.8.Consumption of spicy Food:
Spicy and chilly foods were also evaluated to establish their role in mediating or
predisposing to infection probably by irritating the intestinal tract. All study subjects were

39
asked to describe their intake of spicy and chilly food. For this purpose the study subjects
were grouped into three categories: “none” for subjects who do not eat any spicy food or
hot pepper at all; “moderate” for individuals who eat spicy food but cannot handle the hot
pepper and “high” for individuals who consume spicy and hot pepper food. Table 3.5
shows the distribution of patients’ and control groups by their consumption of spicy food.
No statistically significant difference was observed between the two study groups
concerning this factor (P> 0.05).
Table 3.5: Consumption of spicy food by patients’ and control groups.
Amount of spicy food
consumption
Patients’ Group
No. (%)
Control Group
No. (%) P- value
None 21 (25.3%) 13 (15.3%) >0.05
Moderate 41 (49.4%) 46 (54.1%) >0.05
High 21 (25.3%) 26 (30.6%) >0.05
3.9.Correlation of ABO and Rh(D) phenotypes to H. pylori infection:
Blood samples from each subject were tested to determine the ABO and Rh phenotypes of
patients and control subjects. For this purpose, RBCs of the study subjects were tested with
anti-A, anti-A1, anti-B and anti-D antibodies.
Table 3.6 shows the ABO and Rh(D) phenotypes of the study subjects. The data showed
that the prevalence of ABO blood groups among patients and controls was as follows:
A>O>B>AB. The distribution of blood groups was similar among patients and controls.
Indeed no statistically significant difference was observed among the patients’ group and
control group concerning the distribution of ABO blood groups.

40
Table 3.7 shows the distribution of Rh (D) phenotype among patients’ and control groups.
The results showed that the prevalence of Rh (D) positivity is similar among the two
groups. No significant difference was observed among the patients’ and control group
concerning the prevalence of Rh (D) phenotype.
Table 3.6: Prevalence of ABO and Rh (D) phenotypes among patients’ and control groups.
Blood Group Ag
Patients’ group Control group
No. % No. %
O blood group 27 32.5 29 34.0
ORh+ve 24 28.9 28 32.9
O Rh-ve 3 3.6 1 1.1
A blood group 34 41.0 34 40.0
A1 Rh+ve 31 37.3 27 31.8
A2 Rh+ve 1 1.2 3 3.5
A1 Rh-ve 2 2.4 3 3.5
A2 Rh-ve 0 0 1 1.2
B blood group 12 14.5 14 16.5
B Rh+ve 9 10.8 10 11.8
B Rh-ve 3 3.6 4 4.7
AB blood group 10 12.1 8 9.5
A1B Rh+ve 7 8.4 6 7.1
A2B Rh+ve 1 1.2 0 0
A1B Rh-ve 2 2.4 1 1.2
A2B Rh-ve 0 0 1 1.2
Total 83 100 85 100

41
Table 3.7:Prevalence of Rh (D) phenotypes among patients’ and control groups.
Rh (D) type
Patients’ group Control group
No. % No. %
Positive 73 88 % 74 87 %
Negative 10 12 % 11 13 %
Total 83 100 85 100
3.10. Lewis Antigens and Secretor status:
3.10.1. Inheritance of Lewis Antigens:
Phenotyping of Lewis antigens was determined using anti-Leᵃ and anti-Leᵇ. Subjects were
tested and categorized in one of the following phenotypes: Le(a-,b-), Le(a-,b+), Le(a+,b-)
and Le(a+,b+).
The results showed that Leᵃ was positive in 16 patients (19.3%) and negative in 67 patients
(80.7%), while it was positive in 30 (35.3%) control subjects and negative in 55 (64.7%)
control subjects (Figure 3.7). This difference was statistically significant (P= 0.020) as
determined by Person’s Chi-Squire test, with control group subjects showing Leᵃ on their
RBCs than patients. Suggesting that Leᵃ to be more resistance marker.
Leᵇ was positive in 43 patients (51.8%) and negative in 40 patients (48.2%), while it was
positive in 36 (42.4%) of the control subjects and negative in 49 (57.5%) of the control
subjects (Figure 3.7). This difference was not significant using the Person’s Chi-Squire
(P= 0.220).

42
Regarding the inheritance of the Lewis phenotypes, individuals were categorized as
follows: Le(a-,b-) in 24 (28.9%) patients and in 19 (22.4%) control subjects, Le(a-,b+) in
43 (51.8%) patients and in 36 (42.4%) control subjects and Le(a+,b-) in 16 (19.2%)
patients and in 30 (35.3%) control subjects. None of the study subjects showed the
Le(a+,b+) phenotype (Figure 3.7). A statistically significant difference (P= 0.039) was
observed between the patients’ group and control group regarding the Le(a+,b-) phenotype.
Figure 3.7: Distribution of Lewis system phenotypes for patients’ and control groups.
3.10.2. Inheritance of secretor gene:
Inheritance of the Se gene was determined by testing saliva samples of study subjects for
ABH soluble substances using the hemagglutination inhibition method. The results of the
secretor status obtained from saliva study were also compared to the Lewis phenotypes to
validate and confirm saliva testing. The secretor status was positive in 61 (73.5%) of the
0
19.2
51.8
28.9
0
35.3
42.4
22.4
0
10
20
30
40
50
60
Le(a+,b+) Le(a+,b-) Le(a-,b+) Le(a-,b-)
% o
f in
div
idu
als
Le phenotypes
Patient % Control %
P= 0.039

43
patients and 47 (55.3%) of the control group, and the non-secretor status was found in 22
(26.5%) of patients and in 38 (44.7%) of control subjects (Figure 3.8). A statistically
significant difference (P= 0.039) was observed between the patients’ and control group
concerning the non-secretor status, while no significant difference was observed between
the study groups when compared for the secretor status (P> 0.05).
Figure 3.8: Comparison of the secretor status between patients’ and control groups.
Figure 3.9 shows a comparison between the patients’ and control groups for secretor status
versus ABO/Rh(D) phenotypes.
73.5
26.5
55.3
44.7
0
10
20
30
40
50
60
70
80
Secretor Non-Secretor
% o
f in
div
idu
als
Secretor Status
Patient% Control%
P= 0.039

44
Figure 3.9: Secretor status versus ABO/Rh(D) groups of patients’ and control groups.
A1+ A1- A1B+ A1B- O+ O- B+ B- A2+ A2- A2B+ A2B-
Secretor 19 2 5 1 19 3 8 3 0 0 0 0
Non-sec 12 0 2 1 5 0 1 0 1 0 1 0
No. of Patients 31 2 7 2 24 3 9 3 0 0 0 0
Secretor 15 3 2 0 18 1 5 3 0 0 0 1
Non-sec 12 0 4 1 10 0 5 1 2 1 0 0
No. of Controls 27 3 6 1 28 1 10 4 3 1 0 1
0
5
10
15
20
25
30
35
No
. of
Sub
ject
s

45
3.11. H. pyloriIgG:
The H. pylori specific IgG was determined by ELISA for the control group to assess
previous asymptomatic exposure to H. pylori. Since the patients’ group was already
evaluated for these bacteria it was necessary to determine whether the asymptomatic
control group individuals had been previously exposed to H. pylori or healthy subjects who
were not exposed to the bacterium at all. However, tolerant individuals will produce a
negative result to that particular antigen as well and will show negative IgG results.
Serum samples were tested twice (two independent assays) for the H. pyloriIgG. The
results showed that 83 (97.6%) of the control subjects were positive and only 2 subjects
(2.4%) were negative for H. pylori IgG. As a result, the control group was considered to be
asymptomatic, except for the two true negative subjects, who may be true negative or
immune-tolerant.

46
Chapter Four:
4. Discussion:
Helicobacter pylori infection may lead to ulceration of the gastric mucosa and duodenum;
it is strongly associated with the development of epithelial and lymphoid malignancies of
the stomach. The prevalence of H. pylori infection varies geographically. In addition
several factors may contribute to its pathogenesis (Li et al., 2003; Martins et al., 2006;
Torres et al., 2008;Barghouthi, 2009; Muhsenet al., 2012; Tonkic et al., 2012; Yamamoto
et al., 2012).
Treatment of H. pylori aims to eradicate 90% of the bacterium, so patients are given a
combination of two antibiotics plus a proton pump inhibitor and this is considered as a first
line treatment. However; frequent use of antibiotics during childhood is associated with a
decline in eradication rates of the bacterium(Ertem, 2012) reports of increasing bacterial
resistance have been reported (Barghouthi, 2009).

47
The study samples were collected between January 2012 and January 2013. The study was
performed at Al-Quds University Research Laboratory and Augusta Victoria Hospital
Laboratory.
After detecting the IgG of H. pylori in the control group, the results revealed an
astonishing high rate (98%) of asymptomatic infection with H. pylori among the control
group. This was an indicator to consider the control group to consist of asymptomatic
subjects.While the patients’ group showed the clinical symptoms of H. pylori infection that
was confirmed by laboratory findings of the bacteria in stomach biopsies or bacterial
antigens in stool or H. pylori specific IgA in serum.Comparison between the two groups
was performed using different predictive factors.Both host and bacterial factors may
contribute to differences in H. pylori pathogenicity. Half of the world population is
reported to be infected with this bacterium (Barghouthi, 2009). Although the prevalence of
H. pylori infection is declining in some developed countries, the prevalence of infection in
Asia and other developing countries is still high. Human host is considered to be the
principle reservoir of the bacterium and transmission is believed to occur via person to
person. Also several studies observed that children acquire H. pylorifrequently from their
mothers. On the other hand, unclean water has been implicated in the transmission ofH.
pylori infection (Wu et al., 2003; Ertem,2012; Valliani et al., 2013).
The subjects of both study groups were from different Palestinian cities in order to have
contributors with different exposing factors, such as pollution, water sources, culture
habits, and different genetic elements.
4.1.Serological Detection of anti- H. pyloriIgG:
Testing for H. pylorispecific IgGindicated bacterial exposure, asymptomatic subjects
showedthat about 98% of the control group were positive for this antibody. Therefore, this

48
test cannot be employed as a diagnostic tool for this infection, this can be useful if only
accompanied with clinical symptoms and/or verified by other means. The test is useful in
showing equal exposure and differentiating between symptomatic and asymptomatic
subjects. The mean IgG concentration for the asymptomatic group was about
109.9NTU/mL (SD= 60.1). Comparison of the IgG titer of symptomatic patients
(determined for few random samples) with the mean titer of the control group
(asymptomatic subjects)revealed no significant difference
Although serologic testing for H. pylori by detectingIgG antibodies have been proven to be
useful in supporting the clinical diagnosis of infection with this bacterium. Serum
immunoglobulin detection are considered good indicators to evaluate and diagnose the
infection and treatment of H. pylori (Jaskowski et al., 1997; Li et al., 2003), this study
showed that physicians must not relay on the IgG blood testing to evaluate patients for H.
pylori infections because exposure to bacteria does not mean to suffer from symptoms, so
there should be other ways to evaluate patients with symptoms in order to be confirmed of
having problems due to H. pyloriinfection or there are other reasons for these troubles.
Prevalence of H. pylori asymptomatic infections in the Middle East was determined to be
increasing with age (Novis et al., 1998; Muhsen et al., 2012; Tonkic et al., 2012). A recent
study conducted on Jewish and Arab patients, showed that H. pylori infection was low
among children, reached 39% in the second and third decades and further increased to 79%
in those over 60 years old (Muhsen et al., 2012). Infection prevalence rates are higher in
patients of Mediterranean and Asian origin (around 89%) compared to Western European/
North American origins (57%). The latter findings reflects the important role of socio-
economic effect on the prevalence of H. pylori infection (Novis et al., 1998; Hussein,
2010), suggesting that socioeconomics variables including hygienic standards play major
roles in the transmission of the pathogen.
49
4.2.Age:
The mean age for symptomatic patients was higher than that of the control group
(asymptomatic subjects) due to the low response rate among older individuals to
participate in the study (in the control group). Therefore, the study groups were not
matched concerning the age parameter. All the study subjects are adults and were older
than 15 years, thus it is unlikely that the age may pose a risk for contacting the infection. A
recent study from Iran, a developing country, investigated 458 children and found that the
rate of H. pylori positivity was increasing with age and rose from 43.6% by 4 months of
age to 90% by 15 years of age (Soltani et al., 2013). In our study, testing of the control
group revealed that about 98% of the subjects were positive for H. pylori specific IgG in
serum, which means that the majority of the control subjects were previously exposed to
H. pylori but remained asymptomatic. The use of this asymptomatic control group for
comparison with symptomatic patients’ group provides an advantage that both groups were
exposed to the bacterium but certain host factors have probably influenced the course of
infection, to remain asymptomatic or to develop into a symptomatic infection. However, in
comparison with other studies that showed a lower rate of H. pylori infection 45-60%
regarding the age of individual in Muhsenet al., 2012 the age range was 0- 77 years. . (Li et
al., 2003; Martins et al., 2006;Torres et al., 2008;Ertem, 2012; Muhsenet al., 2012; Tonkic
et al., 2012).
This difference in age between the whole study groups has no effect on all variable
investigated in this study except for the amount of water intake and source of water, as
shown in Appendix C by statistical analysis of a subset of 43 subjects matched for age and
gender.

50
4.3.Gender:
It was essential to compare both groups with similar gender distribution in order to
determine whether there was a significant correlation between the symptoms of infection
and gender of individuals. In this study no significant difference was observed between
both genders concerning H. pylori infection. This result is in accordance with previous
studies (Fiedoreket al., 1991; Graham et al., 1991; Turkolmezet al., 2007; Petrovic et al.,
2011). Yet, our result disagrees with other studies from Turkey and Iraq (Kanbay et al.,
2005; Jaff et al., 2011) which showed that male gender as a protective factor for infection
while females were more susceptible to H. pylori complications.
4.4.Source of drinking water:
Water sources are limited in Palestine and they were categorized into tap water and rain
water collected by water wells. There was no significant difference (P-value>0.05)
between the source of drinking water and symptomatic infection with H. pylori. Although
the role of drinking water in transmission of H. pylori is not confirmed, recent studies
reported that, water contamination may play a role in transmission of the bacterium
(Ertem; 2012). However, further studies that include young children and a controlled and
characterized source of drinking water is needed to determine the role of water in
transmission of H. pylori and whether it contributes to the high seropositive asymptomatic
individuals among Palestinians.
4.5.Water intake:
High water intake habits are necessary to maintain body hydration levels and cellular
integrity. Water has several advantages and benefits for body tissues. After comparing the
two study groups, for amounts of water intake, it was observed that the patients’ group

51
were drinking less water (P<0.05) than control group, indicating that water intake may
have a protective effect against symptomatic infection. A possible explanation include that
adequate water intake increases the hydration of mucous membranes and enhances the
effect of innate immunity in the mucous or secretions surrounding the mucous membranes
of the digestive tract. Further investigation of this issue at the cellular level may provide
more accurate explanations for this point.
4.6.Pollution and Smoking Habits:
The environmental contamination may play a primary role in bacterial transmission
through contaminating food and water sources, individuals who carry H. pylori may
transmit it to others by contaminating the environment leading to infecting others. No
significant difference between the two study groups concerning environmental pollution
was observed in this study. Palestine is not considered as an industrialized country so the
chemical remnants are probably limited and not polluted. The level of exposure to
environmental contamination is difficult to measure. Thus it is better to investigate the
effect of this factor on H. pylori infection using a larger sample and to limit the study to
specific regions with clear differences in environmental contamination or to measure
certain indicators of pollution.
Concerning the effect of smoking on H. pylori infection, no statistically significant
difference was observed between the study groups concerning this factor, this finding is
consistent with the finding by Valliani et al. (2013) from Pakistan. The latter finding was
in contrast with a study in Turkey that found smoking as a protective factor against
infection with H. pylori (Kanbay et al., 2005).

52
4.7.Consumption of Spicy food:
Since food is considered one of the primary factors affecting and influencing
gastrointestinal tract diseases (Singh et al., 2006; Yassibas et al., 2012); spicy and chilly
food was evaluated for its contribution for the development of symptomatic infection with
H. pylori. In our study there was no significant correlation between consumption of spicy
food and H. pylori infection.
The general public usually relates gastritis as a temporary reaction to spicy/ chilly- foods.
Indeed some reports indicated that spicy foodinfluences gastrointestinal diseases (Singh et
al., 2006; Yassibas et al., 2012). In this study, there was no correlation between spicy food
and symptomatic infection with H. pylori.
4.8.Drug intake:
Drugs are composed of different chemicals, many of which when taken in excess doses, in
combination or for a period longer than indicated for such drugs, may cause adverse effects
on the stomach tissues (Kuhn et al., 2010). In this study, there was a significant difference
between the study groups, concerning the intake of drugs (P <0.001).
It seems that individuals who are using drugs for a long time may be at risk of developing
symptomatic H. pylori infection. It also may indicate that individuals with underlying
infections or disorders may be predisposed to developing symptomatic infections of H.
pylori.
53
4.9.Body Mass Index (BMI):
Body mass index (BMI) may reflect the food intake habits and physical activities of
participating subjects. It was found that the patients’ group showed significantly higher
BMI values than the control group. This evidence supports the view that feeding habits
(quantities and frequencies of feeding) may impact the function of the stomach and
influence the interaction of the stomach cells with invading pathogens. It may also
contribute to intake of higher infectious doses of the bacterium H. pylori. Whether obesity
is directly or indirectly responsible for this association still awaits further investigation.
A statistically significant difference (P= 0.033) was observed between the patients’ and
control groups when compared for the BMI. Indeed the mean BMI for the control group
being in the normal category and the mean BMI for the patients group being in the
overweight category. This finding suggests that overweight may be predisposing for H.
pylori infection.
4.10. ABO and Rh:
Many studies found a strong relationship between ABO and Rh antigens and H. pylori
infection, this correlation is due to the different glycosylation patterns of RBC antigens.
Several pathogens have been demonstrated to use certain RBC antigens as receptors that
facilitate adherence of the pathogen. Analysis of ABO blood groups and Rh (D) antigen
distribution among the study subjects, showed no significant difference between the study
groups. The primary results showed that the blood group A1 Rh+ve was slightly higher in
the patients’ group and the blood group O Rh+ve was slightly higher in the control group,
but this difference was not statistically significant. The distribution of ABO blood groups
was close to that reported among the Palestinian population (Al-Kawasmi, 2011).

54
No significant difference was observed between the study groups when compared for the
ABO and Rh antigen, which is consistent with previous reports (Jaff et al., 2011; Petrovic
et al., 2011).While other studies have found a significant correlation between blood groups
and H. pylori infection. In certain patients a significant association was found between
infection and O blood grouping with Leᵇ and secretor inheritance (Kanbay et al., 2005;
Martius et al., 2006; Bayan et al., 2009;Anstee, 2010; Yamamoto et al., 2012; Valliani et
al., 2013).
The variations between different studies and correlations found within certain blood groups
may be explained by the difference in epidemiological distribution and prevalence of
particular blood groups. Therefore, it is noticed that blood group antigen effect is not that
significant and the increase in certain antigen is due to the degree of dominance of ABO
antigens in the population. In the present study, the finding that 98% of the control group
were asymptomatic and previously have been exposed to H. pylori, suggests that, at least
among our study subjects, the ABO blood group is not associated with H. pylori infection.
4.11. Lewis Antigens and Secretor Status:
Lewis antigens are described to resemble some H. pylori antigens that are carried by this
bacterium and helps in its adhesion and interaction with host cells. The Lewis antigens (Leᵃ
and Leᵇ) are produced through interaction of Lewis (FUT3) gene and Secretor (FUT2)
gene. (Magdalena et al., 1998; Hynes et al., 2000; Monteiro et al., 2000; Mcguckin et al.,
2007; Torres et al., 2008; Anstee, 2010; Yamamoto et al., 2012). In this study, the Leᵃ
antigen which correlates with the non-secretor phenotype was observed in a significantly
(P-value= 0.020) less frequency in the patients’ group compared to the control group.
Previous studies have shown Leᵇ antigen acts as a receptor for H. pylori and correlates with
the secretor phenotype (Valliani et al., 2013).There was trend toward slightly a higher
frequency in patients compared to the control group. This finding was further supported by
the frequency of the secretor phenotype among the study groups discussed in the next

55
paragraph. These findings are consistent with previous reports that reported a role for
Lewis antigens in the binding of H. pylori to the stomach mucosal cells (Hynes, 2000;
Magdalena, 1998; Monteiro, 2000; Anstee, 2010; Yamamoto et al., 2012; Valliani et al.,
2013).
An important finding of this study is the different distribution of the secretor phenotype
among the study groups. Secretor phenotype showed similar expression in the patients’
group compared to the control group (P>0.05) and the non-secretor phenotype was found
in a significantly lowerfrequency (P-value= 0.014) in the patients’ group compared to the
control group. Inheritance of Le (a+,b-) phenotype is associated with the non-secretor
phenotype while the inheritance of Le(a-b+) is associated with the secretor phenotype.
Additionally, the number of Leᵇ antigens per red cell is higher than Leᵃ antigens
(Harmening, 2005). Taken together, individuals with Le(a-b+) phenotype/ secretor
phenotype has more Lewis antigens per cell compared to individuals with the Le(a+b-)
phenotype/non-secretor phenotype. Since the H. pylori has been reported to use the Lewis
antigens for attachment or adherence to the stomach mucosal cells, it can be deduced that
individuals with the Le(a-b+) phenotype/secretor phenotype may facilitate infection with
this bacterium. This finding is consistent with the findings reported by earlier reports
which suggested that H. pylori needs high Leᵇ antigen concentration on the host cells to
facilitate its attachment and colonization on host cells (Magdalena et al., 1998; Lee et al.,
2006; Harvey et al., 2010; Yamamoto et al., 2012). Alternatively, the non-secretors express
only Leᵃ which is usually found in a lower concentration compared to Leᵇ, which in turn
may reduce the potential attachment sites for H. pylori.
4.12. Conclusion:
This study was a case-control study. The patients’ group has experienced symptomatic H.
pylori infection. In the control group or asymptomatic group, the majority of the subjects
(98%) was exposed to H. pylori pathogen but did not show any symptoms of infection. To

56
the best of our knowledge, this study is the first study of its kind in Palestine. Comparison
of the study groups, showed significant association between H. pylori infection and BMI,
drug intake, amount of water intake, Lewis phenotype and secretor property. While
comparison of the study groups, showed no statistically significant association between H.
pylori infection and gender, drinking water source, spicy and chilly food intake, smoking,
exposure to environmental pollution and ABO/Rh group.
4.13. Future Work:
Future testing for the H. pylori behavior and infection mediating factors is still
recommended especially to study the H. pylori exposure status among age groups, and to
use certain genetic studies to determine the blood antigens affecting the infection and
bacterial antigens chemical contents responsible for the adhesion and attachments to be
blocked by certain reactions. On the other hand the analysis of drugs and their chemical
components mediating the infection and improving its pathological characteristics. In
addition, further investigations are needed to examine the effect of BMI and water intake
on H. pyloriinfection.

57
5. References:
Al-Kawasmi, A. (2011). Frequency of ABO blood Groups, A Subgroups and Rh (D) Status
among Blood Donors in Hebron Governorate.Master Project at Al-Quds University.
Anstee, D. (2010). The relationship between blood groups and disease.Blood. 115, 4635-
4643.
Anstee, D. (2011). The functional importance of blood group-active molecules in human
red blood cells.VoxSanguinis. 100, 140-149.
Appelmelk, B., Monterio, M., Martin, S., Moran, A., and Vandenbroucke-Grauls, C.
(2000). Why Helicobacter pylori has Lewis antigens. Trends in Microbiology. 8(12), 565-
570.
Barghouthi, S. (2009).Helicobacter pylori. Jerusalem, Palestine:AkhnatonArts, pp. 16-40.
Bashwari, L., Al-Mulhim, A., Ahmad, M., and Ahmed, M. (2001).Frequency of ABO
blood groups in the Eastern region of Saudi Arabia.Saudi Medical Journal.22 (11), 1008-
1012.

58
Bayan, K., Tuzun, Y., Yilmaz, S., Dursun, M., and Canorue, F. (2009). Clarifying the
Relationship Between ABO/Rhesus Blood Group Antigens and Upper Gastrointestinal
Bleeding. Digestive Disease and Science. 54, 1029-1034.
Brown, L. (2000). Helicobacter pylori: epidemiology and routs of transmission.
Epidemiologic Reviews.22 (2), 283.
Burton, N., and Daniels, G. (2011).Structural modeling of red cell surface
proteins.VoxSanguinis. 100, 129-139.
Centers for Disease Control and Prevention (CDC).Global database on body mass index.
Available at: http://www.cdc.gov/healthyweight/assessing/bmi/adult_bmi/. (Accessed on
March 30, 2013).
Clyne, M., and Drumm, B. (1997).Absence of Effect of Lewis A and Lewis B Expression
on Adherence of Helicobacter pylori to Human Gastric Cells.Gastroenterology. 113, 72-
80.
Ertem, D. (2012). Clinical Practice: Helicobacter pylori infection in childhood. European
Journal Pediatrics.1-8.
Eweidah, M., Rahiman, S., Ali, H., and Al-Shamary, A. (2011).Distribution of ABO and
Rhesus (RHD) Blood Groups in Al- Jouf Province of the Saudi Arabia.Antropologist
Journal. 13 (2), 99- 102.
Fiedorek, S., Malaty, H., Evans, D., Pumphrey, C., Casteel, H., Jr, D., and Graham, D.
(1991).Factors Influencing the Epidemiology of Helicobacter pylori Infection in
Children.Pediatrics.88 (3), 578- 582.
Graham, D., Malaty, H., Evans, D., Jr, D., Klein, P., and Adam, E. (1991).Epidemiology of
Helicobacter pylori in an Asymptomatic Population in the United States (Effect of Age,
Race and Socioeconomic Status).Gastroenterology.100, 1495- 1501.
Graham, D., Lew, G., Klein, P., Evans, D., Evans, D., Saeed, Z., and Malaty, H.
(1992).Effect of treatment of Helicobacter pylori infection on the long-term recurrence of

59
gastric or duodenal ulcer.A randomized, controlled study.Annals of Internal Medicine.116
(9), 705- 708.
Harmening, D. (2005). Modern Blood Banking and Transfusion Practices. 5th
edition,
Philadelphia: F. A. Davis Company,pp. 148- 161.
Harvey, R., Herbert, Y., Lingeng, L., and Kidd, M. (2010). ABO Blood Group,
Helicobacter pyloriSeropositivity, and Risk of Pancreatic Cancer: A Case-Control Study.
J. Natl Cancer Inst. 102 (7), 502- 505.
Hassan, F. (2010).Frequency of ABO, Subgroup ABO and Rh (D) Blood Groups in Major
Sudanese Ethnic Groups.Pakistan Journal of Medical Research.49 (1), 21- 24.
Hawkey, C., Talley, N., Yeomans, N., Jones, R., Sung, J., Langstorm, G., Naesdal, J., and
Scheiman, J. (2005).Improvements with Esomeprazole in Patients with Upper
Gastrointestinal Symptoms Taking Non- Steroidal Antiinflammatory Drugs, Including
Selective COX-2 Inhibitors.The American Journal of Gastroenterology.100 (5), 1028-
1036.
Henry, S., Mollicone, R., Fernandez, P., Samuelsson, B., Oriol, R., and Larson, G. (1996).
Molecular basis for erythrocyte Le(a+b+) and salivary ABH partial-secretor phenotypes:
expression of a FUT2 secretor allele with an AT mutation at nucleotide 385 correlates
with reduce α(1,2) fucosyltransferaseactivety. Glycoconjugate Journal. 13, 985- 993.
Hussein, N. (2010). Helicobacter pylori and gastric cancer in the Middle East: A new
enigma. World Journal of Gastroenterology.16 (26), 3226- 3234.
Hynes, S., and Moran, A. (2000). Comparison of three serological methods for detection of
Lewis antigens on the surface of Helicobacter pylori.FEMS Microbiology Letters. 190, 67-
72.
Jafarzadeh, A., Kahanali, J., Bahrami, M., and Taghipour, Z. (2007).Seroprevalence of
anti-Helicobacter pylori and anti-CagA antibodies among healthy children according to
age, sex, ABO blood groups and Rh status in south-east of Iran.Turk J Gastroenterol.18
(3), 165- 171.

60
Jaff, M. (2010).Higher frequency of secretor phenotype in O blood group- its benefits in
prevention and/or treatment of some diseases.International Journal of Nanomedicin.5, 901-
905.
Jaff, M. (2011).Relation between ABO blood groups and Helicobacter pylori infection in
symptomatic patients.Clinical and Experimental Gastroenterology.4, 221- 226.
Jaskowski, T., Martins, T., Hill, H., and Litwin, C. (1997). Immunoglobulin A Antibodies
to Helicobacter pylori. Journal of Clinical Microbiology.35 (11), 2999- 3000.
Kanbay, M., Gur, G., Arslan, H., Yilmaz, U., and Boyacoiglu, S. (2005). The relationship
of ABO Blood Group, Age, Gender, Smoking and Helicobacter pylori Infection.Digestive
Diseases and Sciences. 50(7), 1214-1217.
Keller, R., Dinkel, K., Christl, S., and Fischbach, W. (2002). Interrelation between ABH
Blood Group O, Lewis (b) Blood Group Antigen, Helicobacter pylori Infection and
Occurrence of Peptic Ulcer. Z Gastroenterol. 40, 273-276.
Kuhn, M., Campillos, M., Lentunic, I., Jensen, L., and Bork, P. (2010). A side effect
resource to capture phenotypic effects of drugs. Molecular systems biology.6: 343.
Lee, H., Choe, G., Kim, W., Kim, H., Song, J., and Park, K. (2006). Expression of Lewis
antigens and their precursors in gastric mucosa: relationship with Helicobacter pylori
infection and gastric carcinogenesis. Journal of Pathology.209, 88- 94.
Li, S., Lu, A., Zahang, L., and Li, Y. (2003).Anti-Helicobacter pylori immunoglobulin G
(IgG) and IgA antibody responses and value of clinical presentations in diagnosis of H.
pylori infection in patients with precancerous lesions.World Journal Gastroenterol.9 (4),
755- 758.
Gallagher, P.G. (2007). Disorders of the red blood cell membrane: hereditary
spherocytosis, elliptocytosis and related disorders. In Williams Hmatology, 7th
edition, M.
Lichtman, E. Beutler, T.J. Kipps, U. Seligsohn, K. Kaushansky, and J.T. Prochal, editors.
New York: McGraw-Hill, pp. 571-601.

61
Lin, Y., Pavenski, K., Saidenberg, E., and Branch, D. (2009). Blood Group Antigens and
Normal Red Blood Cell Physiology: A Canadian Blood Services Research and
Development Symposium. Transfusion Medicine Reviews. 23, 292-309.
Linden, S., Mahdavi, J., Mora, C., Olsen, C., Carlstedt, I., Boren, T., and Dubois, A.
(2008).Role of ABO Secretor Status in Mucosal Innate Immunity and H. pylori
Infection.PloS Pathogens. 4(1), 6-13.
Loffeld, R., and Stobberingh, E. (1991).Helicobacter pylori and ABO blood groups.J
ClinPathol. 44, 516-517.
Magdalena, C., Torkel, W., Hans, F., Izabela, M., Elzbieta, C., Tomasz, R., and Weislawa,
R. (1998). Anti- Lewis X antibody and Lewis X-anti- Lewis X immune complexes in
Helicobacter pylori infection. Immunology Letters 61, 119-125.
Magen David Adom in Israel, (The national rescue service in Israel). Available at:
http://www.mdais.org/362/. (Accessed on March.20th
,2013).
Martins, L., Corvelo, T., Oti, H., Loiola, R., Aguiar, D., Barile, K., Amaral, R., Barbosa,
H., Fecury, A., and Souza, J. (2006).ABH and Lewis antigen distributions in blood, saliva
and gastric mucosa and H. pylori infection in gastric ulcer patients.World J Gastroenterol.
12(7), 1120-1124.
Monteiro, M., Zheng, P., Ho, B., Yokota, S., Amano, K., Pan, Z., Berg, D., Chan, K.,
MacLean, L., and Perry, M. (2000). Expression of histo- blood group antigens by
lipopolysaccharides of Helicobacter pylori strains from Asian hosts: the propensity to
express type 1 blood- group antigens. Glycobiology.10 (7), 701- 713.
Muhsen, K., Cohen, D., Spunqin-Bialik, A., and Shohat, T. (2012).Seroprevalance,
correlates and trends of Helicobacter pylori infection in the Israeli population.
Epidemiology and Infection.140 (7), 1207- 1214.
Nelson, D., and Cox, M. (2003).Lehninger Principles of Biochemistry. 3rd
ed. New York:
Worth Publishers. pp. 3-52.

62
Novis, B., Gaby, G., and Naftali, T. (1998).Helicobacter pylori: The Middle East Scenario.
Yale Journal of Biology and Medicine. 71, 135-141.
Pasini, E., Lutz, H., Mann, M., and Thomas, A. (2010). Red blood cell (RBC) membrane
proteomics-Part I: Proteomics and RBC physiology. Journal of Proteomics. 73(3), 403-
420.
Petrovic, M., Artiko, V., Novosel, S., Ille, T., Sobic-Saranovic, D., Pavlovic, S., Jaksic, E.,
Stojkovic, M., Antic, A., and Obradovic, V. (2011). Relationship between Helicobacter
pylori infection estimated by 14C-urea breath test and gender, blood groups and Rhesus
factor. Hell J Nucl Med. 14 (1), 21- 24.
Pourazar, A. (2007). Red cell antigens: Structure and function. Asian Journal of
Transfusion Science. 1, 24-32.
Raza, M., Blackwell, C., Molyneaux, P., James, V., Ogilvie, M., Inglis, J., and Weir, D.
(1991).Association between secretor status and respiratory viral illness.BMJ. 303 (6806),
815-818.
Rio Preto, S., and Paulo, S. (2002). ABO, Lewis, secretor and non-secretor phenotypes in
patients infected or uninfected by the Helicobacter pylori bacillus. Sao Paulo Medical
Journal. 120(2), 55-58.
Robinson, C., and Weigley, E. (1989).Basic Nutrition and Diet Therapy, 6th
edition.New
York; Macmillan pp. 157- 168.
Rowland, M. (1990).Self-reported weight and height.The American Journal of Clinical
Nutrition. 52 (6), 1125-1133.
Skaik, Y., Alhawary, A., Shbair, A., and Hamouda, B. (2007).Frequancy of ABO and Rh
(D) blood groups in five governorates in Gaza- Strip.Pakistan Journal of Medical
Sciences.23 (6), 924- 927.
Sheinfeld, J., Schaeffer, A., Cordon-Cardo, C., Rogatko, A., and Fair, W.
(1989).Association of the Lewis blood-group phenotype with recurrent urinary tract
infections in women. N Eng J Med. 320(12), 773-777.

63
Sheu, S., Sheu, B., Yang, H., Lei, H., and Wu, J. (2007).Anti- Lewis X antibody Promotes
Helicobacter pylori Adhesion to Gastric Epithelial Cells.Infection and Immunity.75 (6),
2661- 2667.
Shtayeh, A., Hamdan, A., and Faydi, Y. (1998).Distribution of ABO blood groups and the
Rh factor in Palestinians living in the northern part of the West Bank.An- Najah University
Journal of Research.5, 35- 41.
Singh, K., and Ghoshal, U. (2006). Causal role of Helicobacter pylori in gastric cancer: An
Asian enigma. World Journal of Gastroenterology.12 (9), 1346- 1351.
Tonkic, A., Tonkic, M., Lehours, P., and Mergraud, F. (2012).Epidemiology and Diagnosis
of Helicobacter pylori Infection.Helicobacter. 17 (1), 1-8.
Torres, J., and Backert, S. (2008). Pathogenesis of Helicobacter pylori
infection.Helicobacter. 13(1), 13-17.
Turkolmez, S., Derya, C., Fusun, A., and Meliha, K. (2007). The relationship of
Helicobacter pylori Positivity with Age, Sex and ABO/Rhesus Blood Groups in Patients
with Gastrointestinal Complaints in Turkey.Helicobacter. 12, 244-250.
Valliani, A., Khan, F., Chagani, B., Khuwaja, A., Majid, S., Hashmi, S., Nanji, K., and
Valliani, S. (2013). Factors Associated with Helicobacter Pylori Infection, Results from
Developing Country- Pakistan. Asian Pacific Journal of Cancer Prevention.14, 53- 56.
WHO Expert Consultation. (2004). Appropriate body-mass index for Asian populations
and it’s implications for policy and intervention strategies. Lancet. 363 (9412), 157-163.
WHO.Global database on body mass index. Available at:
http://apps.who.int/bmi/index.jsp?introPage=intro_3.html. (Accessed on March 30, 2013).
Wu, T., Chen, L., and Hwang, S. (2003). Seroprevalence of Helicobacter pylori in school-
aged Chinese in Taipei City and relationship between ABO blood groups. World Journal
of Gastroenterology.9 (8), 1752- 1755.

64
Yamamoto, F., Cid, E., Yamamoto, M., and Blancher, A. (2012).ABO Research in the
Modern Era of Genomics.Transfusion Medicine Reviews Journal.26 (2), 103- 118.
Yassibas, E., Arslan, P., and Yalcin, S. (2012). Evaluation of Diatry and Life-Style Habits
of Patients with Gastric Cancer: A Case-Control Study in Turkey. Asian Pac J Cancer
Prev. 13 (5), 2291- 2297.

65
Appendices
Appendix A: Study Questionnaire
جامعة القدس/ كلية الدراسات العليا/ ماجستير علوم طبية مخبرية استمارة بحث علمي اسم الباحث: علا كرمي
:/السيدالسيدة
دساست حي " بإػذاد-بإششاف اذوخس حد سشس اذوخس س١ش ابشغرجبؼت امذس – علا كرمحم اببحزت
. "فسط١ -ف اؼفت اغشب١ت فظ١ت اذ بىخ١ش٠ب ا١ىببوخش ب١س
إعطاء عنات دم و لعاب اافمت ػ ت الاسخب١ب اشفك زه شج حؼشحه اخؼب غ اببحزت بخؼبئ لاستخدامها ف هذا البحث.
سف ٠خ اخؼب غ اؼ١بث خبئج ابحذ بسش٠ت خظط١ت وبت، أب خبئج ابحذ فسف حسخؼ لأغشاع
.ذ اؼ فمؾابح
س١خ إػلاى بخبئج ابحذ ػذ الاخبء اذساست.
زا ابحذ،،،،، لإجبحؼ حؼبىشىش اخب١ ألذ ى
--------------------------------------------------------------------------------------------------------------------
معلومات عامة:
:رقم المشارك .1 العمر: .2 أنثى -ذكر ب -الجنس: أ .3 الطول: .4 الوزن: .5 (:Body mass index)لحساب
ما ه فصلة دمك: .6 لا -نعم ب -هل تدخن: أ .7
إذا كنت تدخن فاذكر العمر الذي بدأت به التدخن:
كم الفترة الت دخنت بها من دون انقطاع:
منطقة السكن: .8
المدنة: القرة:

66
لا -نعم ب -............الخ(: أ ، تعمل ف مصنعفها تلوث )مكب نفااتمن منطقة اقرب تقطنهل .9
حدد:
لا حدد: -نعم ب -هل تشرب من ماه أبار الجمع )الأمطار(: أ .10
أتناولها ف كثر من -ج لتر( 2-1متوسط ) -قللا )أقل من لتر( ب -كف تصف شربك للماء: أ .11
(لتران من الماءالأحان )
أتناولها ف كثر من -قللا ج -لا أتناولها نهائا ب -كف تصف تناولك للطعام الحار و الفلفل: أ .12
الأحان
(51إذا لم تكن مصابا بأعراض القرحة في حياتك الرجاء الذهاب للسؤال رقم:)
الطرقة الت كانت متبعة ف تشخص مرض القرحة:ما ه .13
غر ذلك، حدد: -لا أعرف هـ -فحص تنفس د -خزعة من المعدة ج -فحص دم ب -أ
____________
--------------------------------أذكر أمور أخرى تزد أعراض المرض لدك و غر موجودة ف الأسئلة السابقة: .14
------------------------------------------------------------------------------------------------------------
----------------
نعم -ب لا -: أهل هناك أشخاص في عائلتك مصابين بأمراض في الجهاز الهضمي أو القرحة .15
حدد صلة القرابة: حدد نوع المرض:

67
Appendix B: Consent Form
جامعة القدس/ كلية الدراسات العليا/ ماجستير علوم طبية مخبرية اسم الباحث: علا كرمي
أنا: الموقع أدناه، أوافق على المشاركة بالبحث العلم الذي تقوم به الباحثة
غوث عن بكترا الهلكوباكتر سمر البر جامعة القدس بإشراف الدكتور محمود سرور و الدكتور -علا كرم
و علاقتها بفصلة الدم، و أوافق على استخدام المعلومات الت طلبها الباحث ف أغراض البحث العلم، و بالوري
أوافق على إعطاء عنات دم و عنات لعاب لاستخدامها ف هذا البحث.
توقع:ال
التارخ:
توقع الباحث:
لاستعمال الباحثة فقط.
سل الاسخب١ب :.................
..............ساجغ اؼبث:

68
Appendix C: Comparison of an age-matched subset of the patients’ and control
groups
Analysis of the patients’ and control groups with regard to age, revealed a statistical
significant difference (P=0.000). In order to determine if this difference has affected the
findings of this study with regard to other variables studied in this study, we have matched
43 patients and 43 control subjects with regard to age and gender. Statistical analysis of
this matched subset revealed that the factors that have significant difference were the same
as the whole group, which were: high body mass index, increased drugs intake, no
inheritance to Leᵃ antigen and inheritance of Se gene (i.e., having the secretor phenotype).
While factors that did not show any significant difference between the patients’ and control
groups were also the same as the whole group, namely: spicy and chilly food intake,
smoking, exposure to environmental pollution and ABO/Rh grouping.
However, the statistical analysis of the age-matched subset was contradictory to the
findings observed with the whole groups with regard to the amount of water intake and the
source of water. Analysis of the patients’ and control groups (whole groups) revealed a
significant difference between groups when compared with regard to the amount of water
intake, while no significant difference was observed between groups when compared with
regard to the source of water. In contrast, analysis of the age-matched subset, did not reveal
a significant difference between groups when compared with regard to amount of water
intake, and revealed a significant difference between groups when compared with regard to
the source of water. Therefore, we believe that further investigations are needed using a
larger sample to study the association between the amount of water intake and source of
water and H. pylori infection.
Statistical analysis was performed using the same methods used to analyze the whole study
groups namely the Pearson’s Chi- square test.

69
و نىع فصيلة الدم و قدرة الشخص الإفرازية بكتيريا الهليكىباكتر بيلىريالعلاقة بين
في فلسطين
إػذاد: ػلا ؽلاي ػبذ الله وش.
.إششاف: د. حد سشس، د. س١ش ابشغر
الملخص:
غ ػذة أاع جذ أ ػلالتاغلاف اخ ىش٠بث اذ احشاء ب ٠شحبؾ ب أخ١ج١بث
لاحظت أ بىخ١ش٠ب اؼذة اذل١مت اشػت. ب حسبس١ت ؼذة أاع اىبئبث أ الأشاع، وب
الاخبببث اشافمت ب شحبطت غ الأخج١بث اخخفت اخ ححب خلا٠ب احض١ت اسببت مشحت
اخ حض٠ذ خطسة إحذاد أػشاع شػ١ت حذ٠ذ اؼا سبث خؼذدة ػ حدسا وب بناذ احشاء
اجشرت.ذ الأشخبص از٠ ٠ظبب بز
ز اذساست ابحذ ف اؼلالت ب١ الإطببت ببىخ١ش٠ب امشحت غ جبح ابىخ١ش٠ب ف اذف الأسبس
شع جت ع فظ١ت اذ ع الأخج١بث اخ ححب ؼبػفبث اإحذاد أػشاع
ABO/ Rh (D) Lewis ع الأخج١ اخبص بـ A ساء وبA1 أA2 لبب١ت ، بح١ت
اشخض لإفشاص الأخج١بث ف اشػ افسط١١١.
از٠ ظشث ػ١ أػشاع ش٠غ( 38اشخج اذساست ػ جػخ١: جػت اشػ )
أ أػشاع ػ١ از٠ حظش شخض( 38اجػت اؼببطت ) طببت بجشرت اؼذة الإ
اجس وزبفت اجس ػبداث اخذخ١ فشق ب١ب بح١ت ا دساستطببت ببجشرت، لذ ح الإ
مذاس اخؼشع ظذسب و١ت ابء ػ ربث اب١ئ١تشحؼحؼبؽ اشخض لأد٠ت اخخفت

70
لبب١ت حشاء أاع الأخج١بث اخخفت اخ ححب وش٠بث اذ ا ببلإػبفت ع اذ طؼب احبس
ب١ أػشاع ئ١ب لاحظت جد اسحببؽ ب١ب ز اؼا حج دساسخب إحظب فشاص٠ت.اشخض الإ
الإطببت ببىخ١ش٠ب امشحت.
%( لذ حؼشػا جشرت اؼذة ح١ذ ح وشف 83أظشث اخبئج أ سبت ػب١ت اؼ١ت اؼببطت )
اخؼشع لأػشاع الاخبة جسب اؼبدة جشرت ف ظ اذ، غ اؼ أ ٠سبك الأ
طت حع جد ػلالت راث دلات بببىخ١ش٠ب امشحت. ببمبست ب١ جػت اشػ اجػت اؼب
و١ت ابء اخ حبي الأد٠ت، : وزبفت اجس،ػا حشػذة طببت ببجشرت إحظبئ١ت ب١ الإ
ػ وش٠بث د احشاء خلا٠ب جس، لبب١خ Lewisح ع الأخج١ ٠خبب اشخض،
راث دلات إحظبئ١ت ب١ وب ظش أربء امبست أ لا ٠جذ ػلالت الإفشاص٠ت لأخ١ج١بث اخخفت.
حبي اطؼب احبس اخب١ت: اجس، ظذس ابء از ٠خ حب، طببت ببجشرت اؼاالإ
ب ٠ح أخ١ج١بث شع ربث اب١ئ١ت اخخفت، ع د اشخض ؼاخاخذخ١، احبد،
ABO/ Rh (D).
وخ١جت زا ابحذ ظش بن سبت ػب١ت احب١ جشرت بىخ١ش٠ب امشحت ف اجخغ
س أػشاع اشع ػذ الاطببت بجشرت اؼذة ٠شحبؾ بؼا ٠حب ظش أ٠ؼب أ ظافسط١،
الإسب أخش اب١ئت اح١طت.

LXXI