Embed Size (px)
Citation preview

St. Petersburg University
Graduate School of Management
Master in Management
Relationship between Dividend Payments
and Stock Price Dynamics
Master’s Thesis by the 2nd year student
Concentration – MIM
Zhasmina Dzhantelieva
Research advisor:
Tatiana Garanina,
Associate Professor
St. Petersburg
2018

2
ЗАЯВЛЕНИЕ О САМОСТОЯТЕЛЬНОМ ХАРАКТЕРЕ ВЫПОЛНЕНИЯ
ВЫПУСКНОЙ КВАЛИФИКАЦИОННОЙ РАБОТЫ
Я, Джантелиева Жасмина Талантовна, студент второго курса магистратуры
направления «Менеджмент», заявляю, что в моей магистерской диссертации на тему
«Взаимосвязь между дивидендными выплатами и динамикой цен акций», представленной
в службу обеспечения программ магистратуры для последующей передачи в
государственную аттестационную комиссию для публичной защиты, не содержится
элементов плагиата.
Все прямые заимствования из печатных и электронных источников, а также из
защищенных ранее выпускных квалификационных работ, кандидатских и докторских
диссертаций имеют соответствующие ссылки.
Мне известно содержание п. 9.7.1 Правил обучения по основным образовательным
программам высшего и среднего профессионального образования в СПбГУ о том, что
«ВКР выполняется индивидуально каждым студентом под руководством назначенного
ему научного руководителя», и п. 51 Устава федерального государственного бюджетного
образовательного учреждения высшего образования «Санкт-Петербургский
государственный университет» о том, что «студент подлежит отчислению из Санкт-
Петербургского университета за представление курсовой или выпускной
квалификационной работы, выполненной другим лицом (лицами)».
_______________________________________________ (Подпись студента)
23.05.2018 (Дата)
STATEMENT ABOUT THE INDEPENDENT CHARACTER OF
THE MASTER THESIS
I, Dzhantelieva Zhasmina Talantovna, second year master student, program
«Management», state that my master thesis on the topic «Relationship Between Dividend
Payments and Stock Price Dynamics», which is presented to the Master Office to be submitted to
the Official Defense Committee for the public defense, does not contain any elements of
plagiarism.
All direct borrowings from printed and electronic sources, as well as from master theses,
PhD and doctorate theses which were defended earlier, have appropriate references.
I am aware that according to paragraph 9.7.1. of Guidelines for instruction in major
curriculum programs of higher and secondary professional education at St.Petersburg University
«A master thesis must be completed by each of the degree candidates individually under the
supervision of his or her advisor», and according to paragraph 51 of Charter of the Federal State
Institution of Higher Education Saint-Petersburg State University «a student can be expelled
from St.Petersburg University for submitting of the course or graduation qualification work
developed by other person (persons)».
________________________________________________(Student’s signature)
23.05.2018 (Date)

3
АННОТАЦИЯ
Автор Джантелиева Жасмина Талантовна
Название магистерской
диссертации
Взаимосвязь между дивидендными выплатами и динамикой
цен акций
Факультет Высшая Школа Менеджмента
Направление подготовки «Менеджмент» (профиль: Маркетинг)
Год 2018
Научный руководитель Гаранина Татьяна Александровна, доцент
Описание цели, задач и
основных результатов
Цель данной магистерской диссертации состоит в том, чтобы
проанализировать взаимосвязь между объявлениями о
дивидендных выплатах и ценами акций компаний,
торгующихся на Московской фондовой бирже в период 2012-
2017 гг. Первая глава содержит теоретические аспекты выплат
дивидендов, гипотезу эффективного рынка и группирует
результаты предыдущих исследований. Во второй главе
представлена подробная методология исследования и
событийный анализ объявлений об изменениях дивидендных
выплат.
Исследование показало, что в целом увеличение размера
дивидендных выплат положительно влияет на цены акций.
Однако финансовый рынок отрицательно реагировал на
объявления о снижении дивидендных выплат в более
благоприятной экономической ситуации, в то время как в
период кризиса акции генерировали положительную
аномальную доходность. Таким образом, можно сделать
вывод, что взаимосвязь между дивидендами и ценами акций
неоднозначна и зависит от состояния экономики.
Ключевые слова Дивидендная политика, цены акций, событийный анализ,
финансовые рынки, сигнальная теория дивидендов, агентская
теория

4
ABSTRACT
Master Student’s Name Dzhantelieva Zhasmina Talantovna
Master Thesis Title Relationship Between Dividend Payments and Stock Price
Dynamics
Faculty Graduate School of Management
Main field of study “Management” (specialization: Marketing)
Year 2018
Academic Advisor's Name Garanina Tatiana Aleksandrovna, Associate Professor
Description of the goal,
task, and main results
The goal of the master thesis is to analyse the relationship between
dividend announcements and stock prices of companies listed on
the Moscow Stock Exchange during the 2012 – 2017 period. The
first chapter contains the theoretical aspects of dividend payments,
efficient market hypothesis and aggregation of the results of
previous studies. The second chapter introduces a detailed research
methodology and the event study analysis of dividend
announcements.
The study revealed that, in general, an increase in the size of
dividends positively affects the stock prices. However, financial
market reacted negatively to the publication of decreased dividend
payments in a more economically flavoured situation while the
stocks yielded positive abnormal returns to the decrease in the size
of dividends during the economic crisis. Thus, it can be concluded
that the relationship between dividends and stock prices is
ambiguous and depends on the state of economy.
Keywords Dividend policy, stock prices, event study, financial markets,
dividend signaling theory, agent theory

5
Table of contents
INTRODUCTION ........................................................................................................................... 6
CHAPTER 1. THEORETICAL BACKGROUND ......................................................................... 9
1.1. Dividend policy ................................................................................................................. 9
1.1.1. Dividend irrelevance theory .................................................................................... 10
1.1.2. Theory of the dividend payment preference ............................................................ 12
1.1.3. Tax-preference theory.............................................................................................. 12
1.1.4. Agency theory ......................................................................................................... 14
1.1.5. Dividend signaling theory ....................................................................................... 14
1.2. Efficiency market hypothesis .......................................................................................... 17
1.3. Research in relationship between dividend payments and stock price dynamics ........... 20
1.4. Research gap ................................................................................................................... 26
CHAPTER 2. METHODOLOGY AND EMPIRICAL STUDY .................................................. 28
2.1. Event analysis ..................................................................................................................... 28
2.2. Research strategy ................................................................................................................ 30
2.3. Data collection .................................................................................................................... 30
2.4. Research model................................................................................................................... 31
2.5. Sample description ............................................................................................................. 38
2.6. Research results .................................................................................................................. 39
2.7. Theoretical contribution ..................................................................................................... 46
2.8. Practical implication ........................................................................................................... 47
2.9. Study limitations and further research ................................................................................ 48
CONCLUSION ............................................................................................................................. 49
Reference list ................................................................................................................................. 51
Appendix 1. Stock returns ............................................................................................................. 55

6
INTRODUCTION
Profit being the main economic driver for the companies can be turned to two key
destinations: it could be reinvested back into the business to be used for its future growth, or
profit can be distributed to shareholders. This distribution is mainly done in the form of dividend
payments or through share repurchases. Therefore, companies need to form a dividend policy in
order to determine whether or not to pay dividends and how to do it. Number of researches have
attempted to study dividend policy, however, the issue of what settles on corporate dividend
policy still remains uncertain. Dividend policy is essential for an organization as it signalizes
company’s strength and provides with information regarding organization’s prospect of
development (Farrukh, 2017).
Potential investors and shareholders decide to invest in the company by investigating its
capacity of paying dividends. Furthermore, dividend policy can be used to minimize agency
costs. Since management prosperity can be determined by the wealth of its shareholders,
management needs to completely comprehend dividend policy. The problem of the dividend
policy setting in both developed and developing countries is widely discussed in numerous of
scientific papers, public periodicals and articles. From the theoretical point of view, the
researchers consider the process of dividend policy in terms of its impact on market value and its
assistance for the well-being of shareholders. On top of that, the dividend policy affects all
aspects of managing financial assets, liquidity, capital structure, share value and business value.
Dividend policy in Russia is quite a young direction and one of the least studied in
academic circles. In the modern world investments in domestic companies with objective to
obtain a dividend income is just beginning to gain popularity. Problems of evaluation and
forecasting of profitability of financial assets are directly related to issues the capital access.
Especially relevant these problems become in conditions when there is a large-scale
unstable situation in the financial markets, which Russian economy have been facing during the
last 8 years. The problem of evaluation and forecasting returns on financial securities are even
more relevant in the conditions of extracting capital from an investment, in the cases of a series
of bankruptcies, and slowdown in economic growth.
The market capitalization of companies may be defined as the total market value of its
shares, quoted on the market. From the point of view of a shareholder who aims to receive
income by selling company shares, market capitalization is a top priority. The importance of
considering the impact of dividend payments on capitalization of the company is that the choice

7
of the right dividend policy allows not only to maximize welfare of the shareholders of the
company, but also to increase its investment attractiveness, thereby ensuring the production
activities. Hence, the efficiency of the dividend policy and its impact on the market value of the
company is a topical issue for their investment attractiveness companies that are willing to
increase and ensure the interests of its shareholders.
The market always reacts to the economic, political and social information, the slightest
fluctuations entail immediate changes to stock prices. If market capitalization responds
positively to administrative, operational, financial or investment decisions, then it can be
concluded that the decision is positive for the well-being of the capital owners and can be
interpreted as a lever for creating value.
In this regard, the goal of this study is to analyze the relationship between dividend
announcements and stock prices of companies listed on the Moscow Stock Exchange during the
2012–2017 period. This research seeks to explain how efficient the Russian market is regarding
dividend announcements, i.e. how fast the market reacts to upcoming information on dividend
payments, and to what extent market players could earn abnormal returns on the stocks they
possess.
When deciding on the distribution of profits, it is very important conducting an informed
dividend policy not only at the company level, but also in the aspect of the movement of market
stock prices on stock exchanges. This is due to the fact that the change in stock prices serves the
investor as the main information about the work of a specific issuer.
Consistent and understandable dividend policy for investors is an indispensable element
of the company's strategy, focused on long-term capitalization growth. Modern companies exist
in an aggressive information environment. Once a company appears on the market, it is involved
in a powerful information flow, becoming one of the sources of information. News sources in
this information flow can be the company itself, its competitors, authorities, etc.
The extent of importance of dividend payments also varies depending on whom is
holding the shares - majority or minority shareholders. For large shareholders, the shares are
important in the first place as a tool for exercising control over the company, while the dividend
income is not that significant. On the contrary, minority shareholders are more interested in
dividend payments. However, nowadays there is an unstable political situation and any event
occurring in the world will have an impact on the value of the enterprise. This is especially true
for companies that are primarily exposed to geopolitical risks. In such situations, the dividend
payout factor takes the second place when calculating the company's capitalization.

8
In accordance with the above purpose of the research, the following research objectives
were set and accomplished:
− Review of dividend policies which explain the market reaction to dividend
announcements and aggregation of the results of these studies
− Selection of data sources, data collection and processing, usage of several
data samples for the research
− Event analysis of the dividends’ announcements on stock prices by
analyzing the dividend theory explaining the interaction of the market value of
companies and changes in dividends
− Setting and testing the hypotheses regarding identified information events
that affect the returns of stock prices
− Testing the significance of obtained results on different samples in order to
identify more obscure and interesting observations for managerial purposes
Thus, the object of this study is the dynamics of stock prices of Russian companies while
the subject of the study is the relationship between stock price dynamics and the announcements
of dividend payments.
The paper has the following structure. The first chapter contains the theoretical aspects of
dividend payments, efficient market hypothesis and aggregation of the results of previous
studies. The second chapter introduces a detailed research methodology, main issues encountered
in analysis and their resolutions. The results and findings of the event study, theoretical
contribution and managerial implications, study limitations and further research are also
presented in the second chapter. In the conclusion the most important findings of the research
and recommendations are summarized.

9
CHAPTER 1. THEORETICAL BACKGROUND
This chapter reviews the research made in the field of dividend payments affecting the
dynamics of price stocks, efficiency market hypothesis and dividend signaling. This chapter also
summarizes different types of dividend policies and assesses the importance of announcements
of dividends payments on the dynamics of stock prices on both foreign and Russian financial
markets.
Over the past several years, the Russian economy has been experiencing tense times. The
accession of Russia by the Crimea caused discontent on the part of Western countries. Sanctions
from Unites States of America against Russian politicians and companies were applied, followed
by sanctions imposed by Canada, Australia, European countries and others. This led to a tense
political and economic situation in the country. Moreover, oil prices started and continue to fall,
while the oil industry accounts for more than 70% of the country's GDP, which could not but
affect the economy.
In this regard, the study of the Russian financial market over the past couple of years is of
a great interest. In addition, at present the analysis on the Russian stock market is continuing to
grow, creating accumulation of empirical material, which can serve as a basis for conducting
tests of various kinds of hypotheses. Consequently, with the emergence of an increasing number
of analysts and forecasts, the question arises as to how much they are qualitative and meaningful.
Therefore, given the change in the dynamics of the situation in the country, specifically in
the oil and gas industry, and the growth of empirical materials on the stock market it becomes,
firstly, interesting and, secondly, accessible to assess how the dividend policy of companies
affects stock prices and what are the most the significant factors of changes in the dynamics of
stock prices.
1.1. Dividend policy
The basis of dividend policy was laid by a study published by J. Lintner (1956). In this
study, based on the analysis of 28 firms in the United States, the author came to the conclusion
that large propensity to pay dividends is owned by large enterprises, whose growth potential is
significantly limited. They regularly pay dividends, and their magnitude is adjusted from year to
year insignificantly. On the basis of this work a variety of dividend policies began to develop.
Consequently, five major dividend policies widely discussed in scientific circles have
been formed. However, primarily two theories of dividend policy - agency and signaling
dividend theories - are the most accepted by the scientific community.

10
Table 1 Dividend policy theories
Dividend policy theories Authors Essence
Dividend irrelevance theory
M. Miller and F.
Modigliani (1961)
In conditions of an imperfect capital
market, dividend policy plays a
secondary role for the company's
management, and dividends can be
paid on a residual basis, only if the
financial situation is favorable
Theory of the dividend
payment preference
M. Gordon, J. Walter
(1963)
For most investors, it is preferable
to receive regular dividends than a
possible increase in the company's
capitalization in the future, since
this reduces the risk of uncertainty
Tax-preference theory
R. Lietzenberger and K.
Ramaswamy (1979)
The main attention is paid to the tax
legislation by virtue of which it is
more profitable to receive part of
the earnings through dividends in
some cases, while in others through
capital gains
Dividend signaling theory
S. Ross, S. Bhattacharya
(1977)
Management of companies through
dividend policy sends signals to
investors and stock exchanges on
the status of enterprises under their
control
Agency theory M. Jensen and W.
Meckling (1986)
The theory supposes conflicts of
interest between different groups:
management and shareholders;
majority and minority shareholders;
shareholders and creditors of the
company
1.1.1. Dividend irrelevance theory
Five years after the article, J. Linter published the famous work of two future Nobel
laureates in economics M. Miller and F. Modigliani (1961), where it was proved that in a perfect
capital market, the dividend policy does not have any influence on the capitalization of the
company, there is no point in paying dividends. Obviously, then, as now there is an imperfect

11
capital market, and in this case, Miller and Modigliani believe that companies can pay dividends
on the residual principle after covering all investment costs. On the basis of this research, the
theory of irrelevance of dividend policy began to develop.
Modigliani-Miller's theory of irrelevance of dividends claims that an investor can itself
influence profitability, regardless of the company's dividend policy. Let us suppose that from the
investor's point of view, the company pays higher dividends than needed. In this case, investor
will decide to use the dividends received to buy additional shares of this company in order to
maximize his cash flow. Now if we suppose that, according to the investor, the dividends paid by
the company are too low, then investor could sell his shares in order to increase the cash flows.
Thus, dividends are irrelevant for the investor, since he can independently generate cash flow,
depending on his need for cash. Therefore, authors of the theory to assert that the company's
dividend policy does not affect the behavior of investors.
Another justification for the theory of the irrelevance of dividends is the arbitration
process. The logic is that, in the case of the perfection of the capital market, the payment of
dividends will lead to a decrease in the market value of the share for the amount of the dividends
paid. Thus, the overall profitability for the investor will not change, as any growth in dividend
yield will be offset by a symmetrical decline in yield on capital gains. This allows us to assert
that the dividend policy does not have any impact on the behavior of investors.
The theory of irrelevance of dividends is based on the following assumptions:
− perfect capital markets;
− no costs for emissions and no transaction costs;
− absence of taxation of companies' profits and investors' incomes;
− capital structure does not affect its weighted average cost;
− company managers and investors have the same access to all available
information about the company's prospects;
− the cost of equity does not affect which share of profit will be directed to
the payment of dividends;
− dividend policy does not affect the company's capital investment.
The main object of criticism in the theory of the dividend irrelevance is its initial
assumptions, which could not be met in real markets. Both companies and investors are required
to pay income taxes, moreover, the costs for emissions and transaction costs could be high. To

12
sum up, it allows critics to assert that in real life the dividend policy can influence both the value
of the company's share capital and the behavior of investors.
1.1.2. Theory of the dividend payment preference
Gordon (1963) continued the scientific research of J. Linter (1956) and determined that
investors, on the basis of basic expectations, would prefer current constant dividend income than
possible future profits in the form of an increase in the value of the enterprise. Gordon and
Walter (1963) created a classic theory of selectivity of dividends. They believe that the
company's dividend and investment policies are interrelated. However, Fama and French (2001)
found that the share of issuers of shares paying dividends was constantly decreasing from 66.5%
to 20.8% in the USA during the period 1978 -1999. Thus, the theory of preferences of dividends
in its classical form was questioned.
It is interesting to study the influence of dividends on the dynamics of market value under
the reverse situation, when the tax burden on income from dividend payments is lower than on
the increase in the exchange rate for most groups of investors (for example, as in Germany).
Therefore, the payment of dividends is beneficial to shareholders and no additional
information on the market is announced about the growth of dividends. In the work "Dividends,
Taxes, and Signaling: Evidence from Germany", Yakov Amihud & Maurizio Murgia (1997)
considered the reaction of the German stock market to dividend announcements. The authors
found that, despite the fundamental difference in the position of shareholders on the taxation of
dividend payments, the reaction to the announcement of dividends in Germany is similar to the
reaction in the United States. In addition, the average dividend payout in Germany is less than in
the US, although the tax environment is motivating to the contrary.
Consequently, dividends bear a signal to the market, which is not mitigated by the tax
environment. The authors included 200 companies traded on the Frankfurt Stock Exchange and
showed the changes in dividends for the period from 1988 to 1992. In total, the study featured
255 "good" events, i.e. announcements on increasing dividends and 51 "bad" events. The
following results were obtained: dividends in part show the same as the company's income
statements. The growth of dividends raises the positive reaction of the market.
1.1.3. Tax-preference theory
The tax-preference theory (R. Lietzenberger and K. Ramaswamy, 1979) grounds on the
taxes and the time value of money. The tax preference theory conveys that due to the fact that
share price appreciation is taxed more favorably than dividend yields, investors prefer long-term
capital gains to the dividend income. Therefore, these investors will pay more for the shares

13
which reinvests back its earnings into capital-appreciating investment projects instead of the
using the earnings to be paid in dividends.
To clarify, the time value of money in this context conveys that a dollar of capital gain
due some time in the future could be taxed at a later date comparing to the dollar of dividends
which is paid at the moment. This relationship decreases the tax-adjusted cost of the capital gain
which is beyond that of the dividend. Therefore, the tax-preference theory states that investors
perceive the company as a place where his money can temporarily increase tax-free which is not
true with the dividends since the tax liability cannot be postponed in the moment when you the
company pays you dividends.
The second rationale behind the tax preference theory is that once capital gains turn into
inter-generational transfer, the shares are re-priced in the way so that capital gains are annulled
for the recipients of the stock which lead to zero tax. Hence, when investors deal with the inter-
generational transfer, they would again prefer long-term capital gains and would not favor the
reception of dividend payments at the moment.
Three abovementioned theories could be shown the following way in the figure below.

14
Graph 1. Trade-off between dividends now and capital growth in the future
1.1.4. Agency theory
In the framework of signaling theory and efficient market hypothesis, such concepts as
agency theory in the scientific community, corporate dividend policies and their impact of stock
prices are frequently considered. Nevertheless, in the recent years, the scientists (Cozorici, 2015;
Vaidean & Moza, 2015; Kim & Joen, 2015; Aamir & Shah, 2011; Mallikarjunappa &
Manjunatha, 2009) have investigated whether those theories remain consistent and whether other
theories (e.g. agency and behavioral thesises) offer more suitable theoretical context to explain
the dynamics of share prices.
The theory (M. Jensen and W. Meckling, 1986) supposes there are conflicts of interest
between different groups: management and shareholders, majority and minority shareholders,
shareholders and creditors of the company.
Simultaneously, in accordance with the agency theory, one can consider manager's
ambition to resolve conflicts with stockholders, as well as through dividend policy. Managers
might not be apt to reduce dividends, but choose to sustain them at a certain stable level. They go
as far as recoursing to external borrows to maintain the payment of devidends. As managers see
it, the prices of such borrowing are lower than attainable costs, which can suffer a decrease in
dividend payments (Brav et al., 2005). The dividend fee controls managers, since it is stimulated
by the response of the capital market, which is mainly determined by the dividends paid on
company's shares. Accordingly, that dividends obligate managers to act in the shareholder's
interests. Otherwise, the outcome may be unfavorable for the people managing the company.
The study (Lang, Litzenberger, 1989; Agrawal, Jayaraman, 1994) provide evidence that
dividends serve as a limitation for managers in the inefficient use of free cash flow and thus the
interests of shareholders are observed. The desire of managers to reduce the level of agency
conflicts is indirectly evidenced by the results of studies on the relationship between ownership
structure and capital structure.
1.1.5. Dividend signaling theory
Dividends carry information to the market. It is interesting that companies which increase
dividends are less susceptible to subsequent downturns of profits than those that do not change
dividend policy, despite the growth of profits.

15
Therefore, it can be assumed that changes in dividends are a signal that the current
growth in profit will be sustainable. As a result, in an imperfect market, the level of dividends
begins to supply the market with information not only about the company's cash flows, but also
about its investment opportunities and the available incentives to invest. The signaling theory of
dividends yields contradictory conclusions. The reduction of dividends can serve as a mixed
signal on the market.
On the one hand, this phenomenon can characterize the situation of not very successful
operation of the company and the lack of funds to make payments to the owners (direct negative
signal). On the other hand, the reduction of dividends may mean that the company has found
good investment opportunities, managed to overcome the typical problem of mature companies
which cannot find effective use of free cash.
A recent study by Bozos, Nikolopoulos and Ramgandhi (2011) explored the dividend
signaling theory in the bull and bear markets. Investigating companies that have been listed on
the London Stock Exchange from 2006 to 2010. Using a market model of event analysis, they
found confirmation for the signaling theory in both bull and bear markets.
Most of the research on the reaction of market value to changes in dividends was
conducted in developed markets. Less investigated are the factors of influence and market
reaction to dividend payments of companies in developing countries. Another interesting study
was conducted by V. Aivazian (2003), who analyzed the factors determining dividend policy in
emerging markets. The aim of the research was to test the factors that traditionally form the
dividend policy in the US market. The result of the study: the fundamental factors (investment
opportunities, financial constraints, etc.) remain important in emerging markets. Further
empirical studies have shown that the sensitivity of dividend payments of firms in emerging
markets to the factors that determine dividends differs from similar indicators for the United
States. The similarity is observed only on the following fundamental factors - a positive impact
on dividend payments:
− ROE
− MV / BV
− negative impact of financial leverage (level of debt).
The difference between emerging markets and the United States is that the "materiality"
of assets adversely affects dividend payments. This can be explained by the reduction of assets
that are suitable as collateral for a bank loan, that is, in essence, the significance of financial
constraints for investment decisions.

16
In the joint work of Grullon (2002) a new interpretation of the dividend as a signal is
proposed. The authors identified the relationship between changes in dividend policy and the
stages of the company's life cycle, with the key idea being that at the stage of maturity, the
company is characterized by a smaller set of investment opportunities, lower profitability and
risk, but the continuing high free cash flow (FCF), which motivates it to increase cash payments
to investors. This explanation was called the concept of maturity (maturity hypothesis). The
hypothesis was checked by the authors on a sample of 7642 companies, which for the period
from 1967 to 1993 made changes in the dividend policy (6284 upwards and 1358 downwards).
At the same time, a significant requirement for inclusion in the sample was a change in
dividends in the range of 12.5% - 500% of the previous level. In addition, companies that first
initiated or stopped paying dividends were excluded from consideration. The analysis used both
relative absolute and incremental indicators of the company such as ROA, capital expenditure
ratio, payout ratio, and adjusted for industry trends. Empirical evidence has confirmed that, on
average, lower ROA figures are observed after an increase in dividends.
Moreover, the authors emphasize that the firm that increases dividend payments goes
from the stage of growth of ROA to the stage of decreasing this indicator in the long term (the
average annual increase in ROA for 3 years before the announcement of a change in the dividend
policy was 0.44%, and in the subsequent 3 the ROA index decreased by 0.53%). For companies
that reduce dividend payments, there is an inverse relationship. The authors analyze cumulative
risk, which is mapped into the three-factor Fama & French model (Fama & French, 1993) for
market risk, size risk, and low-capitalization risk. The authors show that before the
announcement of an increase in the company's dividends, the samples were characterized by a
high aggregate risk, whereas after the changes the riskiness of firms declined.
At the same time, using the division of firms into quantiles by the extent of increase in
dividends, the authors came to the conclusion that the larger the announced increase, the greater
the risk is reduced. Multiplying the obtained risk assessment measures (beta coefficients) by the
mean values of the variables, an average change in the annual risk premium for firms increasing
dividends (-1%) and decreasing dividends (+ 2%) was obtained. Additional indicator of the
company's maturity is changes in capital expenditure (CAPEX) and accumulated cash.
Statistics shows that firms that increase dividend payments will in future reduce capital
costs and funds on accounts (for firms that reduce dividends, it is characteristic of the opposite
case), confirming the hypothesis that such firms do not need investments (due to the narrowing
of investment opportunities) and send free funds to pay dividends.

17
Nevertheless, after the black Monday of 1987, the validity of dividend signaling theory
became questionable, and in subsequent years several Nobel Prize research were associated with
the irrationality of the market. Chairman of the Board of Governors of the Federal Reserve Alan
Greenspan introduced the concept of "Irrational exuberance", which means a reassessment of the
market. A new generation of economists has focused on psychological and behavioral aspects
and are convinced that the movements in the prices of financial instruments are predictable to
some extent because of mental prejudices.
1.2. Efficiency market hypothesis
According to the market efficiency hypothesis, securities prices already contain all the
essential information (Fama, 1991). In other words, the information must be reflected in the
value of the stock completely and immediately.
Research in the field of information impact on stock price behavior began to develop
actively in the mid-1960s. However, the first theoretical propositions to the effective market
hypothesis were presented in 1900 by the French economist L. Bachelier, in his thesis he touched
on the subject of random fluctuations in quotations of securities on the stock market. In 1965, the
hypothesis of market efficiency was fully developed by the American researcher Fama (1965),
known to the world as the "father of the effective market hypothesis."
It was defined that by testing the efficient market hypothesis, researchers check the extent
of information reflection in the stock price of the security. This relation is of a great interest for
almost all agents of financial markets - investors, issuers, managers and even regulators. Their
interest can be explained by the fact that stock prices determine the distribution of income in the
market. For instance, if the financial markets were perfectly efficient, then the costs related to the
stock analysis would be eliminated as the analyst’s work would be unnecessary. On the contrary,
in the case of incompletely perfect market, investors would bear these expenses in order to
obtain private analytics, expecting to receive a higher yield than a market receives. These
actions, in turn, would increase the efficiency of the market - "this is confirmed by the actual
state of affairs and growth in annual spending on the analyst" (Volodin, 2012).
The efficiency of the market could be divided into three forms as it was introduced by
Mallikarjunappa and Manjunatha (2009): weak, semi-strong and strong. A weak form of
efficiency supposes that the market knows the history of prices and yields of securities. Semi-
strong form of market efficiency implies that market participants have access to published
information, including messages contained in periodicals, television and radio news, and
analytical reviews in addition to statistical information on past prices and stock returns. A strong

18
form of market efficiency characterizes a market in which absolutely all information, including
insider information, is open for all market agents.
The forms of market efficiency consistently include each other. This means that the semi-
strong form of efficiency includes a weak form, and the strong form includes the semi-strong
form of efficiency.
Chart 1. Three forms of the efficiency of the market
Market inefficiency can be explained by behavioral aspects. A widespread common
mistake is "herd behavior". Shiller (2005) concluded that the reason for this behavior is a large
cascade of information. Individuals who have been exposed to the crowd cannot make individual
and independent decisions. He also compared the behavior of the crowd to the behavior of the
barbarians, where impulsiveness, lack of reflection, excessive nervousness, lack of doubt - the
basic behavioral aspects. Further, Bondt and Thaler (1985) concluded that investors tend to
overreact to news, overestimate them; another behavioral error is the illusion of control - a
tendency on the part of people to think that they can influence the outcome of uncontrolled
events. Additionally, the results of Slovic, Fischhoff and Lichtenstein (1977) showed a steady
trend of investors to excessive confidence.

19
In the article "Analysis of the Applicability of the Efficient Market Hypothesis for
Modeling Price Dynamics" Volodin came to the following conclusion, analyzing the hypothesis
of an effective market: the researcher concluded that markets cannot be fully effective, hence,
"price fluctuations cannot be accidental, and it is quite possible to assert about the possibility of
at least partial forecasting of prices for financial assets" (2012). Accordingly, it is possible to
make profits by finding a market inefficiency by forecast the stock prices of securities.
Thus, in this research it is vital to evaluate how efficient the Russian financial market is
and whether there is a place of making trading profits by forecast of stock prices. Then the first
research question addressed in this study can be formulated in the following way.
RQ1. How efficient is the Russian financial market?
Volodin (2012) tested the state of Russian financial market for the time period before
2012. He concluded that the market has a semi-strong form of efficiency. In this regard, it can be
assumed that the state of financial market has not changed significantly since 2012 and,
therefore, the following hypothesis is set and will be tested further on:
H1. Russian financial market has a semi-strong form of efficiency (Volodin, 2012).
To test the hypothesis of an efficient market, a new toolbox is needed, according to
several papers written almost at the same time in the 1960s: Jack Treynor (1962), William F.
Sharpe (1964), John Lintner (1965), Jan Mossin (1966). According to the Markowitz (1952)
paper on diversification and modern portfolio theory, the researchers proposed a new pricing
model of assets - CAPM. The hypothesis of efficient markets together with the CAPM model,
gave a strong impetus to the calculation of the profitability indicator, which is unique for each
company (Brown and Warner, 1985).
Profilet and Frank (2013) took 15 random firms traded on the NASDAQ in the period
from 2008 - 2012. Using the market model of event analysis, they found abnormal revenues
before declaring dividends and concluded that the market has a semi-strong form of efficiency,
and added that abnormal returns before the event could indicate the existence of insider trading
and information leakage.
Dharmarathne (2013) tested the effectiveness of the market using the event analysis
method analyzing 137 declarations of dividends during the period from 1999-2005 on the Sri
Lanka exchange. Only a few statistically significant anomalous incomes were recorded in the 31-
day window with 1% and 5% confidence level, it was concluded that the Sri Lanka Exchange
observes the efficiency market hypothesis.

20
The opposite results were obtained by Suwanna (2012), indicating the existence of
abnormal returns within two days after the payment of dividends on the Thailand Stock
Exchange in the period from 2005-2010. She concluded that the Thai market does not have a
semi-strong form of market efficiency.
1.3. Research in relationship between dividend payments and stock price
dynamics
A particular feature of analyzing dividend distributions is that they are not associated
with any new information. The announcement of the size of the dividend payment is made weeks
before the distribution date. When investors receive the dividends, the size and timing of the
payment merely confirm what they already know. It is important to evaluate how the
announcements of the changes in dividend payments influence the stock price dynamics in order
to investigate whether managers could have the stock prices increased if they change the
dividend policy, and, particularly, the change in the size of dividends. Thus, the following
research question is addressed in this study:
RQ2. How do the changes in the size of dividend payments affect the stock price
behavior in Russia?
If the increases and decreases in the dividend payments affect the stock prices, then it is
crucial to understand in which cases there is a place for this relationship and which factors could
also have an impact on it. Thereby, the third research question is stated in the following way:
RQ3. Which factors should the management and shareholders of the company take into
account when setting dividend payments in Russia?
Many academic papers are dedicated to the research in the relationship between dividend
announcements and the dynamics of stock prices. However, these studies have conflicting
results. The results of studies have been summarized in the Table 2. The general conclusion that
follows from the studies below is that in most cases the relationship between the announcements
of dividend payments and stock returns is ambiguous, and, thereby, are discussed further on.

21
Table 2. Relationship between the announcements of dividend payments and stock returns
Positive relationship Ambiguous relationship No relationship
Khanal A., Mishra A. (2017) Kvamvold K., Lindset S.
(2018)
Dharmarathne (2013)
Lofti T. (2017)
Aggarwal N., Mohit G.
(2018)
Profilet, Frank (2013)
Ansary O., Hussien M. (2017) Babu S., Nagendra M.
(2017)
Abbas G. (2015) Farrukh K. et al. (2017)
Mallikarjunappa T.,
Manjunatha T. (2009)
Legenzova R. et al. (2017)
Michaely R., Thaler R.,
Womack K. (1995)
Berezinetz I. et al. (2016)
Healy P., Palepu K. (1988) Maio P., Santa-Clara P.
(2015)
Aharony J., Swary I. (1980) Suwanna T. (2012)
Ahmed M., Zuguang H.
(2010)
Teplova T. (2008)
Woolridge G., Ghosh C.
(1985)
From the earliest study on the topic of the relationship between dividends and stock
prices of Healy & Palepu (1988), Aharony & Swary (1980), Michaely & Thaler & Womack
(1995) it can be concluded that: the stock prices on average increase when companies increase
dividends, and on average decrease when dividends decrease. Thus, the "good" news for the
market is an announcement of an increase in dividends, while the "bad" news - a decrease. This
news interpretation was adopted in our study.
More recent studies (Khanal, A., Mishra, A., 2017; Lofti, 2017; Mallikarjunappa, T.,
Manjunatha, T., 2009, and others) also obtained the similar results showing a significant
positively associated reaction in stock prices around the event date. On average, stock prices
reacted positively to the increase of stock dividends and negatively to the decrease of the size of

22
dividend. However, the strength of relationship between these two parameters differs from one
financial market to another or from one time period to another. For instance, compared to other
findings of abnormal returns (5.9%), results from the study of Khanal and Mishra (2017) show
small abnormal returns (about 1.81%) attributable to stock dividend announcements that are
cumulative of the announcement day and up to 3-day post-announcement days.
Another interesting research have been made by Ansary, O., Hussien, M. (2017). They
examined the effect of two types of corporate actions, “Stock Split” and “Stock Dividends”, on
the shares’ prices, liquidity changes, and price volatility; and to investigate the efficiency of the
Egyptian stock market in response to the announcement of the corporate actions. The analysis
concluded that the announcement of both of stock split and stock dividend has a positive impact
on stock prices.
In the study conducted by Abbas, G. (2015), one interesting aspect of the stock price
behavior was noticed which shows that the only 5 out of 41 days in the considered window
showed statistically significant. This may be a result of other factors affecting investors’
behavior such as economic, political and others. In general, a quick and positive response of
stock prices to dividend announcement on the event day have been concluded. This evidences
that dividend information reflects on stock prices. The average abnormal return fluctuates
surrounding zero in alternating days giving uncertain indication of investors gain or loss both in
the pre and post dividend announcement days.
An unambiguous view of the positive reaction of the market to good news is not always
fulfilled. Dividends bear a dual signal, which is often much deeper than a simplified view of the
benefits of growth in current payments as a signal of a future increase in profits. The change in
dividends gives the market information not only about the company's projected cash flows, but
also about its investment opportunities, as well as the motives for investing, which is partly
determined by the company's maturity stage in the market. If the company knows that it can
effectively use the funds, investing it in new projects, sending a signal through lowering
dividends, then it can not only not scare off investors, but, on the contrary, attract them with the
prospect of getting more revenue.
An interesting study demonstrating this more complex dividend signal is the work of
Woolridge and Ghosh (1985) in which they showed that the share price would at least not react
negatively to the announcement of a decrease in dividends if the firm could provide investors
with information that these unpaid flows will really go to finance a profitable project. In another
key work on the topic under consideration, Maio and Santa-Clara (2015) found that for

23
companies with good investment opportunities, the decline in the share price is statistically
insignificant with a decrease in the dividends, and, on the contrary, for companies with poor
investment prospects the decline in the share price is statistically significant with a decrease in
the dividends. Babu, S., Nagendra M. (2017) found selection of samples influence on dividend
announcement impact on abnormal returns. If the random sample includes only either positive or
negative cumulative return stocks that may impact the abnormal return of stocks, it means some
stocks abnormal returns may get influence by dividend announcement and some stocks won’t get
influence by dividend announcement.
Large-cap stocks displayed the presence of significant abnormal returns in the pre-event
period, whereas the mid-cap stocks displayed the same in the post-event period, according to the
study of Aggarwal, N. and Mohit, G. (2018). The results of the small-cap stocks mirrored that of
large-cap stocks but they are the only ones in which cumulative average abnormal returns were
found to be significantly displaying the lagged response toward the event. The decrease in
dividend rate by 20 percent or more did not result in average abnormal returns in either pre-event
or post-event window.
The study of Ahmed, M., Zuguang, H. (2010) also confirmed an ambiguous relationship
between the announcements of dividend payments and stock returns. They have analyzed the
effect of dividend announcement on stock price in Shanghai Stock Exchange for the stocks listed
in SSE 180 index during the period from January 2005 and December 2009. They have found
that on the day of dividend increase announcement, stock prices increase and investors gain
abnormal returns. However, as for the effect of dividend decrease on the announcement day,
market does not experience any negative abnormal returns implying that investors in Shanghai
Stock Exchange do not regard dividend decrease as unfavorable information. Moreover,
significantly large dividend increase announcement has much higher effect on the value of
abnormal returns implying that size of the dividend increase is an important consideration to the
investors.
There is also a spillover effect to other stocks that do not pay dividends as it was
confirmed by Kvamvold and Lindset (2018). They claim that this spillover effect is a result of
investors reinvesting dividends in broad benchmark portfolios. The trading volume is higher on
the payment day for both dividend payers and non-dividend payers. Furthermore, they have
found that investors to a large extent try to reinvest dividends three days before their distribution.
The effects that dividend flows have on returns appear to be temporary. Thus, they also provide
evidence supporting temporary demand-driven price pressure, referred to as the price pressure
hypothesis in the literature.

24
Another study (Berezinetz et al, 2016) is conducted for forty Russian companies during
the 2010-2014 years. It is assumed that the expectations of market participants regarding the
magnitude of the company's forthcoming dividend payments are formed by forecasts of analysts.
As a proxy for dividend "surprise" the deviation is used, the deviation of the value of the actually
paid dividend from the consensus forecast of analysts regarding these payments. The analysis
showed that, on average, the Russian market reacted negatively to both positive and negative
dividend "surprises". Thus, the work confirms the conclusions of existing Russian market
research conducted using the "naive" model of market reaction to dividend announcements of
companies. Results were discussed from the point of view of the information efficiency of the
market, investors' expectations and the specifics of their behavior, the state of the Russian market
in the period under investigation.
To sum up, the relationship between dividend payments and stock prices could differ
depending on multiple factors such as the form of market efficiency, the state of the economy
development, investor’s preferences and risk sentiment, dividend’s size, thus, confirming that on
different financial markets and at different time periods financial agents react to the dividend
announcements in many ways. In this regard, the following hypotheses regarding the relationship
between publication of dividend payments and price behavior needed to be tested for the Russian
market for all cases of dividend changes and not only for the cases of dividend surprises as it was
studied by Berezinetz et al. (2016):
H2a. Positive announcements of dividend payments (“good” news) have a positive
impact on the stock price dynamics of Russian companies (Ansary O., Hussien M., 2017; Abbas
G., 2015; Mallikarjunappa T., Manjunatha T., 2009).
The reaction of the market in the opposite case (negative dividend announcements)
should also be tested.
H2b. Negative announcements of dividend payments (“bad” news) have a negative
impact on the stock price dynamics of Russian companies (Ansary O., Hussien M., 2017; Abbas
G., 2015; Mallikarjunappa T., Manjunatha T., 2009).
The study (Teplova, 2008) aims at studying the relationship between dividend payments
and stock prices of Oil & Gas companies. The results of the research of the reaction of the stock
market on 118 announcements of Russian companies on the change in the value of dividends per
share for the period from 1999 to 2006 are shown. The hypothesis which was tested is the
announcement of an increase in dividends will not be perceived as a good signal for the firm, if it
has the potential for more effective investment of earned funds. Since the sample includes

25
rapidly growing Russian companies throughout the period under review, they assume the
negative reaction of the market to "good" news (increase in dividends). However, they divided
the sample into two:
− companies with high investment prospects, but significant financial constraints
(where investment costs were sensitive to the operating cash flow received);
− companies with high cash inflows, with high return on invested capital and
opportunities to raise capital from the external market.
The initial survey involved large Russian companies that paid dividends in the 1999-2006
period and quoted shares on both the RTS exchange and at the same time on the western stock
exchanges of the New York Stock Exchange (NYSE) or the London Stock Exchange (LSE).
Thus, the second hypothesis which was tested is the difference in reactions to announcements
regarding the change in dividends on the stock quotes of various exchanges. Data on common
shares were taken for the Russian market, and for depositary receipts (ADR, GDR) for the
western market.
The hypothesis of the importance of investment opportunities and excess cash flows is
tested through industry comparisons and the allocation of time subperiods. It is shown that
Russian and foreign investors negatively perceive the information on the increase in dividends
for Russian companies with the availability of investment opportunities and financial constraints.
For companies with significant cash receipts and potential agency conflict (oil and gas sector in
Russia), investors are positive to the increase in the size of dividends. According to the time
period or, in other words, the state of economy, the relationship between prices and dividends
changes (Teplova, 2008).
Therefore, this study also aims to test the hypothesis for the Russian market during two
time periods with a more macroeconomic situation and less flavored macroeconomic situation:
H3. The state of economy influences the relationship between announcements of
dividend payments and price behavior of Russian companies (Teplova, 2008).
The abovementioned hypothesis is also tested in the studies of Legenzova R. et al. (2017)
and Aggarwal N., Mohit G. (2018). In the study (Legenzova R. et al., 2017), the authors have
found that during the crises the relationship between stock price dynamics and dividend
announcements is stronger for Baltic market. The similar results were gained in the work of
Aggarwal N., Mohit G. (2018) for the Indian market.

26
1.4. Research gap
In the field of corporate news affecting stock prices there are a lot of foreign studies in
financial literature. In particular, a big number of papers are devoted to the analysis of the
information significance of analytical reports with recommendations on stock price dynamics,
mergers and acquisitions affecting share prices after the announcements, macroeconomics
announcements such as unemployment levels and inflation in the country, news on big changes
in government policies.
There are numerous Russian studies on the analysis of dividend effects. The most recent
have the following findings. Bogataya and Evstafyeva (2009) believe that when building their
dividend policy, companies take into account the level of dividend payments of competitors'
firms. Ivashkovskaya and Kukina (2009) refuted the hypothesis that dividends paid negatively
affect the economic profit of Russian enterprises. Stepanova and Kuzmin (2011) confirmed the
hypothesis that increasing the share of minority shareholders and management in the company
positively affects the operational efficiency of Russian enterprises. However, these academic
papers do not study the relationship between dividend announcements and the stock prices.
However, if to look particularly on the research in relationship between dividend
payments and stocks, then one can be surprised by the low level of scientific research in this area
comparing to other event studies. There are only few studies investigating the relationship
between dividend payments and dynamics of share prices in developing countries.
To sum up, there is only one research conducted for whole Russian market which
analyzes the relationship between dividends and stock market (Berezinetz et al., 2016).
However, this research is specified for the dividend surprises – those information events
regarding dividends that do not reflect the expectations formed by analyst’ recommendations.
Another study of Russian market (Teplova, 2008) was conducted only for an Oil & Gas segment.
In this study the research gap in the field of relationship between dividend payments and stock
price behavior will be filled for the Russian market.
Thus, the research gap in the field of the dividend announcements and stock prices
exists due to the narrow focus of the current research for Russian financial market.
To fill the research gap the research questions, as they have already been mentioned
earlier, have been formulated in the following way:
RQ1. How efficient is the Russian financial market?

27
RQ2. How do the changes in the size of dividend payments affect the stock price
behavior in Russia?
RQ3. Which factors should the management and shareholders of the company take into
account when setting dividend payments in Russia?
Consequently, in order to provide answers to the abovementioned research questions, the
hypotheses regarding the relationship between publication of dividend payments and price
behavior and the efficiency of Russian financial market have been tested in this study. Each of
hypotheses is tested by applying methods of event study analysis.

28
CHAPTER 2. METHODOLOGY AND EMPIRICAL STUDY
This chapter discusses the process of data collection and its processing, and also
discusses the main problems encountered in the study event analysis, including clustering of
events and the release of related news. Then the chapter presents the ways to solve these
problems. It also provides descriptive statistics on the samples accessed, the results of an
empirical study based on the methodology of event study and a detailed analysis of the
assessment of the significance of the results of this study.
2.1. Event analysis
One of the main instruments for testing financial decisions is event study analysis. Event
studies are one of the mainstays of empirical corporate finance research. The purpose of an event
study is to test what Fama (1970) called semi-strong efficiency, that markets react rationally to
the release of public information. The essence of the method is to track the reaction of the stock
market to certain events caused by managerial decisions or external factors. In the following
areas of corporate finance, the method has proved its worth:
− market assessment of decisions regarding external growth of companies (mergers and
acquisitions)
− the impact on the market value of the company's development strategy through
diversification or focus (development of key competencies)
− implementation of the focus strategy through the sale of non-core assets
− signal effects of financial performance (announcements of the dynamics of profit,
operating or net cash flow)
− financial decisions, for example, decisions on attracting public debt or equity capital, a
decision on private capital raising, changes in dividends per share or dividend policy
− decisions on the beginning of public trading in shares (IPO), on entering foreign
exchanges, on the placement of depositary receipts (ADR, GDR)
− the impact on the market value of changes in the macroeconomic environment, legislative
developments in the market
The empirical studies based on the method of event analysis have a long history. The first
work belongs to J. Dolley (1933), which shows the influence of stock splits on the market
capitalization of the company. The sample consisted of 95 events (crushing) on a time interval
from 1921 to 1931. J. Dolley found that the stock price in response to the announcement of
fragmentation increased in 57 cases, and fell only in 26.

29
Today, most of the research is based on an algorithm that was developed in the late 60's
in the works of R. Ball & Ph. Brown (1968), and E. Fama (1969). Ball and Brown (1968)
analyzed the information value of announcements about the company's financial results (profit)
on its market valuation. In the joint work of Eugene Fama (Fama et al, 1969), the influence on
the market value of the company of the facts of stock collapse. At the same time, the effects were
differentiated for situations of simultaneous increase in dividends.
In recent years, many modifications of the event study have been proposed in the
framework of the developed algorithm Ball & Brown (1968), Fama (1969). The need for
adjustments to algorithms is associated with an attempt to apply the method in imperfect
markets, which are the markets with poor information efficiency and low liquidity. For example,
modifications allow to take into account the presence in the sample of companies with small
capitalization or low liquidity of shares.
A number of modifications allow testing of rather complex hypotheses, delineating the
influence of a number of factors in the observed market reaction. For example, Jay Ritter (1991)
applied the event study method to analyze the operation of an IPO (initial public offering of
equity). The peculiarity of his model is the absence of a period of observation of the capital
market for the company before the analyzed event, i.e. the impossibility of calculating the
"normal yield" of stocks from the available past data.
Leveling the influence of secondary factors on the dynamics of shares
In previous studies, there was often the problem of the accuracy of determining the
impact of an event on the dynamics of a security. For example, the impact of analytical
recommendations is often significantly overestimated due to the fact that the reports were issued
in the same period as important corporate news, for example, financial statements.
Accordingly, if we consider only the recommendations of analysts, excluding other
important events from attention, while for a long period of time, then the reliability of the results
will be significantly reduced. In their article, Jiang and Kim (2010) used a strong and sharp
increase in the stock price to level the influence of secondary news as a sign that the information
event took place. Then they assessed the reaction of investors only to those changes in
recommendations that were issued immediately after such abnormal leaps.
A similar approach was applied by the researchers Park and Pincus (2000). It consisted in
determining jumps with the help of econometrics and attributing these jumps to information
events, which really influenced the movement of quotations. In order to eliminate this type of
problem in this study, first, the news of the companies was studied in the aggregate, and

30
secondly, a not very long window of events was selected, 5 days before and after the
announcement of the news, in order to reduce the likelihood of one corporate event affecting the
other.
2.2. Research strategy
The research is conducted in accordance with the philosophy of positivism, which asserts
that the surrounding reality can be studied through empirical research. Then the deductive
method of investigation is applied, so the hypothesis is built on the existing theory, then the data
is analyzed and finally the hypotheses are confirmed or disproved. On the contrary, the inductive
approach begins with the study of data, and then the formulation of the theory. Based on
previous studies, a quantitative method of data analysis was selected for the conduct and
interpretation of the study. The methods that is used in the research is event study analysis.
The analysis is conducted in two stages. In the first stage of the research, Russian
companies which pay dividends were identified. As the payments of dividends is not necessary
for firms, the first part of the analysis evaluated how many companies listed on the Moscow
stock exchange paid dividends and publicly disclosed such information. In the second stage of
the analysis the evaluation of dividend announcement events that have an impact on stock
quotations have been made. It employed the mean adjusted return model event study
methodology. The mean average adjusted return model of the event study methodology reposes
on the analysis of share price dynamics during the several time intervals which are: pre-
announcement, announcement and post-announcement periods.
2.3. Data collection
All announcements of dividend payments in cash were considered. As the date of the
event, the date of the meeting of the Board of Directors was adopted, at which the dividend
amount recommended for payment is declared. This is explained by the fact that it is on the day
of the board meeting that real information on recommended dividends for shares becomes
available to the market. The dates of meetings of the boards of directors (and the corresponding
dividend announcements) were obtained from the database of Thomson Reuters Eikon.
This database contains almost all the kind of company’s information news in different
countries, and Russia is no exception. Stock prices were also downloaded from Thomson Reuters
Eikon database. Since it provides a wide range of information, opening up a more global picture
to the reader, it allows to determine which news influenced the jump in the abnormal return of

31
the stock. Most publications occur in real time, which is another advantage of this database. The
disadvantages of the database include the following:
- incompleteness, that is not all corporate news of the company can be found in the
database of Thomson Reuters Eikon
- the inconvenience of downloading data, most information regarding the dates of
dividend payments could not be downloaded automatically
2.4. Research model
Firstly, to conduct event study analysis the estimation window and event window must be
defined properly to preserve the high rate of accuracy. After defining the most optimal time
intervals in the methodology, the calculations of stock’s returns, abnormal returns and
cumulative returns must be conducted. Finally, the results are tested to be statistically significant
using t-test statistics.
1. Estimation window and event window
One of the most crucial factors in the event study is defining the most optimal time period
of observations. Firstly, the estimation period needed to be defined (𝐿1 on the Chart 2). The
estimation window is the time period under which the stock prices of the company are analyzed.
For the purpose of this study, the length of estimation window is 120 days which is the most
common figure for the estimation period (Pogozheva, 2013). When analyzing events that have
more long-term effects such as mergers & acquisitions deals, a longer time period is taken.
However, the dividend announcements have a short-term impact on stock prices which justifies
the chosen estimation period of 120 days.
Secondly, the 11-day event window (𝐿2 = 11 days) have been chosen, the time interval
during which information messages were observed: 5 days before a dividend announcement
event and 5 days after the dividend announcement event. Several days before the event is
important to consider, since if the information message is forecasted, then part of the abnormal
return of the security can begin to be realized even before the publication of the event. Several
days after the announcement is important to analyze, because the market reaction to the event is
often not instantaneous, in addition, this period is interesting for understanding the speed of
processing information and, consequently, for the testing of the market efficiency. In the case
where the abnormal profitability is higher or lower than zero, there is a possibility of creating a
profitable trading strategy if transaction costs were not incurred, and this contradicts the
hypothesis of an effective market.

32
Chart 2. Time intervals in event analysis
Often a longer event window is used in the cases when the study aims to analyze the
impact of the most significant and rare events for the company (for instance, merger and
acquisition) because their effects can be manifested for more than one year. When analyzing
events that have more short-term effects, authors generally use the 21-day event window (Irum,
Rafique, Hassan, 2012) or shorter, for example 11 days or even 3 days (Andres et al., 2013).
However, in this study, it was decided to consider a shorter period of time. Firstly,
because this research does not aim to determine how the news influenced the share price over a
long period. The objective of this research is to identify how the stock price changes at the
moment of the event. Secondly, over a longer time interval, the probability of correctly
correlating news to a jump in abnormal returns is reduced, as the influence of other information
events that arise in the industry or in the company is increased. Therefore, the 11-day event
window for the purposes of this study is the most optimal, thereby reducing information "noise".
2. Analysis of the stock returns
Stock return. The stock return can be defined as the closing price on a given day divided
by the closing price for the previous day minus one. Another way to determine the stock return is
through a lognormal distribution. It is the lognormal distribution that has been used in this paper
for more comparable values of the returns of different companies, since the values of the shares
of companies may differ from each other.
It is also important to note that only trading days of the exchange were used, and not
calendar days. As a result, the following formula was used to estimate stock return:
𝑅𝑖,𝑡 = ln𝑃𝑖,𝑡
𝑃𝑖,𝑡−1,
where 𝑃𝑖𝑡 – closing price per security i per day t, а 𝑃𝑖𝑡−1– the closing price for the
security i on the previous day t-1.

33
Expected returns. Next, for each stock on each of the days, the average expected return
was calculated. Expected return is a security yield in the case of absence of an event such as
dividend publication. The expected return is determined for the estimation window followed by
the event window. In the formula below, the abnormal return is a random variable:
𝐸[𝑅𝑖,𝑡] = 𝑅𝑖,𝑡 − 𝜀,
where 𝐸[𝑅𝑖,𝑡] are expected returns of security i per day t, 𝑅𝑖,𝑡 – returns of security i per
day t and ε – random variable.
Accordingly, the abnormal return in the event analysis is the difference that arises
between the yield at the occurrence of an event and the expected yield that would arise if the
event did not occur.
Next, the mean adjusted return model was used to estimate the expected return. In the
event analysis, it is also possible to use more complex models, for example, market models,
three-factor models of Fama-French or even a four-factor model. All of the above models may
differ in the accuracy, bias in estimating the abnormal return.
The mean adjusted return model is one of the most used models in the event analysis. For
example, Brown and Warner (1985), in their work on the event-based analysis method "Using
daily stock returns: The case of event studies", found the following result: both the mean
adjusted return model and the market model can reasonably be used in the context of event
analysis, since in practice, the results of these models only slightly differ from the results
obtained during the use of more complex models. In addition, the model with the average is not
very applicable to data with a wide window of events, because the variance of returns for a few
days is not high enough, and in this study, a narrow window of events makes it possible to use
this model.
It is assumed that in a mean adjusted return model the stock expected return is determined
based on the selected estimation window period, which takes place exactly before the event
window. In this study the estimation window of 120 days is used. Hence, the expected return was
calculated using the following formula.

34
𝐸[𝑅𝑖,𝑡] =1
120∑ 𝑅𝑖,𝑡
−6
−126
where 𝐸[𝑅𝑖,𝑡] are expected returns of security i per day t, 𝑅𝑖,𝑡 – returns of security i per
day t.
Abnormal return. After estimating the expected return, the abnormal return must be
calculated. As it was mentioned earlier, it is a random variable that remains above the expected
yield. The indicator of abnormal return in the event analysis is the influence of the information
message on the change of the stock dynamics. The abnormal return is calculated by the formula
presented below:
𝜀 = 𝐴𝑅𝑖,𝑡 = 𝑅𝑖,𝑡 − 𝐸[𝑅𝑖,𝑡],
where 𝐴𝑅𝑖,𝑡 are abnormal returns of security i per day t, 𝐸[𝑅𝑖,𝑡] are expected returns of
security i per day t, and 𝑅𝑖,𝑡 – returns of security i per day t.
Cumulative abnormal return. After the calculation of abnormal returns, the cumulative
abnormal returns (CAR) is calculated for each event for the entire period of the event window,
which is the sum of the abnormal returns for a given period:
С𝐴𝑅𝑖(𝑡1, 𝑡2) = ∑ 𝐴𝑅𝑖,𝑡𝑡2𝑡=𝑡1 ,
where 𝐶𝐴𝑅𝑖,𝑡 are cumulative abnormal returns of security i per day t and
𝐴𝑅𝑖,𝑡 are abnormal returns of security i per day t.
The cumulative abnormal returns indicate whether the event led to a change in the market
return of the company's shares. In order to draw conclusions on the full sample of data, the next
step is to calculate the average values of abnormal returns (AAR) and cumulative average
abnormal returns (CAAR) for each day of the event window:
𝐴𝐴𝑅𝑡 =1
𝑁∑ 𝐴𝑅𝑖,𝑡
𝑁𝑖=1 ,
𝐶𝐴𝐴𝑅(𝑡1, 𝑡2) = ∑ 𝐴𝐴𝑅𝑡𝑡2𝑡=𝑡1 ,

35
where 𝐴𝐴𝑅𝑡 is the average abnormal return for all emissions on day t, and
𝐶𝐴𝐴𝑅(𝑡1, 𝑡2) is the average cumulative abnormal return for all emissions over a period of time
[𝑡1, 𝑡2].
Testing hypothesis. The final stage of the event analysis is to test the hypotheses.
This study aims to test several hypotheses, each of which is tested by applying the
described methods of event study analysis. With the help of event analysis, the following
hypothesis were evaluated:
H1. Russian financial market has a semi-strong form of efficiency (Volodin, 2012).
To test this hypothesis, the speed of market reaction to the dividend announcements is
defined using the calculation of average abnormal return and cumulative average abnormal
return of the stocks.
H2a. Positive announcements of dividend payments (“good” news) have a positive
impact on the stock price dynamics of Russian companies (Ansary O., Hussien M., 2017; Abbas
G., 2015; Mallikarjunappa T., Manjunatha T., 2009).
To test the hypothesis 2a, the average abnormal return and cumulative average abnormal
return are calculated for the subset of good news in the final sample during the period from 2012
till 2018.
H2b. Negative announcements of dividend payments (“bad” news) have a negative
impact on the stock price dynamics of Russian companies (Ansary O., Hussien M., 2017; Abbas
G., 2015; Mallikarjunappa T., Manjunatha T., 2009).
To test this hypothesis, the average abnormal return and cumulative average abnormal
return are calculated for the subset of bad news in the final sample during the period from 2012
till 2018.
H3. The state of economy influences the relationship between announcements of
dividend payments and price behavior of Russian companies (Teplova, 2008).
To test the final hypothesis, the average abnormal return and cumulative average
abnormal return were compared for each of the subsets of good and bad news in the final sample
separately for the 2012-2013 years and 2014-2016 years.

36
3. Statistical significance
In the final stage of event study analysis, the results are needed to be tested for being
statistically significant. Statistically significant results are those that are understood as not likely
to have occurred purely by chance and thereby have other underlying causes for their occurrence.
The significance level for a study is chosen before data collection, and typically set to
5%. To test the significance, the t-test statistics is used.
Every test of significance begins with a null hypothesis H0 which represents a theory that
has been put forward, either because it is believed to be true or because it is to be used as a basis
for an argument, but it has not been proved.
In this case, the null hypothesis states that the average abnormal returns equal to zero at
time t0 - the day of dividend announcement, so that information event does not affect the average
yield. The same is tested for the cumulative average abnormal returns.
𝐻0: 𝐴𝐴𝑅𝑡 = 0
𝐻0: 𝐶𝐴𝐴𝑅𝑡 = 0
where 𝐴𝐴𝑅𝑡 is the average abnormal return for all emissions on day t, and
𝐶𝐴𝐴𝑅(𝑡1, 𝑡2) is the average cumulative abnormal return for all emissions over a period of time
[𝑡1, 𝑡2].
In addition, the question is whether the average abnormal return is different from zero in
the period before and after the event. The analysis of the period before the event is important
because if the event could be forecasted, then the part of abnormal return must be realized before
the event occurs. The analysis of the period after the event is of interest for testing the market
efficiency, since the determination of the speed of processing the information received by the
market is an empirical question. If the abnormal return after the event systematically differs from
zero, this contradicts the hypothesis of an effective market, since it assumes the possibility of
creating a profitable trading strategy in the absence of transaction costs.
A null hypothesis is rejected if the critical value of the test statistic exceeds a certain level
corresponding to 5% level of significance. The test statistic is a random variable, since the
abnormal return is measured with an error. The presence of error is determined by two factors.
Firstly, in the case of inaccurate assumptions regarding normal profitability in the absence of
news. Secondly, the actual returns of individual companies on the date of the event depend on

37
the set of other factors, so that this component of the abnormal return is not averaged to zero in
the cross-sectional analysis. The level of statistical significance of the results obtained is
determined by the following calculation of the t-test statistics:
𝑡𝑡𝑒𝑠𝑡 𝐴𝑅 =
1𝑁
∑ 𝐴𝑅𝑖,𝑡𝑁𝑡=1
√1
𝑁 (𝑁 − 1)∑ (𝐴𝑅𝑖,𝑡 − ∑
𝐴𝑅𝑖,𝑡
𝑁𝑁𝑡=1 )2𝑁
𝑡=1
Since there is no information at what specific moment the information regarding dividend
announcements has spread, it is necessary to check the significance of the average cumulative
abnormal returns on certain time intervals. To do this, we also calculate t-statistics for the
average cumulative abnormal returns:
𝑡 =𝐶𝐴𝐴𝑅(𝑡1,𝑡2)
𝑠(𝐴𝐴𝑅𝑡)√𝐿,
where L is the number of days during which average anomalous returns are accumulated
in CAAR (𝑡1, 𝑡2) and S is the standard deviation which is calculated in the following way:
𝑆 = √1
𝑁 (𝑁 − 1)∑(𝐶𝐴𝑅𝑖,𝑡 − ∑
𝐶𝐴𝑅𝑖,𝑡
𝑁
𝑁
𝑡=1
)2
𝑁
𝑡=1
In addition, by analogy with the study of the entire sample, we apply the event analysis
separately to each year of the period under review to assess whether there is a relationship
between the year of dividend announcements and the reaction of the company's stock prices to
them.
The share price should decrease for the entire size of dividends on the day of the
announcement in perfectly efficient market. Thus, abnormal revenues can be obtained only when
selling immediately after an event affecting the stock, for example, declaring dividends, because
waiting for longer period will eventually lead to the decrease of share prices.
Therefore, if abnormal revenues can be obtained from the sale of shares one day after the
announcement of dividends, this will mean that the market efficiency is in a strong form and

38
stock prices fell shortly after 1 day after the announcement of dividends. However, the market
may be less effective.
Since the effective market hypothesis is a simplistic theoretical approach based on
fundamental assumptions that may be violated - as shown in previous studies (Borges, 2009,
Mallikarjunappa & Manjunatha, 2009, Vazakidis & Athianos, 2010), it is important to assume
that it is possible to obtain abnormal returns, and the width of the window of events used in the
study helps to present these expectations of possible market inefficiencies. Therefore, the more
inefficient the market, the wider the event window that should be used.
Most importantly, in the framework of such testing investment significance, researchers
are faced with a multitude of methodological problems that have not been uniquely solved by the
scientific community yet. Conclusions regarding the effectiveness of the use of trade strategies
which use the recommendations of analysts vary considerably depending on many factors. These
include the market in which the analysis is carried out, which time interval is considered,
whether the influence of transaction costs is taken into account, how correctly the question of the
correlation of data is presented, and so on. It is also difficult to draw definitive conclusions,
because the change in the market situation leads to a change in the effectiveness of the trading
strategy.
The use of event analysis gives reliable results on short-term time intervals in the absence
of both serious clustering of data and the release of significant related news. Therefore, most
researchers are inclined to believe that the revision of the analytical recommendations is of
informational importance for investors (Jegadeesh, Kim, 2006; Brav, Lehavy, 2003). However,
questions regarding the impact of the revisions on the stock market and the impact of countries
on new differences remain open, since the vast majority of studies were conducted on the basis
of data on the US stock market.
In order to be able to consider the significance of the results separately for ups and
downs, the entire sample was split into two parts for each of the exchanges in question. As a
"quotation" the closing price for the issuer's securities was used for each specific day (trading
session). In rare cases, data on quotes were absent - in such cases, the average of the closing
price for the previous and for the subsequent trading session was taken to supplement the data.
2.5. Sample description
Data on the closing price of securities were collected for the period from January 2012 till
January 2018 from Thomson Reuters data base. The study examined the shares and dividend
payments of all companies listed in the Moscow Stock Exchange. However, only 56 companies

39
were included in the final sample. The reasons for the exclusion from the sample were the
following:
- The company did not pay dividends
- The dividend payments were too small to be considered as significant
- The company did not change the amount of dividend payments throughout
the period under review
Totally, according to the data on 56 companies, 329 dividend announcements were
included in the final sample.
After completing the sample creation, it is necessary to divide the above news events on
dividend payments presented in the sample into two categories: "good news" and "bad news" -
announcements that deliver either positive or negative signals to the market. The good news is
those when the dividend payments were increased by the company, while the news when the
company decreases the dividend payments are considered as bad news.
The rationale for the division is that positive and negative signals result in contrary price
stock behavior. Hence, this multidirectionality should be eliminated by dividing sample into two
subsets with “good” and “bad” announcements.
Among the 329 information messages included in the final sample, 192 positive
announcements (58%) and 137 negative announcements (42%) were identified.
In the case when the news release on the positive change in dividend payments affects the
market, it can be expected that the value of the average abnormal return on the day of increase
will be positive and statistically significantly different from zero. In the case of the public
announcement with decreased dividend payments, the value of the average abnormal return
should be negative and statistically different from zero.
2.6. Research results
Hypothesis 2a which conveys that positive announcements of dividend payments (“good”
news) have a positive impact on the stock price dynamics of Russian companies is approved. As
shown in the graph below, the average abnormal return as well as cumulative average abnormal
return is different from zero. The null hypotheses are rejected at the significance level of 95%.
𝐻0: 𝐴𝐴𝑅𝑡 = 0.
𝐻0: 𝐶𝐴𝐴𝑅𝑡 = 0.

40
Graph 2. AAR and CAA for “good” announcements during the period of 2012-2017
It can be also concluded that the market reacts to the dividend announcements even
before the day of news publication. The average abnormal return equals to 0,4% one day before
the release of new dividend payments have been made.
Thus, Hypothesis 1 which states that Russian financial market has a semi-strong form of
efficiency is confirmed. The share price should decrease for the entire dividend size on the day
of announcement in a perfectly efficient market. Hence, abnormal returns can be obtained only
when selling immediately after an event affecting the stock. However, we can conclude from the
graph 2 that there was an opportunity to profit from buying the shares even one day before the
announcement.
There could be several reasons for this:
- Insight trading
- Positive expectations of investors before the day of the meeting of the
board of directors are formed due to the analytics.
On the date of announcement AAR and CAAR are the highest in the assessed event
window, being 1,7% and 1,9% respectively. The next day after announcement the abnormal
returns are decreasing. In the table presented below, which shows the data for the positive
dividend announcements, the cumulative average abnormal returns equal to 1,9%.
-2,5%
-2,0%
-1,5%
-1,0%
-0,5%
0,0%
0,5%
1,0%
1,5%
2,0%
2,5%
-5 -4 -3 -2 -1 0 1 2 3 4 5
AAR CAAR

41
However, there are also cases when the stock prices demonstrate negative abnormal
returns despite the increase in the amount of dividend payments. This price behavior can be
explained by the fact that the increase in dividend payments actually can be considered as a bad
signal for the market. Market players could negatively react to the rise in the dividend’s size if
they find it more appealing for the company to invest free cash flows into projects rather than to
pay out money in a form of dividends. Thus, the companies that do have big investment
opportunities are better off if they have small dividend payments.
The hypothesis 2b stating that negative announcements of dividend payments (“bad”
news) have a negative impact on the stock price dynamics of Russian companies cannot be
confirmed.
Table 3. AAR and CAAR for positive dividend announcements
Day AAR CAAR t-stat (AAR) t-stat (CAAR)
-5 -0,1% -0,1% 0,4076 0,6850
-4 -0,1% -0,2% 0,5034 0,8632
-3 0,0% -0,3% -0,1095 -0,3724
-2 0,1% -0,2% 0,4732 0,8743
-1 0,4% 0,2% 0,5831 0,3629
0 1,7% 1,9% 1,8253 1,7835
1 -0,1% 1,9% 1,2933 1,4876
2 0,3% 2,2% -0,9065 1,8043
3 -0,3% 1,9% 0,1053 1,0482
4 0,3% 2,0% -0,3244 0,3814
5 -0,1% 2,0% -1,8062 -0,9742
As shown on the table 4 below, which shows the data for the negative dividend
announcements, the average abnormal returns take positive values (for instance, AAR=0,3% and
CAAR=0,5% at t = 0). In the period after the announcement, the average abnormal returns have
a certain positive trend while the cumulative abnormal returns in average are positive as well.
Some of the stock prices do not reveal reductions in quotations, and even demonstrate high
positive abnormal returns. One of the reasons of this price behavior is the fact that the decrease

42
in dividend payments actually can be considered as a good signal for the market. As it was
mentioned earlier and in previous studies, market players could positively react to such a
decrease in dividends if they find it more appealing for the company to invest free cash flows
into projects rather than to pay out money in a form of dividends.
However, as can be seen from the low values of t-statistics, during the entire event
window all of the t-tests rejected the hypothesis of the significance of the average abnormal
returns and cumulative average abnormal returns.
Table 4. AAR and CAAR for negative dividend announcements
Day AAR CAAR t-stat (AAR) t-stat (CAAR)
-5 0,1% 0,1% 0,9732 0,9098
-4 0,1% 0,2% 0,0032 0,2245
-3 -0,1% 0,0% -0,9375 -0,7982
-2 0,2% 0,2% -0,4738 0,0232
-1 -0,1% 0,2% 0,0443 0,3629
0 0,3% 0,5% -0,3473 0,3927
1 0,3% 0,8% 0,2438 0,2394
2 -0,3% 0,6% -0,0489 -0,1393
3 0,0% 0,6% 0,0220 0,2483
4 0,2% 0,7% -0,9834 0,4389
5 0,1% 0,8% -1,8062 -0,9742
The graphical data representation of the “bad” news release regarding dividend payments
is shown below. However, it can be concluded that these results are statistically insignificant
neglecting the positive news’ impact on stock prices.

43
Graph 3. AAR and CAAR for “bad” announcements during the period of 2012-2017
To receive more consistent and statistically significant results, the data sample with bad
announcements was divided into different subsets that might explain the true nature of price
behavior to the announcements of decreased dividend payments.
In addition to analyzing the full sample of 137 negative announcements, we also split the
sample into two subsets for each specific time periods: the time period of 2012-2013 years when
the economy had higher GDP and the time period of 2014-2016 when the economy experienced
the downturn being in deep financial crisis due to the political situation with Crimea.
Graph 4. AAR and CAAR for “bad” announcements during the period of 2012-2013
-0,4%
-0,2%
0,0%
0,2%
0,4%
0,6%
0,8%
1,0%
-5 -4 -3 -2 -1 0 1 2 3 4 5
AAR and CAAR for "bad" announcements
during the period of 2012-2017
AAR CAAR
-1,0%
-0,8%
-0,6%
-0,4%
-0,2%
0,0%
0,2%
0,4%
0,6%
-5 -4 -3 -2 -1 0 1 2 3 4 5
AAR and CAAR for "bad" announcements
during the period of 2012-2013
CAAR AAR

44
From the graph above, we can conclude that in a more economically flavored situation
(2012-2013 years) the financial market reacted negatively to the publication of decreased
dividend payments one day before the announcement, on the day of announcement and during
after-announcement period.
However, totally opposite results were received for the period of 2014-2016 years when
the economy was in a recession. Investors positively react to the publication of decreased
dividend payments on the day of announcement and during after-announcement period. It could
be explained by the fact that in the times of scare financial resources shareholders and investors
prefer companies to reinvest money into business rather than increasing dividend payments.
Thereby, Hypothesis 3 which states that the state of economy influences the relationship
between announcements of dividend payments and price behavior of Russian companies is
confirmed.
Hence, we can conclude that shareholders should take into account the fact that dividend
decrease does not necessarily result in the reduction of the company’s stock price and thus
market capitalization but even could lead in the increase of its share price.
Graph 5. AAR and CAAR for “bad” announcements during the period of 2014-2016
The same iterations have been made for the sample of “good” announcements. In
addition to analyzing the full sample of 192 positive announcements, the sample was split into
two subsets for each specific time periods: the time period of 2012-2013 years when the
-0,4%
-0,2%
0,0%
0,2%
0,4%
0,6%
0,8%
1,0%
1,2%
-5 -4 -3 -2 -1 0 1 2 3 4 5
CAAR AAR

45
economy had higher GDP and the time period of 2014-2016 when the economy experienced the
downturn.
From the graphs 6 and 7, we can conclude that there are no significant differences in the
relationship between publication good news and stock price dynamics in two time periods when
the economy was in a boom and in recession. Both in a more economically flavored situation
(2012-2013 years) and less economically beneficial situation the financial market reacted
positively to the publication of increased dividend payments.
Graph 6. AAR and CAAR for “good” announcements during the period of 2012-2013
However, the effect is stronger in the case of worse macroeconomic situation (1-2% of
CAAR in 2012-2013 relative to 3-4% of CAAR in 2014-2016). Hence, we can conclude that
shareholders should take into account the fact that rise in dividend size in general result in the
higher company’s stock prices and thus market capitalization.
-2,5%
-2,0%
-1,5%
-1,0%
-0,5%
0,0%
0,5%
1,0%
1,5%
2,0%
-5 -4 -3 -2 -1 0 1 2 3 4 5
CAAR AAR

46
Graph 7. AAR and CAAR for “good” announcements during the period of 2014-2016
Additionally, the analysis revealed that companies with lesser investment opportunities
do not necessarily have their prices dropped when they decrease the dividends paid. However, in
some financial markets, those type of companies could experience the fall in their stock prices as
shareholders and investors believe that exempted cash flows should rather be invested in
dividend payments.
The same logic could be applied for the companies with bigger investment opportunities.
In this case, some shareholders and investors prefer cash flows reinvested back into the
company, as they could gain more earnings from the returns of the projects. However, Russian
financial market does not necessarily negatively react to the decrease of the dividend size.
According to the event study analysis, the same company could experience positive stock
price dynamics and negative stock price dynamics to the rise in dividend size irrespective to the
fact whether it has more or less investment opportunities at the moment.
2.7. Theoretical contribution
As it has been mentioned earlier, the topic on relationship between dividend payments
and stocks on Russian financial market remains topical and under-investigated. The existing
research were conducted for the US market, for developed European countries and some of the
developing countries as well. However, there are only few studies investigating the relationship
between dividend payments and dynamics of share prices in Russia and, hence, in this study the
research gap for Russian market has been filled.
-2,5%
-1,5%
-0,5%
0,5%
1,5%
2,5%
3,5%
4,5%
5,5%
-5 -4 -3 -2 -1 0 1 2 3 4 5
CAAR AAR

47
The analysis has been conducted for the whole Russian market during the period of 2012-
2017. This study partially confirms and partially contradicts with the study made by Teplova
(2008). It was confirmed that the relationship between dividend payments and stock returns is
ambiguous. Depending on the type of the dividend announcements, the results of event study
differs. If there is an increase of the dividend size, the relationship is positive between dividends
payments and stock prices. However, in the study (Teplova, 2008) the relationship was both
positive and negative depending on the investment potential of the firms. This result contradicts
with the findings of this research. It was concluded that the investment potential of the firm does
not affect this relationship. There are several reasons that could explain this difference. Firstly,
Teplova (2008) investigated only Oil & Gas companies, while this study is conducted for the
whole Russian market. Secondly, the analysis (Teplova,2008) was conducted 10 years ago, since
then the efficiency of the Russian financial market has been improved as well as its stage of
development.
Another research was conducted for the whole Russian market but it investigated only the
relationship between dividend surprises and stock market (Berezinetz et al., 2016). However, this
research is not specified only for the dividend surprises – those information events regarding
dividends that do not reflect the expectations formed by analysts’ recommendations, but also
includes all the announcements of changes in dividends’ size.
2.8. Practical implication
One of the main practical implications is the fact that management and shareholders when
forming the size of dividend payments should take into account the economic situation of the
country. According to the research results, investors positively react to the publication of
decreased dividend payments when the economy is in a recession and positively react to these
publications when the economy is in a boom. This finding is useful for companies’ managers,
who, knowing that dividend announcement affect stock prices, can determine different periods
for dividend announcement, increase or decrease the size of dividends, hence, sending the
desired information into the market which, consequently, increases company’s market value.
The second implication is that increases in dividends bring the positive signal to the
market meaning that the stock prices will increase with the rise of dividend payments. Being
acknowledged of this information, company’s management could, firstly, increase the stock
price market capitalization of the firm and, secondly, reduce the agency conflicts between them
and shareholders.

48
Another practical implication could be valuable for the investors and traders. It was
defined that the Russian market efficiency is in a semi-strong form. The implication of semi-
strong form efficiency for the individual investor is that it is highly unlikely that one can spot a
share being sold at a bargain price. This is because the markets will already have gained
knowledge of, analyzed information and, the impact thereof will have quickly been reflected in
the current price of that share. However, an investor may take steps to help ensure that his or her
investment reacts in a timely fashion to public announcements. Such an investor may employ the
services of institutional investors to act on his or her behalf.
The results of this study could be applied in practice when constructing stocks portfolio,
because the results could help to evaluate possible abnormal changes in stock prices due to the
dividend announcement
2.9. Study limitations and further research
The scope of the study, however, is limited as it focuses only on firms listed in Moscow
Exchange Stock for the time period of 2012–2017. Thereby, the further research could expand
the given time period and conduct an analysis for several stock exchanges (LSE, NYSE and
others) where the Russian company’s stocks are listed. The findings of this comparative analysis
could provide more insights into setting the dividend policy which is more beneficial for Russian
firms as it would show how different financial markets react to announcements in dividend
payments.
Another limitation of the study is inadequate number of observations (dividend
announcements) to provide findings for each particular industry, rather than make them for
Russian market in general. Due to the fact that data was collected for 329 dividend
announcements, the division into samples for each industry would not be justified because of the
small number of observations for some industries. Thereby, the avenue for further research is to
increase the sample so that there are enough observations presented for each industry which
could lead to additional insights.
Another recommendation to go further in studying the dividend signal theory and the
subsequent reaction of prices for growth and dividends, is to investigate these events on both the
bull market and the bear market as was done by Below and Johnson (1996).

49
CONCLUSION
In this study the relationship between dividend announcements and stock price dynamics
was analyzed for the companies listed on the MOEX market during the 2012–2017 period. This
study reveals how efficient the Russian market is regarding dividend announcements, and to
what extent market players could earn abnormal returns on the stocks they possess.
The analysis of dividend policy theories, explaining the interaction of the market value of
companies and changes in dividends, have been conducted. The market efficiency hypothesis
was also considered in the framework of declaring dividends. Additionally, the event study
analysis has been performed which explained the effect of dividend payments on company’s
stock prices. The event study method is the most common method as it has proved its
effectiveness comparing to other financial methods because only this method uses forward-
looking approach and direct measure of created added value for investors. Finally, the results of
the research have been described and the indicators were tested for statistical significance.
One of the research questions have been formulated in the following way: How efficient
is the Russian financial market? Summarizing the analysis of financial market efficiency, it is
worth noting that the detection of abnormal revenues signals the market's inefficiency, while
their absence confirms the hypothesis of the fully efficient market. Thus, the research results
confirmed that Russian financial market has a semi-strong form of efficiency meaning that
investors could potentially profit from the news announcements as the stock price reflects only
historical prices and returns and publicly available information.
These results slightly differ from those presented by Bozos, Nikolopoulos and
Ramgandhi (2011), who examined the signaling theory of dividends on the London Stock
Exchange, focusing only on the final dividends (paid in the end of the financial year), excluding
intermediate dividends in the sample and confirming the signaling theory of dividends with the
level confidence interval of 99%. In their study, most of the market reaction took place on days 2
and 3 after the announcement of dividends and excess income came to naught by the end of 5
days after the announcement of dividends. This difference in results can be explained by the fact
that the final dividends may have a greater impact on the decision-making process of investors
than intermediaries. Moreover, a study by Bozos et al. (2011) was focused on the UK financial
market, which is more advanced compared to Russian in the terms of the development stage of
financial markets.

50
However, the results of this study are partially consistent with the results conducted for
Russian market (Teplova, 2008; Berezinetz et al., 2016). Announcements of the increase in the
size of dividends indeed result in the rise of stock prices of Russian companies.
However, the hypothesis stating that negative announcements cause the decrease in share
price fluctuations has not been confirmed due to the low t-test statistics values. Hence, to check
this hypothesis the sample was divided into two subsets for two time periods:
− time period of 2012-2013 when the economy has not been in a downturn yet, and
− time period of 2014-2016 when the economy experienced deep recession
It was concluded that the financial market reacted negatively to the publication of
decreased dividend payments in a more economically flavored situation (2012-2013 years) while
it yielded positive abnormal returns when it was in crisis. It could be explained by the fact that in
the times of scare financial resources shareholders and investors prefer companies to reinvest
money into business rather than increasing dividend payments.
To sum up, shareholders and the management of the company should take into account
the fact that dividend decrease does not necessarily result in the reduction of the company’s
stock price and, thus, market capitalization, but even could lead to the increase of its share price
respective to the macroeconomic context. However, the increase of the dividend payments yields
an increase in company’s stock price due to the dividend signaling theory which is consistent
with the results made by Teplova (2008). Furthermore, the results of this study could be applied
in practice when constructing stocks portfolio, as they could help to evaluate possible abnormal
changes in stock prices due to dividend announcement from which financial agents (traders and
investors) could benefit making profit on trading strategies.

51
Reference list
1. Abbas, G. (2015). Stock Prices Reaction to Dividend Announcements: A Study on Listed
Companies in the Damascus Securities Exchange. International Journal of Academic
Research in Accounting, Finance and Management Sciences, 5 (1), 130–136
2. Aggarwal, N., Mohit, G. (2018). Signaling Effect of Shifts in Dividend Policy: Evidence
from Indian Capital Markets // Business Perspectives & Research, 6 (2),142
3. Agrawal, A., J. Jaffe, G. Mandelker. (1992). The postmerger performance of acquiring
firms: reexamination of an anomaly // Journal of finance, 47, 89-114
4. Aharony, J., Swary, I. (1980). Quarterly dividend and earnings announcements and
stockholders’ returns: an empirical analysis // Journal of Finance, 35, 112
5. Ahmed, M., Zuguang, H. (2010). Dividend Announcement Effect on Stock Return: An
Event Study on Shanghai Stock Exchange // Intelligent Systems (GCIS), 2010 Second
WRI Global Congress on Intelligent Systems, 320
6. Aivazian, V. (2003). Do emerging markets follow different dividend policies from US
firms // Journal of Financial Research, 26 (3), 371-387
7. Amihud, Y., Murgia, M. (1997). Dividends, Taxes, and Signaling: Evidence from
Germany // Journal of Finance, 52(1), 397-408
8. Andres, Ch., Betzer, А., Van den Bongard, I., Haesner Ch., Theissen E. (2013). The
information content of dividend surprises: Evidence from Germany. Journal of Business
Finance & Accounting 40 (5–6), 620–645
9. Ansary, O., Hussien, M. (2017). The Impact of Stock Dividends and Stock Splits on
Shares’ Prices: Evidence from Egypt // Accounting and Finance Research, 6, 96-114
10. Babu, S., Nagendra M. (2017). Corporate Actions and Impact on Stock Abnormal
Returns: A Study on Indian Context // International Journal of Management and Social
Sciences Research, 6 (11), 30
11. Ball, R., Brown Ph. (1968). An Empirical Evaluation of Accounting Income Numbers //
Journal of Accounting Research, 6 (2), 159-178
12. Berezinets I., Bulatova L., Ilina Y., Smirnov M. (2016). The reaction of the Russian stock
market to dividend surprises: and empirical study // Russian Management Journal, 14 (2),
29-48
13. Bernhardt, D., Douglas, Robertson, F. (2005). Testing dividend signaling model //
Journal of Empirical Finance, 12(1), 77-98
14. Bhattacharya, S. (1977). An Exploration of Nondissipative Dividend-Signaling
Structures. Working paper, Graduate School of Business, University of Chicago

52
15. Bhattacharya, S. (1979). Imperfect information, dividend policy, and ‘The bird in the
hand policy’ fallacy // The Bell Journal of Economics, 259-270
16. Bondt, W. F., Thaler, R. (1985). Does the stock market overreact? // The Journal of
finance, 40 (3), 793-805
17. Borges, M. (2009). The Ex-Dividend Day Stock Price Behavior: The Case of Portugal.
Atlantic Economy Journal, 36, 15–30
18. Bozos K., Nikolopoulos K., Ramgandhi G. (2011). Dividend signaling under economic
adversity: Evidence from the London Stock Exchange //International Review of Financial
Analysis, 20 (5), 364-374
19. Brown, S. J., Warner, J. B. (1985). Using daily stock returns: The case of event studies
//Journal of financial economics, 14 (1), 331
20. Dharmarathne, D. (2013). Stock price reaction to dividend announcements and
information efficiency Sri Lankan share market // International Journal, 3 (2)
21. Fama E. (1965). The Behavior of Stock Market Prices // Journal of Business, 38, 34–105
22. Fama, E., French, K. (2004). The Capital Pricing Model: Theory and Evidence // Journal
of Economic Perspectives, 18 (3), 25-46
23. Fama, E. et al. (1969). The Adjustments of Stock Prices to New Infor-mation //
International Economic Review, 10 (1), 1-21
24. Farrukh, K., Irshad S., Khakwani, M., Ishaque, S., Ansari N. (2017). Impact of dividend
policy on shareholders wealth and firm performance in Pakistan // Cogent Business &
Management, 4 (1), 1-11
25. Fuller, K. (2001). The impact of informed trading on dividend signaling: a theoretical and
empirical examination // Journal of Corporate Finance, 9, 385-407
26. Gordon, M. J. (1963). Optimal Investment and Financing Policy // Journal of Finance, 18
(2), 264-272
27. Grullon, G., Roni, M., Bhaskaran, S. (2002). Are Dividend Changes a Sign of Firm
Maturity? // Journal of Business, 75 (3)
28. Healy, P., Palepu, K. (1988). Earnings information conveyed by dividend initiations and
omission // Journal of Financial Economics, 21, 149-176
29. Irum, M., Rafique, M., Hassan, A. (2012). Effect of dividend announcement on share
prices of petroleum industry of Pakistan. Journal of Basic and Applied Scientific
Research, 2 (7), 6503−6511
30. Jegadeesh, N., Kim, W. (2006). Value of analyst recommendations: International
evidence, Journal of Financial Markets, 3(9), 274-309

53
31. Jensen, M. (1986). Agency Cost of Free Cash Flow, Corporate Finance, and Takeovers //
American Economic Review, 76 (2), 323-329
32. Jiang, G., Kim, W. (2010). Evaluating Analysts' Value: Evidence from
Recommendations Around Stock Price Jumps
33. Khanal, A., Mishra, A. (2017). Stock price reactions to stock dividend announcements: A
case from a sluggish economic period // The North American Journal of Economics and
Finance, 42, 338-345
34. Korczak, P., Bohl, M.T. (2005). The Empirical Evidence on Crosslisted Stocks of the
Central and Eastern European Companies // Emerging Markets Review, 5, 121-137
35. Kvamvold, K., Lindset, S. (2018). Do dividend flows affect stock returns? // The Journal
of Financial Research, 149–176
36. Lang, L., Litzenberger, R. (1989). Dividend announcements: cash flow signaling vs. free
cash flow hypothesis // Journal of Financial Economics, 24, 181-192.
37. Legenzova, R., Jurakovaitė, O., Galinskaitė, A. (2017). The Analysis of Dividend
Announcement Impact on Stock Prices of Baltic Companies // Central European Business
Review, 6 (1), 61-76
38. Lintner, J. (1965). The valuation of risk assets and the selection of risky investments in
stock portfolios and capital budgets, Review of Economics and Statistics, 47 (1), 13–37
39. Litzenberger, R. Ramaswamy, K. (1979). Effect of Personal Taxes and Dividends on
Capital Asset Prices: Theory and Empirical Evidence // Journal of Financial Economics,
7 (2), 163-195
40. Lotfi, T. (2018). Dividend Policy in Tunisia: A Signalling Approach // International
Journal of Economics and Finance, 10 (4), 84
41. MacKinlay, A. (1997). Event Studies in Economics and Finance // Journal of Economic
Literature, 35 (1), 13-39
42. Maio, P., Santa-Clara, P. (2015). Dividend Yields, Dividend Growth, and Return
Predictability in the Cross Section of Stocks // Journal of Financial & Quantitative
Analysis, 50, 33-60
43. Mallikarjunappa, T., & Manjunatha, T. (2009). Stock Price Reactions to Dividend
Announcements. Journal of Management & Public Policy, 1(1), 43-56
44. Markowitz, H. (1952). Portfolio Selection. The Journal of Finance, 7 (1), 77–91
45. Michaely, R., Thaler, R., Womack, K. (1995). Price reactions to dividend initiations and
omissions: overreaction or drift? // Journal of Finance, 50 (2), 573-608
46. Miller, M., Modigliani, F. (1961). Dividend Policy, Growth and the Valuation of
Shares // Journal of Business, 34 (4), 411-433

54
47. Park, C., Pincus, M. (2000). Market reactions to changes in analyst consensus
recommendations following quarterly earnings announcements // Papier de recherche,
Hong Kong University of Science and Technology, University of Iowa
48. Petrosyan, N. (2007). Efficiency of the market of corporate bonds // Journal of Financial
Management
49. Profilet, K., Bacon, F. (2013). Dividend Policy and Stock Price Volatility in the US
Equity Capital Market // ASBBS Proceedings, 20 (1)
50. Rosen, R. (2002). Merger momentum and investor sentiment: the stock market reaction
on merger announcements // The Kelly School, Indiana University, SSRN working paper,
43
51. Sharpe, W. (1964). Capital asset prices: A theory of market equilibrium under conditions
of risk, Journal of Finance, 19 (3), 425–442
52. Shiller R. (2005). Irrational exuberance. - Princeton university press
53. Slovic P., Fischhoff B., Lichtenstein S. (1977). Behavioral decision theory // Annual
review of psychology, 28 (1), 1-39
54. Suwanna, T. (2012). Impacts of the dividend announcement on stock return // Procedia-
Social and Behavioral Sciences, 40, 721-725
55. Teplova, T. (2008). Impact of cash dividend payments on Russian companies’ market
capitalization: Event study testing on Russians and world’s stock exchange. Audit I
Finansovyj Analiz, 2, 1–15
56. Treynor, Jack L. (1962). Toward a Theory of Market Value of Risky Assets. Unpublished
manuscript. A final version was published in 1999, in Asset Pricing and Portfolio
Performance: Models, Strategy and Performance Metrics. London: Risk Books, 15–22
57. Vazakidis, A. & Athianos, S. (2010). Do Dividend Announcements Affect The Stock
Prices in The Greek Stock Market? International Journal of Economic Sciences and
Applied Research, 3(2), 57-77
58. Volodin, S. (2012). Analysis of the Applicability of the Efficient Market Hypothesis for
the Modeling of Price Dynamics // In: The Stock Market: Current State, Instruments and
Trends of Development, M.: Business Elaine, 56-66
59. Walter, J.-E. (1963). Dividend Policy: Its Influence on the Value of Enterprise, Journal of
Finance, 18, 280 – 291
60. Woolridge, J., Ghosh, C. (1985). Dividend cuts: do they always signal bad news? //
Corporate Finance Journal, 3, 20-32

55
Appendix 1. Stock returns
COMPANY TYPE OF EVENT
R ER AR (0) CAR (0)
SBERBANK OF RUSSIA GOOD -2,3% 0,1% -2,4% -6,0%
SBERBANK OF RUSSIA GOOD -0,2% -0,2% 0,0% -1,0%
SBERBANK OF RUSSIA BAD -5,4% 0,0% -5,4% 0,9%
SBERBANK OF RUSSIA GOOD 0,5% 0,2% 0,3% 7,5%
SBERBANK OF RUSSIA GOOD 3,0% 0,0% 3,0% 4,8%
GAZPROM GOOD 0,0% 0,1% -0,1% 3,5%
GAZPROM BAD -0,1% 0,0% 0,0% -3,8%
GAZPROM GOOD 0,9% -0,1% 1,0% 5,8%
GAZPROM GOOD -1,8% 0,0% -1,8% 4,0%
GAZPROM GOOD -0,4% 0,0% -0,4% -4,5%
ROSNEFT BAD 4,4% 0,0% 4,4% 6,7%
ROSNEFT BAD 1,4% 0,2% 1,2% -3,7%
ROSNEFT GOOD 1,7% -0,1% 1,7% -2,8%
ROSNEFT BAD -1,3% 0,1% -1,4% -2,7%
ROSNEFT GOOD 1,5% 0,2% 1,3% 4,3%
OIL COMPANY LUKOIL GOOD 0,2% 0,0% 0,1% 3,6%
OIL COMPANY LUKOIL GOOD 1,4% 0,1% 1,3% 0,6%
OIL COMPANY LUKOIL GOOD 1,6% 0,0% 1,6% -0,1%
OIL COMPANY LUKOIL GOOD -0,2% 0,0% -0,1% -2,4%
OIL COMPANY LUKOIL GOOD -1,3% -0,1% -1,2% 0,1%
OIL COMPANY LUKOIL BAD 1,2% 0,0% 1,2% -2,5%
OIL COMPANY LUKOIL GOOD -0,6% 0,2% -0,8% -2,1%
OIL COMPANY LUKOIL GOOD 2,3% -0,1% 2,4% 2,2%
OIL COMPANY LUKOIL GOOD -1,3% 0,2% -1,5% 0,2%
OIL COMPANY LUKOIL GOOD 0,4% -0,1% 0,5% 5,2%
NOVATEK GOOD -2,8% 0,1% -2,9% -4,7%
NOVATEK BAD 0,4% -0,1% 0,5% -0,1%
NOVATEK GOOD -0,9% -0,1% -0,7% -0,9%
NOVATEK BAD 0,9% 0,1% 0,8% -2,4%
NOVATEK GOOD 8,6% 0,1% 8,6% -8,8%
NOVATEK GOOD -0,2% 0,1% -0,2% -6,1%
NOVATEK GOOD -2,1% 0,2% -2,3% -9,5%
NOVATEK GOOD 0,6% 0,1% 0,4% -4,8%
NOVATEK GOOD 0,5% 0,0% 0,5% -2,6%
NOVATEK BAD -1,8% 0,1% -1,9% 2,0%
NOVATEK GOOD -0,6% 0,1% -0,7% -5,8%
NOVATEK BAD 0,3% -0,2% 0,5% 2,5%
MMC NORILSK NICKEL GOOD 1,7% 0,0% 1,7% 0,9%
MMC NORILSK NICKEL GOOD 1,8% 0,1% 1,7% -4,2%
MMC NORILSK NICKEL BAD 2,2% 0,0% 2,2% 4,9%
MMC NORILSK NICKEL GOOD 1,1% 0,2% 0,9% -0,5%
MMC NORILSK NICKEL GOOD 4,4% 0,1% 4,3% 2,8%
MMC NORILSK NICKEL BAD 2,0% 0,3% 1,7% -3,5%
MMC NORILSK NICKEL BAD 3,9% -0,2% 4,1% 10,1%
MMC NORILSK NICKEL GOOD -0,3% -0,1% -0,2% -0,8%

56
COMPANY TYPE OF EVENT
R ER AR (0) CAR (0)
MMC NORILSK NICKEL GOOD 1,0% 0,0% 1,0% 10,1%
MMC NORILSK NICKEL GOOD 0,0% -0,1% 0,0% 1,8%
MMC NORILSK NICKEL BAD -0,8% 0,0% -0,7% 4,5%
GAZPROM NEFT GOOD 2,6% 0,2% 2,4% -0,2%
GAZPROM NEFT GOOD 0,8% -0,2% 1,0% -0,2%
GAZPROM NEFT BAD 2,8% -0,1% 2,9% 2,2%
GAZPROM NEFT GOOD -0,8% -0,1% -0,8% 7,8%
GAZPROM NEFT BAD 2,5% -0,1% 2,6% 4,7%
GAZPROM NEFT BAD -0,4% 0,0% -0,5% 1,4%
GAZPROM NEFT GOOD -0,1% -0,2% 0,2% 6,3%
GAZPROM NEFT BAD -1,0% 0,0% -1,0% -0,3%
GAZPROM NEFT GOOD -0,2% 0,1% -0,3% -0,3%
GAZPROM NEFT BAD 1,3% 0,2% 1,1% 4,2%
TATNEFT GOOD 1,3% 0,3% 1,0% -1,4%
TATNEFT GOOD -1,7% -0,1% -1,7% 9,8%
TATNEFT BAD 0,8% 0,0% 0,8% -2,1%
TATNEFT GOOD 3,2% 0,1% 3,1% 3,7%
TATNEFT GOOD 0,1% 0,0% 0,0% 2,2%
TATNEFT GOOD 6,1% -0,1% 6,2% 10,3%
TATNEFT GOOD 11,7% 0,1% 11,7% 14,2%
NOVOLIPETSK STEEL BAD -2,2% -0,2% -2,0% -0,2%
NOVOLIPETSK STEEL GOOD 2,8% -0,2% 3,0% 3,9%
NOVOLIPETSK STEEL GOOD 2,0% -0,2% 2,3% 0,3%
NOVOLIPETSK STEEL GOOD 4,7% -0,1% 4,8% 9,4%
NOVOLIPETSK STEEL BAD 2,8% -0,1% 2,9% 7,8%
NOVOLIPETSK STEEL GOOD -2,0% 0,0% -2,0% -2,5%
NOVOLIPETSK STEEL GOOD 1,5% 0,2% 1,3% 11,0%
NOVOLIPETSK STEEL GOOD 0,1% 0,2% 0,0% 1,4%
SEVERSTAL GOOD -0,7% 0,1% -0,8% -3,4%
SEVERSTAL GOOD -1,5% -0,5% -1,0% 7,8%
SEVERSTAL GOOD -0,8% 0,1% -0,8% -2,3%
SEVERSTAL BAD -1,7% -0,1% -1,7% -5,7%
SEVERSTAL GOOD 4,5% 0,3% 4,1% 0,8%
SEVERSTAL GOOD -0,5% 0,1% -0,6% 6,2%
MOBILE TELESYSTEMS GOOD -0,2% 0,2% -0,4% -1,0%
MOBILE TELESYSTEMS BAD -0,5% 0,1% -0,6% 3,3%
MOBILE TELESYSTEMS BAD 0,4% 0,1% 0,3% 0,8%
MOBILE TELESYSTEMS GOOD -2,2% -0,2% -2,0% -6,9%
MOBILE TELESYSTEMS BAD 1,0% -0,1% 1,0% 2,7%
MOBILE TELESYSTEMS GOOD 3,7% 0,1% 3,6% 2,5%
MOBILE TELESYSTEMS BAD 2,7% -0,1% 2,7% 4,5%
MOBILE TELESYSTEMS GOOD -0,6% 0,1% -0,7% 5,1%
MOBILE TELESYSTEMS BAD -0,4% 0,0% -0,5% 2,6%
MOBILE TELESYSTEMS GOOD -0,2% 0,2% -0,4% -2,6%
MOBILE TELESYSTEMS BAD -0,3% -0,1% -0,2% 3,3%
MAGNIT GOOD 1,0% 0,1% 0,9% 3,5%
MAGNIT GOOD 2,2% 0,1% 2,0% 6,1%

57
COMPANY TYPE OF EVENT
R ER AR (0) CAR (0)
MAGNIT BAD 1,2% 0,2% 1,0% 7,9%
MAGNIT GOOD 0,4% -0,1% 0,4% 7,6%
MAGNIT BAD 0,6% 0,1% 0,5% -8,9%
MAGNIT GOOD 1,5% 0,2% 1,2% 10,4%
MAGNIT BAD 1,0% 0,1% 0,9% 6,8%
MAGNIT BAD 2,0% 0,1% 1,9% -1,8%
MAGNIT GOOD 0,6% 0,0% 0,7% -4,4%
MAGNIT BAD -0,1% -0,1% 0,0% -1,7%
MAGNIT GOOD -0,3% 0,0% -0,3% 3,2%
MAGNIT GOOD 0,7% 0,1% 0,6% 0,3%
MAGNIT BAD -0,6% -0,1% -0,4% -3,0%
MAGNIT GOOD 0,5% 0,0% 0,5% 2,9%
POLYUS BAD -1,0% -0,1% -0,9% 1,8%
POLYUS GOOD 0,4% 0,0% 0,4% 0,5%
POLYUS BAD 0,2% -0,1% 0,3% 9,3%
BASHNEFT BAD -0,2% 0,0% -0,3% 2,4%
BASHNEFT GOOD 0,4% 0,0% 0,4% 0,4%
BASHNEFT GOOD 0,0% 0,0% 0,0% 5,6%
BASHNEFT BAD -1,7% 0,4% -2,1% -1,4%
BASHNEFT GOOD 0,0% 0,3% -0,4% -1,0%
BASHNEFT BAD 2,0% -0,2% 2,2% 2,0%
BASHNEFT GOOD 1,6% -0,3% 2,0% 2,6%
RUSHYDRO BAD -8,7% -0,2% -8,5% -15,7%
RUSHYDRO GOOD 1,9% -0,3% 2,2% 1,4%
RUSHYDRO GOOD -1,7% 0,0% -1,7% 3,4%
RUSHYDRO GOOD -1,6% -0,1% -1,6% -2,5%
RUSHYDRO GOOD 0,0% 0,1% -0,1% -2,3%
RUSHYDRO GOOD 2,4% 0,0% 2,5% -3,8%
TRANSNEFT GOOD -1,8% 0,5% -2,3% -1,4%
TRANSNEFT BAD -0,5% 0,0% -0,5% 4,1%
TRANSNEFT GOOD -6,1% 0,0% -6,1% -3,6%
TRANSNEFT GOOD -0,7% -0,1% -0,6% 5,0%
TRANSNEFT GOOD -3,4% 0,0% -3,4% -0,8%
TRANSNEFT GOOD -0,2% -0,2% -0,1% -5,7%
URALKALIY PAO GOOD 1,6% 0,1% 1,5% -3,7%
URALKALIY PAO BAD -0,2% -0,1% -0,2% 1,0%
URALKALIY PAO BAD -0,6% -0,2% -0,4% 4,0%
URALKALIY PAO BAD 0,0% 0,0% 0,0% -0,5%
URALKALIY PAO GOOD 1,0% -0,1% 1,1% 0,1%
URALKALIY PAO BAD 1,7% -0,1% 1,8% 0,5%
AKRON PAO BAD -2,4% 0,1% -2,5% -9,7%
AKRON PAO BAD -2,6% -0,1% -2,5% -2,8%
AKRON PAO GOOD 0,6% 0,1% 0,6% -1,4%
AKRON PAO GOOD 0,5% 0,0% 0,5% -1,1%
AKRON PAO GOOD 6,1% 0,1% 6,0% 2,7%
AKRON PAO BAD 6,1% 0,5% 5,6% -1,5%
AKRON PAO BAD 1,2% 0,4% 0,8% 2,2%
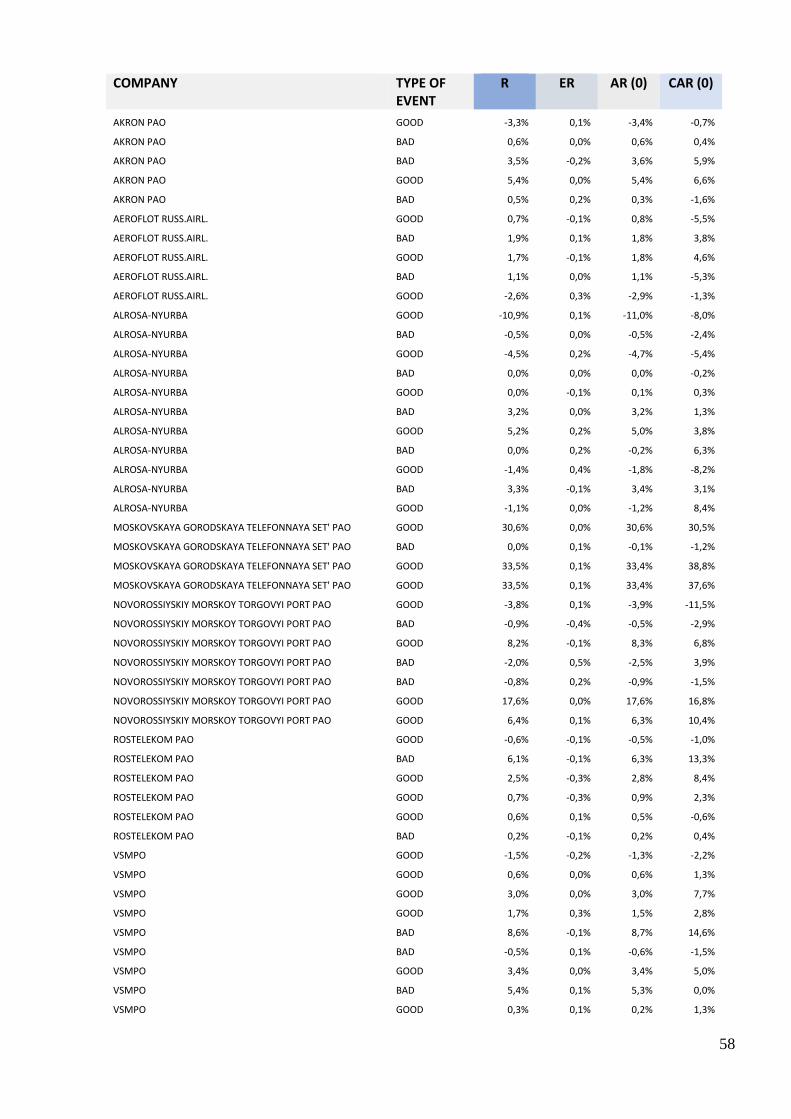
58
COMPANY TYPE OF EVENT
R ER AR (0) CAR (0)
AKRON PAO GOOD -3,3% 0,1% -3,4% -0,7%
AKRON PAO BAD 0,6% 0,0% 0,6% 0,4%
AKRON PAO BAD 3,5% -0,2% 3,6% 5,9%
AKRON PAO GOOD 5,4% 0,0% 5,4% 6,6%
AKRON PAO BAD 0,5% 0,2% 0,3% -1,6%
AEROFLOT RUSS.AIRL. GOOD 0,7% -0,1% 0,8% -5,5%
AEROFLOT RUSS.AIRL. BAD 1,9% 0,1% 1,8% 3,8%
AEROFLOT RUSS.AIRL. GOOD 1,7% -0,1% 1,8% 4,6%
AEROFLOT RUSS.AIRL. BAD 1,1% 0,0% 1,1% -5,3%
AEROFLOT RUSS.AIRL. GOOD -2,6% 0,3% -2,9% -1,3%
ALROSA-NYURBA GOOD -10,9% 0,1% -11,0% -8,0%
ALROSA-NYURBA BAD -0,5% 0,0% -0,5% -2,4%
ALROSA-NYURBA GOOD -4,5% 0,2% -4,7% -5,4%
ALROSA-NYURBA BAD 0,0% 0,0% 0,0% -0,2%
ALROSA-NYURBA GOOD 0,0% -0,1% 0,1% 0,3%
ALROSA-NYURBA BAD 3,2% 0,0% 3,2% 1,3%
ALROSA-NYURBA GOOD 5,2% 0,2% 5,0% 3,8%
ALROSA-NYURBA BAD 0,0% 0,2% -0,2% 6,3%
ALROSA-NYURBA GOOD -1,4% 0,4% -1,8% -8,2%
ALROSA-NYURBA BAD 3,3% -0,1% 3,4% 3,1%
ALROSA-NYURBA GOOD -1,1% 0,0% -1,2% 8,4%
MOSKOVSKAYA GORODSKAYA TELEFONNAYA SET' PAO GOOD 30,6% 0,0% 30,6% 30,5%
MOSKOVSKAYA GORODSKAYA TELEFONNAYA SET' PAO BAD 0,0% 0,1% -0,1% -1,2%
MOSKOVSKAYA GORODSKAYA TELEFONNAYA SET' PAO GOOD 33,5% 0,1% 33,4% 38,8%
MOSKOVSKAYA GORODSKAYA TELEFONNAYA SET' PAO GOOD 33,5% 0,1% 33,4% 37,6%
NOVOROSSIYSKIY MORSKOY TORGOVYI PORT PAO GOOD -3,8% 0,1% -3,9% -11,5%
NOVOROSSIYSKIY MORSKOY TORGOVYI PORT PAO BAD -0,9% -0,4% -0,5% -2,9%
NOVOROSSIYSKIY MORSKOY TORGOVYI PORT PAO GOOD 8,2% -0,1% 8,3% 6,8%
NOVOROSSIYSKIY MORSKOY TORGOVYI PORT PAO BAD -2,0% 0,5% -2,5% 3,9%
NOVOROSSIYSKIY MORSKOY TORGOVYI PORT PAO BAD -0,8% 0,2% -0,9% -1,5%
NOVOROSSIYSKIY MORSKOY TORGOVYI PORT PAO GOOD 17,6% 0,0% 17,6% 16,8%
NOVOROSSIYSKIY MORSKOY TORGOVYI PORT PAO GOOD 6,4% 0,1% 6,3% 10,4%
ROSTELEKOM PAO GOOD -0,6% -0,1% -0,5% -1,0%
ROSTELEKOM PAO BAD 6,1% -0,1% 6,3% 13,3%
ROSTELEKOM PAO GOOD 2,5% -0,3% 2,8% 8,4%
ROSTELEKOM PAO GOOD 0,7% -0,3% 0,9% 2,3%
ROSTELEKOM PAO GOOD 0,6% 0,1% 0,5% -0,6%
ROSTELEKOM PAO BAD 0,2% -0,1% 0,2% 0,4%
VSMPO GOOD -1,5% -0,2% -1,3% -2,2%
VSMPO GOOD 0,6% 0,0% 0,6% 1,3%
VSMPO GOOD 3,0% 0,0% 3,0% 7,7%
VSMPO GOOD 1,7% 0,3% 1,5% 2,8%
VSMPO BAD 8,6% -0,1% 8,7% 14,6%
VSMPO BAD -0,5% 0,1% -0,6% -1,5%
VSMPO GOOD 3,4% 0,0% 3,4% 5,0%
VSMPO BAD 5,4% 0,1% 5,3% 0,0%
VSMPO GOOD 0,3% 0,1% 0,2% 1,3%

59
COMPANY TYPE OF EVENT
R ER AR (0) CAR (0)
BANK SAINT PETERSBURG GOOD -0,6% 0,1% -0,6% -0,4%
BANK SAINT PETERSBURG BAD -3,0% 0,2% -3,2% 4,0%
BANK SAINT PETERSBURG GOOD -0,5% 0,0% -0,5% -0,7%
CHERKIZOVO GROUP GOOD -0,1% 0,0% -0,1% 1,6%
CHERKIZOVO GROUP GOOD -4,1% 0,1% -4,2% -7,1%
CHERKIZOVO GROUP BAD 0,7% 0,1% 0,6% -3,4%
CHERKIZOVO GROUP BAD 0,6% 0,1% 0,5% 4,5%
CHERKIZOVO GROUP GOOD 1,2% 0,3% 0,9% 1,3%
MRSK SEVERNOGO KAVKAZA PAO GOOD 4,5% -0,4% 4,9% 7,3%
MRSK SEVERNOGO KAVKAZA PAO BAD 8,1% 0,1% 8,0% 18,9%
IRKUTSKENERGO GOOD -1,6% 0,0% -1,7% -5,7%
IRKUTSKENERGO GOOD 3,3% -0,3% 3,7% 7,6%
IRKUTSKENERGO BAD -2,3% -0,2% -2,1% -1,3%
IRKUTSKENERGO GOOD 33,4% 0,0% 33,4% 33,8%
IRKUTSKENERGO BAD -2,7% 0,2% -2,9% -5,8%
KAMAZ GOOD 0,3% 0,0% 0,2% -1,0%
KAMAZ BAD 6,3% -0,2% 6,5% 6,8%
KAMAZ BAD 0,8% 0,2% 0,6% -0,8%
KAMAZ GOOD -1,5% 0,1% -1,6% -1,7%
LENENERGO GOOD 2,2% -0,3% 2,5% 9,3%
LENENERGO BAD 4,1% 0,1% 4,0% 2,4%
LENENERGO BAD -1,3% 0,1% -1,4% -3,5%
LENENERGO GOOD -2,9% 0,0% -3,0% -5,7%
LSR GROUP GOOD -3,6% -0,3% -3,3% 6,4%
LSR GROUP GOOD -0,4% -0,2% -0,2% 6,6%
LSR GROUP GOOD 0,3% 0,0% 0,4% 0,8%
M VIDEO GOOD -0,3% 0,1% -0,4% -3,3%
M VIDEO GOOD 2,6% 0,1% 2,5% 4,2%
M VIDEO BAD 1,6% 0,0% 1,6% 1,9%
M VIDEO GOOD 0,1% -0,2% 0,3% 1,5%
M VIDEO GOOD 8,3% -0,1% 8,4% 8,1%
M VIDEO GOOD 0,0% 0,0% 0,0% -0,6%
M VIDEO BAD 0,0% 0,2% -0,2% 0,6%
M VIDEO BAD 1,2% 0,1% 1,1% 0,3%
MOSTOTREST GOOD 0,0% 0,1% -0,1% -7,8%
MOSTOTREST GOOD -1,6% -0,1% -1,5% 2,0%
MOSTOTREST BAD -0,6% -0,3% -0,3% 0,2%
MOSTOTREST GOOD 2,0% 0,1% 1,9% 4,6%
MOSTOTREST BAD -0,4% 0,2% -0,6% 4,6%
NIZHNEKAMSKNEFTEKHIM GOOD 1,5% 0,2% 1,2% 0,7%
NIZHNEKAMSKNEFTEKHIM GOOD 0,9% 0,1% 0,8% -1,3%
NIZHNEKAMSKNEFTEKHIM BAD 0,5% 0,0% 0,6% -3,7%
NIZHNEKAMSKNEFTEKHIM GOOD 2,5% 0,3% 2,2% -1,3%
NIZHNEKAMSKNEFTEKHIM GOOD 10,3% 0,2% 10,1% 5,3%
NIZHNEKAMSKNEFTEKHIM BAD 0,0% 0,1% -0,1% -6,4%
SISTEMA JSFC GOOD -0,6% 0,1% -0,7% -3,4%
SISTEMA JSFC GOOD 0,2% 0,1% 0,2% -1,0%

60
COMPANY TYPE OF EVENT
R ER AR (0) CAR (0)
SISTEMA JSFC BAD -4,2% 0,2% -4,5% -2,8%
SISTEMA JSFC GOOD 0,6% 0,0% 0,6% 11,7%
SISTEMA JSFC BAD -0,2% 0,2% -0,4% -0,4%
SLAVNEFT MEGIONNEFTEGAZ GOOD 1,2% -0,1% 1,3% -5,3%
SLAVNEFT MEGIONNEFTEGAZ GOOD -2,4% -0,1% -2,3% -4,3%
STHN.KUZBASS COAL CO. GOOD 16,9% 0,0% 16,8% 5,1%
STHN.KUZBASS COAL CO. BAD -12,9% -0,4% -12,5% -10,8%
TMK OAO GOOD 2,6% 0,0% 2,5% -8,1%
TMK OAO BAD -1,4% 0,0% -1,4% 2,0%
TMK OAO BAD 0,9% -0,1% 1,0% 2,3%
TMK OAO GOOD 0,0% 0,0% 0,0% 1,1%
TMK OAO BAD 1,2% -0,2% 1,4% 1,1%
TMK OAO BAD 1,0% 0,1% 0,9% 4,0%
TMK OAO BAD -2,7% -0,4% -2,3% 5,4%
TMK OAO GOOD 2,3% 0,0% 2,3% -3,2%
TMK OAO BAD -1,2% 0,0% -1,2% -2,0%
TMK OAO GOOD 0,8% 0,0% 0,9% 8,2%
TMK OAO GOOD -2,2% 0,0% -2,2% 2,4%
TRANS CONTAINER GOOD 0,0% 0,2% -0,2% -1,6%
TRANS CONTAINER BAD 0,0% -0,1% 0,1% -1,4%
TRANS CONTAINER BAD -3,5% -0,2% -3,3% -9,5%
TRANS CONTAINER BAD -0,4% 0,0% -0,4% 0,5%
TRANS CONTAINER BAD 0,0% 0,3% -0,3% -1,5%
TRANS CONTAINER GOOD 3,0% 0,4% 2,6% 4,8%
TRANS CONTAINER GOOD 3,0% 0,4% 2,6% 4,8%
TRANS CONTAINER BAD -1,1% -0,1% -1,0% -0,6%
CHELYABINSKIY KUZNECHNO-PRESSOVYI ZAVOD PAO GOOD -3,8% 0,1% -3,9% -26,3%
CHELYABINSKIY KUZNECHNO-PRESSOVYI ZAVOD PAO BAD 0,0% 0,0% 0,0% 0,3%
CHELYABINSKIY KUZNECHNO-PRESSOVYI ZAVOD PAO GOOD 0,0% 0,0% 0,0% 2,0%
CHELYABINSKIY KUZNECHNO-PRESSOVYI ZAVOD PAO GOOD 0,0% 0,1% -0,1% -10,6%
GAZPROM GAZORASPREDELENIYE ROSTOV-NA-DONU PAO GOOD -1,4% -0,1% -1,3% -9,6%
JSC LENZOLOTO BAD -1,1% 0,2% -1,3% -3,4%
JSC LENZOLOTO GOOD 2,7% 0,0% 2,6% 8,3%
JSC LENZOLOTO BAD -0,7% -0,1% -0,6% 1,8%
JSC LENZOLOTO GOOD 1,8% 0,0% 1,8% 5,1%
KRASNOKAMSKIY ZAVOD METALLICHESKIKH SETOK OAO GOOD 0,0% 0,0% 0,0% 0,0%
KRASNOKAMSKIY ZAVOD METALLICHESKIKH SETOK OAO BAD 0,0% 0,0% 0,0% 0,0%
KRASNOYARSKENERGOSBYT BAD 0,0% 0,0% 0,0% -16,6%
KRASNOYARSKENERGOSBYT GOOD 0,0% -0,1% 0,1% 1,9%
KRASNOYARSKENERGOSBYT BAD 13,6% -0,1% 13,7% -11,9%
KRASNOYARSKENERGOSBYT GOOD 21,5% -0,1% 21,6% 25,2%
KRASNOYARSKENERGOSBYT GOOD 27,8% 0,2% 27,6% 26,9%
KRASNOYARSKENERGOSBYT BAD 7,7% 0,1% 7,6% 8,7%
KUBANENERGO GOOD 0,3% 0,2% 0,1% -0,7%
KUBANENERGO BAD -0,8% 0,1% -0,8% -2,5%
PERM EN.DISTRIBUTING CO. GOOD -0,5% -0,2% -0,3% -1,1%
PERM EN.DISTRIBUTING CO. BAD 0,8% 0,1% 0,8% -0,6%

61
COMPANY TYPE OF EVENT
R ER AR (0) CAR (0)
PERM EN.DISTRIBUTING CO. BAD -2,2% -0,1% -2,2% -1,1%
PERM EN.DISTRIBUTING CO. BAD 0,0% -0,1% 0,1% 2,6%
PERM EN.DISTRIBUTING CO. BAD 8,8% -0,1% 8,9% 9,5%
PERM EN.DISTRIBUTING CO. GOOD 5,0% 0,0% 5,0% 4,2%
PERM EN.DISTRIBUTING CO. GOOD 3,9% 0,0% 3,8% 3,5%
PERM EN.DISTRIBUTING CO. GOOD 3,2% 0,1% 3,1% 3,1%
PRIMORIE BANK GOOD 19,4% 0,0% 19,4% 17,6%
PRIMORIE BANK BAD 0,0% 0,0% 0,0% 0,3%
PRIMORIE BANK GOOD 0,0% -0,1% 0,1% 5,7%
PRIMORIE BANK BAD 0,0% 0,0% 0,0% 0,0%
PRIMORIE BANK BAD 0,0% -0,2% 0,2% -9,1%
PRIMORIE BANK GOOD 0,0% 0,0% 0,0% 0,2%
RSC ENERGIA BAD 1,4% 0,1% 1,4% -0,7%
RSC ENERGIA BAD -1,2% 0,0% -1,3% -6,0%
RSC ENERGIA BAD 0,5% -0,1% 0,6% 0,4%
RSC ENERGIA GOOD 0,0% 0,0% 0,0% -0,1%
RSC ENERGIA BAD 0,3% 0,0% 0,3% -1,4%
RSC ENERGIA GOOD 1,3% 0,0% 1,3% 1,3%
RSC ENERGIA BAD 0,2% 0,0% 0,2% 0,5% ROSSIYSKIY AKTSIONERNYI KOMMERCHESKIY DOROZHNYI BANK PAO BAD 0,0% 0,1% -0,1% -0,3% ROSSIYSKIY AKTSIONERNYI KOMMERCHESKIY DOROZHNYI BANK PAO BAD 0,0% 0,0% 0,0% -0,1% RYAZANSKAYA ENERGETICHESKAYA SBYTOVAYA KOMPANIYA PAO BAD 0,0% -0,2% 0,2% 7,1% RYAZANSKAYA ENERGETICHESKAYA SBYTOVAYA KOMPANIYA PAO BAD -24,5% -0,2% -24,3% -21,7% RYAZANSKAYA ENERGETICHESKAYA SBYTOVAYA KOMPANIYA PAO BAD 0,0% -0,1% 0,1% 0,4% RYAZANSKAYA ENERGETICHESKAYA SBYTOVAYA KOMPANIYA PAO BAD 14,1% -0,2% 14,3% 30,9% RYAZANSKAYA ENERGETICHESKAYA SBYTOVAYA KOMPANIYA PAO BAD -15,5% 0,1% -15,6% -11,4% RYAZANSKAYA ENERGETICHESKAYA SBYTOVAYA KOMPANIYA PAO GOOD 0,4% 0,2% 0,2% 0,6%
SOLLERS GOOD -1,9% 0,3% -2,2% -4,0%
TNS ENERGO GOOD -2,1% 0,0% -2,1% 9,2%
TNS ENERGO BAD -0,3% -0,1% -0,3% -2,3%
TNS ENERGO YAROSLAVL GOOD 0,0% 0,2% -0,2% -1,2%
VLADIMIR CHEMICAL PLANT BAD -5,5% 0,0% -5,5% -3,8%
VLADIMIR CHEMICAL PLANT GOOD -1,1% 0,0% -1,0% -0,2%
VLADIMIR CHEMICAL PLANT GOOD 0,3% -0,2% 0,6% 7,2%
VLADIMIR CHEMICAL PLANT BAD 8,2% 0,0% 8,2% 11,4%
VLADIMIR CHEMICAL PLANT BAD -2,5% 0,3% -2,8% -8,0%
VLADIMIR CHEMICAL PLANT GOOD 0,0% -0,4% 0,4% -1,8%
VLADIMIR CHEMICAL PLANT BAD -0,6% -0,1% -0,5% 4,1%
VLADIMIR CHEMICAL PLANT BAD -2,4% -0,1% -2,3% -2,8%
VLADIMIR CHEMICAL PLANT GOOD -2,4% 0,0% -2,4% -4,4%
VLADIMIR CHEMICAL PLANT BAD 6,7% -0,3% 7,0% 4,6%
WORLD TRD.CENTER MOSCOW GOOD 0,0% 0,0% 0,0% 0,8%
WORLD TRD.CENTER MOSCOW BAD 0,5% 0,0% 0,5% 1,2%
WORLD TRD.CENTER MOSCOW GOOD -1,8% 0,1% -1,9% -2,7%


![On Steady Dividend Payment under Functional Mean Reversion ... · motivation for investing in stocks [11] so firms’ failure to maintain steady and high dividend payments is a discouragement](https://img.dokumen.tips/doc/110x75/5e8bc57b9020b54f4a55f261/on-steady-dividend-payment-under-functional-mean-reversion-motivation-for-investing.jpg)