Embed Size (px)
Citation preview

RELATIONSHIP BETWEEN 2-0AY SCREENING MEASUREMENTS OF 222Rn AND ANNUAL LIVING AREA AVERAGES 1N BASEMENT AND NONBASEMENT HOUS ES
by: S. B. White, N. F. Rodman and B. V. Alexander Research Triangle Institute Research Triangle Park, N.C. 27709
J. Phillips and F. Marcinowsk1 U.S. Environmental Protection Agency Office of Radiation Programs Washington, D.C. Z0460
ABSTRACT
As part of an EPA/State cooperative program, a random sample of 41 648 houses from 30 of the 48 conterminous states have been screened for 22ZRn over the past four years. Charcoal canisters were placed in the lowest livable level and exposed for two days. In addition, 1-year. alpha track detectors were used in a random subsample of houses with at least one detector placed on each livable level.
This paper describes the relationship between annual living area averages (ALAA) and wintertime, closed-house, 2-day screening measurements. Both 2-day and 1-year measurements of 222Rn were made on 995 houses located in 13 states. A broad range of climates, geologic conditions, and housing types are represented in the sample. Equations for predicting ALAA are derived for screening measurements taken in the basement and on the first floor of nonbasement houses. These relationships are used to obtain predicted values of ALAA for the 41,648 houses for which screenings measurements are available. The distribution of predicted values of ALAA by house type are then characterized. To the extent that the 30 states reoresent the 48 conterminous states, these distributions apply to the nation as a whole.
This paper has been reviewed in accordance with the U.S. Environmental Protection Agency's peer and administrative review policies and ~pproved for presentation and publication.

INTRODUCTION
Short-term screening tests for 222Rn are used to determine if additional testing (usually one year duration) is needed to more accurately characterize health risks to Rn exposure. The extent to which screening tests can properly identify houses needing further testing is governed by the degree to which short- and long-term measurements are related. This relationship has not been studied extensively. In a review of the published literature, Ronca-Battista (1) found only nine studies in which this issue was addressed and most of these had sample sizes less than 100 houses. This study attempts to provide a better understanding of this relationship.
A component of the EPA/State Indoor Radon Surveys involves two types of 222Rn measurement devices in a subsample of houses. Each participating house is tested with a 2-day charcoal canister placed in the lowest livable level and 1-year alpha track detectors (ATDs) placed on each livable level. The 2-day test is carried out in the winter season under closed-house conditions. A total of 995 houses provided data for establishing the relationship between 2-day measurements and 1-year measurements.
OBJECTIVES
The purposes of this study were (1) to examine the overall relationship between 2-day screening measurements and annual living area averages (ALAA), (2) to determine if a screening measurement can be effectively used to predict the ALAA for an individual house, and (3) to examine the distribution of predicted values of ALAA for some 40,000 randomly selected houses for which screening measurements are available.
METHODOLOGY
Two indoor radon measurements (X, ALAA) were obtained from houses covering a 13-state area.l X is the 2-day charcoal canister measurement observed in a given house and ALAA is the annual living area average obtained by averaging all ATD readings taken on that house. In multiple level houses, a single ATD was placed on each livable level with a maximum of four ATDs per house. Two ATDs were used in one-story nonbasement houses. Averaging measurements from each level is one of several ways of characterizing the annual concentration in a house. Other ways include
lStates providing both short-term and long-term measurements include: Alaska, Arizona, Indiana, Iowa, Maine, Massachusetts, Minnesota, Missouri, North Dakota, Ohio, Tennessee, Vermont, and West Virginia.
using only the first floor ATD meas_urement or using a weighted average :of the ATD measurements from each level, where the weights reflect the proportion of time spent o~. each revel. ·
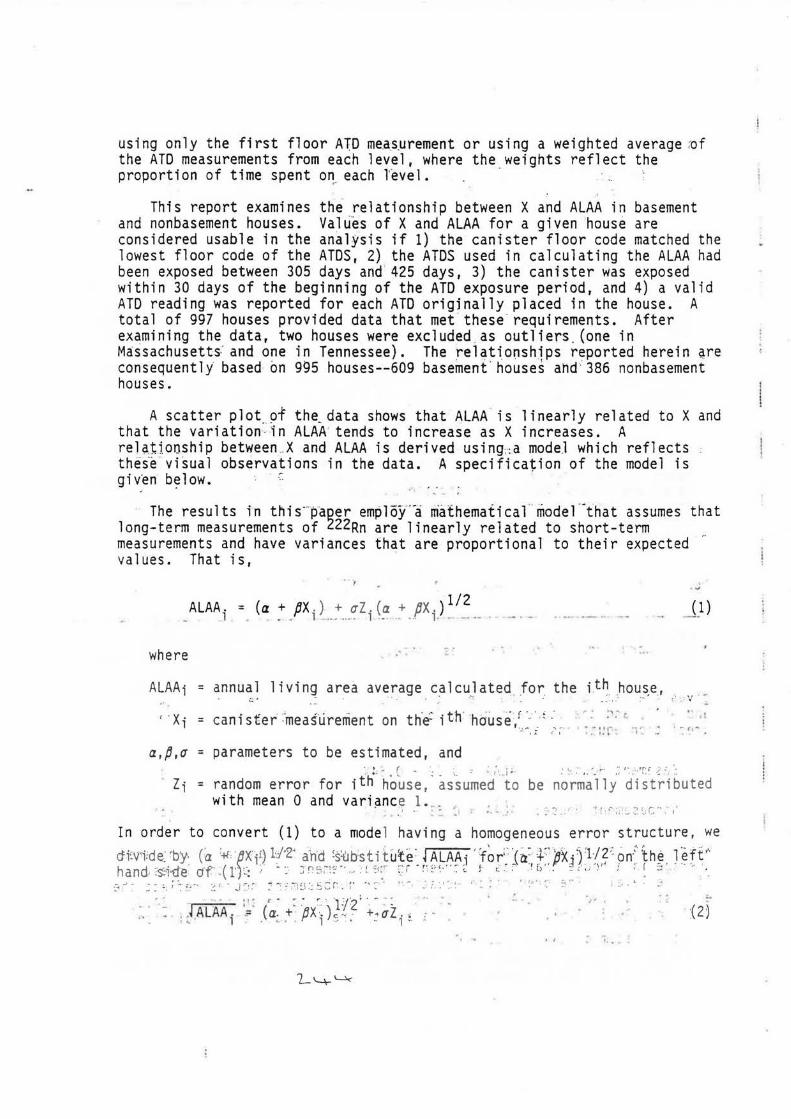
This report examines the relationship between X and ALAA in basement and nonbasement houses. Values of X and ALAA for a given house are considered usable in the analysis if 1) the canister floor code matched the lowest floor code of the ATDS, 2) the ATDS used in calculating the ALAA had been exposed between 305 days and 425 days, 3) the canister was exposed within 30 days of the beginning of the ATD exposure period, and 4) a valid ATD reading was reported for each ATD origjnally placed in the house. A total of 997 houses provided data that met these · requirements. After examining the data, two houses were excluded as outliers . (one in M~ssachusett~ and one in Tennessee). The relationsh1ps reported herein ~re consequentlY based on 995 houses--609 basement house~ ahd; 386 nonbasement houses.
A scatter plot_pf th~data shows that ALAA . is linearly related to X and that the variation -in ALAA' tends to increase as X increases. A relationship between _X and ALAA is derived using~ a mode] which reflects th~i~ vi~ual observations in the data. A specification of the model is giv~n b~low. · ~
·· The results in this ·· pager employ--a mathematical modef-that assumes that long-term measurements of 222Rn are linearly related to short-term measurements and have variances that are proportional to their expected · values. That is,
where
ALAAi
.. ,
. ...
=annual living area average calculated for the i~~ hou~e, ::.. ' ' .
= cani sfer :·measurement on th·e- i th: house f ·_ ·: ·· ... ~ : :'; · • · • ... ·.··.: ,:· ;· -. :.-::r ~,·: .:
j _l)
,:· ·.v -:
a,p.~ = parameters to be estimated, and ·,. L · (- :_ · :: .~/' ] ~ :~:.- t.-:. ~· .: ~ ~ .. ·., rr:~.~·::'.:
Zi = random error for ith h~~se,· ~s;umed to be normally distributed with mean 0 and vari~nce 1 •. . , .. , . ~ - ~ . . ~ : .. ; ~ . ... _. . -~· ~· . : ,. · -~ r: ~~ ; , ~:... 2 ~ .. l c ·~ .. , ·
'I • . .. • •
The parameters in (2) were estimate'd u'&-ing rionlirfear:least squares. The ... ' /'\ ""'" ""'\" ~-- ""' ::: \. • ' .J J ~: . :i; '_
prediction equation JALAA = (a+ px)1/2 was squared to 6btain predictions of long-term concentrations for given short-term measurements. Similarly,
.: A ·'
endpoints 'of the 95% confidence interval fQr -~ALAA were squared to obtain a corresponding interval estimate for the lo·n·g~~erm concentration.
. •.ri ·'
RESULTs; ,. ~·~.s ,:_-. ·
SHORT- VS LONG-TERM ' RELAT!ONSHIP - " .. ~ ~ ..... .
c -. - {• .• .' ,' -
1, Results of fitfi~g equatjon (2) to data""from hasemE:mt h~u.ses ~anc:t _f:rom ~qnbasement houses ; a~e ~ ~i~~~ ; in Table 1. For ea~~- type of house, TabJe 1
TABLE 1. EQUATIONS . FOR PREDICTING ANNUAL LIVING AREA -AVERAGES _ FOR BAS~MENT : AND NONBASEM~NT~~bUS~S~
·~ ...., :; I
·-. . ::: '"' ' : ',) I
Correiation Residual (X, ALAA) ~rror (;) Type of House
Sample - - . Size Prediction Equation
Basement ... 609
Nonbasement 386
. ""' ~ ~:-.~ .. --.· AlAA .= . 0.69 . ; .. + 0.54X
. ''(0.08)* (0.02) A
ALAA = 0.53 -- ·, (0.04) .
+ 0.61X . . (0.021
* (Standard error of parameter estimate.)
0.82
0.90
" . •' I - ' : . "•• '- ., • .
gives 'th~e"· sample "sfze, the::. pr'eai 'c'fion ~quation, fhe correlation and ALAA, and the standar.d devi;atiqn,. ri,r from.,the.,fitted ;mooel.
• • I ...,~ -,.. '"' • .. ' '- .J • ~ ..
predict1on equat1ons are
/"' ~ ~::. . ... l~ .: 2 ~
ALAA = 0.69 + 0.54X Basement House: :5.1 :J j ~ ··: .: Z-. ~ C \ ~ f Em1 ·':"" ; 9C ~: J9~U~2~ .~~ ~~ ~ ::t
Nonbasement House: A . l ~-<' r ·, t ! ; 5 ,' :· '" ~ :
ALAA = 0.53 + 0.61X C· n ~ s ., i • .J ; ~\
0.51
0.34
between X .The
-( 3)
(4) :."' , S' i L : x·::;: •t ::;·; ~ ~ <:,,; .··~)'-,:3 ~ : m.J ~ ~-\~" IV.'_. .·, ·:.:., o 'Ti £.C. .. : (~ i ~ ·L; ~~~: . · :_:· . ~ · c'''": -:
w~efe ~L~Ar; ~ s: tre; ~p~c~ed--: ~~r: P,r~q1 ~t~d) : y_ad~--~ :9:-f5 tlle~ ~p:n_ua.l ~l ; i v.:itn~rarnecl average 1n a house that has a screen1ng measurement of X o(l ~ t~- l:r;.we:st_. ~-· s ~ livable level. The prediction equation for nonbasement houses reflect the exclusion of two (X, ALAA) data points c;:onsige_r~d ,to be susp~~-,- (24.0, 2.2) and (39.6, 3.6). If these data po~nts are'incl~d~d the p~e~iction
A equation becomes ALAA = 0.61 + 0.52X.

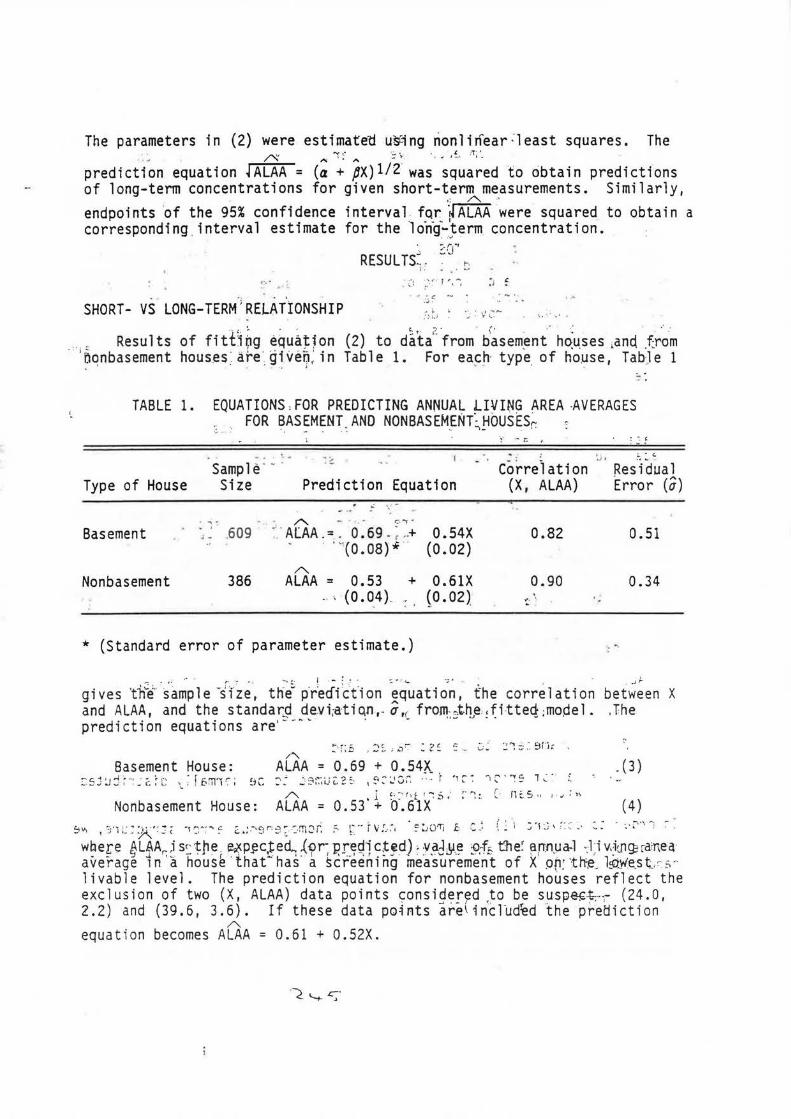
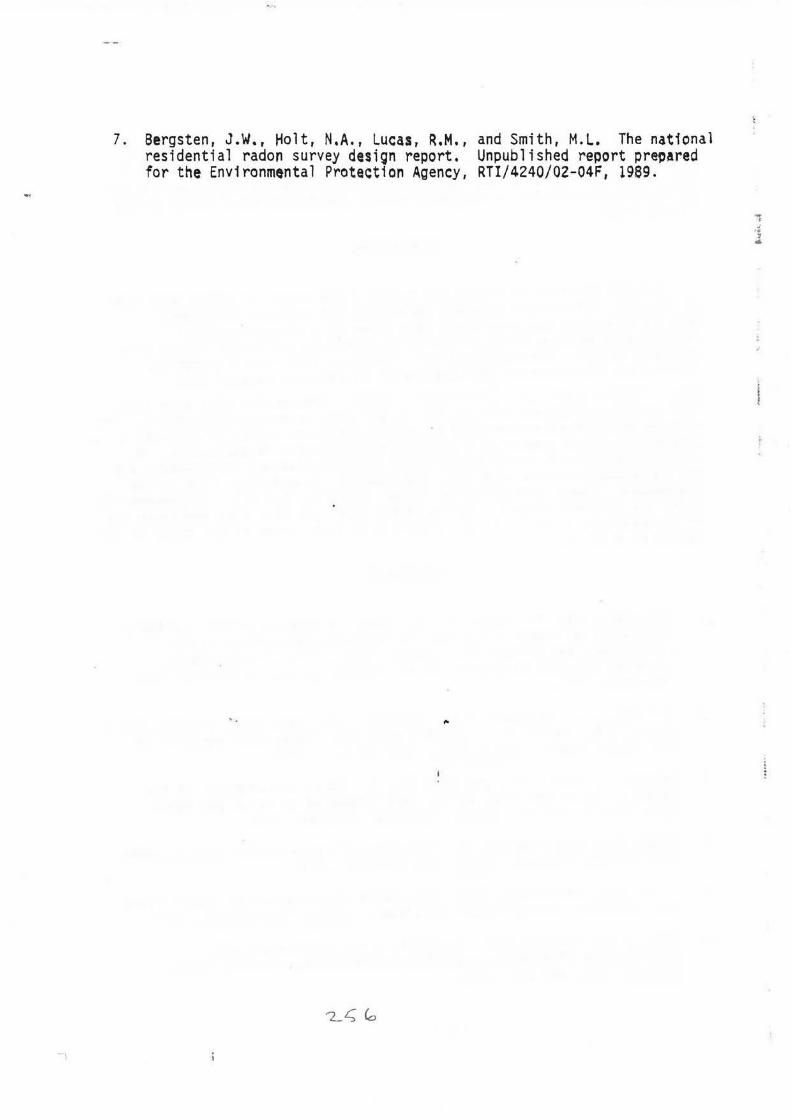
Scatter plots of the data for basement and nonbasement houses are shown in Figures 1 and 2, respectively. Note that as the canister measurements get larger the ALAA measurements show greater dispersion. As noted previously, this increase in variability in long-term measurements is taken into account by the model used in the data analysis. Superimposed on each scatter plot are three lines. The center line is the prediction equation. The other two lines (designated as UCL and LCL) represent the estimated upper and lower 95 percent confidence limits on the predicted value for an individual house. The interpretation of the confidence limits in Figures 1 and 2 is as follows: if a 2-day canister reading is X for a given house, there is a 95 percent chance that the true ALAA for that house would be covered by the interval falling between the upper and lower lines corresponding to X. For instance, for a basement canister measurement of X = 10 pCi/L, we can be 95 percent confident that the interval (2.2-12.0) will cover the true ALAA for that house. The vertical spread in the data for a given value of X (as reflected by the distance between the upper and lower confidence limits) indicates that the ALAA varies widely among houses having the same canister measurement.
FALSE POSITIVE/NEGATIVE ERRORS
EPA currently recommends additional testing if the screening measurement exceeds 4 pCi/L. Furthermore, EPA recommends mitigation if a 1-year test exceeds 4 pCi/l. In this case, a perfect screening test would correctly classify a house as to whether its annual concentration would exceed 4 pCi/L. Although there is no perfect test, one can, however, assess the performance of a screening test by characterizing the probability of an incorrect decision. One of two incorrect decisions can be made on the basis of a screening measurement--if a screeQing measurement is S4 pCi/L, one may incorrectly conclude that the house annual concentration is S4 (false negative); if a screening measurement exceeds 4;pCi/L, one may incorrectly conclude that the house annual concentration is · also greater than 4 pCi/L (false positive).
The probability that the ALAAwill exceed 4 pCi/L, given a specified screening measurement, X, is given by
P(z < (a+ bXl1/2_ 2 I xJ (]
(5)
where Z is a;' starid q. rq ~no_rm~al deviate, a and bare the estimated model parameters, a'· d . · a~,<l i s t he' sta-ndard deviation from the fitted model. This probabi 1 i ty/.was ··c a~ .cu l a ted fo r screening measurements, X, ranging from 1 to 16 pCJ / ~ fdr ~ ba~ement and nonbasement houses by substituting the appropriat,e pariim.eter estimates from Table 1 into equation (5); the results are show'n ·i'n Figure 3. The regions of false positive and false negative errors are noted and the probability of an error associated with a given screening measurement can be determined directly from the plotted curves.

A L A A
l: i I L
80 . ..,
70
60
~0
40
30
20
10
0
0
'J
j ,,
•1:"'1. lD .. ... \1.•
.-, r _-r ..-..: 1 l ~ ! ""
•.. , =-·: f .. J
'·' '' L. 1,1
· • 1',1• 'I
. ,
•
t·· - f' l- ~ ! ....
,-._ ( ! (j · __ .:_
(1 ...., :1 . r: ·.. . ..
; l ·r: -- :J
•."'I :.; - } ,. •. ~~·
_( Cl 1.: _;
•
, t ~_.,..,
J' ( _l I ' r-t I
... ~0 :_ ,. ! .. /
... ! tn !:""l
;:..' r_-r '"' ~-~· 1 t. . l i. 1.\' , _,
• • t I, I
'. ; l •• I) } I '• , ..
..
.-- ••
•
20 30 .,
-· :"'',
'·· ...
' I
,,.
., ' ' t •
.· .. .,
..
.,
' )
. ·~ ..
'} I I
• J
·~ q : ! ~0 •.· · :·
' I •
r•
' " ...
60
l-(?~y Cania~ Meuuremeoa. pCi/L
i' ; .
70
';I 1. •.)
~ . .,
80
Figure 1. Relationship Between 2-Day Charcoal Canister Measurement And Annual Living Area A vcragc - Bucmcm Houses
•· · •1 • • v• J t f 1 •
( .
• -!
90
• : .
...
01 '
UCL
A •· ALAA 0 .. 69 + 0.54X
LCL
•
100 110

3
0
0 2 4 6 8 10 12 14 . 16 18 20 22 24 26
2-Day Canistel" Meaawement, pCi/1...
Figure 2. Relationship Between 2-Day Charcoal Canister Measurement And Annual L1ving Area Average - Non basement Houses
28 30 32 34 36

.. ,,
u -•.. .::, .
•. ~ .,
-·
~-:;-- - ~
:. ~. .....
i.!- .... .. (.:
~::.
~L~ ,' ,-, ,.
,. .. ;.
-X ~ A
~ <( -a..
:: ... ._,
1.0 ~--------------r---------------------------~~-~--------------~
.9
.a
.7
.6
.5
.4
.3
.2
.1
'
2
I I
I
False Positives (above the curve)
Nonbasement ,' Houses-.,'
I I
I
I I
I I
I
,'!-- False Negatives , " , (below the curve)
3 4 5 6 7 8
, , , , , ,
, , ... ,
.,._ Basement Houses
9 10 11 12 13 14 15 16
·-. Screening Measurement, X
, ~ I '
Figure 3. ·Probability that annual living area average exceeds 4 pCI/L ! ' "' a~·a function of screening measurement
-it •. ..

For instance, the probability -of a false negative :error is approximately 0.17 for a screening measurement of 3 pCi/L in a basement house and approximately 0.09 for a screening measurement of 3 pCi/L in a nonbasement house. On t he other hand, the probability of a false positive error is approximately 0.41 (= 1.00 -; 0 •. 59) for a screening measurements of 7 pCi/L in a basement house and aRpro~~ately 0.29 (= 1.00 - 0.71) for a screening measurement of 7 pCi/L in a nonbasement house.
A ~ .. DISTRIBUTION OF ALAA r . • .
The re l ati onshi ps between short-term and l ong-t,erm measurements of indoor 222Rn as given by equ:ations (3) and (4) provide an opportunity to use an existing data ba-se of screening measurements to characterize the
A distribution of ALAA. •
Under the EPA/State Indoor Radon surveys initiated in 1986, 30 of the 48 conterminous states have conducted statistically designed surveys. A probability-based sample of owner-occup}~d main residences having a listed te-lephone riuinbe·r, a p·e-rin.anent foundation, and at least one floor at or below grade level was selected in each state. Sample houses were tested with a 2-day charcoal canister placed in the lowest livable level. Tests were conducted during the heating season under close-house conditions. Although other surveys have used probability sampling : (2,3), and other·data sets include more test houses (4,5)~ _ the state surveys collectively provide the largest existing data base formed from studies that 1) use probabilities in making house selections, 2) have common objectives, 3) utilize the same measurement method, 4) employ the same protocol, and 5) sample the same target po~ulation. The 30 state ~urveys have produced
. .
20,768 basement measurement~, and. 20,880 first floci~ meas~~e~ents in nonbasement houses .
" r
The basement screening :m~asurement, X, for a giv~n house was A .
substituted into equation (3.)" to obtain a value of ALAA for that house.· :rn ·-A . .. .. . .. ·----- ..... ...... ... ·---· - -- ··'"" . ... ... .. ····-- ---·-
rilakfng.the· translation from X to ALAA, the sampling weight for the house was retained for use in future analyses. This process was repeated for all
A basement screening measurements and produced 20,768 ALAA values and associated sampling weights from a random sample of basement houses covering a 30-state area. Similarly, each first floor screening
/' . measurement was substituted into equation (4). This generated 20,880 ALAA values and associated sampling weights from a random sample of nonbasement houses covering a 30-state area.
Table 2 gives, in tabular form, the weighted cumulative distribution of /'
ALAA for baseme·nt houses, for nonbasement houses, and for a 11 houses in the 30-state area. In addition, the distribution for basement and for nonbasement houses are presented graphically in Figure 4. Summary
statistics (weighted) relating to these distributions of ALAA are given in

. A "' · ·TABLE 2. · CUMULATIVE DIS1RIBUTIONS OF :ALAA FOR 30;..STATE AREA
A ALAA
.4
.6
.8 1.0 1.2
1.4 1.6 1.8 2.0 2.2
2.4 2.6 2.8 3.0
~ 3. 5
4.0 4.5 5.0 6'.0 8.0
..
.. .. ~
Basement Houses
0.0 0.1 1.2 5. 4; .. .·
15 J. ~
26.2 33.0 41.3 48.1 52.4
57.2 ' 61.5 ~: · ;-
65.1 ;67.6 --74.6
. 79.1 82.4 -
~ :85 ~: 1 . . : '' ·,· - '· > 89 A
93.6
I ,:
:' - :J·
,. ... .. "'
3.4 12.9 28.6 45.2 ~ ;; . 5.8~3
70.5 76.2 80.4 84.8 ~ :T ~
'
.
87.4 .. C7!'
-~ :- .. , ~-. ':' ~
89.3 •:: 90.6
. 92 ~ 1 93.0 94.7 '
96.1 ,:· 97 :o . . 97.9 . ·. =_. 98.4 99.2
·- -: -~-~
:1 .. :.
All Houses
1.6 5.9
13.7 23.6 35.1
46.4 52.7 59.1 64.8 . 68.4 ~.
71.9 <.
74.8 ··: 77 .4, 79. 2.' . 83 .8~
86.8' 89.1 90.8 93.5 96.1
-----------------------------------------------------------r--------------10.0 ' ' 95,8 ::" ''.' 99,5 c . • 97,5 15. 0 98. 0 c .99. 9 ,. : 98 .8 20.0 . ::• 98 ~ 8· . l ~ ... -···99.9 99.3 -2:5.0::.. 99.2 . 99: .9+ ~- ... Jl!99.5
,.. - - . • c. ==' i. -.. l I •'
2 ··-, , • ,. . ,.. . ,. . . -,.; .. ' .
...... ~.! . -~ . - . ....,
: ~. _· -~ • ~-- ~' ~: • --~1 ~~ ~ ~: •• • • ~~ r--_ ~ ~ :: ·• !
. •'' 91";'~(-.£.):: ,-~ ")~~ i -. ! ::.:;,..s: ;:·:1'). [:~ ~ i'ii~l''.
., .. - : . .. .. .. ~ . ~ .
I ~ . . . ..
{. ~ ~! ~ f :o\
L
. ,.~ •.; · ~ ~:· .. ::. ~ ~·· ,·'"\
: •·.;. .. .. :) '" : ..... ~., ;, ·.:·:~:' :- '" · :_\:. ~
.~~~~ s:::: ~ :: r .. "l;~.-~----
. L • ·; ~ ;:, : : :: ~- - ) ; 0::' 2921.'~ ...
'.J :. ~--'~.\'''t' I ~ •• :,,,•·· ~ , r: • ~~ •, . , · ' ~ f:. : .J ·.L ~- v. ; ~ -
• • r • •• • :_. . \
' ..
. .

c: 0 ·~
~ -c: g 0 ()
<~ <
40
30
20
10 8
6
4
2
1.0 .8
.6
. 4
. 2
.1
~
(~ ~ . ~
• •
2 5
-<.
., ~ . . "'
- .. .....
.... .J.,..
-· • •
::_·( ~-
• i. • . ~· .
,,
~
. r.; • • • ~ . •• • • .,_
A
•• A 1 • A • AA • AA
· ....... ... .'t ~ ~!; ~::.
n u - . -• Basement Houses " ;;. I .......
, o ~: ,. ~o .: 3o · · 4cr· "'so ... ~. 6o
,, ';_-. .~
~- Nonba.sementrHouses:
·-.J:. 80 90 95
: :1 ('·~ ~
98
•• •
AA
c
99 99.5

A Table 3. It is clearly evident that ALAA is higher in basement houses. For example: the median (5oth percentile) is 2.05 pCi/L for basement houses as compared to 1.02 pCi/L for nonbasement houses and the arithmetic mean for basement houses is more then double that for nonbasement houses (3.4 pCi/L as contrasted to 1.4 pCi/L).
A Figure 4 indicates that the -distribution of ALAA cannot be
satisfactorily approximated by a lognormal distribution since the data points for each house type depart substantially from a straight line plot. This was anticipated and can be explained by examining the prediction equations (3) and (4). Prediction equation (3), for example, converts the
A variable X, basement screening measurement, into the variable ALAA through
A the relationship ALAA = 0.69 + 0.54X. X is assumed to be lognormally distributed and there is strong evidence to support this assumption. Under
A ' this assumption, ALAA is lognormally distributed~ if the intercept
A term in the relationship is zero. If the intercept is zero, then ln (ALAA) is normally distributed since it is the sum of a normally distributed variable (ln X) and a constant (ln 0.54). The data show, however, the intercept (estimated at 0.69) to be statistically greater than zero.
A The empirical distribution of ALAA ~haws more houses in the tail of the
distribution than the number obtained by using · a lognormal distribution. For instance, the empirical distribution (Table 2 or Figure 4) ·shows 1.2%
A of basement houses have ALA~ exceeding 20.0 pCi/L as contrasted to an est1mate of 0.2% .based onc·a -lognormal distribution with a geometric mean of 2.4 !pCi/L and a geometric standard deviation of 2.1. Applying ~h~se percentages(· to· ·a;:base of. -severa 1 mi 11 ions of houses produces an : enormous
A difference in the two estimates of the number of houses with ALAA exceeding 20.0 pCi/L. The empirical distribution is based on tests from more than 40' 000 .~:louses -and. shou 1 d ·be u·sed 'in '"est i m;ft i n~(pro'p"orfi ons rather than using a geometric me~n an~geoJ~:~etriclstandaqj deviatipn.
i. 0~~ ~·~ -~~ 2:. ~ :·,,__ . . - {. \· ' ' . ~ - - .
A The percentage of houses: ·'!'li::th ,A.LAA .. ~exceeding 4, 10 and 20 pCi/L are,
respectively, 13.2%, 2.5% and 0.7% (Table 3, 3rd column). In contrast, [he distribution of annual average radon concentration in U.S. houses reported by Nero (6) shows: 7.4% of the houses above 4 pCi/L; 1.0% abov~ 10 pCi/L; and, Pl!- ~3% . rlb9y:e :·.~O.::RSJ/L ·, (,th.ese .. ~percentages rwere :carc·t~' l a ted ,.us fng a geome1:rfc'iriean of 0.9 pCi/L and a geometric standard deviation of 2.8). The differences may be attributable, in part, to differences in the dependent variables, to the way basement houses are defined, and to the sampled populations. For this study, a basement house is defined as any house where the lowest livable level has at least one wall built against earth.
A scientific study is now under way by EPA to characterize the nationwide distribution of annual concentration of indoor 222Rn in residential houses (7). This study should resolve many issues/questions

A . TABLE 3.-.·. ALAA SUMMARY STATISTICS FOR 30-STATE~AREA
. ,. , Basement
Parameter Houses
Arithmetic Mean* 3.4 . '
2.4 ..
Geometric Mean* ' ,.
2.1 .. [
Geometric Standard Deviat~on l i.: i..: . :~ . i"' ~:\
,.. - 0 A ~ • •
Median*
%) 4 pCi/L~ · ';
%) 10 pCi/L · ·. f.• .
%·) 20 pCi/L ··· ·
. ~
.. ~ ·-' .
.. f
2. 05
... ',·
-: .. ... ·-
* Units of measurement · ~ · pCi/l. . :
•-: r . ·. : .
''t'"( . ~\. ::-: . .. ·, . ... :· ~ .. •.: .
. . 2 I ~ ~ # ~
i . ~ ... ·" .,"!. L • : -· I
'"'\ .· . ·-.
Nonbasenient '· Houses
1.4
c .. All Houses
2.5 • t., ~.J -
1.1 ~:-; !-; 1. 7
2.0 2.2 '· 1.02 1.50
~ -. 9 13.2 :,.
o .5 · 2.5 S'
0. pc . .. . . . . 0~7
r _, -... • c..
• • ... r ... ' 1 f • I ~ • • .. ~
;
- r ; .. '
• : : 0 :J (. : ;. :· r: • • _J .. :•: . ;, ... ~ r :r ~ , . ri. ~ , 2 ~~ ;1 ~: ~-
.... ..., . , 'l -. ; ."
·' , '· .
~:~~rn .. r' ~:r-:.1 >·1o\
·). 1
; I 1 ~:: U · :.: ~ · ;_ I • )" : =· : y' r_;:~ t • ~ t fl f "':1f , ~) ~
I - ·:; (_ : .~ :: J
;·; 0 f:'j" ~
. Et' :~· ~
. • ... .. r
-c .. r, :.
SC.: ~~ '3"· . . ~ : ~ :!:? :7n~ ·~s~ia '"1· ~··\J£q \:':.:::~·~:; .
. ~ ~· , n:>:: ; . ~c!. ~ .
. :
. . :: •. f.
..
'"'< -.-.
':' "

.· ..
relating tcr levels of·222Rn to whj~h occupants are exposed. Until such times that results from this national assessment study become available,
A the . .in.formation provided by the distr-ibution of:::AL-AA serves: to add to the ex.isffng body of data on nationwide annual concentration of 222Rn in the living area.-·-. '
'• -
. Two-day charcoal canisters and 1-year alpha track detectors were .used to-measure 222Rn in 609 basement houses and 386 nonbasement houses. Results from this two-year study show there is . a~ ~trong positive .. .. relationship between 2-day screening measurem~rtti and annualLliving· area averages (ALAA). The equations for predicting ALAA from a screening measurement for-basement and nonbasement houses are, respectively,
A A ALAA = 0.69 + 0.54X and ALAA = 0.53 + 0.61X. The results also. show that ALAA varies widely among houses having the same screening measurement. The derived relationships w~re used to obtain predicted values of ALAA for a · probability-based sample of 41,648 houses covering a 30-state area. A characterization of the distribution of predicted values for basement and for nonbasement--houses .is given-.-· .for--example, an estimated 7.0% of the nonbasement houses have predicted values exceeding 3.0 pCi/L as compared to 32.4% for basement houses. To the extent that the.30 states represent the 48 conterminous states, the distributions of ALAA shown herein apply to the nation as a whole.
REFERENCES
1. Ronca-Battista, M. Radon in U.S. homes: A summary of the available literature on annual and screening radon concentrations, season variations, and differences between floors. Unpublished report prepared for U.S. Environmental Protection Agency, Washington, D.C., September 1989. ·
2. Perritt, R.L., Hartwell, T.D., Sheldon, L.S., Cox, B.G., Clayton, C.A., Jones, S.M., Smith, M.L., and Rizzuto, J.E. Radon-222 levels in New York state homes. Health Phys. 58: 147-155, 1990.
3. Rahman, M., Hoyle, W., and Tuccillo, K. Radon measurements in New Jersey. Paper presented at the 1988 Symposium on Radon and Radon Reduction Technology, Denver, Colorado, October, 1988.
4. Cohen, B.L. and Gromicko, N. Variation of radon levels in U.S. homes with various factors. JAPCA 38: 129-134, 1988.
5. Alter, H.W. and Oswald, R.A. Nationwide distribution of indoor radon measurements: A preliminary data base. JAPCA 37: 227-231, 1987.
6. Nero, A.V., Schwehr, M.B., Nazaroff, W.W., and Revzan, K.L. Distribution of airborne radon-222 concentrations in U.S. homes. Science 234: 992-997, 1986.
7. Bergsten, J.W., Holt, N.A., Lucas, R.M., and Smith, M.L. The natfonal residential radon survey design report. Unpublished report pre~ared far the Env1ronmental Protection Agency, RTI/4240/02-04F, 1969.