Embed Size (px)
DESCRIPTION
3 < x + 2 < 10 10 > -2x + 4 > 19 -5 ≥ ½ x + 3 > 11
Citation preview

Relating Graphs and Events
Goals / “I can…”◦ Interpret, sketch, and analyze graphs from
situations
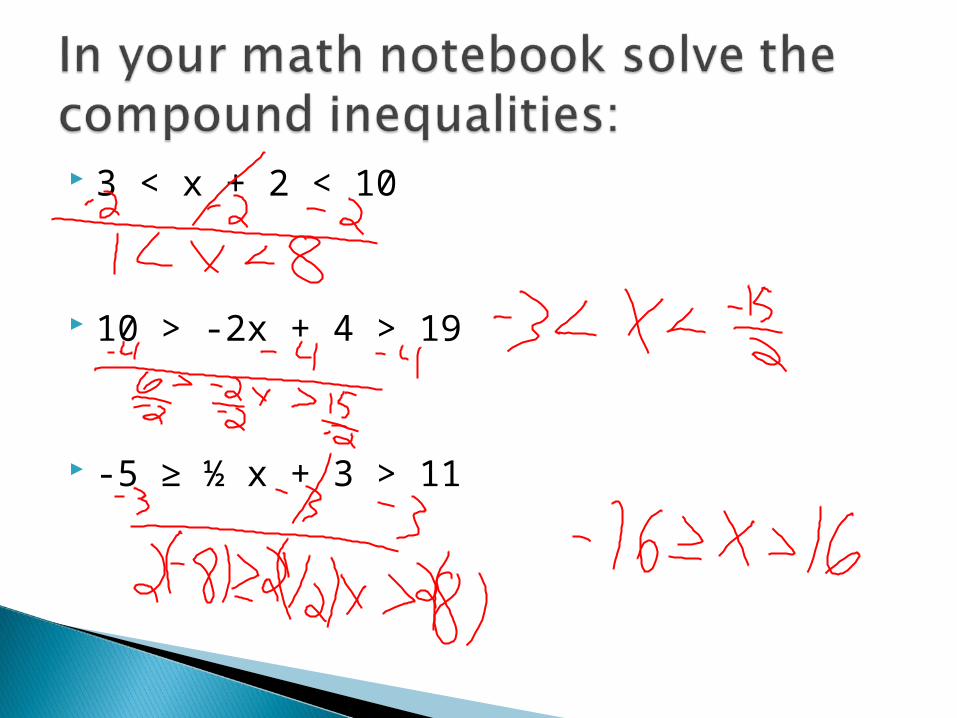
3 < x + 2 < 10
10 > -2x + 4 > 19
-5 ≥ ½ x + 3 > 11
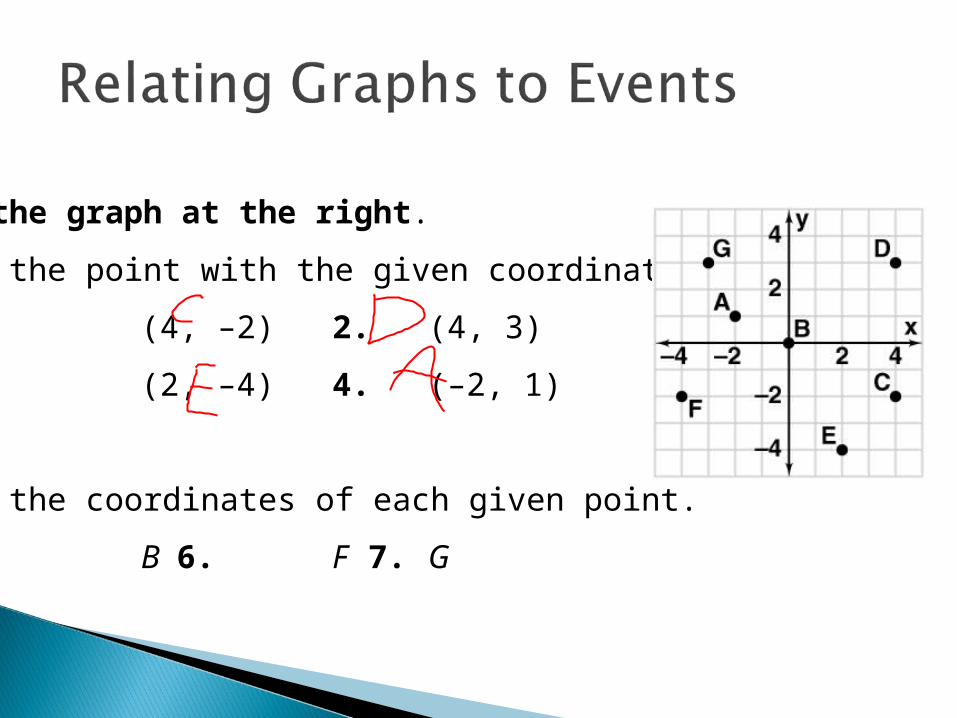
Use the graph at the right.
Name the point with the given coordinates.
1. (4, –2) 2. (4, 3)
3. (2, –4) 4. (–2, 1)
Name the coordinates of each given point.
5. B 6. F 7. G

Now that you have worked with both equations and inequalities, you will begin to learn more about functions and their characteristics. One of those characteristics is their graphs. This lesson is an introduction relating graphs to events that will later lead to understanding functions.

A big part of math is understanding the world around us.

A big part of math is understanding the world around us.
Part of understanding the world around us is representing information mathematically.

A big part of math is understanding the world around us.
Part of understanding the world around us is representing information mathematically.
In life graphs are often used to persuade people.

This graph shows someone taking a walk inthe neighborhood. Describe what it shows by labeling each part.

A pelican flies above the water searching for fish. Sketch a graph of its altitude from takeoff from shore to diving to the water to catch a fish. Label each section.

In your math notebook write what you think this graph tells you.
Percent of people using shaving cream

Which graph in Example 3 could show a car sitting at a stoplight?
Graph I indicates a quantity that does not change with time.
Graph II shows an increase over time.
A car sitting at a stoplight would stay in the same place over time.
Graph I could show a car sitting at a stoplight.

Graph your distance from the ground as you ride a Ferris wheel for five minutes.