Embed Size (px)
Citation preview

Research article
TheJournalofClinicalInvestigation http://www.jci.org Volume 120 Number 1 January 2010 93
The evolutionarily conserved TSC/Rheb pathway activates Notch in tuberous sclerosis
complex and Drosophila external sensory organ development
Magdalena Karbowniczek,1 Diana Zitserman,1 Damir Khabibullin,2 Tiffiney Hartman,1 Jane Yu,2 Tasha Morrison,2 Emmanuelle Nicolas,1 Rachel Squillace,3
Fabrice Roegiers,1 and Elizabeth Petri Henske2
1Institute for Cancer Research, Fox Chase Cancer Center, Philadelphia, Pennsylvania, USA. 2Division of Pulmonary and Critical Care Medicine, Brigham and Women’s Hospital, Boston, Massachusetts, USA. 3The Rothberg Institute for Childhood Diseases, Guilford, Connecticut, USA.
Mutationsineitherofthegenesencodingthetuberoussclerosiscomplex(TSC),TSC1andTSC2,resultinamultisystemtumordisordercharacterizedbylesionswithunusuallineageexpressionpatterns.Howtheseunusualcell-fatedeterminationpatternsaregeneratedisunclear.WethereforeinvestigatedtheroleoftheTSCintheDrosophilaexternalsensoryorgan(ESO),aclassicmodelofasymmetriccelldivision.Innormaldevelopment,thesensoryorganprecursorcelldividesasymmetricallythroughdifferentialregulationofNotchsignalingtoproduceapIIaandapIIbcell.WereportherethatinactivationofTsc1andoverexpressionoftheRashomologRhebeachresultedinduplicationofthebristleandsocketcells,progenyofthepIIacell,andlossoftheneuronalcell,aproductofpIIbcelldivision.LiveimagingofESOdevelopmentrevealedthiscell-fateswitchoccurredatthepIIa-pIIb2-cellstage.Inhumanangiomyolipomas,benignrenalneoplasmsoftenfoundintuberoussclerosispatients,wefoundevidenceofNotchreceptorcleavageandNotchtargetgeneactivation.Further,anangiomyolipoma-derivedcelllinecarryingbiallelicTSC2mutationsexhibitedTSC2-andRheb-dependentNotchactivation.Finally,inhibitionofNotchsignalingusingaγ-secretaseinhibitorsuppressedproliferationofTsc2-nullratcellsinaxenograftmodel.Together,thesedataindicatethattheTSCandRhebregulateNotch-dependentcell-fatedecisioninDrosophilaandNotchactivityinmammaliancellsandthatNotchdysregulationmayunderliesomeofthedistinctiveclinicalandpathologicfeaturesofTSC.
IntroductionTuberous sclerosis complex (TSC) is a multisystem tumor sup-pressor gene syndrome caused by mutations that inactivate either TSC1 or TSC2. TSC is characterized by neurologic disease (sei-zures, mental retardation, and autism), pulmonary lymphangi-oleiomyomatosis (LAM), and hamartomatous tumors of the brain, heart, kidney, and skin (1). The hamartin and tuberin proteins (TSC1 and TSC2, respectively) function as a heterodimeric com-plex to inhibit the Ras homolog Rheb, which activates the mam-malian target of rapamycin (mTOR) complex 1 (TORC1) (2–7). The TSC/Rheb/TOR pathway is conserved in Drosophila, in which it has been shown to regulate cell size (8–15) and the timing of neuronal development (16).
Unusual cell lineage expression patterns are a hallmark of TSC lesions in humans. The central nervous system lesions in TSC include cortical tubers and subependymal giant cell astrocytomas, both of which contain distinctive “giant cells” that inappropriately coexpress neuronal and glial-lineage markers (17, 18). Outside the central nervous system, pulmonary LAM and renal angiomyoli-pomas are among the most clinically devastating features of TSC (19). LAM cells and angiomyolipoma cells express both smooth muscle and melanocytic markers, and angiomyolipomas exhibit differentiation plasticity, with vascular, smooth muscle, and fat
cells all arising from a common precursor cell (20). The molecular mechanisms underlying these unusual cell-fate determination pat-terns in TSC tumors are not well understood.
To study the potential role of the TSC signaling network in cell-fate determination, we used the Drosophila external sensory organ (ESO), which is a well-studied model of asymmetric cell division. The sensory organ precursor (SOP) cell divides asymmetrically to produce 2 daughter cells, the pIIa cell and the pIIb cell. The pIIa cell divides once more to form the external cells of the ESO (the socket and hair cells), and the pIIb cells divides twice to generate a neuron, a sheath cell, and an apoptotic glial cell (Figure 1A). The asymmetry between the pIIa and pIIb is established by differential regulation of Notch signaling. Activation of Notch signaling in the pIIa cell and suppression of Notch in the pIIb cell is controlled through multiple mechanisms, including asymmetric segregation of the Notch antag-onist Numb to the pIIb cell during SOP mitosis (Figure 1A).
Here we show that inactivation of Tsc1 or overexpression of Rheb in SOP cells results in a phenotype consistent with ectopic Notch activation: duplication of the pIIa cell and its progeny, the hair and socket cell, at the expense of the pIIb cell. We further find evidence for Notch receptor cleavage and Notch target gene activa-tion in human angiomyolipoma tumors and an angiomyolipoma-derived cell line with biallelic TSC2 inactivation. Our results reveal what we believe to be a novel, evolutionarily conserved pathway, in which the TSC1/TSC2/Rheb proteins regulate the activity of Notch, which in turn may act to regulate cell fate and cell prolif-
Conflictofinterest: The authors have declared that no conflict of interest exists.
Citationforthisarticle: J. Clin. Invest. 120:93–102 (2010). doi:10.1172/JCI40221.
Related Commentary, page 84

research article
94 TheJournalofClinicalInvestigation http://www.jci.org Volume 120 Number 1 January 2010
research article
TheJournalofClinicalInvestigation http://www.jci.org Volume 120 Number 1 January 2010 95
eration. Notch activation may contribute to the unusual clinical manifestations of TSC, and targeting the Notch signaling network may provide a new clinical strategy for the therapy of TSC.
ResultsRheb regulates Notch-dependent cell-fate decisions in Drosophila. Based on previous observations that central nervous system lesions in TSC show inappropriate expression of neural and glial markers (17, 18), we asked whether TSC loss or Rheb activation results in cell-fate defects in the Drosophila ESO, a well-studied system for understanding neural cell fate choice, based on Notch signal-ing activation (Figure 1A). We generated mosaic clones of 3 Tsc1 mutant alleles (Tsc1Q87X, Tsc1W243X, and Tsc1R453X) on the fly tho-rax. Within these clones we observed 2 phenotypes: double bristles (twinning) and patches of bald cuticle (balding) (Figure 1B). We quantified these phenotypes in 17 flies with GFP-marked mosaic clones of 2 of the alleles, W243X and R453X (Figure 1D), using the mosaic analysis with a repressible cell marker (MARCM) sys-tem (see Methods). Twinning was present in 1.6% of the Tsc1W243X ESOs and 5% of the Tsc1R453X ESOs (Supplemental Table 1; sup-plemental material available online with this article; doi:10.1172/JCI40221DS1). Balding (lack of bristles) was observed in 33% of the GFP-positive SOPs.
To determine whether these cell fate phenotypes were a conse-quence of hyperactivation of Rheb, the target of the GTPase-acti-vating domain of tuberin (TSC2), we used the Gal4/upstream acti-vating sequence (Gal4/UAS) system (21) to express Rheb within the SOP lineage, using the scabrous promoter (21, 22). Three per-cent of Rheb-expressing ESOs showed bristle twinning (Figure 1, B, E, and F, and Supplemental Table 1), similar to the Tsc mutant flies. Duplication of external cell fates at the expense of internal
cells in the ESO lineage is a hallmark of inappropriate activation of Notch signaling. We therefore examined whether the observed increase in external cells (twinning) in Tsc and Rheb mutant cells was accompanied by a loss of internal cells, using specific mark-ers for the neuronal and socket cells, embryonic lethal, abnormal vision (ELAV) and suppressor of hairless [Su(H)], respectively. We found that ESOs with twinning were devoid of ELAV-positive cells (Figure 1, D and E), indicating lack of the neuron, and Su(H) was expressed in 2 cells instead of 1 cell (Figure 1D), indicating dupli-cation of the socket cell. These data indicate that loss-of-function of the TSC proteins causes Rheb-mediated defects in ESO develop-ment, with duplication of the external cells (the socket and hair) and loss of the internal neuronal cell.
In order to further probe the nature of the defects we observed in Tsc mutant and Rheb overexpressing cells, we used live cell imaging to monitor asymmetric division and differentiation of ESO cells in living pupae of wild-type, Tsc mutant, and Rheb overexpress-ing cells. We used tau-GFP to observe the dynamics of the mitotic spindle and partner of numb–GFP (Pon-GFP) as a reporter of cell fate determinant asymmetric localization. Using this system, we visualized the development of the sensory organ from the division of the pI cell to morphogenesis of the differentiated sensory organ. In both Tsc1 mutant and Rheb overexpressing cells, we observed delays or premature arrest of the cell cycle and increased apoptosis compared with wild-type cells (Supplemental Table 2 and Supple-mental Figure 1). Cell cycle arrest and apoptosis resulted in the loss of sensory organs, consistent with the balding phenotype we observe in adult flies (Supplemental Figure 1).
We next focused on the analysis of asymmetric cell division in sensory organs that displayed the twin bristle phenotype. In wild-type SOP cell division, Pon formed a distinct crescent at the ante-rior cortex of the pI cell. As the pI cell divided, this crescent was segregated asymmetrically to the anterior pIIb daughter cell, as shown previously (23, 24). Interestingly, in Rheb overexpressing ESOs that subsequently developed duplication of hair and socket cells, we observed asymmetric targeting of Pon-GFP to the anterior cell cortex of the pI cell during mitosis and segregation of Pon-GFP to the pIIb daughter cell (Figure 1F). These data suggest that the bristle duplication phenotype is not likely a result defective segregation of cell fate determinants, such as Pon and Numb, dur-ing asymmetric cell division.
While the pI cell appears to divide in the correct orientation along the anterior-posterior axis under conditions of Rheb overexpres-sion, our live imaging revealed a striking change in mitotic spindle alignment of the pIIb cells. In the wild-type fly, the pIIb cell aligns its spindle along the apical-basal axis, while the pIIa cell spindle aligns along the anterior-posterior axis (23, 25–27). In the Rheb-expressing flies, 12% of the pIIb cells aligned their spindles along the anterior-posterior or medial-lateral axis, instead of the apical-basal axis. Importantly, the pIIb cells with misaligned spindles sub-sequently gave rise to duplicate bristle and socket cells (Figure 1F). Despite the change in orientation of the mitotic spindle, Pon-GFP was correctly segregated asymmetrically to only 1 daughter cell. These findings are consistent with model whereby Rheb induces a pIIb-to-pIIa cell-fate switch by promoting ectopic Notch activation, resulting in the twinning phenotype (Figure 1, C–F).
Genetic interaction of Rheb with genes involved in sensory organ develop-ment. Our data indicate that Rheb activation or Tsc inactivation results in incorrect cell fate specification in the pIIb cell, despite correct asymmetric targeting of cell fate determinants such as
Figure 1Tsc and Rheb regulate Notch-dependent cell-fate decisions in Dro-sophila. (A) The ESO lineage arises from a SOP cell (pI) and consists of 5 cells: 2 external cells, the hair (h) and socket (so), and 3 internal cells, the neuron (n), sheath (sh), and apoptotic glial cell (g). Numb (red) is asymmetrically localized in the mitotic pI and pIIa cells. The mitotic spindles of the pI and pIIa cells align on an anterior-posterior axis; the spindles of the pIIb and pIIIb cells align along the apical-basal axis. (B) Missing bristles and bald patches (asterisks) and duplicated bristles (arrows) in both Tsc mutant clones and Rheb-overexpress-ing ESOs. (C) Rheb expression inappropriately induces Notch activ-ity in the pIIb cell, causing it to divide in a pIIa-like manner, resulting in a duplicate socket and hair cell. (D and E) Both correct cell fate specification (white arrows) and loss of internal neuron (Elav, red, red arrows) and extra socket [Su(H), purple, arrows and arrowhead] cells in Tsc1 mutant clones (GFP, green) and Rheb-overexpressing ESOs. All panels are single XY sections extracted from a Z series. (D) Bottom panels are higher-magnification images of the boxed area from the top left panel. Tsc mutant organs exhibit extra external cells and loss neu-ron phenotypes (arrowheads). Su(H) immunostaining (top right panel, purple arrows) confirmed extra socket (boxed area). (E) Rheb overex-pression results in duplication of external cells (white arrowheads) and loss of neurons (Elav, red). (F) Representative example of live imaging of a pIIb-to-pIIa cell-fate switch in Rheb-expressing pI cells, leading to sensory organ twinning phenotype. pI and pIIb cells divide within the plane of the epithelium (white arrows) and segregate Pon-GFP cor-rectly to 1 daughter cell. Scan of the same cells in the living pupa at 12 hours after division reveals a double socket and double hair ESO, and the thorax of the same adult fly showed a sensory organ twinning from this SOP cluster (black arrow). Scale bar: 10 μm (B and D–F).
research article
96 TheJournalofClinicalInvestigation http://www.jci.org Volume 120 Number 1 January 2010
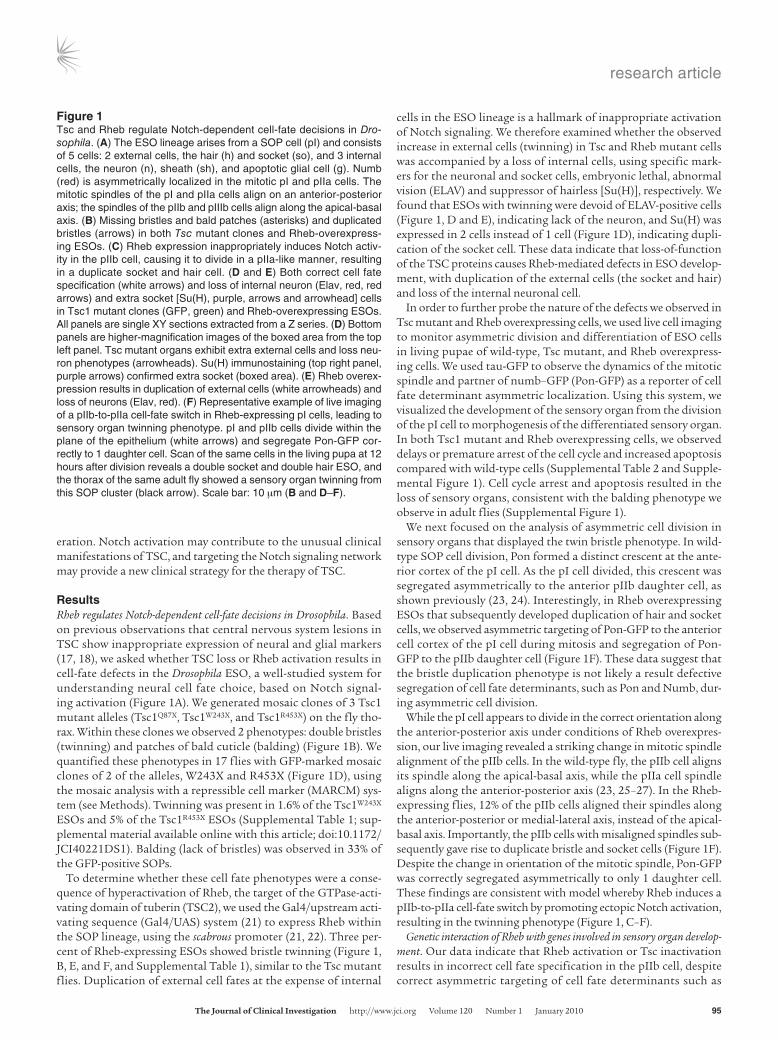
Numb during SOP mitosis. In order to determine whether Rheb acts in the same pathway or in a parallel pathway to Numb, we used a genetic approach and assessed the interaction between Rheb and 3 other genes that impact Notch activity: a nonphosphorylatable form (3A) of lethal giant larvae [l(2)gl], nuclear fallout (Nuf), and Rab11), nuclear fallout (Nuf), and Rab11. Nuf and Rab11 regulate Notch activity by controlling Delta trafficking (28), while l(2)gl3A regulates Notch activity by controlling the asymmetric targeting of Numb (29). When combined with l(2)gl3A expression, Rheb synergistically enhanced the twinning phenotype (Figure 2 and Supplemental Table 1), while when combined with Rab11 or Nuf, Rheb had only a minor impact on twinning (Figure 2A and Sup-plemental Table 1). From these data we conclude that Rheb likely functions to control Notch signaling during ESO development via a pathway that is parallel to asymmetric targeting of Numb.
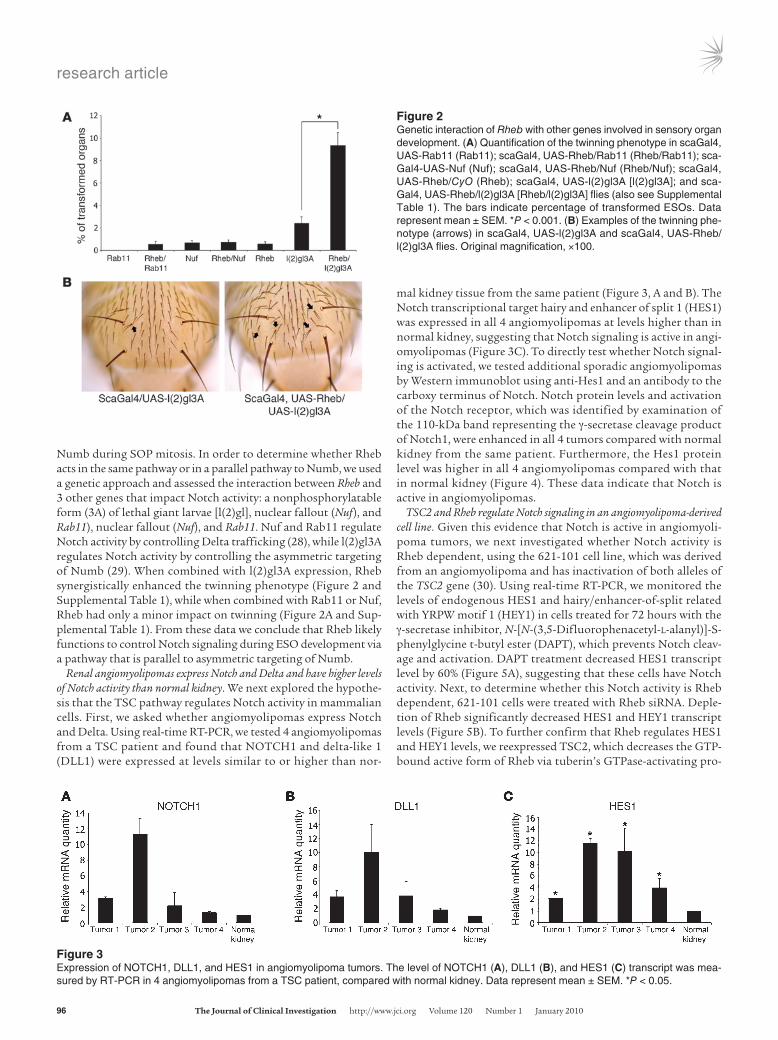
Renal angiomyolipomas express Notch and Delta and have higher levels of Notch activity than normal kidney. We next explored the hypothe-sis that the TSC pathway regulates Notch activity in mammalian cells. First, we asked whether angiomyolipomas express Notch and Delta. Using real-time RT-PCR, we tested 4 angiomyolipomas from a TSC patient and found that NOTCH1 and delta-like 1 (DLL1) were expressed at levels similar to or higher than nor-
mal kidney tissue from the same patient (Figure 3, A and B). The Notch transcriptional target hairy and enhancer of split 1 (HES1) was expressed in all 4 angiomyolipomas at levels higher than in normal kidney, suggesting that Notch signaling is active in angi-omyolipomas (Figure 3C). To directly test whether Notch signal-ing is activated, we tested additional sporadic angiomyolipomas by Western immunoblot using anti-Hes1 and an antibody to the carboxy terminus of Notch. Notch protein levels and activation of the Notch receptor, which was identified by examination of the 110-kDa band representing the γ-secretase cleavage product of Notch1, were enhanced in all 4 tumors compared with normal kidney from the same patient. Furthermore, the Hes1 protein level was higher in all 4 angiomyolipomas compared with that in normal kidney (Figure 4). These data indicate that Notch is active in angiomyolipomas.
TSC2 and Rheb regulate Notch signaling in an angiomyolipoma-derived cell line. Given this evidence that Notch is active in angiomyoli-poma tumors, we next investigated whether Notch activity is Rheb dependent, using the 621-101 cell line, which was derived from an angiomyolipoma and has inactivation of both alleles of the TSC2 gene (30). Using real-time RT-PCR, we monitored the levels of endogenous HES1 and hairy/enhancer-of-split related with YRPW motif 1 (HEY1) in cells treated for 72 hours with the γ-secretase inhibitor, N-[N-(3,5-Difluorophenacetyl-l-alanyl)]-S-phenylglycine t-butyl ester (DAPT), which prevents Notch cleav-age and activation. DAPT treatment decreased HES1 transcript level by 60% (Figure 5A), suggesting that these cells have Notch activity. Next, to determine whether this Notch activity is Rheb dependent, 621-101 cells were treated with Rheb siRNA. Deple-tion of Rheb significantly decreased HES1 and HEY1 transcript levels (Figure 5B). To further confirm that Rheb regulates HES1 and HEY1 levels, we reexpressed TSC2, which decreases the GTP-bound active form of Rheb via tuberin’s GTPase-activating pro-
Figure 2Genetic interaction of Rheb with other genes involved in sensory organ development. (A) Quantification of the twinning phenotype in scaGal4, UAS-Rab11 (Rab11); scaGal4, UAS-Rheb/Rab11 (Rheb/Rab11); sca-Gal4-UAS-Nuf (Nuf); scaGal4, UAS-Rheb/Nuf (Rheb/Nuf); scaGal4, UAS-Rheb/CyO (Rheb); scaGal4, UAS-l(2)gl3A [l(2)gl3A]; and sca-Gal4, UAS-Rheb/l(2)gl3A [Rheb/l(2)gl3A] flies (also see Supplemental Table 1). The bars indicate percentage of transformed ESOs. Data represent mean ± SEM. *P < 0.001. (B) Examples of the twinning phe-notype (arrows) in scaGal4, UAS-l(2)gl3A and scaGal4, UAS-Rheb/l(2)gl3A flies. Original magnification, ×100.
Figure 3Expression of NOTCH1, DLL1, and HES1 in angiomyolipoma tumors. The level of NOTCH1 (A), DLL1 (B), and HES1 (C) transcript was mea-sured by RT-PCR in 4 angiomyolipomas from a TSC patient, compared with normal kidney. Data represent mean ± SEM. *P < 0.05.

research article
TheJournalofClinicalInvestigation http://www.jci.org Volume 120 Number 1 January 2010 97
tein domain. Expression of TSC2 decreased endogenous HES1 and HEY1 transcript levels (Figure 5C), similarly to Rheb siRNA. To test directly whether Rheb regulates Notch activity, 621-101 cells were treated with control or Rheb siRNA, and the presence of cleaved Notch was examined by Western immunoblotting. Deple-tion of Rheb decreased the level of the 110-kDa cleaved Notch product detected with anti–C terminus Notch1 antibody in the whole cell lysate (Figure 5D, left) and anti-cleaved Notch1 Val 1744 antibody in the nuclear fraction (Figure 5D, right).
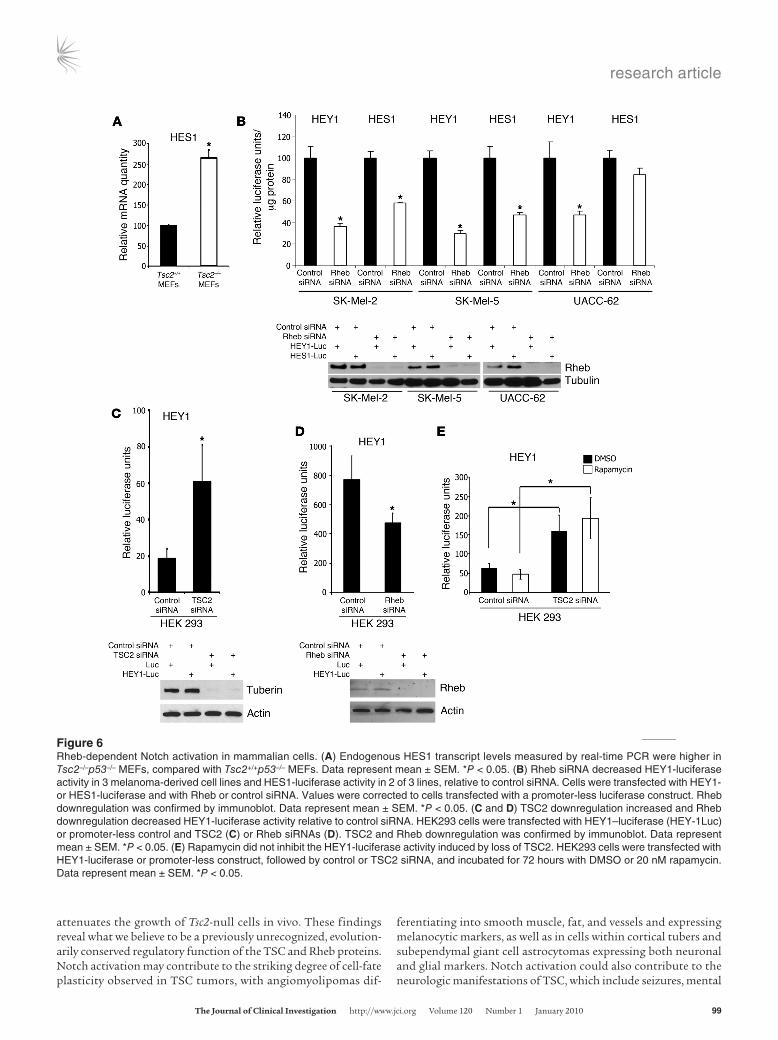
TSC2 and Rheb regulate Notch signaling in mammalian cells. To determine whether TSC and Rheb regulate Notch activity in cells that are not derived from TSC patients, we measured the endog-enous level of HES1 transcript in Tsc2-null mouse embryonic fibroblasts (MEFs). Consistent with our results from angiomyo-lipoma-derived cells, we found that Tsc2-null MEFs have higher levels of HES1 relative to littermate-derived control MEFs (Figure 6A). Next, we used HES1- and HEY1-luciferase reporter assays to monitor Notch activity in 3 melanoma-derived cell lines. Down-regulation of Rheb with siRNA decreased HEY1-luciferase activity in all 3 cell lines and decreased HES1-luciferase activity in 2 of the lines (Figure 6B). In HEK293 cells, downregulation of TSC2 resulted in a 3-fold increase in HEY1-luciferase activity (Figure 6C), and downregulation of Rheb resulted in a 40% decrease in HEY1-luciferase activity (Figure 6D).
Rheb-dependent Notch activation is insensitive to TORC1 inhibition. The most well-studied target of the TSC/Rheb pathway is TORC1. Interestingly, in HEK293 cells treated with TSC2 siRNA, the TORC1 inhibitor rapamycin did not block the increased HEY1 luciferase activity (Figure 6E). To further explore whether Rheb-dependent Notch activation is rapamycin sensitive, we monitored endogenous levels of cleaved Notch by Western immunoblot in 621-101 cells. Treatment with DAPT for 72 hours (as a positive control) decreased levels of the 110-kDa band representing cleaved Notch (Figure 7A), which was also confirmed with an antibody detecting specifically cleaved Notch1 at Val 1744 (data not shown). Treatment with rapamycin (20 nM) did not inhibit cleaved Notch (Figure 7A), consistent with the results using the luciferase assay in HEK293 cells. These data suggest that Rheb’s effects on Notch activity are TORC1 independent, with the caveat that it is increas-ingly recognized that TORC1 is not completely blocked by rapa-mycin. Therefore, we treated 621-101 cells with Torin 1, an ATP-competitive mTOR kinase inhibitor (31). Similarly to rapamycin, Torin 1 inhibited the phosphorylation of ribosomal protein S6 but did not inhibit Notch cleavage (Figure 7B), while as a control DAPT inhibited Notch cleavage but did not affect phosphory-
lation of S6. Finally, as a third approach to inhibit TORC1, we downregulated Raptor using siRNA. Similarly to rapamycin or Torin 1 treatment, downregulation of Raptor did not affect Notch cleavage but decreased phosphorylation of ribosomal protein S6 (Figure 6C). These results suggest that Rheb’s activation of Notch is TORC1 independent.
Inhibition of Notch signaling inhibits the growth of Tsc2-null xenograft tumors. To determine whether Notch activity contributes to the growth of Tsc2-null cells, we injected Tsc2-null ELT3 cells, which were derived from the Eker rat model of TSC (32), bilaterally into the flank region of SCID mice. When the tumors reached 250 mm3, the animals were treated with the γ-secretase inhibitor, DAPT. DAPT inhibited tumor growth by more than 50% relative to vehicle control (Figure 8A) and was associated with a significant decrease in Ki-67 positivity (Figure 8B). DAPT’s inhibition of Hes1 expression was confirmed by RT-PCR and immunoblot (Figure 8C). These results suggest that Notch activation drives prolifera-tion, thereby promoting growth of Tsc2-null tumors.
DiscussionTSC is a multisystem disease, in which many tumors and lesions, including cerebral cortical tubers, subependymal giant cell astro-cytomas, angiomyolipomas, and LAM, display unusual cell-fate determination patterns. While activation of Rheb and TORC1 is believed to drive the proliferative component of tumors carry-ing TSC1 or TSC2 mutations, little is known about the molecu-lar basis of these cell lineage abnormalities. To investigate the cell fate abnormalities in TSC, we used the Drosophila ESO as a model. The ESO develops over approximately 6 hours, during the pupal stage, through a series of 4 asymmetric cell divisions. We tested 3 different Tsc1 mutant alleles and found that all 3 disrupted cell fate assignments in the ESO, leading to a double bristle phenotype. The double bristle resulted from a cell-fate switch, in which the pIIb cell, which normally has low Notch activity and generates the internal cells, acquired the character-istics of the pIIa cell, which normally has high Notch activity and gives rise to the hair and socket cells. Similar double bristles were observed in flies overexpressing Rheb, further confirming the role of the TSC/Rheb signaling axis in ESO development. The impact of the TSC/Rheb pathway on cell fate appears to be lineage specific, since we did not observe any impact of Rheb expression in the wing. This result may explain why evidence of Rheb-induced Notch pathway activation was not observed in previous studies of the Drosophila eye (16) and could also be related to the cell-lineage specificity of TSC tumors.
Figure 4Evidence of Notch activation in angiomyolipomas. The level of cleaved Notch1 and Hes1 measured by Western blot in sporadic angiomyo-lipomas and normal kidney from 4 patients. Activated Notch1 was identified by examination of the 110-kDa band, which represents the γ-secretase cleavage product of Notch1 receptor.

research article
98 TheJournalofClinicalInvestigation http://www.jci.org Volume 120 Number 1 January 2010
Multiple lines of data indicate that the regulation of Notch activity by the TSC proteins and Rheb is evolutionarily conserved between flies and mammals. Evidence of Notch pathway activa-tion was present in angiomyolipoma tumor specimens. TSC2 and Rheb were found to regulate Notch cleavage and Notch target gene activation in an angiomyolipoma-derived cell line carrying bial-lelic TSC2 mutations. Evidence of Notch regulation by TSC2 and Rheb was also observed in melanoma-derived cell lines, MEFs, and HEK293 cells. Furthermore, inhibition of Notch signaling blocked the growth of Tsc2-null xenograft tumors, suggesting that this con-nection that we believe to be novel between TSC/Rheb and Notch activity may be related to the proliferative aspects of TSC lesions as well as their cell-fate abnormalities.
Treatment with the TORC1 inhibitor rapamycin, the TORC1 and TORC2 inhibitor Torin 1, or downregulation of Raptor, a key component of TORC1 (33), did not inhibit Notch activation in TSC2-deficient cells. This is consistent with the lack of a twinning phenotype in flies expressing the Rheb target, dTOR kinase, in the SOP lineage (data not shown). These data suggest that Rheb’s regulation of Notch activity occurs via a TORC1-independent mechanism. TORC1 is the most well-studied effector of Rheb, but there are other indications that Rheb has rapamycin-insensitive
targets (34–36). The identification of TORC1-insensitive pathways regulated by Rheb and TSC2 is particularly important clinically because TORC1 inhibitors have only partial clinical efficacy in patients with TSC and LAM. In the first completed trial, rapamy-cin as a single agent resulted in an approximately 50% regression of angiomyolipomas over 12 months of treatment, with nearly com-plete regrowth after discontinuation (37).
The Notch signaling pathway plays a central role in the regu-lation of neuronal progenitor cell differentiation (38, 39) and is required to maintain stem/progenitor cells in an undifferentiated status (40). Notch also impacts a broad range of cellular events during normal development and in tumors, including prolifera-tion and migration (41–43). We speculate that Notch signaling in TSC2-deficient progenitor cells may underlie some of the clinical manifestations of TSC, by altering the terminal differentiation of these cells with subsequent inappropriate differentiation and/or proliferation. If this is correct, then a “pulse” of Notch inhibition could promote the completion of differentiation and thereby block further proliferation.
In summary, we report here that activation of Rheb leads to abnormalities in asymmetric cell division in Drosophila SOP cells. In mammalian cells, Rheb activates Notch, and Notch inhibition
Figure 5Rheb-dependent Notch activation in a TSC2-null angiomyolipoma-derived cell line (621-101 cells). (A) Seventy-two hours of 10 μM DAPT treatment in 621-101 cells decreased endogenous HES1 and HEY1 transcripts measured by real-time PCR. Data represent mean ± SEM. *P < 0.05. (B) Downregulation of Rheb in 621-101 cells decreased endogenous HES1 and HEY1 transcripts measured by real-time PCR relative to control siRNA. TATA box–binding protein (TBP) transcript was used as a control for changes in global RNA abundance and was not affected by downregulation of Rheb. Data represent mean ± SEM. *P < 0.05. (C) Reexpression of tuberin in 621-101 cells decreased HES1 and HEY1 transcripts relative to vector control. GATA6 transcript was used as a control and was not affected by tuberin reexpression. Data represent mean ± SEM. *P < 0.05. (D) Downregulation of Rheb by siRNA decreased levels of the 110-kDa band, representing the γ-secretase cleaved, active form of the Notch1 receptor (lower arrow) in 621-101 cells (left panels) in the whole-cell lysate and decreased levels of cleaved Notch1 at Val 1744 (right panels) in the nucleus. Actin and Creb were used as loading controls.
research article
TheJournalofClinicalInvestigation http://www.jci.org Volume 120 Number 1 January 2010 99
attenuates the growth of Tsc2-null cells in vivo. These findings reveal what we believe to be a previously unrecognized, evolution-arily conserved regulatory function of the TSC and Rheb proteins. Notch activation may contribute to the striking degree of cell-fate plasticity observed in TSC tumors, with angiomyolipomas dif-
ferentiating into smooth muscle, fat, and vessels and expressing melanocytic markers, as well as in cells within cortical tubers and subependymal giant cell astrocytomas expressing both neuronal and glial markers. Notch activation could also contribute to the neurologic manifestations of TSC, which include seizures, mental
Figure 6Rheb-dependent Notch activation in mammalian cells. (A) Endogenous HES1 transcript levels measured by real-time PCR were higher in Tsc2–/–p53–/– MEFs, compared with Tsc2+/+p53–/– MEFs. Data represent mean ± SEM. *P < 0.05. (B) Rheb siRNA decreased HEY1-luciferase activity in 3 melanoma-derived cell lines and HES1-luciferase activity in 2 of 3 lines, relative to control siRNA. Cells were transfected with HEY1- or HES1-luciferase and with Rheb or control siRNA. Values were corrected to cells transfected with a promoter-less luciferase construct. Rheb downregulation was confirmed by immunoblot. Data represent mean ± SEM. *P < 0.05. (C and D) TSC2 downregulation increased and Rheb downregulation decreased HEY1-luciferase activity relative to control siRNA. HEK293 cells were transfected with HEY1–luciferase (HEY-1Luc) or promoter-less control and TSC2 (C) or Rheb siRNAs (D). TSC2 and Rheb downregulation was confirmed by immunoblot. Data represent mean ± SEM. *P < 0.05. (E) Rapamycin did not inhibit the HEY1-luciferase activity induced by loss of TSC2. HEK293 cells were transfected with HEY1-luciferase or promoter-less construct, followed by control or TSC2 siRNA, and incubated for 72 hours with DMSO or 20 nM rapamycin. Data represent mean ± SEM. *P < 0.05.

research article
100 TheJournalofClinicalInvestigation http://www.jci.org Volume 120 Number 1 January 2010
retardation, and autism. Finally, our work may highlight elements of the Notch signaling pathway (Notch, its ligands, and enzymes required for signaling activation) as potential therapeutic targets for TSC and LAM patients, for whom novel therapeutic concepts are urgently needed.
MethodsFly strains and statistics. To generate mosaic flies expressing mutant Tsc1 in the SOP cells, we used the flippase recognition target/flippase recombina-tion enzyme (FLP/FRT) system. Mutant clones were identified using the
MARCM system (44), which generates GFP-labeled cell clones with homo-zygous mutations. Yellow white (yw), ubx-FLP; scabrous-Gal4 (scaGal4), UAS-Pon-GFP, UAS-tau-GFP; FRT82B tubulin-Gal 80 females were crossed to yw; FRT82BTsc1Q87X/TM3Sb– or to yw; FRT82BTsc1W243X/TM3Sb– and to yw; FRT82BTsc1R453X/TM3Sb– males (provided by I. Hariharan, Univer-sity of California, Berkeley, California, USA).
To generate flies with transient expression of Rheb, we used the Gal4-UAS system (21). yw; scaGal4/curly of oyster (yw; scaGal4/CyO) females were crossed to w; UAS Rheb males (provided by F. Tamanoi, University of California, Los Angeles, California, USA).
Figure 7Notch cleavage is insensitive to TORC1 inhibition in patient-derived cells. (A) Levels of the 110-kDa band representing the γ-secretase cleaved, active form of the Notch receptor, were decreased following treatment with the γ-secretase inhibitor DAPT as expected, while in rapamycin and DMSO treated cells, the 110-kDa band was present. Rapamycin inhibited the phosphorylation of ribosomal protein S6 as expected. (B) Treat-ment with the Tor kinase inhibitor Torin 1 did not inhibit Notch cleavage in 621-101 cells but did inhibit the phosphorylation of ribosomal protein S6. DAPT did inhibit the 110-kDa cleaved Notch band as expected. (C) Raptor downregulation did not inhibit Notch cleavage but did inhibit the phosphorylation of ribosomal protein S6. Actin and Creb were used as loading controls.
Figure 8DAPT suppresses growth, proliferation, and Notch pathway activation in Tsc2-null xenograft tumors. (A) Growth of Tsc2-null ELT3 cell xenograft tumors in mice treated with DAPT (10 mg/kg/d) or placebo control. Data represent tumor volume (mm3) (mean ± SEM of DAPT-treated (n = 4) or placebo-treated (n = 3) mice. *P < 0.05. (B) Ki-67 staining of pla-cebo- (left panel) and DAPT-treated (right panel) xenograft tumors (original magnifi-cation, ×100) and quantification of results. DAPT treatment reduced the proliferation index. Data represent mean ± SEM. *P < 0.05. (C) DAPT treatment of Tsc2-null tumors decreased endogenous Hes1 transcript level, measured by real-time PCR (mean ± SEM; *P < 0.05), and the level of Hes1 protein (arrow, upper band), measured by immunoblot.

research article
TheJournalofClinicalInvestigation http://www.jci.org Volume 120 Number 1 January 2010 101
To monitor the dynamics of SOP lineage division and spindle orienta-tion the scaGal4 promoter was used to drive UAS-Pon-GFP and tau-GFP expression in Rheb transgenic flies. Female scaGal4, Pon-GFP, tau-GFP/CyO flies (22, 23) were crossed to yw/w; scaGal4, UAS Rheb/CyO males.
To test for enhancement of the twinning phenotype in Rheb flies, we crossed females of either yw; scaGal4 or yw/w; scaGal4, UAS Rheb/CyO to either males UAS-l(2)gl3A (provided by J. Knoblich, Institute of Molecular Biotechnology of the Austrian Academy of Sciences, Vienna, Austria) or UAS-Rab11-YFP (stock no. 9790) or UAS-EP3324 (Nuf) (both from Bloom-ington Drosophila Stock Center).
To statistically analyze the fly crosses for synergism, the sum of the means of twinning in Rheb-expressing and l(2)gl3A-expressing flies was compared with the mean of twinning in flies with Rheb and l(2)gl3A coex-pression. The chance that the observed results represented synergy rather than additivity was calculated using the normal approximation to the dis-tributions of the 3 means values.
Time-lapse microscopy and image quantification. For time-lapse microscopy, Drosophila pupae were dissected and imaged as previously described (33). For overnight movies, z stacks were acquired at 10-minute intervals using the vertical section scan mode on a Bio-Rad 1024 confocal microscope. Imaging was conducted over a large area; therefore, individual clusters are pixilated. For imaging of fixed samples, z stacks were acquired by using Nikon eclipse C1 confocal microscope.
RNA extraction and real-time RT-PCR. Total RNA was isolated using the RNeasy kit (Qiagen) according to manufacturer’s instructions. RNA was quantified using the Agilent 2100 BioAnalyzer in combination with a RNA 6000 Nano LabChip. RNA was reverse-transcribed using Moloney murine leukemia virus RT (Ambion) and a mixture of anchored oligo(dT) and random decamers. For each sample, 2 RT reactions were performed with inputs of 50 and 10 ng. Using TaqMan chemistry, 5′-nuclease assays were run on a 7900HT Sequence Detection System (Applied Biosystems). Ct values were converted to quantities (in arbitrary units) using a standard curve (5 points; 5-fold dilutions) established with a calibrator sample. For each sample, the 2 values of relative quantity were averaged.
Antibodies. The following antibodies were used: rat anti-ELAV (1:300, 7E8A10; Developmental Studies Hybridoma Bank), rat anti-Su(H) (provid-ed by F. Schweisguth, École Normale Supérieure, Paris, France), anti-mouse Alexa Fluor 555 (Invitrogen), mouse anti-tubulin and mouse anti-actin (Sigma-Aldrich), and rabbit anti-Raptor, rabbit anti–phospho-S235/236 S6 ribosomal protein, anti-cleaved Notch1 Val 1744 (lot no. 5; Cell Sig-naling Technology), rabbit anti-Notch C terminus and rabbit anti-tuberin (Santa Cruz Biotechnology Inc.), rabbit anti-Rheb and rabbit anti-HES1 (Abcam), and rabbit anti-Ki67 (Vector Laboratories Inc.).
siRNA and luciferase assays. For siRNA downregulation, cells were transfect-ed with 100 nM Rheb, TSC2, or Raptor SMARTpool siRNA, or nonspecific control siRNA (all from Dharmacon) using Mirus Trans-IT TKO Transfec-tion reagent (Mirus). For luciferase assays, HEK293 cells were first trans-fected with the indicated siRNA and then, 24 hours later, with pHEY1-lucif-erase DNA or promoter-less luciferase control. Melanoma-derived cells were
transfected with pHEY1-luciferase or pHES1-luciferase DNA or promoter-less luciferase control simultaneously with siRNA. Both, pHEY1-luciferase and pHES1-luciferase DNA constructs were provided by M. Gessler (Univer-sity of Wuerzburg, Wuerzburg, Germany). Luciferase levels were measured after addition of luciferase substrate, and the difference of relative luciferase units after correction to background (luciferase control) was calculated.
Nuclear fractionation. The preparation of nuclear extracts was performed using CelLytic NuCLEAR Extraction Kit (Sigma-Aldrich). Briefly, cells were allow swell with hypotonic buffer, then were disrupted using syringe and needle. The cytoplasmic fraction was removed, and nuclear proteins were released from the nuclei by a high salt buffer.
DAPT, rapamycin, and Torin 1 treatment. Cells were treated for indicated times with 10 μM DAPT (Calbiochem), 20 nM rapamycin (Biomol), or 250 nM Torin 1 (provided by D. Sabatini, Whitehead Institute for Biomedical Research, Cambridge, Massachusetts, USA and N. Gray, Dana Farber Can-cer Institute, Boston, Massachusetts, USA).
Induction of subcutaneous tumors in nude mice. ELT3 cells were inoculated bilaterally into the posterior back region of 6-week-old immunodeficient C.B17 SCID female mice. Tumor length, width, and depth were monitored with a Vernier caliper. When tumors reached 250 mm3, mice were randomly assigned to intraperitoneal DAPT (Calbiochem) at a dose of 10 mg/kg/d for 3 consecutive days, followed by 4 days without treatment (45) or vehicle control. The Fox Chase Cancer Center Institutional Animal Care and Use Committee approved this protocol.
Statistics. Both 2-tailed and 1-tailed Student’s t tests were used for all statisti-cal analysis. P values of less than 0.05 were considered statistically significant.
AcknowledgmentsWe thank Sandy Jablonski and the Fox Chase Cancer Center Con-focal Microscopy Facility for assistance with imaging; I. Hariharan, J. Knoblich, F. Schweisguth, and F. Tamanoi for fly stocks and reagents; M. Gessler for the HEY1-luciferase constructs; David Saba-tini and Nathanial Gray for Torin 1; and E. Golemis and J. Chernoff for their critical review of the manuscript. This work was supported by a postdoctoral fellowship to M. Karbowniczek from The LAM Foundation (Cincinnati, Ohio, USA), the Tuberous Sclerosis Alliance (Silver Spring, Maryland, USA), NIH RO1 DK51052 and HL81147 (to E.P. Henske), and NIH RO1 NS059971 (to F. Roegiers).
Received for publication September 8, 2009, and accepted in revised form October 21, 2009.
Address correspondence to: Elizabeth Petri Henske, Brigham and Women’s Hospital, One Blackfan Circle, Karp 6, Boston, Massa-chusetts 02115, USA. Phone: (617) 355-9049; Fax: (617) 355-9016; E-mail: [email protected]. Or to: Fabrice Roegiers, Fox Chase Cancer Center, 333 Cottman Ave., Philadelphia, Pennsylvania 19111, USA. Phone: (215) 728-5518; Fax: (215) 214-2412; E-mail: [email protected].
1. Crino PB, Henske EP. New developments in the neurobiology of the tuberous sclerosis complex. Neurology. 1999;53(7):1384–1390.
2. Plank TL, Yeung RS, Henske EP. Hamartin, the prod-uct of the tuberous sclerosis 1 (TSC1) gene, interacts with tuberin and appears to be localized to cytoplas-mic vesicles. Cancer Res. 1998;58(21):4766–4770.
3. Tee AR, Manning BD, Roux PP, Cantley LC, Ble-nis J. Tuberous sclerosis complex gene products, Tuberin and Hamartin, control mTOR signaling by acting as a GTPase-activating protein complex toward Rheb. Curr Biol. 2003;13(15):1259–1268.
4. Inoki K, Li Y, Xu T, Guan KL. Rheb GTPase is a direct
target of TSC2 GAP activity and regulates mTOR signaling. Genes Dev. 2003;17(15):1829–1834.
5. Garami A, et al. Insulin activation of Rheb, a media-tor of mTOR/S6K/4E-BP signaling, is inhibited by TSC1 and 2. Mol Cell. 2003;11(6):1457–1466.
6. Castro AF, Rebhun JF, Clark GJ, Quilliam LA. Rheb binds tuberous sclerosis complex 2 (TSC2) and promotes S6 kinase activation in a rapamycin- and farnesylation-dependent manner. J Biol Chem. 2003;278(35):32493–32496.
7. Sarbassov DD, Ali SM, Sabatini DM. Growing roles for the mTOR pathway. Curr Opin Cell Biol. 2005; 17(6):596–603.
8. Ito N, Rubin GM. gigas, a Drosophila homolog of tuberous sclerosis gene product-2, regulates the cell cycle. Cell. 1999;96(4):529–539.
9. Tapon N, Ito N, Dickson BJ, Treisman JE, Hari-haran IK. The Drosophila tuberous sclerosis com-plex gene homologs restrict cell growth and cell proliferation. Cell. 2001;105(3):345–355.
10. Potter CJ, Huang H, Xu T. Drosophila Tsc1 func-tions with Tsc2 to antagonize insulin signaling in regulating cell growth, cell proliferation, and organ size. Cell. 2001;105(3):357–368.
11. Gao X, Pan D. TSC1 and TSC2 tumor suppressors antagonize insulin signaling in cell growth. Genes

research article
102 TheJournalofClinicalInvestigation http://www.jci.org Volume 120 Number 1 January 2010
Dev. 2001;15(11):1383–1392. 12. Radimerski T, Montagne J, Hemmings-Mieszczak
M, Thomas G. Lethality of Drosophila lacking TSC tumor suppressor function rescued by reducing dS6K signaling. Genes Dev. 2002;16(20):2627–2632.
13. Zhang Y, Gao X, Saucedo LJ, Ru B, Edgar BA, Pan D. Rheb is a direct target of the tuberous sclerosis tumour suppressor proteins. Nat Cell Biol. 2003; 5(6):578–581.
14. Saucedo LJ, Gao X, Chiarelli DA, Li L, Pan D, Edgar BA. Rheb promotes cell growth as a component of the insulin/TOR signalling network. Nat Cell Biol. 2003;5(6):566–571.
15. Stocker H, et al. Rheb is an essential regulator of S6K in controlling cell growth in Drosophila. Nat Cell Biol. 2003;5(6):559–565.
16. Bateman JM, McNeill H. Temporal control of dif-ferentiation by the insulin receptor/tor pathway in Drosophila. Cell. 2004;119(1):87–96.
17. Roske B, Stoltenburg G, Baier PM, Konig R, Schlote W. Tuberous sclerosis complex with disseminated telencephalic distribution of atypical cells and their relation to corticogenesis. Clin Neuropathol. 2003;22(3):119–128.
18. Jozwiak J, Jozwiak S, Skopinski P. Immuno-histochemical and microscopic studies on giant cells in tuberous sclerosis. Histol Histopathol. 2005; 20(4):1321–1326.
19. Crino PB, Nathanson KL, Henske EP. The tuberous sclerosis complex. N Engl J Med. 2006; 355(13):1345–1356.
20. Karbowniczek M, Yu J, Henske EP. Renal angio-myolipomas from patients with sporadic lymph-angiomyomatosis contain both neoplastic and non-neoplastic vascular structures. Am J Pathol. 2003;162(2):491–500.
21. Brand AH, Perrimon N. Targeted gene expres-sion as a means of altering cell fates and gener-ating dominant phenotypes. Development. 1993; 118(2):401–415.
22. Roegiers F, Younger-Shepherd S, Jan LY, Jan YN.
Bazooka is required for localization of determi-nants and controlling proliferation in the sensory organ precursor cell lineage in Drosophila. Proc Natl Acad Sci U S A. 2001;98(25):14469–14474.
23. Roegiers F, Younger-Shepherd S, Jan LY, Jan YN. Two types of asymmetric divisions in the Dro-sophila sensory organ precursor cell lineage. Nat Cell Biol. 2001;3(1):58–67.
24. Bellaiche Y, Gho M, Kaltschmidt JA, Brand AH, Schweisguth F. Frizzled regulates localization of cell-fate determinants and mitotic spindle rota-tion during asymmetric cell division. Nat Cell Biol. 2001;3(1):50–57.
25. Gho M, Bellaiche Y, Schweisguth F. Revisiting the Drosophila microchaete lineage: a novel intrinsi-cally asymmetric cell division generates a glial cell. Development. 1999;126(16):3573–3584.
26. Schweisguth F. [Cell polarity and asymmetric divi-sion in the peripheral nervous system of Drosoph-ila]. J Soc Biol. 2003;197(1):17–22.
27. Roegiers F, Jan YN. Asymmetric cell division. Curr Opin Cell Biol. 2004;16(2):195–205.
28. Emery G, et al. Asymmetric Rab 11 endosomes regu-late delta recycling and specify cell fate in the Dro-sophila nervous system. Cell. 2005;122(5):763–773.
29. Betschinger J, Mechtler K, Knoblich JA. The Par complex directs asymmetric cell division by phos-phorylating the cytoskeletal protein Lgl. Nature. 2003;422(6929):326–330.
30. Yu J, Astrinidis A, Howard S, Henske EP. Estradiol and tamoxifen stimulate LAM-associated angio-myolipoma cell growth and activate both genomic and nongenomic signaling pathways. Am J Physiol Lung Cell Mol Physiol. 2004;286(4):L694–L700.
31. Thoreen CC, et al. An ATP-competitive mTOR inhibitor reveals rapamycin-insensitive functions of mTORC1. J Biol Chem. 2009;284(12):8023–8032.
32. Howe SR, Everitt JL, Gottardis MM, Walker C. Rodent model of reproductive tract leiomyomata: characterization and use in preclinical therapeutic studies. Prog Clin Biol Res. 1997;396:205–215.
33. Kim DH, et al. mTOR interacts with raptor to form a nutrient-sensitive complex that signals to the cell growth machinery. Cell. 2002;110(2):163–175.
34. Karbowniczek M, et al. Regulation of B-Raf kinase activity by tuberin and Rheb is mammalian target of rapamycin (mTOR)-independent. J Biol Chem. 2004;279(29):29930–29937.
35. Karbowniczek M, Robertson GP, Henske EP. Rheb inhibits C-raf activity and B-raf/C-raf heterodimer-ization. J Biol Chem. 2006;281(35):25447–25456.
36. Saito K, Araki Y, Kontani K, Nishina H, Katada T. Novel role of the small GTPase Rheb: its implica-tion in endocytic pathway independent of the activation of mammalian target of rapamycin. J Biochem. 2005;137(3):423–430.
37. Bissler JJ, et al. Sirolimus for angiomyolipoma in tuberous sclerosis complex or lymphangioleiomyo-matosis. N Engl J Med. 2008;358(2):140–151.
38. Morrison SJ, et al. Transient Notch activation initiates an irreversible switch from neurogen-esis to gliogenesis by neural crest stem cells. Cell. 2000;101(5):499–510.
39. Artavanis-Tsakonas S, Rand MD, Lake RJ. Notch signaling: cell fate control and signal integration in development. Science. 1999;284(5415):770–776.
40. Bao ZZ, Cepko CL. The expression and function of Notch pathway genes in the developing rat eye. J Neurosci. 1997;17(4):1425–1434.
41. Weinmaster G, Kopan R. A garden of Notch-ly delights. Development. 2006;133(17):3277–3282.
42. Leong KG, Gao WQ. The Notch pathway in pros-tate development and cancer. Differentiation. 2008; 76(6):699–716.
43. Kerbel RS. Tumor angiogenesis. N Engl J Med. 2008;358(19):2039–2049.
44. Lee T, Luo L. Mosaic analysis with a repressible cell marker for studies of gene function in neuronal morphogenesis. Neuron. 1999;22(3):451–461.
45. Sjolund J, et al. Suppression of renal cell carcinoma growth by inhibition of Notch signaling in vitro and in vivo. J Clin Invest. 2008;118(1):217–228.