Embed Size (px)
Citation preview
Regulatory Spillovers in Common Audit Markets*
Raphael Duguay
Booth School of Business, University of Chicago
Michael Minnis
Booth School of Business, University of Chicago
Andrew Sutherland
MIT Sloan School of Management
March 2019
* We appreciate helpful comments from Mark Bagnoli, John Barrios, Phil Berger, John Core, Jacquelyn Gillette, Joao
Granja, Michelle Hanlon, S.P. Kothari, Christian Leuz, Nathan Marshall (discussant), Karen Nelson (discussant),
Canice Prendergast, Sugata Roychowdhury, Doug Skinner, Nemit Shroff, Suraj Srinivasan (Editor), Chad Syverson,
Joe Weber, Mike Willenborg, Jerry Zimmerman, two anonymous reviewers; faculty at Boston College, Chicago, Car-
negie Mellon, CUHK, Columbia, HKUST, Kansas, MIT, Northwestern, Purdue, Temple, Toronto, UT Dallas; and
conference attendees at FARS, Notre Dame’s Fall Research Conference, and Washington University’s Accounting
Conference. We are grateful to the Risk Management Association for providing data for this project, and both the
Initiative on Global Markets and the Rustandy Center for Social Innovation at the University of Chicago Booth School
of Business for providing funding. Duguay gratefully acknowledges financial support by the Deloitte Foundation and
the Social Sciences and Humanities Research Council of Canada. Minnis acknowledges financial support from the
Booth School of Business. Sutherland acknowledges financial support from MIT. Any errors or omissions are our
own.
Electronic copy available at: https://ssrn.com/abstract=3020316
"Regulatory Spillovers in Common Audit Markets." Duguay, Raphael, Michael Minnis, and Andrew Sutherland. Management Science Vol. 66, No. 8 (2020): 3389-3411. DOI: 10.1287/mnsc.2019.3352

1
Regulatory Spillovers in Common Audit Markets
Abstract
We find that Sarbanes-Oxley (SOX) had two significant effects on the audit market for nonpublic entities.
The first short-run effect stems from inelastic labor supply coupled with an audit demand shock from public
companies. As a result, private companies reduced their use of attested financial reports in bank financing
by 12%, and audit fee increases for nonprofit organizations (NPOs) more than doubled. The second long-
run effect was a transformation in the audit supply structure. After SOX, NPOs were less likely to match
with auditors most exposed to public companies, while auditors increasingly specialized their offices based
on client type. Audit market concentration for NPOs dropped by more than half within five years of SOX
and remained at this level through the end of our sample in 2013, while the number of suppliers increased
by 26%. Our results demonstrate how regulation directed at public companies generates economically im-
portant spillovers for nonpublic entities.
Keywords: Sarbanes-Oxley, securities regulation, auditing, market structure, accounting, private firms,
non-profits, labor economics.
JEL Codes: H83, M12, M21, M41, M48, M49
Electronic copy available at: https://ssrn.com/abstract=3020316

1
1. Introduction
The market for financial statement attestation services has attracted considerable attention from ac-
ademics, regulators, and practitioners, especially following the passage of the Sarbanes-Oxley Act in 2002
(SOX). Congress directed SOX at improving the audit quality of publicly held companies through enhanced
oversight of auditors and additional testing of companies’ financial reporting processes. As such, almost all
of the discussion and analysis related to the effects of SOX focuses on public companies. Yet many other
organizations—including private companies, nonprofits, and governmental entities—also purchase services
from public accounting firms for managerial and external financing purposes.1 If public regulation affects
unregulated entities, then analyses focusing exclusively on regulated companies do not measure the full effect
of the regulation. In this paper, we study the passage of SOX to examine how and why regulatory shocks to
the public company audit market affect nonpublic entities.
SOX changed the public audit market in two primary ways. First, Section 404 of SOX required public
company auditors to provide assurance on their clients’ internal controls (IC). This created a substantial de-
mand shock for accounting services because public companies needed accounting labor to document and test
their internal controls, and auditors had to exert additional effort to attest to the effectiveness of those controls
(Iliev 2010; Ge, Koester, and McVay 2017). Second, Title I of SOX altered the structure of the public audit
market by establishing an audit regulator—the Public Company Accounting Oversight Board (PCAOB)—
with two mandates: (1) to register and periodically inspect accounting firms conducting public company
audits; and, (2) to establish auditing standards specifically for public companies, thus distinguishing public
company and nonpublic entity audits.
Whether the audit market changes induced by SOX have spillover effects for nonpublic entities is
1 Examples of papers investigating the effects of SOX on public companies include Engel, Hayes, and Wang (2007);
Leuz (2007); Zhang (2007); Ashbaugh-Skaife, Collins, Kinney, and LaFond (2008); Cohen, Dey, and Lys (2008); Pi-
otroski and Srinivasan (2008); Brochet (2010); DeFond and Lennox (2011); Ettredge, Sherwood, and Sun (2017); Al-
buquerque and Zhu (2018). For examples of papers investigating financial reporting in private companies and nonprof-
its, see Blackwell, Noland, and Winters (1998); Core, Guay, and Verdi (2006); Allee and Yohn (2009); Kitching (2009);
Minnis (2011); Petrovits, Shakespeare, and Shih (2011); Yetman and Yetman (2013); DeFond and Zhang (2014); Cas-
sar, Ittner, and Cavalluzzo (2015); Harris, Petrovits, and Yetman (2015); Badertscher, Kim, Kinney, and Owens (2017);
Lisowsky and Minnis (2018); Lisowsky, Minnis, and Sutherland (2017).
Electronic copy available at: https://ssrn.com/abstract=3020316
2
not clear a priori. On one hand, if public and nonpublic entities purchase attestation services from a common
pool of suppliers—i.e., there is a “common market” for accountants’ services—then the audit market changes
induced by SOX could have both short- and long-run effects on nonpublic entities. In the short-run, the public
company demand shock for accounting services caused by the IC attestation requirements of SOX Section
404 could have increased prices and reduced quantities of attestation services purchased by nonpublic clients
if the labor supply was sufficiently constrained and inelastic. In addition, Title I of SOX created the PCAOB
with its focus on public companies. This new and distinct regulatory regime between public and nonpublic
entities could have split a previously common market into distinct markets for each entity type. This suggests
that SOX could have longer-run implications for nonpublic entities if auditors chose to specialize as a result
of the distinct auditing regulations.
On the other hand, multiple features of the audit market could limit spillovers from regulation onto
nonpublic entities. First, researchers argue that auditors specialize by client size, ownership, and location
(e.g., Doogar and Easley 1998; Ferguson, Pinnuck, and Skinner 2017). If this specialization reduces the sub-
stitutability of labor across public and nonpublic clients, then the scope for spillovers from the creation of the
PCAOB (Title I) or the internal control attestation requirements (Section 404) is limited. Moreover, firms
can respond to the changes induced by SOX in a number of ways. For example, audit firms could address the
demand shock by outsourcing, investing in technology, or hiring foreign workers or retired accountants. In
addition, while the creation of the PCAOB may have segmented the attestation markets for public and non-
public clients, such segmentation could have increased audit supply for nonpublic clients. For example, De-
Fond and Lennox (2011) find that many auditors exited the public company audit market following SOX and
these auditors may have shifted their capacity to the nonpublic market.
Because prior research typically focuses on public companies, the extent to which the collective
provisions of SOX affected nonpublic entities is an open question. Moreover, understanding whether and
how public market regulatory shocks affect unregulated entities is important for several reasons. First, like
public companies, nonpublic entities engage independent accountants to attest to the company’s financial
statements to access financing, contract with external parties, improve information quality, and constrain
Electronic copy available at: https://ssrn.com/abstract=3020316
3
agency problems.2 Therefore, regulation directed at public companies can impose unintended harm on un-
regulated entities if it increases the cost of financial statement attestation services. Second, while there has
been continued debate surrounding the overall effects of SOX and securities regulation generally (e.g., Leuz
2007, Coates and Srinivasan 2014, Leuz and Wysocki 2016), the discussion primarily focuses on public
companies. However, the extent to which—and why—unregulated entities are affected by securities regula-
tion is important to the debate, especially if the effects are large and persistent.
To investigate the spillover effects of SOX, we examine two types of nonpublic entities: private
companies and nonprofit organizations (NPOs), including universities, hospital systems, and charities. To-
gether, these entities control over $14 trillion in assets, and financial statement attestation is an important
contracting and monitoring mechanism in the oversight of the majority of these assets.3 The settings comple-
ment one another in the nature of financial reporting demand and data availability, which facilitates the gen-
eralization of our findings. Private companies do not face an attestation mandate, and we can observe changes
in their quantity (but not price) of attested financial statements. By contrast, NPOs spending federal grants
face mandatory audit requirements and disclose their external accounting fees and auditor identity, allowing
us to observe changes in price and auditor.4 We use these settings to examine first the short-run quantity and
price responses to SOX, and then the longer run changes and segmentation in audit supply.
We acquire private company data from the Risk Management Association (RMA), which reports the
2 Unlike public companies, nonpublic entities are not required to hire an independent accountant to perform an exami-
nation of their financial statements. Moreover, instead of being limited to an audit, nonpublic entities have a menu of
services that accountants can provide, including “compilations” (providing no assurance that the statements are materi-
ally correct), “reviews” (which provide negative assurance), and “audits” (which provide positive—i.e., most inten-
sive—assurance that the financial statements are not materially misstated). All of these services are collectively referred
to as “attestation services.” We provide additional definitions in Appendix A. For discussions and analyses of the use
of the different types of attested financial statements in U.S. private companies, see for example: Botosan et al. (2006);
Allee and Yohn (2009); Bradshaw et al. (2014); Berger et al. (2017); Lisowsky et al. (2017). 3 Lisowsky and Minnis (2018) examine a comprehensive panel dataset of private U.S. companies and find over $9
trillion in assets in 2010 (excluding real estate and financial entities)—approximately $6 trillion of which is controlled
by companies with audited GAAP financial statements. Nonprofits controlled over $5 trillion in assets in 2013 (Urban
Institute 2015) and a large share of NPOs obtain financial statement audits either voluntarily or to comply with regula-
tion. 4 Following prior work, we study the line item on the Form 990 where NPOs report the fees for external accounting and
audit services (Pearson, Brooks, and Neidermeyer 1998; Tate 2007; Webb and Waymire 2016). For parsimony, we refer
to this line item as “accounting fees”, “audit fees”, and “audit prices” interchangeably throughout the paper.
Electronic copy available at: https://ssrn.com/abstract=3020316

4
propensity of private companies to provide banks with attested financial statements (i.e., unqualified audits,
reviews, and compilations). We find that private companies significantly reduced their use of CPA attestation
upon the implementation of Section 404 of SOX (i.e., years 2004 to 2009). For example, the propensity for
private companies to report attested financial statements dropped by 6.3 percentage points, or approximately
12% of the pre-SOX sample attestation rate between 2003 and 2005. The reduction is particularly acute in
reviews and compilations, which recent evidence suggests are useful forms of attestation for smaller compa-
nies (e.g., Badertscher et al. 2017). Instead, these borrowers were more likely to provide either tax returns or
company-prepared financial statements. Thus these initial results suggest that public company audit regula-
tion reduced the proportion of private companies accessing higher quality financial reporting, which has been
shown to be important for private company access to capital.
To examine the effects on nonprofit entities, we then construct a panel dataset of NPOs, including
auditor names and accounting fees using public filings of NPOs spending over $500,000 of federal grant
money. Our specification exploits the fact that Section 404 of SOX affected auditors differently (Iliev 2010,
Albuquerque and Zhu 2018). Some auditors became involved with IC attestation of public companies imme-
diately upon the effective date of Section 404, while other auditors did not engage with IC attestation until
one or more years after the effective date (e.g., because their clients were sufficiently small to avoid IC
attestation), and still other auditors never had public clients with mandated IC attestation. To estimate the
effects of SOX, we employ a generalized difference-in-differences design comparing treated NPOs engaging
auditors providing Section 404 attestations to a control set of NPOs engaging auditors which do not provide
Section 404 attestations. Not only does this research design exploit auditors’ heterogeneous and staggered
involvement with IC attestations, it also includes state-year, operating activity-year, and NPO-auditor pair
fixed effects, reducing concerns that our findings reflect regional or nonprofit segment-specific shocks to the
audit market, auditor-client matching, or time-invariant NPO characteristics, respectively. If accounting labor
supply is sufficiently inelastic and talent is substitutable across client types, NPO clients with audit firms
most affected by the Section 404 demand shock should in turn be most affected.
We first confirm that prior to the passage of Section 404, audit fees for both the treated and control
Electronic copy available at: https://ssrn.com/abstract=3020316

5
NPOs move in parallel. We then find the pattern changes. Once an auditor begins issuing IC attestations for
its public company clients, its nonprofit clients face an incremental fee increase of 5.4%—twice the fee in-
crease of nonprofit clients of auditors who do not produce IC attestations. We then show that the likelihood
of NPOs switching auditors also more than doubles in the year an NPO’s auditor begins performing IC at-
testations for public companies. Our results are not limited to clients of Big 4 auditors, do not depend on
whether we define auditor IC involvement at the firm or office level, and remain after matching treated and
control observations on observable characteristics.
From this set of results, we infer that a public company demand shock coupled with inelastic ac-
counting labor supply caused negative spillover effects for private companies and NPOs.5 The fixed effect
structure we use and the fact that the pre-treatment parallel trend assumption holds for both the private com-
pany and NPO analyses make it unlikely that time-invariant characteristics or sample composition issues are
driving these results. However, a time-varying attestation demand shock from nonpublic entities or unspeci-
fied sectoral trends would threaten this inference. For example, if the NPOs engaging the auditors who began
providing IC attestations post-SOX Section 404 (i.e., the treated observations) simultaneously demanded
additional audit procedures that other NPOs did not simultaneously demand (Iyer and Watkins 2008), this
would result in differential price increases like the ones documented in our results.
To mitigate this concern, we conduct cross-sectional tests based on differences in labor elasticity
plausibly exogenous to audit demand. Because of the preponderance of entities with December fiscal year-
ends in the U.S. economy, accounting labor capacity is seasonal resulting in a “busy season” for auditors
immediately following December (Hay, Knechel, and Wong 2006; Lopez and Peters 2011). Importantly,
despite this difference in accounting labor capacity, the attestation service they purchase is the same. There-
fore, we argue that an entity’s fiscal year-end is related to audit labor inelasticity, but is not related to any
change in attestation demand. In the quantity (price) response analyses for private companies (NPOs), we
find that while the effects are still positive for non-December fiscal year-end entities, they are significantly
5 In the supplemental appendix to this paper, we discuss the evidence of both the demand shock and labor supply in
more detail.
Electronic copy available at: https://ssrn.com/abstract=3020316
6
stronger for entities with December year-ends. Moreover, consistent with accounting labor entering the mar-
ket in the years following the enactment of SOX Section 404 (i.e., a reduction in labor inelasticity), the
difference in treatment effect between December and non-December entities diminishes over time. Thus,
alternative explanations, such as time-varying demand shocks, have to describe not only why December year-
end entities experience a stronger initial demand shock coinciding precisely with Section 404, but also why
that demand shock dissipates over time vis-à-vis non-December entities. We conclude that the evidence is
consistent with a public company demand shock coupled with labor inelasticity causing short-run spillovers.
We then investigate whether SOX had longer run effects caused by separating the audit markets. One
view suggests that if a public company demand shock coupled with labor inelasticity caused the results doc-
umented above, then the pre-SOX equilibrium will simply return as more accounting labor enters the market.
Under an alternative view, the creation of the PCAOB with its separate auditing standards and auditor mon-
itoring features established under Title I of SOX created differential costs required to service public and
nonpublic clients. This could cause auditors to further specialize between public and nonpublic clients to
manage these differential costs. Moreover, because the IC testing newly required by Section 404 can be
conducted throughout the fiscal year (rather than concentrated right after the fiscal year-end), public company
audit labor can be spread more evenly throughout a given year. This makes NPO audit engagements, typically
conducted during off-peak months, less appealing for public company auditors. Collectively, SOX could
have sufficiently shifted the features of the audit market to make specialization by client type more appealing,
thus separating attestation supply for public and nonpublic entities.
We test for market separation two ways. First, we assess whether NPOs were significantly less likely
to have an auditor that focuses on public companies following SOX, which we refer to as “across-firm”
separation. To test this, we first model the likelihood that an NPO engages an auditor that specializes in
public companies in the year 2000 (the first year of our sample). We then use the model’s parameters to
predict the likelihood that NPOs match to public company auditors in each subsequent year. In the years prior
to SOX, the model’s aggregate predictions are not significantly different from the actual matches, however
the predictions significantly worsen after 2004. Specifically, far fewer NPOs actually match with public
Electronic copy available at: https://ssrn.com/abstract=3020316
7
company auditors compared to the model’s predictions. The poor performance of the predictive model con-
tinues to the end of our sample in 2013, far beyond when we expect any labor constraints to have subsided.
The decline in the actual market share of public company auditors is economically significant: in 2013 the
model predicts a market share of 16.4% but the actual NPO market share for public company auditors is only
6.1%. We conduct several robustness tests mitigating concerns that these results are solely a function of
switching costs, sample composition changes, or auditors exiting the public company market. Our results
suggest that auditors more intensively specialize by client type after SOX was enacted.
Second, we examine whether offices within audit firms having both public and nonpublic engage-
ments increased their concentration of client types (i.e., public versus nonpublic) in specific offices, which
we refer to as “within-firm” separation. To test this, we focus on auditors serving both public and nonpublic
clients, and measure whether the distribution of client engagements across the auditor’s offices changes post-
SOX. Using two measures of client type concentration, we find that offices within the same audit firm were
more likely to focus on either NPOs or public companies. These results persist through the end of our sample
in 2013. This evidence documents a second channel through which SOX contributed to the separation of
public and nonpublic audit markets.
Given the sizable, persistent changes in the audit market we document, we conclude our study by
descriptively assessing how these changes relate to the aggregate audit supply concentration of the NPO
market. Analyses using the Herfindahl-Hirschman Index (HHI) reveal a sharp decline in audit market con-
centration starting in 2004, driven by NPOs previously concentrating in larger auditors shifting to a broader
set of auditors. By 2009, the HHI is less than half the value it was in 2003 and this level persists to the end
of our analysis in 2013. Complementing this evidence, we find the number of auditors serving at least five
NPO clients increased by 26% over this same period, from 54 to 68. While we view these results as descrip-
tive, they stand in stark contrast with the literature investigating the public company audit market, in which
both academic and practitioner literatures highlight increased audit market concentration (e.g., Gerakos and
Syverson 2015; Ferguson et al. 2017) and decreased number of suppliers (DeFond and Lennox 2011).
Our results are relevant to both researchers and regulators for three reasons. First, we identify large,
Electronic copy available at: https://ssrn.com/abstract=3020316
8
persistent effects of SOX on the audit market for unregulated entities. Our findings thus indicate that analyses
of the costs and benefits of public company regulation (e.g., Coates and Srinivasan 2014) should not be
limited to public companies. Second, recent research highlights that as large customers have moved toward
large public audit firms, the audit supply structure has become highly concentrated (Gerakos and Syverson
2015; Ferguson et al. 2017). Our findings reveal that the audit supply market is not only affected by long-run
changes in client characteristics, but also affected by regulation. Specifically, following SOX audit firms
specialized in either regulated or unregulated clients, resulting in less concentrated attestation markets for
nonpublic entities. Finally, we document a new determinant of the equilibrium financial report attestation for
nonpublic entities. While extant research investigates the demand drivers and consequences of attested fi-
nancial reports to private companies (e.g., Blackwell et al. 1998; Allee and Yohn 2009; Minnis 2011) and
nonprofits (Tate 2007, Kitching 2009, Petrovits et al. 2011), we know relatively little about the determinants
of audit supply or spillovers from public entity regulation.
2. Motivation and Prior Literature
A significant body of literature investigates the effects of SOX; however, most prior literature fo-
cuses on measuring the effects of SOX on public companies (Engel et al. 2007; Zhang 2007; Cohen et al.
2008; Linck et al. 2008). For example, prior research finds a sharp increase in public company audit fees
upon the enactment of Section 404 (e.g., Ettredge et al. 2007; Griffin and Lont 2007; SEC 2009; Iliev 2010;
Ettredge et al. 2017). Another stream of literature investigates changes in auditors’ portfolios of public com-
panies in conjunction with the demise of Arthur Andersen and the passage of SOX. Moreover, several papers
find an increase in the frequency of auditor switches among public companies, especially departures from
the Big N, during the 2000s (Rama and Read 2006; Doogar, Fargher, and Hong 2007; Ettredge et al. 2007;
Hogan and Martin 2009; Landsman, Nelson, and Rountree 2009; Chang et al. 2010; Aobdia, Enache, and
Srivastava 2019). These papers ascribe these Big N portfolio changes to a number of factors such as SOX,
post-Enron risk adjustments, or simply a continuation of longer run trends. Prior work also documents how
the costs of complying with SOX affect entry in the public company market. For example, Piotroski and
Srinivasan (2008) find that small foreign companies are less likely to choose to list in the U.S. compared to
Electronic copy available at: https://ssrn.com/abstract=3020316

9
the U.K. Bova, Minutti-Meza, Richardson, and Vyas (2014) show that private companies seeking public
equity financing are more likely to be acquired by an existing public company rather than pursue an initial
public offering.
While most literature does not investigate whether audit regulation of public companies has spillover
effects on nonpublic entities, an understanding of any such spillovers is important for several reasons. Private
companies and NPOs rely on CPA attestation to mitigate information and agency problems just as public
companies do. For example, the literature investigating private companies shows that high quality reporting
affects these companies’ ability to access credit markets (e.g., Blackwell et al. 1998; Allee and Yohn 2009;
Minnis 2011; DeFond and Zhang 2014). If CPA-prepared statements are more costly for borrowers to obtain,
banks will have to rely on other information sources, including unverified management-prepared reports, soft
information, and credit reports (Cassar et al. 2015; Minnis and Sutherland 2017; Sutherland 2018). This could
increase interest rates or collateral requirements, or decrease the amount of credit available (Berger and Udell
2006; Minnis 2011; Badertscher et al. 2017). Thus, private companies may face a higher cost of capital. For
NPOs, both Kitching (2009) and Harris et al. (2015) find that audit quality is related to donor decisions, thus
the ability of NPOs to access high quality auditors affects the nearly $400 billion annual market for contri-
butions (Charity Navigator 2016). More broadly, examining spillover effects of public entity regulation on
nonpublic entities is informative about the full costs of the regulation.
Recent literature has begun exploring a link between SOX and the nonpublic audit market. For ex-
ample, Feng and Elder (2017) examine the nonprofit clients of the Big 4 and find their propensity to switch
to smaller auditors increases starting in 2002. They further find that downward switching is concentrated in
hospitals and universities, and is associated with subsequent internal control weaknesses but not donor con-
tributions. However, because their study focuses exclusively on the auditor switching of individual Big 4
clients over a relatively short period, it does not investigate pricing implications, or more importantly, any
aggregate or long-run consequences for the NPO audit market.
One limitation of the extant SOX literature relates to the challenges associated with drawing causal
inferences surrounding the effects of SOX. As Coates and Srinivasan (2014) note, “To date, however, most
Electronic copy available at: https://ssrn.com/abstract=3020316

10
studies of SOX…have not used research designs well adapted for (causal inference), and instead use simple
before-and-after comparisons that fail to control for contemporaneous changes in the objects of study” (pp.
660). Related to our research question, prior research has struggled with identifying the causes of auditor
switches and audit fee increases around SOX separately from other contemporaneous developments such as
responses to corporate scandals, the fall of Arthur Andersen, and prevailing economic conditions. Disentan-
gling these channels is crucial, however, if the goal is to document a regulatory spillover, rather than simply
show greater prevalence of switches and fee increases after 2002. As we detail in Section 3, an attractive
feature of our setting for studying the connectedness of public and nonpublic markets is the across-time and
auditor variation in the involvement of IC attestation. We thus contribute not only by assessing whether
public company regulation had spillover effects on nonpublic entities, but also by identifying causal effects
of SOX.
3. Short-run Effects: Audit Quantities and Prices
3.1 Audit quantities of private companies
3.1.1 Private companies: Data and summary statistics
We collect private company data from the RMA’s Annual Statement Studies (“Studies” hereafter).
RMA is an industry association of banks that collects and publishes aggregate statistics about the type of
financial statements gathered by its members each year. The Studies tabulates the types of financial reports
submitted by commercial loan applicants and borrowers to member banks each year into one of five mutually
exclusive and collectively exhaustive categories: unqualified audits, reviews, compilations, tax returns, and
other (which are typically company prepared statements). The first three report types are collectively referred
to as “attestation” reports (i.e., a CPA is involved in the report preparation and provides an attestation report
in conjunction with the financial statements) and the latter two do not involve CPA attestation. We provide
additional definitions of these reports in Appendix A.6
6 While the American Institute of Certified Public Accountants refers to audits, reviews, and compilations as attestation
services (requiring a CPA) (AICPA 2016), only audits and reviews are assurance engagements in which the CPA pro-
vides assurance with respect to the veracity of the figures reported in the financial statements.
Electronic copy available at: https://ssrn.com/abstract=3020316

11
The Studies does not report company level data for confidentiality purposes, but instead reports the
distribution of statement types by six-digit NAICS code, region (Northeast, Southeast, Central, South Cen-
tral, North Central, and West), and borrower size category (under $1M of revenue, $1M-$3M, $3M-$5M,
$5M-$10M, $10M-$25M, and greater than $25M). Additional details of the RMA dataset are provided in
Appendix A of Berger, Minnis, and Sutherland (2017) and Lisowsky et al. (2017). The version of the dataset
used in our study differs slightly from the version in those papers. Because our tests do not require bank-
level data, we can expand the sample back to 1995, instead of 2002 which is the first year bank-level detail
is available. Accessing earlier data from RMA allows us to observe a longer time series of financial reporting
practices during the pre-SOX period to better account for any secular trend.7 An appealing feature of the
RMA dataset is that it contains the reports collected by the banks responsible for the majority of commercial
lending activity in the U.S., facilitating the generalizability of our analyses.
Table 1 reports descriptive statistics for the variables used in our private company analyses, measured
between 1995 and 2011. The entire dataset includes 2,004,650 statements after eliminating financial services
borrowers (two-digit sectors 52 and 55), and observations with fewer than five statements. We collapse the
statements to a three-digit industry by region by company size category by year unit of observation. In the
mean (median) industry-region-company size-year, 53.9% (56.0%) of the statements are unqualified audits,
reviews, or compilations (collectively referred to as “% CPA”). Unqualified audits (reviews, compilations)
comprise 20.5% (15.2%, 18.2%) of this 53.9% share. The remaining 46.1% of statements are split between
tax returns and other statements. To study changes in reporting practices, we employ time indicators for
periods within our sample marking distinct milestones associated with SOX (Year 02-03; Year 04-09). We
chose our 2004-2009 post-enactment period to immediately follow the enactment of Section 404 and span
the expected period of audit labor shortage, given licensing and education requirements. In the supplemental
appendix, we show that focusing only on the period immediately following the enactment of Section 404
7 Nevertheless, in untabulated robustness analyses we repeat our main tests using the bank-level data for the 2002-2013
period with bank fixed effects, and find similar results, mitigating concerns that bank-level participation decisions over
time are responsible for our results. Our results are also the same if we restrict the sample to banks participating in RMA
every year from 2002 to 2011.
Electronic copy available at: https://ssrn.com/abstract=3020316

12
(e.g., 2004-2005) strengthens our inferences. Last, we report summary statistics for the cross-sectional vari-
able used in our tests. NonCalendarFYEShare measures the percent of private companies in the industry with
a fiscal year-end in months other than in December. We measure this variable in 2003 using the Sageworks
data described in Minnis (2011). The average value of NonCalendarFYEShare is 18.2%.8
3.1.2 Private companies: Results
Our first set of tests uses the RMA data to study the reporting practices of private companies as a
function of time, using the following weighted least squares specification:
% 𝐶𝑃𝐴𝑟,𝑖,𝑠,𝑡 = 𝛼𝑟 + 𝛼𝑖 + 𝛼𝑠 + 𝛽1 × 𝑌𝑒𝑎𝑟𝑡 + 𝛽2 × 𝑇𝑟𝑒𝑛𝑑𝑡 + 𝜀𝑟,𝑖,𝑠,𝑡 (1)
The unit of observation is industry-region-company size category-year. We weight each observation by the
number of statements collected within the unit of observation, but our results are not sensitive to this choice.
Our baseline specification includes region (𝛼𝑟), industry (𝛼𝑖), and company size category (𝛼𝑠) fixed effects.
The coefficient of interest, 𝛽1, measures how the quantity of financial report attestation differs in the years
2004-2009 relative to other years in the sample. Our prediction is that % CPA is lower after Section 404
implementation (i.e., after 2004), but before the supply of auditors has had time to adjust (i.e., before 2009).
We include a linear trend term, 𝑇𝑟𝑒𝑛𝑑, increasing by one each year following 1995 to account for a potential
secular trend. We cluster our standard errors by industry. Because our sample only spans 1995-2011 and
contains only six regions and six size categories, clustering by year, region, or size category is inappropriate
(Angrist and Pischke 2009). However, our results are robust to clustering on multiple dimensions (e.g., by
region x size category or region x size category and industry, see Table A1 in the supplemental appendix).
Table 2, Column 1 presents the results of estimating (1). It shows that in the six years after SOX was
enacted, bank collection of CPA attested statements declined by 2.2% beyond the long-term trend (i.e., Year
04-09 is negative and significant). We then subject this result to a series of robustness tests. First, we include
8 Sageworks is a panel data set of privately held companies that reports industry and fiscal year-end information. Be-
cause the RMA data is tabulated at the industry level, we aggregate the Sageworks fiscal year-end data by industry for
the year 2003 and merge this into the RMA data. Prior literature discusses the factors driving across-industry variation
in fiscal year-ends, such as inventory flows (see, for example, Huberman and Kandel 1989).
Electronic copy available at: https://ssrn.com/abstract=3020316

13
indicators for each industry-region-size category combination, to account for time-invariant reporting prac-
tices within an industry, across regions and company sizes. Second, we assess whether developments unre-
lated to SOX could be generating our findings by including either higher order trend terms or industry-spe-
cific trends in our specification. In each test, the economic and statistical significance of Year 04-09 remains
similar to column 1.9
Then, to reinforce that labor market developments contribute to variation in % CPA and to ensure the
finding is not simply the result of an unmodeled secular trend, we study a second time period with regulatory-
driven changes in audit supply for private companies. We focus on the period after SOX was passed (2002)
but before the November 15th, 2004 mandatory compliance date for management reports on internal controls.
Motivated by DeFond and Lennox (2011), we test whether % CPA increases for 2002-2003, as auditors
exiting the public company market increase accountant supply for private companies. Column 2 finds that
private companies were more likely to provide CPA-prepared reports to their bank in 2002 and 2003. The
coefficient on Year 02-03 is positive and significant at the 1% level.
We also examine changes in attestation by year, instead of grouping years. Figure 1 plots the coeffi-
cients of year fixed effects, thus allowing the attestation rate to vary by year. Note that points before 2002
are not significantly different from zero, thus establishing that no years had significant deviations from the
overall trend during this time. Year 2003 is significantly positive, consistent with the results in column 2 of
Table 2. More importantly, the decrease in attestation between 2003 and 2005 is large—a 6.3 percentage
point decrease (or 12% of the pre-SOX rate) in just two years—and consistent with the timing of the majority
of the public company demand shock. To gauge the economic significance of this decrease, we compare it
to the difference in companies’ propensity to provide attested statements to large versus small banks, which
has received considerable attention in the banking literature (e.g., Berger, Miller, Petersen, Rajan, and Stein
2005). The difference in % CPA between large and small banks is only 3.4 percentage points (Berger et al.
9 To further ensure entry by small companies into the sample between 2004 and 2009 does not drive the decline in %
CPA (e.g. see Section 4.1 and Figure 4 of Lisowsky et al. 2017), we repeat our tests after omitting companies with less
than $10M of revenue, and arrive at the same results. Our results are also the same if we allow for company size-
specific trends.
Electronic copy available at: https://ssrn.com/abstract=3020316
14
2017)—approximately half of the magnitude of the SOX spillover. The remaining years of the figure show
that % CPA slowly reverts to the trend rate by 2010 as accounting labor returns to the attestation market.
The results thus far identify the effects of SOX by comparison to the overall trend in changes in attes-
tation. We next conduct cross-sectional tests to tie these findings more directly to labor constraints. Recall
the spillover mechanism argument: audit firms did not have sufficient labor to supply all consumers, and
private companies have elastic demand because they do not face a reporting mandate, and may be able to
provide alternative information (e.g., tax returns or credit scores) to their contracting counterparties. If labor
inelasticity is the mechanism, then the post-SOX decline in CPA statement reporting should be more apparent
in settings where labor is more constrained. We exploit plausibly exogenous within-year variation in the
demand for accountants to identify labor constraints while holding private company audit demand constant.
The preponderance of December fiscal year-end companies in the U.S. economy has traditionally created a
CPA “busy season” during the first few months of the year, while the summer months typically have ac-
countant supply slack because of reduced demand. If labor constraints induce spillover, then private compa-
nies with December year-ends will experience more negative spillover effects from SOX than companies
with fiscal year-ends outside of the busy season.
Column 3 of Table 2 presents the results of regressions that add interactions between Non Calendar
FYE Share and our time variable of interest, Year 04-09, to equation (1). We present a deciled version of Non
Calendar FYE Share to facilitate interpretation; alternative specifications and the raw continuous measure
produce the same inferences. Consistent with our predictions, Column 3 shows a positive and significant
coefficient on Year 04-09 * Non Calendar FYE Share. Moving from the industries with the lowest (1st) to
highest (10th) decile of slack substantially reverses the post-SOX decline in % CPA (0.003 x 9 = 0.027,
offsetting much of the -0.038 coefficient on Year 04-09). Thus, the increase in public company accountant
demand most affected December year-end companies.10
10 One concern about the fiscal year-end cross-sectional variable is that companies could simply switch their fiscal year-
end to avoid the effect of SOX. However, switching fiscal year-ends is difficult. The majority of companies in the U.S.
economy are passthrough entities, such as partnerships and subchapter S corporations, which have “required tax years”
per the Internal Revenue Service. Required tax years generally force the entity to have the same fiscal year-end as the
Electronic copy available at: https://ssrn.com/abstract=3020316

15
Performing cross-sectional tests also allows us to augment our specification with sector and time
controls, to account for developments concurrent with the passage of SOX. By including sector-by-time fixed
effects, we can control for macroeconomic and governance developments affecting reporting within a class
of similar industries, while exploiting differences in fiscal year-ends across these industries. The identifying
assumptions behind these tests are: (1) reporting for the three-digit industries within a two-digit sector re-
sponds similarly to the state of the economy and governance reform during the sample period; and (2) within-
sector, across industry variation in fiscal year-ends is unrelated to sector-level developments during our sam-
ple.11 Column 4 presents the results using fully saturated specifications. We find that controlling for sector-
by-year effects does not affect our original inferences. Companies belonging to industries with more off cycle
reporting are less exposed to the accountant supply inelasticity.
The results to this point suggest that the SOX demand shock affected the reporting of CPA-attested
statements by private companies. We exploit this shock to investigate which types of statements (audits,
reviews, or compilations) are responsible for the decrease in % CPA between 2004 and 2009, and whether
labor constraints mediate the decrease. Doing so also allows us to offer evidence on the elasticity of demand
for different CPA statements. One possibility is that companies choose less expensive report options in the
face of price increases. An alternative conjecture is that demand elasticity for attestation services is negatively
related to attestation quality because higher quality financial statements could be contractually required by
banks, suppliers, or shareholders. We acknowledge that theory can support still other predictions, so we con-
sider our results exploratory.
majority owner(s)—which is typically an individual with a calendar tax year. While the IRS allows for exceptions to
the required tax year (providing the variation we exploit with the cross-sectional variable, Non Calendar FYE), it is not
surprising that the majority of private companies have December year-ends and that this rarely changes in the Sageworks
data (see also IRS Publication 538). Moreover, for those companies with a possibility of switching, they must first apply
to the IRS to have this granted and then file a partial year return, which imposes further costs for the company. 11 We uncover significant variation in fiscal year-ends across the industries belonging to the same sector. The standard
deviation in Non Calendar FYE Share within sector (8.2%) is comparable to the standard deviation across sectors
(8.1%). To illustrate the variation, consider two-digit sector 62 (health care and social assistance). Its three-digit indus-
tries (ambulatory health care services, hospitals, nursing and residential care facilities, and social assistance; industries
621, 622, 623, and 624) are comparably exposed to the broader economy, but have different fiscal year-end concentra-
tions (Non Calendar FYE Share of 9.8%, 33.3%, 14.9%, and 17.6% respectively). Note that the sector-by-year fixed
effects absorb the Year04-09 variable, and thus that coefficient is not reported in column 4.
Electronic copy available at: https://ssrn.com/abstract=3020316

16
Columns 1-3 of Table 3 present the results. We find that the coefficients for Year 04-09 monoton-
ically decline in statement quality. That is, unqualified audits see no statistical change in reporting frequency,
while reviews decline slightly and compilations decline more (statistically and economically). Moreover, as
further evidence that labor constraints contribute to the quantity reduction following SOX Section 404, we
find that the effects are weaker in industries with companies with a higher preponderance of non-December
fiscal year-ends (Year 04-09 * Non Calendar FYE Share is significantly positive). To assess the economic
magnitudes of the results, the coefficients imply a 4.7% (8.4%) decline in reporting rates for reviews (com-
pilations) for the pooled sample of companies following SOX Section 404.12 Note, however, that our evi-
dence does not imply that private companies purchasing audit services were not affected by SOX. Instead,
we suggest that SOX affected all attestation levels but that audit services—which likely have lower demand
elasticity because of contractual requirements—experienced effects through price (which is unobservable to
us) rather than quantity. Thus, we consider these results intriguing evidence of differential demand elasticity
across statement types which can be explored in future research.
To summarize the private company results, we find that a public company audit shock affected the
quantity of attestation services consumed by private companies. We conjecture these changes in quantities
are a response to changes in attestation prices; however, we are unable to directly measure this because we
do not have access to audit price data for private companies. Therefore, we examine the nonprofit setting.
3.2 Audit price and supply in NPOs
3.2.1 NPOs: Data and summary statistics
NPOs and governmental entities who expend total federal grants of $500,000 or more are required
to obtain an attestation referred to as a “Single Audit.”13 An independent CPA must conduct the audit and
12 To calculate these figures for the representative company, we assume a fifth decile of Non-Calendar FYE Share, and
compare the change in reporting to the pre-SOX average. Specifically, the 8.4% decline for compilations is calculated
as (-0.029 + 5 x 0.002)/0.225, where -0.029 and 0.002 are the column 3 coefficients for Year 04-09 and Year 04-09 x
Non-Calendar FYE Share, respectively, and 0.225 is the average for % Compilations before 2004. 13 At the beginning of our sample period, the threshold is $300,000. Organizations expending total grants between
$300,000 and $500,000 are therefore not observable throughout our sample period. We exclude these organizations to
ensure that our results are not confounded by a change in sample composition. Because we do not have fees or necessary
control variables (e.g., assets) for governmental entities, we do not examine them in our price and switching tests.
Electronic copy available at: https://ssrn.com/abstract=3020316

17
submit the audit report to the Federal Audit Clearinghouse, which in turn makes the report publicly accessi-
ble. Audit Analytics collects data filed by NPOs subject to a Single Audit, allowing us to observe the auditor
identity for each NPO-year. By tracing that audit firm in both Audit Analytics’ Opinions and SOX 404 data-
bases, we can determine whether it also serves public companies, and when it begins issuing IC attestations.
The filing requirements for NPOs subject to a Single Audit are minimal. The auditees must file their
audit report, but not their actual financial statements. We access GuideStar for detailed NPO-level data.
GuideStar extracts the information reported on the Form 990 that NPOs file with the Internal Revenue Ser-
vice. Certain types of organizations represented in Audit Analytics are not Form 990 filers (e.g., states, local
governments, and Indian tribal governments). Similarly, not all NPOs receive grants from the federal gov-
ernment. Our sample is therefore at the intersection of Audit Analytics and GuideStar.
There are two selection issues related to smaller NPOs in the Form 990 data. First, GuideStar’s cov-
erage of NPOs is haphazard during the years 2004 to 2007, especially those with less than $750,000 in re-
ceipts.14 Second, the IRS’s revenue threshold exempting NPOs from filing an annual Form 990 varies over
time. This causes small NPOs to leave and re-enter the sample. To ensure various sample selection issues do
not induce our results, we impose a balanced panel on GuideStar’s dataset prior to merging it with Audit
Analytics. Of course, doing so introduces a survivorship bias concern; therefore, we replicate all of our anal-
yses without this requirement. We also re-estimate our tests only on NPOs with receipts above $750,000
which do not suffer from these concerns, and our results are statistically and economically similar.
Table 4 describes the sample selection procedures. Our sample begins in 2000 because it is the first
year Audit Analytics is adequately populated.15 We begin with the 67,886 NPO-year observations at the in-
tersection of the Audit Analytics nonprofit database and GuideStar. We exclude NPOs expending less than
14 Based on our discussion with GuideStar, they experienced funding issues during 2004-2007 and as a cost savings
measure, reduced coverage of some NPOs in an ad hoc manner, mainly affecting those with less than $750,000 in
receipts. Since the vast majority of GuideStar’s customers demand contemporaneous rather than archival data,
GuideStar has decided not to backfill the missing observations. 15 We end the sample in 2009 for our short-run price and switching tests to maintain a relatively tight window around
the IC shock (nearly all audit firms who issue IC attestations begin doing so prior to 2009). Moreover, given the reduc-
tion in the demand shock from AS5 (Schroder and Hogan 2013) and the steady increase in accounting labor after 2004
Electronic copy available at: https://ssrn.com/abstract=3020316
18
$500,000 in federal grants because they are not subject to the audit requirement throughout the sample period.
We also exclude observations where any of the following fields are missing: total assets at year-end, fees for
audit and accounting services, date of the fiscal year-end, or activity type. Consistent with prior work, we
find that the number of observations with missing fields is not trivial (Krishnan, Yetman, and Yetman 2006;
Yetman and Yetman 2012; Burks 2015). One explanation is that errors that occur while filling out the Form
990 can go unnoticed because the financial statements are audited, not the Form 990. This leaves us with
41,605 NPO-year observations representing 8,123 distinct NPOs. For the specification where the outcome
variable is the likelihood of switching auditor, we drop observations without prior-year data. Finally, we
winsorize all continuous variables at the 1st and 99th percentile.
We then allocate these observations to treatment and control groups. In the audit fee specification,
we assign an NPO to the treatment group in year t if its auditor issues IC attestations to public companies in
year t. In the auditor switch specification, we assign an NPO to the treatment group in year t if its year t-1
auditor issues IC attestations to public companies in year t, regardless of whether the NPO stays with that
auditor. All NPO-year observations not meeting the treatment definition are in the control group.
In Panels A and B of Table 5, we present the summary statistics for the variables used in the tests of
the effect of SOX on audit price and the probability of switching auditor, respectively. NonCalendarFYE
takes a value of one when an NPO’s fiscal year-end falls in a month other than December and zero if the
NPO has a December fiscal year-end. Seventy-nine percent of organizations in the treatment group (72% in
the control group) have a year-end that falls outside of the auditor busy period. By definition, NPOs in the
control group have auditors which never audit public companies and are, therefore, smaller. As such, the
NPOs in the control group are also smaller on average. Note that while the descriptive statistics reveal dif-
ferences between treatment and control NPOs on average, we evaluate pre-treatment trends and conduct
several matching analyses to mitigate the threat of such differences generating our results.
3.2.2 NPOs: Results
discussed in Section 2, much of the initial labor inelasticity had been resolved by 2009. We continue our long-run tests
to the end of our data in 2013.
Electronic copy available at: https://ssrn.com/abstract=3020316
19
To identify the effect of public company demand shocks on NPOs, we use a generalized difference-
in-differences design. We compare changes in fees and auditor switch rates of NPOs whose auditors become
busy with 404 IC attestation for public company clients to NPOs whose auditors are not busy with IC attes-
tations. Our identifying assumption behind this approach is that changes in fees and switch rates would be
similar between these two groups of NPOs except for the fact that their auditors became busy with other
clients in their portfolios.16
One advantage of our approach is that NPOs in the treatment group do not all experience the treat-
ment simultaneously because not all audit firms begin issuing IC attestations in the same year. Section 404
of SOX becomes effective in 2004, but covers only public companies with a public float above a certain
threshold (Albuquerque and Zhu 2018). Larger auditors with large public company clients perform their first
IC attestation in 2004. However, many smaller auditors begin issuing IC attestations at different points in
time over the subsequent years, depending on when the public companies in their client portfolio become
subject to the mandate.17 Consequently, the year in which treated NPOs first experience the treatment de-
pends on their auditor and when that auditor begins issuing IC attestations to public companies.18 Our differ-
ence-in-differences specification to examine audit fees is:
𝐿𝑛𝐹𝑒𝑒𝑠𝑁𝑃𝑂,𝑡 = 𝛼𝑁𝑃𝑂 𝑥 𝑎𝑢𝑑𝑖𝑡𝑜𝑟 + 𝛼𝑡 + 𝛽1 × 𝐴𝑢𝑑𝑖𝑡𝑜𝑟𝐵𝑢𝑠𝑦404𝑁𝑃𝑂,𝑡
+𝛽2 × 𝐿𝑛𝐴𝑠𝑠𝑒𝑡𝑠𝑁𝑃𝑂,𝑡 + 𝜀𝑁𝑃𝑂,𝑡 (2)
The main regression includes NPO-auditor and year fixed effects. By including NPO-auditor fixed effects,
16 Note that NPOs with auditors not issuing IC attestations (i.e., the control group) likely experience some effects of the
SOX shock as well. For example, their auditor might lose staff to audit firms who issue IC attestations. Our design
therefore measures the difference in the intensity of the spillover, which likely results in a lower bound of the treatment
effect of SOX in the nonprofit sector. 17 We identify 138 auditors who both cater to NPOs and issue IC attestations during our sample period. Fifty-seven of
the auditors perform their first IC attestation in 2004, while the remainder do so over the subsequent years. Refer to
Iliev (2010) for a year-by-year discussion of the specific criteria that determine whether a public company is subject to
the mandate. 18 We perform a robustness test where we exclude NPOs who first experience the treatment through a Big 4 auditor.
The results are weaker because of sample attrition, but remain statistically significant. We also argue that the 2002
failure of Arthur Andersen is unlikely to confound our analysis for several reasons. First, Andersen, which had only 60
NPO clients in our sample, was not a major player in the NPO segment. By comparison, the other Big 4 auditors col-
lectively had 779 nonprofit clients. Second, we replicate all our analyses after excluding former Andersen clients, and
arrive at nearly identical results. Third, the timing of Andersen’s failure works against us finding results because all of
Andersen’s clients switched to other auditors before 2002.
Electronic copy available at: https://ssrn.com/abstract=3020316

20
we estimate the model within auditee-auditor relationship and therefore capture the change in fees for NPOs
who stay with their auditor. The year fixed effects reduce the likelihood that year-specific factors such as
changes in economic conditions or other regulatory developments drive our results. We then run a version of
regression (2) in which we include activity type-year and state-year fixed effects. We base the 26 activity
types on the National Taxonomy of Exempt Entities, which is the standard classification system for NPOs.
AuditorBusy404 is the treatment variable of interest. The main effects are absorbed by the fixed effect struc-
ture. In addition to our fixed effects, we also control for NPO size using LnAssets, equal to the natural loga-
rithm of assets reported on the NPO’s Form 990, but our inferences are similar if we use revenue instead of
assets. We cluster the standard errors by auditor.
We next investigate the effect of SOX on the likelihood of switching auditor. We use a similar dif-
ference-in-differences specification to the fees regression above:
𝑆𝑤𝑖𝑡𝑐ℎ𝐴𝑢𝑑𝑖𝑡𝑜𝑟𝑁𝑃𝑂,𝑡 = 𝛼𝑁𝑃𝑂 𝑥 𝑎𝑢𝑑𝑖𝑡𝑜𝑟,𝑡−1 + 𝛼𝑡 + 𝛽1 × 𝐴𝑢𝑑𝑖𝑡𝑜𝑟𝑡−1𝐵𝑢𝑠𝑦404𝑁𝑃𝑂,𝑡
+𝛽2 × 𝐿𝑛𝐴𝑠𝑠𝑒𝑡𝑠𝑁𝑃𝑂,𝑡−1 + 𝜀𝑁𝑃𝑂,𝑡 (3)
SwitchAuditor is an indicator variable that takes a value of 1 if the NPO has a different auditor in year t
relative to t-1.19 𝐴𝑢𝑑𝑖𝑡𝑜𝑟𝑡−1𝐵𝑢𝑠𝑦404𝑁𝑃𝑂,𝑡 is the treatment variable of interest and equals 1 when the NPO’s
auditor (identified in year t-1) has a client requiring IC testing in year t.20
Our design mitigates issues of omitted variables. An omitted variable would have to affect NPOs in
the treatment group (i.e., NPOs with auditors who issue IC attestations at some point in time) differently from
NPOs in the control group and this differential effect would have to occur at the time auditors issue IC
attestations (and not before if the parallel trend assumption holds). Furthermore, the omitted variable would
19 To ensure SwitchAuditor excludes mergers and acquisitions activities between audit firms, we manually inspect the
names of all audit firms and track systematic movements of clients across auditors for every year in our sample. We
adjust our code so as not to count these movements as switches; however, our results are economically and statistically
similar if we count mergers and acquisitions of audit firms as auditor switches. 20 We measure the auditor-client match in year t-1 and auditor busyness in year t to allow for NPOs to switch auditors
simultaneously with the busyness of the auditor. This definition assumes that auditors anticipate being busy in year t
with IC attestation. However, if we redefine the variable to measure switching starting the year after an auditor engages
in IC attestation (i.e., Auditort-1Busy404NPO,t-1), we continue to find a significant increase in switches (untabulated). This
result can also be observed by examining Figure 2b and noting the continued increase after year t=0.
Electronic copy available at: https://ssrn.com/abstract=3020316

21
also have to explain why the outcome reverses for NPOs who withdraw from the treatment by switching
auditor.
We first examine pricing effects. Figure 2A plots the results of estimating equation 2 in event time.
Point t=0 is the first year an NPO’s auditor issues IC attestations to public companies and period t-1 serves
as the benchmark period. The figure shows the coefficient estimates and their 95% confidence intervals for
each period. Importantly, note that prior to t=0, the coefficients are very close to zero, providing evidence
supporting the parallel trends assumption necessary for our identification strategy—i.e., audit fee changes
for treatment and control NPOs did not change differentially prior to Section 404 implementation. NPOs in
the treatment group experience an increase in audit fees relative to the control group as soon as their auditor
begins issuing IC attestations (i.e., at t=0 and thereafter). Our point estimates of the increase in audit fees
range from 4.0% to 9.5%, depending on the year. Since we perform the estimation within NPO-auditor rela-
tionship (i.e., we include NPO-auditor fixed effects), we capture the effect on audit fees conditional on the
NPO not having switched auditor.21
Table 6, column 1 tabulates the results of estimating equation (2). We find that NPOs experience an
incremental 6.5% increase in audit fees when their auditor becomes busy with IC attestations. We include
activity type-year and state-year fixed effects in column 2, and find the magnitude of the effect attenuates
slightly to 5.4%. This specification alleviates the concern that different time trends across activity types or
states influences our results. While the use of fixed effects and the pre-treatment parallel trends substantially
mitigate time-invariant omitted variable concerns, one may still be concerned that differences in the treatment
and control NPOs revealed in Table 5 could be associated with different responses to SOX Section 404. A
particular threat to our inference is that the treated firms are larger and that larger NPOs experienced an audit
demand shock in conjunction with SOX. To mitigate this concern, in column 3 we re-estimate equation (2)
after matching treated and control observations based on size, activity type and year. The results only slightly
21 Recall, in our private company analysis, we find evidence of a positive attestation supply shock in 2002 to 2003,
consistent with the outflow of auditors from the public company accounting market identified in DeFond and Lennox
(2011). We test for a 2002-2003 response in the NPO market as well, but do not find evidence of one. We speculate the
reason for this is that the human capital exiting the public market specialized in for-profit companies.
Electronic copy available at: https://ssrn.com/abstract=3020316

22
attenuate and remain significant.22 In column 4, we assume that audit offices are independent within an audit
firm and redefine the busyness treatment variable based on the audit office serving the NPO. We consider
the office-level specification more restrictive because it suggests NPOs audited by auditors who become busy
in other offices are not affected by personnel shuffling within an audit firm across offices—even though audit
staff often travel for a given auditor. Again, we find similar results under this more restrictive specification.
One concern with the results in the first four columns of Table 6 is that features of the audit product
changed in conjunction with SOX. For example, the PCAOB began inspections of audit firms starting in
2003. The fee increases could therefore be the result of a different audit product for NPOs with inspected
auditors, rather than a result of a constrained supply (e.g., Gipper, Leuz, and Maffett 2017; Aobdia 2017;
Aobdia and Shroff 2017; DeFond and Lennox 2017; Shroff 2017; Aobdia 2018) and even the matching spec-
ification is unable to identify these differences. To mitigate this concern, we exploit NPO fiscal year-ends,
similar to our private company analysis. In column 5 of Table 6, we interact the treatment variable Auditor-
Busy404 with Non Calendar FYE and find a negative and statistically significant coefficient on the interaction
term. These findings suggest that an NPO whose fiscal year-end falls outside of its auditor’s busy season
experiences a smaller (though significant) increase in audit fees (an F-test of the sum of AuditorBusy404 and
AuditorBusy404*NonCalendarFYE produces a p-value of 0.0301).23 Figure A4 in the supplemental appendix
plots these results and further shows that the pre-treatment parallel trends assumption holds. We find the
same results (untabulated) when we conduct the analysis after matching December and non-December fiscal
year-end NPOs, thus ensuring that observable differences between NPOs based on the timing of the fiscal
year-end are not driving the results. Analogous to our results for private company audit decisions, this cross-
22 While the matching specification mitigates concerns that size differences between treatment and control NPOs are
creating the results, this approach comes at a cost: it eliminates the larger NPOs from the analysis and, because they are
more frequently using larger auditors, these are the NPOs which are most affected by the public company demand shock
caused by SOX. Therefore, it is not surprising that the coefficient in column 3 slightly attenuates. 23 Similar to the private company analysis, one concern is that NPOs could simply switch their fiscal year-end. This is
also costly for NPOs. They often establish fiscal year-ends to comport with funding cycles of their major contributors.
Moreover, switching a fiscal year-end requires two audits within the same year (shortened fiscal year and new fiscal
year), minimizing the savings. Therefore, it is not surprising that we see very few fiscal year-end switches for NPOs in
our sample.
Electronic copy available at: https://ssrn.com/abstract=3020316

23
sectional finding supports the inference that the increase in audit fees is related to labor inelasticity.
To reinforce this inference, we examine the magnitude of the interaction coefficient by year. If this
coefficient is identifying differences in short-run labor inelasticity and labor is relatively elastic in the long-
run, then we should find the magnitude of the cross-sectional coefficient attenuates as time moves further
from the SOX shock. In column 6 of Table 6, we show the coefficients of the interactions between Auditor-
Busy404 and Non Calendar FYE, estimated each year. We find that the magnitude of the coefficient decreases
after 2006 and becomes insignificant by 2009—coinciding almost exactly with the same time new accounting
labor flows into accounting firms per Figure A2. Under the mild assumption that non-December fiscal year
NPOs do not have a differential change in audit demand relative to December fiscal year NPOs, these cross-
sectional findings support the inference that a public company demand shock coupled with an auditor supply
inelasticity accounts for our fee results. Alternative demand side explanations have to describe not only a
specific demand shock for December year-end private companies and NPOs, but also why that demand shock
dissipates over time vis-à-vis non-December entities.
We now examine changes in NPO auditor relationships using equation (3). Figure 2B plots the like-
lihood of switching auditor in event time and finds no difference between treatment and control firms before
IC attestations, and a significant increase once an NPO’s auditor is required to conduct IC attestations for
public companies in its portfolio. Table 7 tabulates the results. In column 1, we find a 6.7 percentage point
increase in the probability of an NPO switching auditor at the time their auditor becomes busy with IC attes-
tation for public companies. In column 2, we include activity type-year and state-year fixed effects. In column
3 we match treated and control NPOs based on observable characteristics.24 In column 4 we change the spec-
ification of the busyness variable based on office-level (rather than auditor-level) involvement in Section 404
attestation. In all cases, our results are very similar to column 1, though the results are attenuated after match-
ing, consistent with the treatment effect being stronger for larger NPOs.25 In untabulated analysis, we repeat
24 This matching approach provides us with a more balanced sample with respect to both size and number of observa-
tions. 25 In untabulated analyses, we do not find that the switching results are stronger in December fiscal year-end entities, in
contrast to the pricing results. We note that this lack of a result is consistent with December year-end entities having
Electronic copy available at: https://ssrn.com/abstract=3020316

24
our tests on the subset of NPOs engaging auditors outside the Big 4 and the results remain significant, indi-
cating that switching after SOX is not limited to clients of Big 4 auditors (e.g., Feng and Elder 2017).
Collectively, our results suggest that the demand shock for public company auditors caused by SOX,
combined with a labor inelasticity, significantly affected both private companies and NPOs. Specifically,
private companies reduced their production of attested financial reports, while NPOs whose auditors became
busy with SOX either paid higher audit fees or switched auditors (or both). These findings are consistent with
the supply of auditors being sufficiently common that one segment of audit consumers is highly sensitive to
the demand shocks experienced by other segments of audit consumers.
4. Long-run Effects: Market Separation and Aggregate Market Consequences
4.1 Market separation
The consequences documented in the prior section could be temporary because they stem from a
demand shock and a short-run labor inelasticity. However, as noted in Section 1, SOX Title I altered the
nature of auditing regulation, potentially creating longer-run implications. We test for two changes to the
audit market: across- and within- audit firm specialization. To test for across-firm separation, we first model
the propensity of NPOs to have public company specialist auditors in the first year of our sample (2000) and
then use the parameters of this model to predict matches in future years. The idea behind this test is that if
the market structure did not change over time, then the predictive ability of the model should perform simi-
larly each year.26
To operationalize our tests, we exploit differential regulatory effects of SOX across auditors. As part
of SOX, the PCAOB established an inspection regime which affected auditors differently according to their
more difficulty switching auditors unconditionally because other audit firms—who are also busy with their December
year-end clients—do not want to accept them (Lopez and Peters 2011). These switching frictions for December FYE
NPOs are consistent with our pricing tests showing that audit price increases are higher when capacity to take them on
is most constrained (i.e., December FYE entities face the greatest price increases, which could reflect their diminished
ability to switch). 26 Our approach directly follows Fama and French (2001), who develop a parsimonious model to estimate the propensity
of companies to pay dividends over time. The key appeal of their approach is that it decomposes the aggregate trend in
company behavior into two types of changes: (1) changes because the composition of companies evolved in the econ-
omy (e.g., more high growth companies); and (2) changes because companies altered their behavior conditional on their
characteristics (e.g., large companies became less likely to pay dividends).
Electronic copy available at: https://ssrn.com/abstract=3020316

25
exposure to public companies. Auditors with more than 100 public clients faced annual (as opposed to trien-
nial) PCAOB inspections and greater overall scrutiny (Lennox and Pittman 2010).27 These are the audit firms
we expect were most affected by the regulatory regime shift and resulting fixed cost change. We estimate a
base model using the following probit specification for the year 2000 data:
𝐴𝑢𝑑𝑖𝑡𝑜𝑟100𝑃𝑢𝑏𝑙𝑖𝑐𝐶𝑙𝑖𝑒𝑛𝑡𝑠𝑁𝑃𝑂 = 𝛽1 × 𝐿𝑛𝐴𝑠𝑠𝑒𝑡𝑠𝑁𝑃𝑂 + 𝛼𝑆𝑡𝑎𝑡𝑒 + 𝛼𝐴𝑐𝑡𝑖𝑣𝑖𝑡𝑦 𝑇𝑦𝑝𝑒 + 𝜀𝑁𝑃𝑂 (4)
The dependent variable, Auditor100PublicClients, is an indicator equal to one if the NPO uses an auditor
with 100 public clients in year t. We model this variable as a function of NPO size (adjusted for inflation),
and state and activity type fixed effects.28 We use the estimated parameters from (4) to predict the auditor
type for each NPO-year subsequent to the year 2000.
We tabulate the analysis in Table A3 of the supplemental appendix but Figure 3 summarizes the
main result. Figure 3 plots the difference in the predicted percentage of NPOs matching to public company
auditors (based on the model in (4)) relative to the actual percentage of NPOs matching to public company
auditors each year. The figure reveals that in the years leading up to 2004, the difference between the pre-
dicted and actual likelihood of matching with a public company specialist audit firm is negligible. After 2004,
the model begins performing significantly worse. Specifically, the actual number of NPOs matching to public
company auditors is significantly lower than that predicted by the model, consistent with a structural change
in the audit market. To ensure robustness of this result, Figure A5 of the supplemental appendix summarizes
two alternative specifications. The first excludes smaller NPOs, which are less likely to match with a large
auditor in the first place. The second restricts the sample to new NPOs entering the sample. In both cases,
the model’s predictions are not significantly different from the actual results until 2004. However, after 2004,
the predicted percentage of NPOs that match to public company auditors is systematically higher than the
actual percentage of NPOs that do so, and this difference persists through 2013. These results provide one
27 For example, Lennox and Pittman (2010) report that the median inspection length for audit firms with more than 100
clients is five months, compared to just four days for audit firms with fewer than 100 clients. 28 By having a parsimonious model, we are trading off a reduction in prediction noise in the model with restricting the
sample size by imposing variable requirements. NPO size is the most important characteristic, and the predictive ability
of our model as measured by the R-squared is similar to that of other auditor matching models in the nonprofit literature
(Tate 2007, Feng and Elder 2017, Harris, Tate, and Zimmerman 2017).
Electronic copy available at: https://ssrn.com/abstract=3020316
26
piece of evidence that SOX caused public company auditors to specialize in public companies and reduce
their work on NPOs.29
We next examine the second potential implication of greater market segmentation and specialization:
whether auditors serving both public companies and NPOs shifted the distribution of audit work within the
audit firm to foster specialist offices based on client type. While our results to this point highlight that public
company auditors reduced their exposure to NPOs to focus on public companies, they did not completely
exit the NPO market for a variety of reasons.30 One prediction consistent with greater segmentation is that
because SOX created rules further distinguishing audits of public companies from nonpublic entities, offices
of a given auditor were more likely to focus on either public companies or NPOs, rather than diversify across
client types in each office. Such a shift would arise if distinct audit rules create economies of scale in focusing
audit labor on single client groups. In other words, the client type concentration for individual offices should
increase with the difference between audit standards for each client type.
To test this prediction, we develop two proxies for client concentration across offices. The first step
in deriving the two proxies is to compute the client mix of each office, equal to the ratio of the total assets of
NPO clients to the total assets of NPO plus public company clients.31 We then measure the dispersion in
client mix across the offices of a given audit firm in a given state. For the first measure, we use the standard
deviation of the client mix across offices. For the second measure, we identify the office with the highest
NPO client mix and the office with the lowest within an auditor-state and calculate the difference. When all
offices within an auditor-state have the same mix of NPO to public client assets, both measures equal zero
(i.e., there is no variation in client mix across offices within a state). The measures take a maximum value if
29 We note that these results do not fully identify why this shift occurs. Based on discussions with audit partners, NPOs
are less profitable than public companies because auditors bill equivalent labor at lower hourly rates. 30 Based on our conversations with audit partners of both Big 4 and mid-tier firms, this occurs for multiple reasons
including NPO size (like public companies, some NPOs are simply too big to be audited by smaller audit firms), personal
relationships (audit partners doing “favors” for board members of nonprofits who are also executives at public compa-
nies), prestige (audit firms gain prestige from auditing certain institutions, and covenant requirements (e.g., some non-
profits have debt with specific auditor requirements). Regardless of the reason, our prediction is that conditional on
having NPO clients, audit firms will concentrate clients in offices based on client type (i.e., public versus nonpublic). 31 One limitation of our approach is that our ratio cannot consider NPOs that do not appear in our dataset or other types
of non-public clients.
Electronic copy available at: https://ssrn.com/abstract=3020316

27
all offices within an auditor-state exclusively serve one client type.32 Both measures require an audit firm to
have at least two offices in a given state. We further restrict the sample to auditors with both public company
and NPO clients in that year. We aggregate the offices at the auditor-state-year level because audit clients
and audit staff typically have more mobility within a state than across states. For example, CPA licensing is
administered at the state level, which can constrain employee mobility (Cascino, Tamayo, and Vetter 2018).
Our results are similar if we do not include the geographic restriction. Our inferences also remain if we more
tightly restrict the geographic dimension to the auditor-county-year level, however this version of the test
reduces our sample thus raising generalizability issues (i.e., we require two offices for the same auditor within
a county).
We estimate the following generalized difference-in-differences model:
𝑌𝑎𝑢𝑑𝑖𝑡𝑜𝑟,𝑠𝑡𝑎𝑡𝑒,𝑡 = 𝛼𝑎𝑢𝑑𝑖𝑡𝑜𝑟 𝑥 𝑠𝑡𝑎𝑡𝑒 + 𝛼𝑡 + 𝛽1 × 𝐴𝑢𝑑𝑖𝑡𝑜𝑟𝑆𝑡𝑎𝑡𝑒404𝑎𝑢𝑑𝑖𝑡𝑜𝑟,𝑠𝑡𝑎𝑡𝑒,𝑡 + 𝜀𝑎𝑢𝑑𝑖𝑡𝑜𝑟,𝑠𝑡𝑎𝑡𝑒,𝑡 (5)
The unit of observation is auditor-state-year. AuditorState404 is the treatment variable. It is equal to one if
an auditor issues internal control attestations to public companies in a given state-year, and zero otherwise.
Table 8 presents the results of modeling our concentration measures as a function of AuditorState404
between 2000 and 2013. We find a positive and significant coefficient on AuditorState404 for both of our
office concentration measures. Once the auditor becomes involved with IC attestations, the across-office
dispersion in their client focus increases by 0.115 (0.181), an economically significant margin above the
0.257 (0.437) pre-SOX mean of our standard deviation (high minus low) variable.
Taken together, our results from Figure 3 and Table 8 document two distinct aspects of segmentation
driven by SOX. Starting in 2004, fewer NPOs match with auditors serving the public company market. The
auditors choosing to serve both public companies and NPOs are more likely to concentrate their individual
offices on a single client type.
4.2 Aggregate market consequences
32 Our measurement approach ensures a systematic decline in NPO market share cannot generate an increase in client
type dispersion. For example, if an auditor dropped 25% of its NPO clients in all of its offices, our dispersion measures
would decrease, rather than increase.
Electronic copy available at: https://ssrn.com/abstract=3020316

28
Having confirmed the significant audit supply composition change, we conclude our study by provid-
ing descriptive evidence of the aggregate effects of these shifts on NPO audit market concentration. Much
attention has been paid to the concentration of audit supply for public companies because of the very high
concentration of the Big 4 auditors, but evidence on the supply of auditors in other markets is much more
limited (GAO 2003, 2008). To examine the audit market concentration, we follow the literature and calculate
the Herfindahl-Hirschman Index (HHI) for the audit supply in the NPO market. Specifically, we use the
square of the market share, based on NPO revenue.33 In Figure 4, we plot the HHI for both the public com-
pany audit market and the NPO audit market and find opposite trends. As has been well documented, the
public market HHI increases with the demise of Arthur Andersen. By comparison, the concentration in the
NPO market does not respond to this event. Beginning with the onset of Section 404 attestation, however,
we find the HHI for NPOs substantially decreases and, by 2009 is less than half its 2003 level.34 This con-
centration level continues to decline through 2013. We also note that the long-run decline in market concen-
tration is not driven solely by the decrease in market share of Big 4 auditors. In untabulated results, we find
that the number of auditors serving at least five NPOs grew by 26% from 2003 to 2013 (from 54 to 68).
Thus, our results suggest that the public company demand shock caused auditors to reassign con-
strained labor away from NPOs to public company engagements, creating a large shift in the suppliers of
attestation. This, in turn, dramatically changed the concentration of supply.
5. Conclusion
We examine how auditing regulation targeted at public companies affects the attestation market for
nonpublic entities. If the attestation market is sufficiently common across consumer types, a demand shock
for one set of consumers will affect other consumers. We test this idea in two nonpublic entity settings:
private companies and nonprofits. Upon the enactment of Section 404 of SOX, we find that private companies
33 To provide an HHI that reflects the degree of competition in the overall audit market, we omit the largest 1% of NPOs,
which skew the data and are generally too big to be feasible clients of auditors other than the Big 4. 34 This trend in market share change occurred despite the PCAOB easing much of the public company demand shock
for fiscal years ending after November 15, 2007 by passing Auditing Standard No. 5 (see Schroeder and Hogan 2013
for discussion and analysis of AS5 in the public company setting).
Electronic copy available at: https://ssrn.com/abstract=3020316
29
reduced their consumption of attestation services. For nonprofit entities required to purchase an annual audit,
we find the audit fees of nonprofits whose auditors conducted public company audits increased by 6% more
than nonprofits whose auditors were not occupied with SOX-related engagements. These results—highlight-
ing significant spillover effects to the attestation market for unregulated entities—are important because non-
public entities also rely on attestation services for management and accessing capital markets.
Moreover, we find a significant transformation in the market for NPO audits. NPOs were less likely
to match with an auditor specializing in public company audits. Those auditors continuing to serve both
public companies and nonpublic entities increased their concentration of client types in individual offices.
Starting in 2004, the concentration of audit supply to NPOs decreased by half as NPOs turned away from
public company auditors. This finding points researchers to a potentially powerful setting in which to exam-
ine the link between concentration and competition in the audit market—an area of current interest to both
regulators and academics. This supply transformation also appears to be an acceleration of the separation in
the audit markets. That is, while the audit market was sufficiently common for a shock to one set of audit
consumers to affect another prior to the regulation, the longer run trend of audit suppliers focusing on specific
consumers (e.g., Doogar and Easley 1998; Ferguson et al. 2017) advanced because of public company regu-
lation.
Electronic copy available at: https://ssrn.com/abstract=3020316

30
References
Albuquerque, A. M., & Zhu, J. L. (2018). Has Section 404 of the Sarbanes-Oxley Act Discouraged Corporate
Investment? New Evidence from a Natural Experiment. Management Science. Forthcoming
Allee, K. D., & Yohn, T. L. (2009). The demand for financial statements in an unregulated environment: An
examination of the production and use of financial statements by privately held small businesses. The
Accounting Review, 84(1), 1-25.
American Institute of Certified Public Accountants (AICPA). (2016). Codification of Statements on Stand-
ards for Accounting and Review Services. New York, NY.
Angrist, J. D., & Pischke, J. (2009). Mostly harmless econometrics: An empiricist's companion. Princeton:
Princeton University Press.
Aobdia, D. (2017). The Impact of the PCAOB Individual Engagement Inspection Process-Preliminary Evi-
dence. The Accounting Review.
Aobdia, D. (2018). The Economic Consequences of Audit Firms’ Quality Control System Deficiencies.
Working Paper.
Aobdia, D. & Shroff, N. (2017). Regulatory oversight and auditor market share. Journal of Accounting and
Economics, 63(2-3), 262-287.
Aobdia, D., Enache L., & Srivastava A. (2019). Changes in Big N Auditors’ Client Selection and Retention
Strategies over Time. Working Paper.
Ashbaugh-Skaife, H., Collins, D. W., Kinney Jr, W. R., & LaFond, R. (2008). The effect of SOX internal
control deficiencies and their remediation on accrual quality. The Accounting Review, 83(1), 217-250.
Badertscher, B. A., Kim, J., Kinney, W., & Owens, E. L. (2017). Audit Procedures and Financial Statement
Quality: The Positive Effects of Negative Assurance.
Berger, A. N., Miller, N. H., Petersen, M. A., Rajan, R. G., & Stein, J. C. (2005). Does function follow or-
ganizational form? Evidence from the lending practices of large and small banks. Journal of Financial
Economics, 76(2), 237-269.
Berger, P. G., Minnis, M., & Sutherland, A. (2017). Commercial Lending Concentration and Bank Expertise:
Evidence from Borrower Financial Statements. Journal of Accounting and Economics, 64(2-3), 253-277.
Berger, A. N., & Udell, G. F. (2006). A more complete conceptual framework for SME finance. Journal of
Banking & Finance, 30(11), 2945-2966.
Blackwell, D. W., Noland, T. R., & Winters, D. B. (1998). The value of auditor assurance: Evidence from
loan pricing. Journal of Accounting Research, 36(1), 57-70.
Botosan, C. A., Bradshaw, M. T., Callahan, C. M., Ciesielski, J. T., Farber, D. B., Hodder, L. D., Hopkins,
P. E., Kohlbeck, M.J., Laux, B. Stober, T. L., Stocken, P. C., & Yohn, T. L., (2006). Financial accounting
and reporting standards for private entities. Accounting Horizons, 20(2), 179-194.
Bova, F., Minutti‐Meza, M., Richardson, G., & Vyas, D. (2014). The Sarbanes‐Oxley Act and Exit Strategies
of Private Firms. Contemporary Accounting Research, 31(3), 818-850.
Bradshaw, M., Bens, D. Frost, C. A., Gordon, E., McVay, S., Miller, G., Pfeiffer, R., Plumlee, M., Shake-
speare, C., Thomas, W., Wong, F. (2014). Accounting standard setting for private companies. Accounting
Horizons, 28(1), 175-192.
Brochet, F. (2010). Information content of insider trades before and after the Sarbanes-Oxley Act. The Ac-
counting Review, 85(2), 419-446.
Burks, J. J. (2015). Accounting Errors in Nonprofit Organizations. Accounting Horizons, 29(2), 341-361.
Cascino, S., Tamayo, A., & Vetter, F. (2018). Labor Market Effects of Spatial Licensing Requirements:
Evidence From CPA Mobility. Working paper.
Electronic copy available at: https://ssrn.com/abstract=3020316
31
Cassar, G., Ittner, C. D., & Cavalluzzo, K. S. (2015). Alternative information sources and information asym-
metry reduction: Evidence from small business debt. Journal of Accounting and Economics, 59(2), 242-
263.
Chang, H., Cheng C. S. A., & Reichelt K. J. (2010). Market Reaction to Auditor Switching from Big 4 to
Third-Tier Small Accounting Firms. Auditing: A Journal of Practice & Theory, 29(2), 83-114.
Charity Navigator. (2016). Giving statistics. https://www.charitynavigator.org/.
Coates, J. C., & Srinivasan, S. (2014). SOX after ten years: A multidisciplinary review. Accounting Horizons,
28(3), 627-671.
Cohen, D., Dey, A., & Lys, T. (2008). Real and accrual-based earnings management in the pre- and post-
Sarbanes-Oxley Periods. The Accounting Review, 83(3), 757-787.
Core, J. E., Guay, W. R., & Verdi, R. S. (2006). Agency problems of excess endowment holdings in not-for-
profit firms. Journal of Accounting and Economics, 41(3), 307-333.
DeFond, M. L., & Lennox, C. S. (2017). Do PCAOB inspections improve the quality of internal control
audits?. Journal of Accounting Research, 55(3), 591-627.
DeFond, M. L., & Lennox, C. S. (2011). The effect of SOX on small auditor exits and audit quality. Journal
of Accounting and Economics, 52(1), 21-40.
DeFond, M. L., & Zhang J. (2014) A review of archival auditing research. Journal of Accounting and Eco-
nomics, 58(2-3), 275-326.
Doogar R. & Easley R.F. (1998). Concentration without differentiation: A new look at the determinants of
audit market concentration. Journal of Accounting and Economics, 25(3), 235-253.
Doogar, R., Fargher N., & Hong K. P. (2007). Audit Market Contestability in the Post-Enron Era. Working
paper.
Engel, E., Hayes, R. M., & Wang, X. (2007). The Sarbanes–Oxley Act and firms’ going-private decisions.
Journal of Accounting and Economics, 44(1-2), 116-145.
Ettredge, M., Li C., & Scholz S. (2007). Audit fees and auditor dismissals in the Sarbanes-Oxley era. Ac-
counting Horizons 21(4, 371–386.
Ettredge, M., Sherwood, M., & Sun, L. (2017). Effects of SOX 404 (B) Implementation on Audit Fees by
SEC Filer Size Category. Working paper.
Fama, E. F., & French, K. R. (2001). Disappearing dividends: changing firm characteristics or lower pro-
pensity to pay?. Journal of Financial Economics, 60(1), 3-43.
Feng, N. C., & Elder, R. J. (2017). Post-SOX downward auditor switches and their impacts on the nonprofit
audit market. Journal of Accounting and Public Policy, 36(5), 379-398.
Ferguson, C., Pinnuck, M., and Skinner, D. (2017). The evolution of audit market structure and the emer-
gence of the Big N: Evidence from Australia. Working paper, Chicago Booth.
Ge, W., Koester, A., & McVay, S. (2017). Benefits and costs of Sarbanes-Oxley Section 404 (b) exemp-
tion: Evidence from small firms’ internal control disclosures. Journal of Accounting and Economics,
63(2-3), 358-384.
U.S. Government Accountability Office (GAO). (2003). Public accounting firms: Mandated study on con-
solidation and competition.
---. (2008). Audits of public companies: Continued concentration in audit market for large public companies
does not call for immediate action.
Gerakos, J., & Syverson, C. (2015). Competition in the audit market: Policy implications. Journal of Ac-
counting Research, 53(4), 725-775.
Gipper, B., Leuz, C., and Maffett, M. (2017). Public audit oversight and reporting credibility: Evidence from
the PCAOB inspection regime. Working paper, Chicago Booth.
Electronic copy available at: https://ssrn.com/abstract=3020316

32
Griffin, P. A., & Lont., D. H. (2007). An analysis of audit fees following the passage of Sarbanes-Oxley.
Asia-Pacific Journal of Accounting and Economics, 14(2), 161–192.
Harris, E., Petrovits, C. M., & Yetman, M. H. (2015). The effect of nonprofit governance on donations:
Evidence from the revised form 990. The Accounting Review, 90(2), 579-610.
Harris, E. E., Tate, S. L., & Zimmerman A. B. (2017). Does hiring a local industry specialist auditor matter
for nonprofit organizations? Working paper.
Hay D. C., Knechel W. R., & Wong N. (2006). Audit fees: A meta-analysis of the effect of supply and
demand attributes. Contemporary Accounting Research, 23(1), 141-191.
Hogan, C. E., & Martin R. D. (2009). Risk shifts in the market for audits: An examination of changes in risk
for ‘‘Second Tier’’ audit firms. Auditing: A Journal of Practice & Theory, 28(2), 93-118.
Huberman, G., & Kandel, S. (1989). Firms' fiscal years, size and industry. Economics Letters, 29(1), 69-75.
Iliev, P. (2010). The effect of SOX Section 404: Costs, earnings quality, and stock prices. The Journal of
Finance, 65(3), 1163-1196.
Iyer, V. M., & Watkins, A. L. (2008). Adoption of Sarbanes-Oxley measures by nonprofit organizations:
An empirical study. Accounting Horizons, 22(3), 255-277.
Kitching, K. (2009). Audit value and charitable organizations. Journal of Accounting and Public Policy,
28(6), 510-524.
Krishnan, R., Yetman M. H., & Yetman R. J. (2006). Expense Misreporting in Nonprofit Organizations.
Accounting Review, 81(2), 399-420.
Landsman, W. R., Nelson, K. K., & Rountree, B. R. (2009). Auditor switches in the pre-and post-Enron eras:
Risk or realignment?. The Accounting Review, 84(2), 531-558.
Lennox, C., & Pittman J. (2010). Auditing the auditors Evidence on the recent reforms to the external moni-
toring of audit firms. Journal of Accounting and Economics 49, 84-103.
Leuz, C. (2007). Was the Sarbanes-Oxley Act of 2002 really this costly? A discussion of evidence from event
returns and going-private decisions. Journal of Accounting and Economics 44, 146-165.
Leuz, C. and P. Wysocki. (2016). The economics of disclosure and financial reporting regulation: Evidence
and suggestions for future research. Journal of Accounting Research 54(2): 525-622.
Linck, J. S., Netter, J. M., & Yang T. (2008). The effects and unintended consequences of the Sarbanes-
Oxley Act on the supply and demand for directors. The Review of Financial Studies 22(8), 3287-3328.
Lisowsky, P., & Minnis, M. (2018). The Silent majority: Private U.S. firms and financial reporting choices.
Chicago Booth Research Paper,(14-01).
Lisowsky, P., Minnis, M., & Sutherland, A. (2017). Economic Growth and Financial Statement Verification.
Journal of Accounting Research, forthcoming.
López, D. M., & Peters, G. F. (2011). Auditor workload compression and busy season auditor switching.
Accounting Horizons, 25(2), 357-380.
Minnis, M. (2011). The Value of Financial Statement Verification in Debt Financing: Evidence from Private
U.S. Firms. Journal of Accounting Research, 49(2), 457-506.
Minnis, M., & Sutherland, A. (2017). Financial statements as monitoring mechanisms: Evidence from small
commercial loans. Journal of Accounting Research, 55(1), 197-233.
Pearson, T. A., Brooks R. C., & Neidermeyer, A. A. (1998). The determinants of monitoring costs in not-
for-profit organizations. Journal of Public Budgeting, Accounting & Financial Management, 10(4), 499-
514.
Petrovits, C., Shakespeare, C., & Shih, A. (2011). The causes and consequences of internal control problems
in nonprofit organizations. The Accounting Review, 86(1), 325-357.
Piotroski, J. D., & Srinivasan, S. (2008). Regulation and bonding: The Sarbanes-Oxley act and the flow of
international listings. Journal of Accounting Research, 46(2), 383-425.
Electronic copy available at: https://ssrn.com/abstract=3020316

33
Rama, D.V., & Read W. J. (2006). Resignations by the Big 4 and the Market for Audit Services. Accounting
Horizons, 20(2), 97-109.
Schroeder J.H. & Hogan C. (2013). The impact of PCAOB AS5 and the Economic Recession on Client
Portfolio Characteristics of the Big 4 Audit Firms. Auditing: A Journal of Practice and Theory, (4), 95-
127.
Securities and Exchange Commission (SEC). 2009. “Study of the Sarbanes-Oxley Act of 2002 Section 404
Internal Control of Financial Reporting Requirements.” Office of Economic Analysis.
Shroff, N. (2017) Does auditor regulatory oversight affect corporate financing and investment decisions?
MIT working paper.
Sutherland, A. (2018) Does credit reporting lead to a decline in relationship lending? Evidence from infor-
mation sharing technology. Journal of Accounting and Economics, forthcoming.
Tate, S. L. (2007). Auditor change and auditor choice in nonprofit organizations. Auditing: A Journal of
Practice & Theory, 26(1), 47-70.
Urban Institute. (2015). The Nonprofit Sector in Brief 2015.
Webb, T. Z., & Waymire, T. R. (2016). Large Sample Evidence of the Determinants of Nonprofit Monitoring
Costs: A Resource Dependence Framework. Journal of Governmental & Nonprofit Accounting, 5(1), 25-
52.
Yetman M. H., & Yetman R. J. (2012). The Effects of Governance on the Accuracy of Charitable Expenses
Reported by Nonprofit Organizations. Contemporary Accounting Research, 29(3), 738-767.
Yetman, M. H., & Yetman, R. J. (2013). Do donors discount low-quality accounting information? The Ac-
counting Review, 88(3), 1041-1067.
Zhang, I. X. (2007). Economic consequences of the Sarbanes–Oxley Act of 2002. Journal of Accounting and
Economics 44(1), 74-115.
Electronic copy available at: https://ssrn.com/abstract=3020316

34
Appendix A: Private Company Variable Definitions
Variable Definition
Unqualified Audits A financial statement audit provides positive assurance that the financial state-
ments are reported in accordance with Generally Accepted Accounting Prin-
ciples. An unqualified audit opinion indicates that the auditor believes that the
financial statements are materially in accordance with GAAP. Unqualified au-
dited financial statements are accompanied by complete footnote disclosure,
providing the most complete set of information of all of the reports along with
the highest level of assurance and no detected material deviations from GAAP.
Reviews Financial statement reviews provide negative assurance. An independent ac-
countant performs analytical procedures (e.g., ratio analyses) and interviews
management to assess whether the financial statements are misstated; how-
ever, the accountant does not perform substantive procedures to obtain posi-
tive evidence of an account balance. Reviews are generally accompanied by
complete footnote disclosure; therefore, reviewed financial statements provide
a similar information set to unqualified audits, but the information has a sig-
nificantly lower level of assurance, reporting quality, and cost.
Compilations A compilation provides no assurance about the financial statement balances
reported in the financial statements. An accountant puts the company’s finan-
cial information in the form of financial statements but performs no procedures
and provides no assurance as to the reporting quality. Compilations include all
three standard financial statements, but are not required to report (and gener-
ally omit) footnote disclosures. Therefore, compilations provide substantially
less assurance and information than either audits or reviews.
% CPA The percent of financial statements collected that are unqualified
audits, reviews, or compilations. The unit of observation is industry-region-
company size category-year.
% Unqualified The percent of financial statements collected that are unqualified
audits. The unit of observation is industry-region-company size category-year.
% Reviews The percent of financial statements collected that are reviews. The unit of ob-
servation is industry-region-company size category-year.
% Compilations The percent of financial statements collected that are compilations. The unit
of observation is industry-region-company size category-year.
Year 04-09 An indicator equal to one between 2004 and 2009.
Year 02-03 An indicator equal to one in 2002 and 2003.
Non Calendar FYE
Share
The percent of private companies within an industry with non-December fiscal
year-ends, measured in 2003 using the company-level Sageworks dataset de-
scribed in Minnis (2011). The unit of observation is industry.
Electronic copy available at: https://ssrn.com/abstract=3020316

35
Appendix B: NPO Variable Definitions
Variable Definition
Fees The fees for external accounting and audit services reported on the NPO’s Form
990 in a given year.
SwitchAuditor An indicator variable equal to one if the NPO’s auditor differs from that in the
prior year.
Auditor100Public-
Clients
An indicator variable equal to one if the NPO uses an auditor with 100 public
clients in a given year.
Big4Auditor An indicator variable equal to one if the NPO uses a Big 4 auditor in a given year.
ClientMixDispersion We use two versions of the variable:
ClientMixDispersion (Standard Deviation):
The standard deviation of the client mix across the offices of a given auditor, in a
given state, for a given year. Client mix is measured as the total assets of NPO
clients over the sum of total assets of NPO and public company clients for a given
office, for a given year.
ClientMixDispersion (Highest minus Lowest):
The difference between the highest and lowest client mix across the offices of a
given auditor, in a given state, for a given year. Client mix is measured as the total
assets of NPO clients over the sum of total assets of NPO and public company
clients for a given office, for a given year.
AuditorBusy404 We use two versions of the variable:
AuditorBusy404 (used in the Fees regression):
An indicator variable equal to one if, in a given year, the NPO’s auditor issues
internal control attestations to public companies. If the NPO’s auditor never issues
internal control attestations, then AuditorBusy404 is always zero.
Auditort-1Busy404t (used in the SwitchAuditor regression):
An indicator variable equal to one if, in a given year, the NPO’s prior year auditor
issues internal control attestations to public companies in the current year. If the
NPO’s prior year auditor never issues internal control attestations, then Auditort-
1Busy404t is always zero.
In robustness tests, we redefine both of these variables by identifying the specific
audit office in charge of the NPO audit. We measure AuditorOfficeBusy404 as
equal to one if the specific office of their auditor issues internal control attestations
to public companies.
Assets The assets reported on the NPO’s Form 990 in a given year.
Non Calendar FYE An indicator variable equal to one if the fiscal year-end of the NPO does not end
in December.
AuditorState404 An indicator variable equal to one if an auditor issues internal control attestations
to public companies in a given state, in a given year.
Electronic copy available at: https://ssrn.com/abstract=3020316
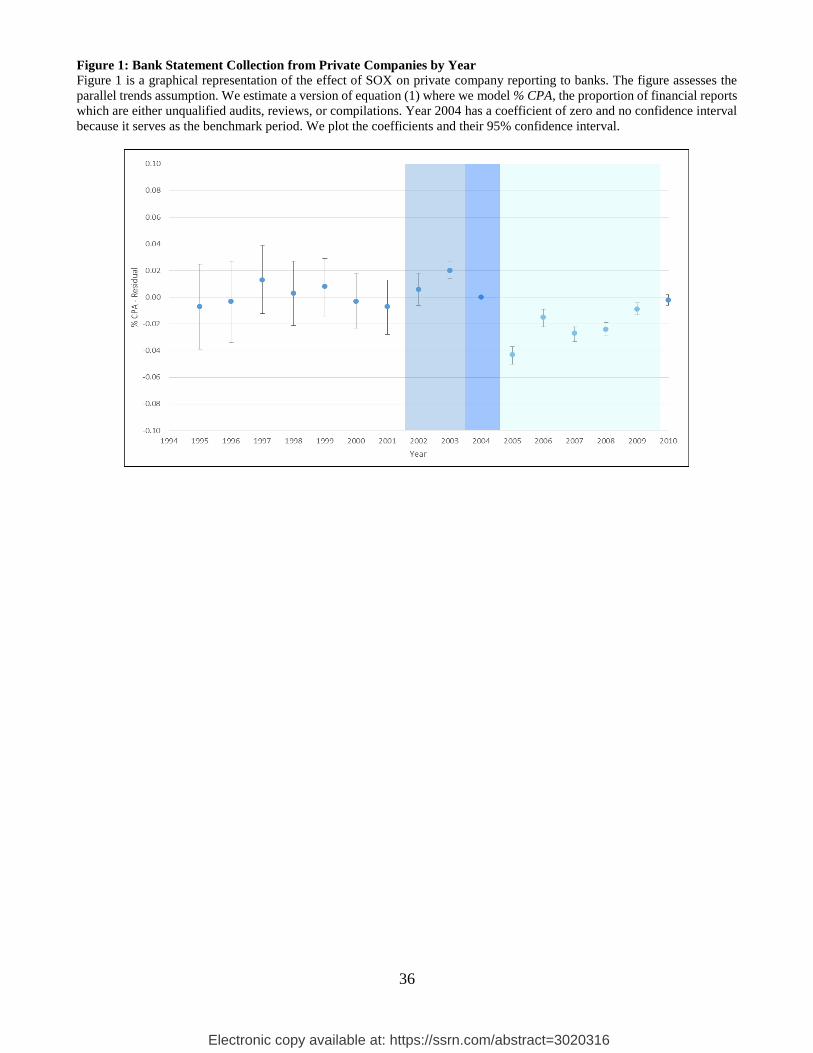
36
Figure 1: Bank Statement Collection from Private Companies by Year
Figure 1 is a graphical representation of the effect of SOX on private company reporting to banks. The figure assesses the
parallel trends assumption. We estimate a version of equation (1) where we model % CPA, the proportion of financial reports
which are either unqualified audits, reviews, or compilations. Year 2004 has a coefficient of zero and no confidence interval
because it serves as the benchmark period. We plot the coefficients and their 95% confidence interval.
Electronic copy available at: https://ssrn.com/abstract=3020316

37
Figure 2: Audit Price Treatment Effect in Event Time
Figure 2A
Figure 2A is a graphical representation of the difference-in-differences analysis of the effect of SOX on audit price in
the nonprofit sector. We estimate equation (2) but replace the AuditorBusy404 indicator variable with separate indi-
cator variables, each marking one year over the t−4 to t+5 period relative to t=0, which is the first year an NPO’s
auditor issues internal control attestations to public companies. Period t-1 has a coefficient of zero and no confidence
interval because it serves as the benchmark period. We plot the coefficients and their 95% confidence interval. These
coefficients capture the difference of the realized outcome between the treatment and control groups, in event time.
Figure 2B
Figure 2B is a graphical representation of the difference-in-differences analysis of the likelihood of switching auditor in the
nonprofit sector. We estimate equation (3) but replace the Auditort-1Busy404NPO,t indicator variable with separate indicator
variables, each marking one year over the t−3 to t+5 period relative to t=0, which is the first year an NPO’s prior year auditor
issues internal control attestations to public companies. Period t-1 has a coefficient of zero and no confidence interval because
it serves as the benchmark period. We plot the coefficients and their 95% confidence interval. These coefficients capture the
difference of the realized outcome between the treatment and control groups, in event time.
Electronic copy available at: https://ssrn.com/abstract=3020316
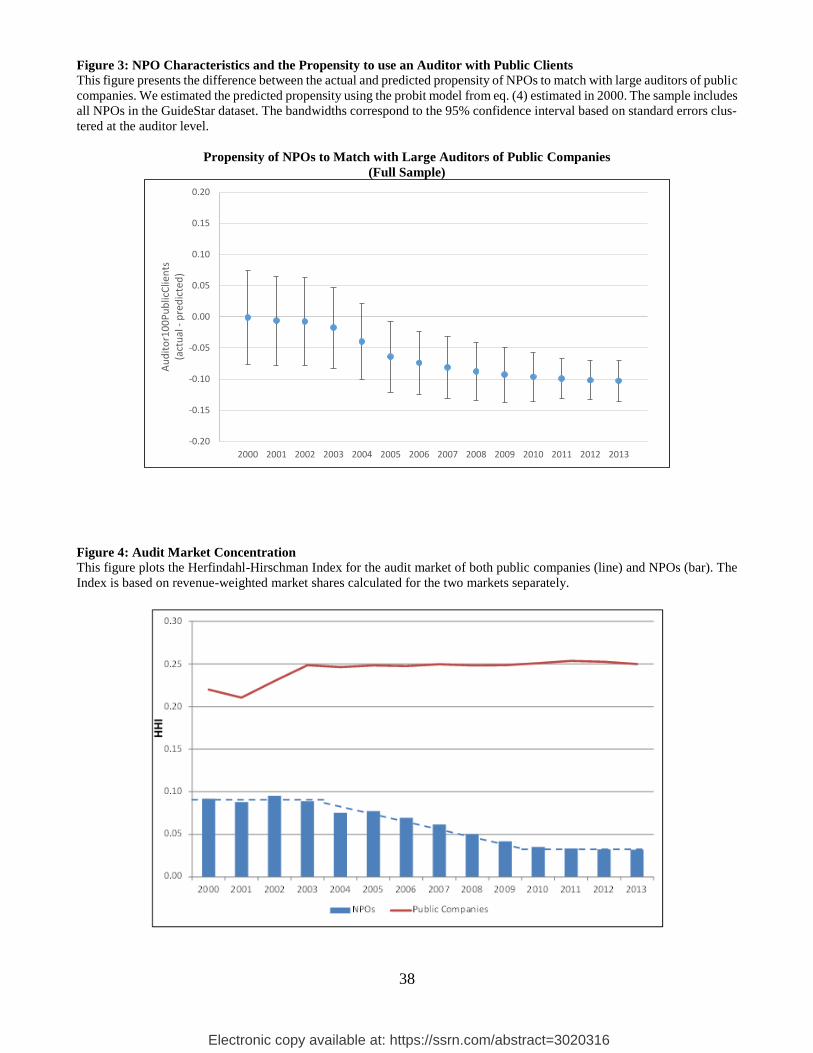
38
Figure 3: NPO Characteristics and the Propensity to use an Auditor with Public Clients
This figure presents the difference between the actual and predicted propensity of NPOs to match with large auditors of public
companies. We estimated the predicted propensity using the probit model from eq. (4) estimated in 2000. The sample includes
all NPOs in the GuideStar dataset. The bandwidths correspond to the 95% confidence interval based on standard errors clus-
tered at the auditor level.
Propensity of NPOs to Match with Large Auditors of Public Companies
(Full Sample)
Figure 4: Audit Market Concentration
This figure plots the Herfindahl-Hirschman Index for the audit market of both public companies (line) and NPOs (bar). The
Index is based on revenue-weighted market shares calculated for the two markets separately.
-0.20
-0.15
-0.10
-0.05
0.00
0.05
0.10
0.15
0.20
1999 2000 2001 2002 2003 2004 2005 2006 2007 2008 2009 2010 2011 2012 2013 2014
Au
dit
or1
00
Pu
blic
Clie
nts
(act
ual
-p
red
icte
d)
Electronic copy available at: https://ssrn.com/abstract=3020316
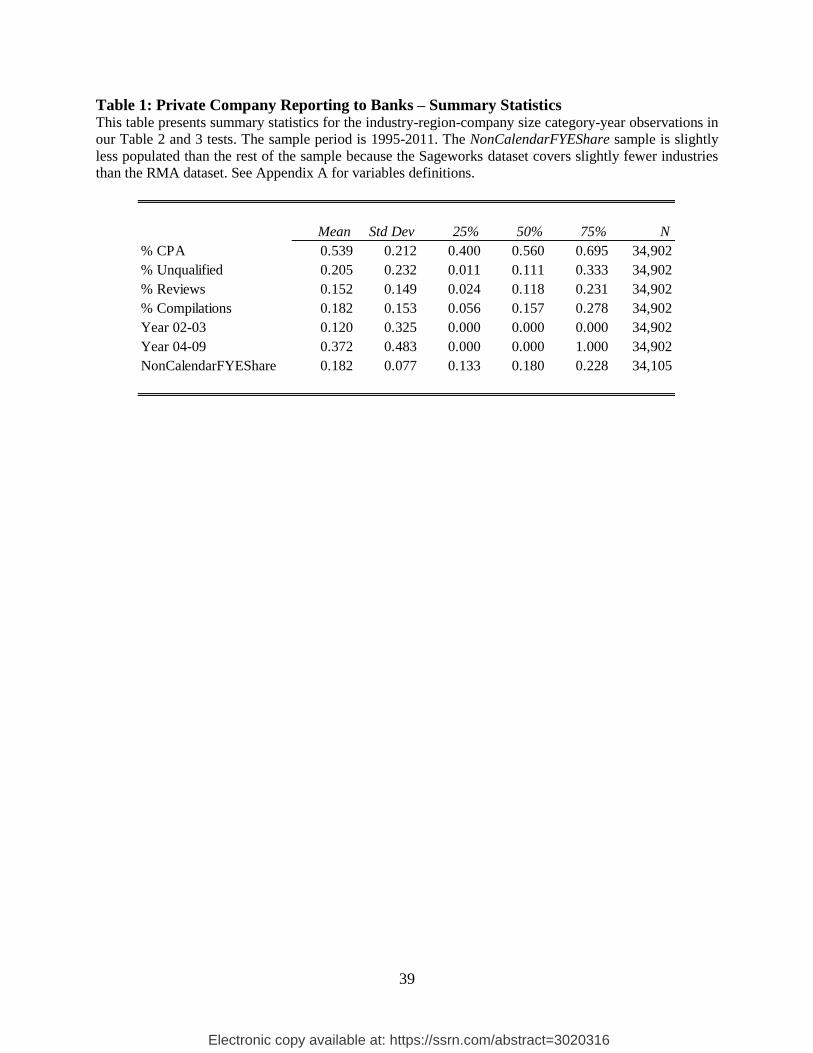
39
Table 1: Private Company Reporting to Banks – Summary Statistics This table presents summary statistics for the industry-region-company size category-year observations in
our Table 2 and 3 tests. The sample period is 1995-2011. The NonCalendarFYEShare sample is slightly
less populated than the rest of the sample because the Sageworks dataset covers slightly fewer industries
than the RMA dataset. See Appendix A for variables definitions.
Mean Std Dev 25% 50% 75% N
% CPA 0.539 0.212 0.400 0.560 0.695 34,902
% Unqualified 0.205 0.232 0.011 0.111 0.333 34,902
% Reviews 0.152 0.149 0.024 0.118 0.231 34,902
% Compilations 0.182 0.153 0.056 0.157 0.278 34,902
Year 02-03 0.120 0.325 0.000 0.000 0.000 34,902
Year 04-09 0.372 0.483 0.000 0.000 1.000 34,902
NonCalendarFYEShare 0.182 0.077 0.133 0.180 0.228 34,105
Electronic copy available at: https://ssrn.com/abstract=3020316

40
Table 2: SOX and Reporting Practices of Private Companies This table models financial statement collection by banks as a function of time. The dependent variable is
% CPA, the proportion of financial reports which are either unqualified audits, reviews, or compilations.
Year 04-09 and Year 02-03 are indicators for observations in those respective years. Non Calendar FYE
Share is the industry’s decile of percent of private companies with a non-December fiscal year-end. The
sample spans 1995-2011. The unit of observation is industry-region-company size category-year. Reported
below the coefficients are t-statistics calculated with standard errors clustered at the industry level. *, **,
*** indicate significance at the two-tailed 10%, 5% and 1% levels, respectively. See Appendix A for vari-
able definitions.
(1) (2) (3) (4)
% CPA % CPA % CPA % CPA
Year 04-09 -0.022*** -0.019*** -0.038***
[-7.15] [-5.05] [-7.49]
Year 02-03 0.014***
[2.72]
Year 04-09 * Non Calendar FYE Share 0.003*** 0.003**
[3.08] [2.20]
Adj R-Sq. 0.781 0.781 0.782 0.792
N 34,902 34,902 34,105 34,105
Linear Trend Yes Yes Yes No
Industry FEs Yes Yes Yes Yes
Region FEs Yes Yes No Yes
Size Category FEs Yes Yes No Yes
Sector x Year FEs No No No Yes
Clustering Industry Industry Industry Industry
Electronic copy available at: https://ssrn.com/abstract=3020316

41
Table 3: SOX and Reporting Practices of Private Companies by Statement Type This table models financial statement collection by banks as a function of time. The dependent variable in
column 1 (2, 3) is % Unqualified (% Reviews, % Compilations). Year 04-09 is an indicator for observations
in those respective years. The sample spans 1995-2011. The unit of observation is industry-region-company
size category-year. Reported below the coefficients are t-statistics calculated with standard errors clustered
at the industry level. *, **, *** indicate significance at the two-tailed 10%, 5% and 1% levels, respectively.
See Appendix A for variables definitions.
(1) (2) (3)
% Unqualified % Reviews % Compilations
Year 04-09 -0.001 -0.008*** -0.029***
[-0.36] [-2.90] [-8.36]
Year 04-09 * Non Calendar FYE Share 0.000 0.000 0.002***
[0.06] [0.97] [4.32]
Adj R-Sq. 0.826 0.673 0.604
N 34,105 34,105 34,105
Linear Trend Yes Yes Yes
Industry FEs Yes Yes Yes
Region FEs Yes Yes Yes
Size Category FEs Yes Yes Yes
Clustering Industry Industry Industry
Electronic copy available at: https://ssrn.com/abstract=3020316
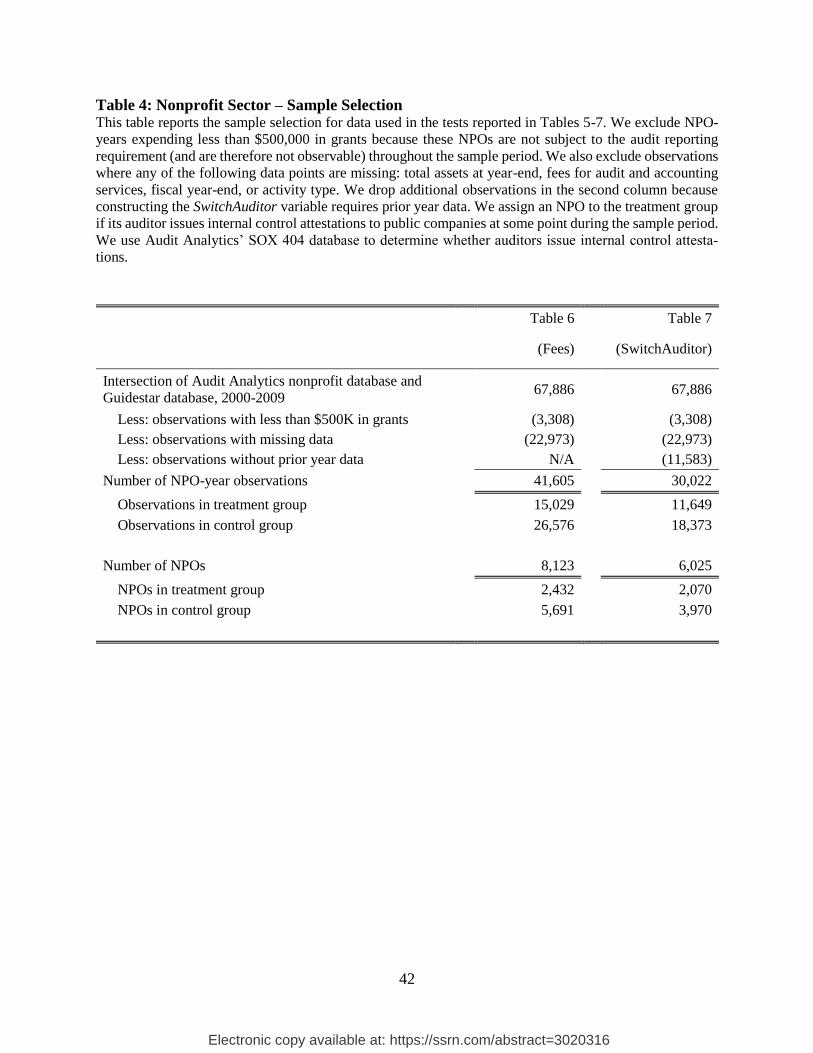
42
Table 4: Nonprofit Sector – Sample Selection This table reports the sample selection for data used in the tests reported in Tables 5-7. We exclude NPO-
years expending less than $500,000 in grants because these NPOs are not subject to the audit reporting
requirement (and are therefore not observable) throughout the sample period. We also exclude observations
where any of the following data points are missing: total assets at year-end, fees for audit and accounting
services, fiscal year-end, or activity type. We drop additional observations in the second column because
constructing the SwitchAuditor variable requires prior year data. We assign an NPO to the treatment group
if its auditor issues internal control attestations to public companies at some point during the sample period.
We use Audit Analytics’ SOX 404 database to determine whether auditors issue internal control attesta-
tions.
Table 6 Table 7
(Fees) (SwitchAuditor)
Intersection of Audit Analytics nonprofit database and
Guidestar database, 2000-2009 67,886 67,886
Less: observations with less than $500K in grants (3,308) (3,308)
Less: observations with missing data (22,973) (22,973)
Less: observations without prior year data N/A (11,583)
Number of NPO-year observations 41,605 30,022
Observations in treatment group 15,029 11,649
Observations in control group 26,576 18,373
Number of NPOs 8,123 6,025
NPOs in treatment group 2,432 2,070
NPOs in control group 5,691 3,970
Electronic copy available at: https://ssrn.com/abstract=3020316

43
Table 5: Nonprofit Sector – Summary Statistics This table reports summary statistics for variables used in the tests reported in Tables 6 and 7. Panel A
reports statistics for variables used in our difference-in-differences analysis of the effect of SOX on audit
price in the nonprofit sector. We assign an NPO to the treatment group if its auditor issues internal control
attestations to public companies at some point during the sample. Panel B reports statistics for variables
used in the difference-in-differences analysis of the effect of SOX on the likelihood of switching auditor in
the nonprofit sector. We assign an NPO to the treatment group if, at some point during the sample period,
its prior year auditor issues internal control attestations to public companies in the current year (i.e., re-
gardless of whether the NPO stays with that auditor). We winsorize the continuous variables at the 1st and
99th percentile. See Appendix B for variables definitions. Panel A: Summary statistics for variables used in the test reported in Table 6
Panel B: Summary statistics for variables used in the test reported in Table 7
Variable Mean Std Dev 25% 50% 75% N
Fees 98,459 125,157 25,544 54,785 113,602 15,029
Assets ($ thousands) 144,294 299,102 4,320 19,480 115,020 15,029
Non Calendar FYE 0.79 0.40 1 1 1 15,029
Fees 31,831 51,108 10,900 19,160 34,551 26,576
Assets ($ thousands) 12,143 53,412 1,248 3,122 7,745 26,576
Non Calendar FYE 0.72 0.45 0 1 1 26,576
Treatment group
Control group
Variable Mean Std Dev 25% 50% 75% N
SwitchAuditor 0.09 0.29 0 0 0 11,649
Assets ($ thousands) 159,595 327,801 4,692 24,481 130,963 11,649
Non Calendar FYE 0.80 0.40 1 1 1 11,649
SwitchAuditor 0.05 0.23 0 0 0 18,373
Assets ($ thousands) 10,997 47,701 1,228 3,081 7,666 18,373
Non Calendar FYE 0.73 0.45 0 1 1 18,373
Treatment group
Control group
Electronic copy available at: https://ssrn.com/abstract=3020316

44
Table 6: The Effect of SOX on Audit Price in the Nonprofit Sector This table presents the results of our difference-in-differences analysis of the effect of SOX on audit price
in the nonprofit sector. AuditorBusy404 is equal to one during the years where an NPO’s auditor issues
internal control attestations to public companies. If an NPO’s auditor never issues internal control attesta-
tions, then AuditorBusy404 is always zero. AuditorOfficeBusy404 is a version of AuditorBusy404 coded at
the auditor office level. Non Calendar FYE is an indicator for NPOs with non-December fiscal year-ends.
In column 3, we use coarsened exact matching to balance the treatment and control groups. Our column 6
tests include interactions between AuditorBusy404 and each year, but we do not tabulate these interactions
for brevity. We base activity types on the National Taxonomy of Exempt Entities. We winsorize the con-
tinuous variables at the 1st and 99th percentile. Reported below the coefficients are t-statistics calculated
with standard errors clustered at the auditor level. *, **, *** indicate significance at the two-tailed 10%,
5% and 1% levels, respectively. See Appendix B for variables definitions.
(1) (2) (3) (4) (5) (6)
LnFees LnFees LnFees LnFees LnFees LnFees
AuditorBusy404 0.065*** 0.054*** 0.042** 0.115***
[3.69] [3.17] [2.21] [3.90]
AuditorOfficeBusy404 0.047**
[2.27]
AuditorBusy404*NonCalendarFYE -0.077***
[-2.74]
AuditorBusy404*NonCalendarFYE*2004 -0.043
[-0.86]
AuditorBusy404*NonCalendarFYE*2005 -0.093*
[-1.79]
AuditorBusy404*NonCalendarFYE*2006 -0.110**
[-2.22]
AuditorBusy404*NonCalendarFYE*2007 -0.101**
[-2.21]
AuditorBusy404*NonCalendarFYE*2008 -0.081*
[-1.86]
AuditorBusy404*NonCalendarFYE*2009 -0.020
[-0.40]
LnAssets 0.151*** 0.151*** 0.131*** 0.151*** 0.151*** 0.151***
[5.68] [5.43] [5.24] [5.43] [5.43] [4.88]
Adj R-Sq. 0.883 0.884 0.843 0.884 0.884 0.884
N 41,605 41,605 20,078 41,605 41,605 41,605
NPO x auditor FEs Yes Yes Yes Yes Yes Yes
Year FEs Yes No No No No No
Activity type x Year FEs No Yes Yes Yes Yes Yes
State x Year FEs No Yes Yes Yes Yes Yes
AuditorBusy404* year interactions No No No No No Yes
Clustering Auditor Auditor Auditor Auditor Auditor Auditor
Electronic copy available at: https://ssrn.com/abstract=3020316
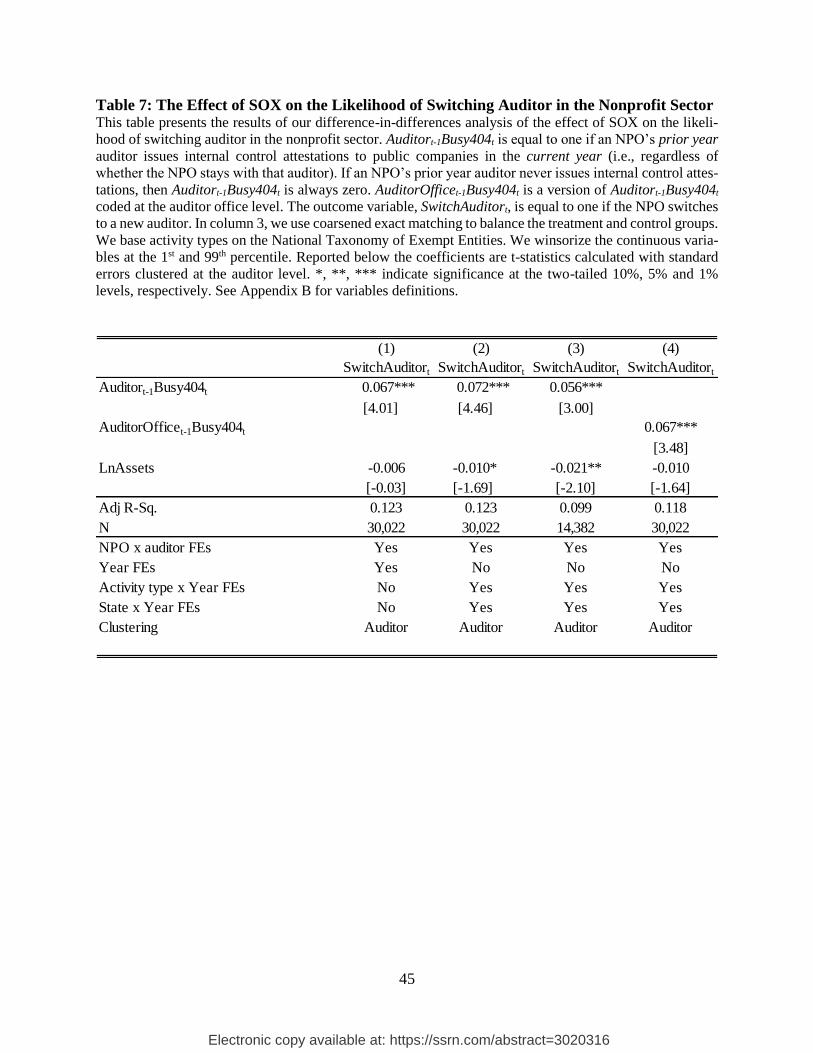
45
Table 7: The Effect of SOX on the Likelihood of Switching Auditor in the Nonprofit Sector This table presents the results of our difference-in-differences analysis of the effect of SOX on the likeli-
hood of switching auditor in the nonprofit sector. Auditort-1Busy404t is equal to one if an NPO’s prior year
auditor issues internal control attestations to public companies in the current year (i.e., regardless of
whether the NPO stays with that auditor). If an NPO’s prior year auditor never issues internal control attes-
tations, then Auditort-1Busy404t is always zero. AuditorOfficet-1Busy404t is a version of Auditort-1Busy404t
coded at the auditor office level. The outcome variable, SwitchAuditort, is equal to one if the NPO switches
to a new auditor. In column 3, we use coarsened exact matching to balance the treatment and control groups.
We base activity types on the National Taxonomy of Exempt Entities. We winsorize the continuous varia-
bles at the 1st and 99th percentile. Reported below the coefficients are t-statistics calculated with standard
errors clustered at the auditor level. *, **, *** indicate significance at the two-tailed 10%, 5% and 1%
levels, respectively. See Appendix B for variables definitions.
(1) (2) (3) (4)
SwitchAuditort SwitchAuditort SwitchAuditort SwitchAuditort
Auditort-1Busy404t 0.067*** 0.072*** 0.056***
[4.01] [4.46] [3.00]
AuditorOfficet-1Busy404t 0.067***
[3.48]
LnAssets -0.006 -0.010* -0.021** -0.010
[-0.03] [-1.69] [-2.10] [-1.64]
Adj R-Sq. 0.123 0.123 0.099 0.118
N 30,022 30,022 14,382 30,022
NPO x auditor FEs Yes Yes Yes Yes
Year FEs Yes No No No
Activity type x Year FEs No Yes Yes Yes
State x Year FEs No Yes Yes Yes
Clustering Auditor Auditor Auditor Auditor
Electronic copy available at: https://ssrn.com/abstract=3020316

46
Table 8: The Effect of SOX on Client Mix Dispersion across Offices This table presents our difference-in-differences analysis of the effect of SOX on the dispersion of the client
mix across offices. For every office-year observation, we compute client mix as the total assets of NPO
clients over the sum of total assets of NPO clients and public clients. In column 1 (2), we aggregate the
observations at the auditor-state-year level by calculating the standard deviation (difference between the
highest and lowest) of the offices’ client mix for a given auditor-state-year. AuditorState404 is equal to one
during the years where an auditor issues internal control attestations to public clients in that state. The
sample is restricted to auditors with both NPO and public clients. The unit of observation is auditor-state-
year and we only include observations with at least two offices in a given auditor-state-year. Reported
below the coefficients are t-statistics calculated with standard errors clustered at the auditor level. *, **,
*** indicate significance at the two-tailed 10%, 5% and 1% levels, respectively. See Appendix B for vari-
ables definitions.
Client Mix Dispersion
(1) (2)
Standard Deviation Highest Minus Lowest
AuditorState404 0.115*** 0.181***
[5.86] [5.78]
Adj R-Sq. 0.556 0.559
N 2,107 2,107
Auditor x state FEs Yes Yes
Year FEs Yes Yes
Clustering Auditor Auditor
Unit of observation Auditor-state-year Auditor-state-year
Electronic copy available at: https://ssrn.com/abstract=3020316