Embed Size (px)
Citation preview

Regulatory policy and the location of
bio-pharmaceutical FDI in Europe
Pamina Koenig, Megan Macgarvie
To cite this version:
Pamina Koenig, Megan Macgarvie. Regulatory policy and the location of bio-pharmaceuticalFDI in Europe. PSE Working Papers n2009-11. 2009. <halshs-00566800>
HAL Id: halshs-00566800
https://halshs.archives-ouvertes.fr/halshs-00566800
Submitted on 17 Feb 2011
HAL is a multi-disciplinary open accessarchive for the deposit and dissemination of sci-entific research documents, whether they are pub-lished or not. The documents may come fromteaching and research institutions in France orabroad, or from public or private research centers.
L’archive ouverte pluridisciplinaire HAL, estdestinee au depot et a la diffusion de documentsscientifiques de niveau recherche, publies ou non,emanant des etablissements d’enseignement et derecherche francais ou etrangers, des laboratoirespublics ou prives.

WORKING PAPER N° 2009 - 11
Regulatory policy and the location
of bio-pharmaceutical FDI in Europe
Pamina Koenig
Megan MacGarvie
JEL Codes: F23, I18 Keywords: Pharmaceutical industry, location choices,
price regulations, discrete choice model
PARIS-JOURDAN SCIENCES ECONOMIQUES
LABORATOIRE D’ECONOMIE APPLIQUÉE - INRA
48, BD JOURDAN – E.N.S. – 75014 PARIS TÉL. : 33(0) 1 43 13 63 00 – FAX : 33 (0) 1 43 13 63 10
www.pse.ens.fr
CENTRE NATIONAL DE LA RECHERCHE SCIENTIFIQUE – ÉCOLE DES HAUTES ÉTUDES EN SCIENCES SOCIALES ÉCOLE NATIONALE DES PONTS ET CHAUSSÉES – ÉCOLE NORMALE SUPÉRIEURE

Regulatory Policy and the Locationof Bio-Pharmaceutical FDI in Europe∗.
Pamina Koenig† Megan MacGarvie‡
Abstract
This paper examines the relationship bewteen cross-country differences in drugprice regulation and the location of biopharmaceutical Foreign Direct Investment (FDI)in Europe. We use a theoretically-grounded location-choice model and data on 294 invest-ments initiated in 27 European countries between 2002 and 2006 to test the hypothesisthat biopharmaceutical companies are less likely to locate new investments in countrieswith more stringent price regulation.
JEL Codes: F23, I18.
Keywords: pharmaceutical industry, location choices, price regulations, discrete choice model
∗This paper was prepared for the NBER Location of Biopharmaceutical Activity Conference. We thankFabrice Hatem and the Agence Francaise des Investissements Internationaux (AFII) for providing the FDI data.We are grateful to Iain Cockburn, Mercedes Delgado, Jeff Furman, Margaret Kyle, Keith Maskus, Thierry Mayerand Sam Thompson for helpful suggestions. Vanessa Wong and Abby Bourgeois provided excellent researchassistance.†University of Paris West and Paris School of Economics, 48 bd Jourdan, 75014 Paris, France. Email:
[email protected]‡Boston University and NBER, Boston University School of Management, 595 Commonwealth Ave, Boston,
MA 02215. Email: [email protected]
1

1 Introduction
As part of the broader debate over the extent of and reasons for international outward invest-
ment, pharmaceutical firms’ decisions to invest abroad are at the center of public attention in
Europe. The crucial question in this debate is whether rich countries can remain an attrac-
tive location for manufacturing firms when confronted with fierce competition from low-wage
countries. A frequent response by economists to concerns about such off-shoring is that rich
countries have a comparative advantage in high-tech skill-intensive industries, and that outflows
of traditional manufacturing will be compensated for by inflows or creation of innovation-based
manufacturing plants. The pharmaceutical industry is one example of this type of industry.
The pharmaceutical industry is among the most regulated in the world. Regulation takes
the form of strong safety norms with certification processes for drugs, intellectual property
rights, and price control mechanisms. Governments justify price regulation as a means to pro-
mote equity in access to drugs and reduce costs to national health care systems. However,
the enforcement of such regulation measures is complex because of their possible indirect con-
sequences on other aspects of the pharmaceutical market, such as the choice of the country
in which companies plan to invest in new production or research facilities. Indeed, several
scenarios can be put forward, among which the negative effect of price regulations on firms
location decisions. For example, it has been documented that in countries with more stringent
price regulations, drug launches are delayed (Danzon 2004; Kyle 2006 and 2007a). In the case
the product is first launched in the production country, firms would want to avoid regulated
countries. It has been suggested that pharmaceutical firms respond to controversial policy
choices by “voting with their feet” in choosing locations. Most recently, Merck was said to
be “re-evaluating” its investment in Brazil after that country imposed compulsory licensing on
efavirenz, Merck’s anti-retroviral AIDS drug. (The Economist, May 10 2007, “Brazil’s AIDS
Program: A conflict of goals”).
In this project, we investigate the determinants of the locations of foreign investments in
the bio-pharmaceutical sector in 27 European countries between 2002 and 2006. We investigate
whether variation in policy regimes across countries helps explain variation in the locations of
foreign investments in the pharmaceutical sector.
Our empirical model draws on the literature on location choices in foreign investment.
Carlton (1983) was the first paper to use a discrete choice model to study choice of production
sites by firms. The subsequent literature analyzed location choices of FDI with the traditional
elements of the expected profit in each location, some studies however including a more complete
form of demand with the income of contiguous locations (Head, Ries and Swenson, 1999).
The new trade theory and the new economic geography literatures provide a foundation for
2

the empirical analysis of location choices directly issued from theoretical predictions. Head
and Mayer (2004) construct a demand variable taking into account the surrounding export
destinations as well as the location of competitors, based on the modeling of Krugman (1992).
They establish a clear link between the theory of location choice and the predictions derived
from their econometric model.
A set of contributions have investigated the influence of public policies on the decision
to locate in different countries. Head, Ries and Swenson (1999) study the influence of US
states’ incentives on the decisions of Japanese affiliates to locate within the United States.
Crozet, Mayer and Mucchielli (2004) analyze whether regional policies have an effect on location
patterns within France, while Devereux, Griffith and Simpson (2007) apply similar methods to
the English case. Those papers end up with mixed evidence of the impact of public policies.
In this paper, we present the first evidence of the impact of regulatory constraints on the
location choice of affiliates by multinational pharmaceutical firms. In the following, we use
the theoretically grounded location-choice model from Head and Mayer (2004) to quantify
the role of domestic regulatory policies as an additional determinant of the location choice of
pharmaceutical firms.
The paper is structured as follows. Section 2 describes the regulatory policy schemes in the
pharmaceutical industry in Europe. Section 3 presents the theoretical model and its empirical
implementation. In section 4 we present the investment data , section 5 explains the results
and section 6 concludes.
2 Regulatory policy and investment in the pharmaceu-
tical industry
The pharmaceutical industry is perhaps the industry most affected by regulatory choices. Poli-
cies concerning the duration and strength of exclusivity awarded by patents are particularly
important. The latter policies are essentially consistent across European countries (although
the pharmaceutical industry has expressed concern over the enforcement of these rights in some
countries), as are policies relating to advertising, wholesale distribution, packaging and label-
ing of drugs. These homogenenized policies are by definition not expected to influence the
profitability of the different countries. This is however not the case in the medical sector. As
discussed at length by Permanand and Mossialos (2005), “Despite the harmonizing imperative
of the SEM, there is still no single European market in medicines.” European countries retain
control over the pricing of drugs and reimbursement of expenditures. Countries vary in the
use of reference pricing, fixed pharmacy profit margins, profit controls for manufacturers, as
3

well as along other dimensions (see Table 2 of Kyle (2007a)). Countries also vary in their
attitudes to parallel trade, or the re-importation of drugs from countries in which prices are
lower. All EU countries exert some degree of influence over expenditures on drugs marketed
within their boundaries, but individual governments employ different policies. Governments
may use formularies (lists of drugs for which patients will be reimbursed), controls on doctors’
prescribing behavior, pharmacists, reimbursements of prescription costs, and/or price controls.
A common mechanism for controlling prices is to set a price not higher than that of a currently
available generic substitute, or to set the price with reference to prices of the same drug in
neighboring countries. Some countries (like Spain and the UK) place controls on the profits
of pharmaceutical companies. Others, like Denmark, do not control the price charged by the
manufacturer, but prohibit price increases after a drug is introduced. Many EU countries also
regulate the profit margins of pharmacists. Some countries (like Belgium, France, Spain and
the UK) also regulate expenditures on drug marketing.
Our empirical investigation concentrates on the following price regulation policies, which
we now define: price controls, reference pricing, therapeutic reference pricing, in each of which
price freezes and price cuts can be introduced. Detailed information on the use of these polices
in different countries is available in Tables (1) and (2).
Price controls refer to policies that directly control either the manufacturer price or the price
reimbursed by the national health service. Reference pricing is a practice in which governments
set a maximum reimbursement amount for drug purchases with reference to prices of substitute
drugs. Under reference pricing regimes, the price charged by manufacturers is not directly con-
trolled. Danzon (2001) notes that it has typically been used in countries without price controls,
and is seen as a less stringent alternative to explicit price controls. However, Danzon notes, “In
practice, certain forms of reference pricing can be de facto at least as stringent. . . particularly
for new products.” The stringency of reference pricing largely depends on which drugs are used
for reference. In some cases, only generic equivalents with the same active ingredient fall into
the reference group. In other cases, the reference group consists of any therapeutic substitute
on the market, and the drug’s prices in other countries are taken into consideration. Most, but
not all, countries exempt patented drugs from reference pricing schemes. As Danzon notes,
“The decision whether to include on-patent products and to cluster on-patent products with
off-patent products raises a critical trade-off between cost control and incentives for R&D, in
addition to the issues of therapeutic substitutability.” These two forms of price setting for reim-
bursement will be respectively denoted RP (reference pricing) and TRP (therapeutic reference
pricing) in the empirical section of this paper. Germany exempted patented drugs from its
reference pricing scheme in 1996. However, in 2004 this exemption was removed, causing the
sales of a number of on-patent drugs to fall dramatically. This policy shift was preceded in
4

2003 by a 16% reduction in reimbursed prices on patented medicines. Denmark expanded the
scope of its reference pricing program in 2005, moving from one in which reference pricing was
only used when generic equivalents were available to one that incorporates therapeutic equiva-
lents. A similar shift took place in Hungary in 2003 for statins (a class of drugs used to lower
cholesterol).
These differences of regulations across countries are likely to be of great concern in the case
their application has side-effects for instance on the location of FDI. In theory, all connections
between the investment of a firm in country i and the application of policy regulations on drug
prices are conceivable.
One could first predict a negative effect of regulations on the investment decision, specifi-
cally in situations in which the product is launched in the production country. Firms choose
investments locations to maximize profits, which are lower in regulated countries. Firms are
also likely to react to countries’ policies by choosing to invest elsewhere. Pharmaceutical com-
panies have often threatened to reduce investment in reaction to policy changes. In response to
reform proposals in 2002, the Pharma Marketletter reported that the pharmaceutical company
Merck KGaA“warned that the reforms could . . . influence where it locates a new 300-million
euro biopharmaceticals product plant, its largest-ever investment.” Die Welt reported on Au-
gust 25, 2003 that “the american pharmaceutical firm Pfizer plans to reduce certain activities
in Germany following upcoming reforms to the health system. Pfizer has decided to transfer an
R&D group from Freiburg, Germany to the United Kingdom. 150 jobs will be affected by this
decision.” As one of the largest markets in Europe, actions taken by Germany may affect other
markets in two ways. Prices for drugs charged in Germany may be factored into other coun-
tries’ reference pricing calculations, and lower prices in Germany lead to lower prices elsewhere.
Secondly, Germany’s policy changes may have been viewed by the pharmaceutical industry
and other regulators as a test case - if the industry did not react strongly to the change, such
changes may have appeared more attractive in other countries. Pharma Marketletter quoted a
Merrill Lynch analyst who pointed out the potential snowball effects of Germany’s change in
policy, asking, “what’s to stop France and Italy following guidance from Germany?” 1.
In the case pharmaceutical firms serve all regional markets, whatever the production country
of the drug, one could also model the absence of relationship between price regulations and
investments decisions. Finally, a positive impact of regulations on the location of FDI could
also be envisioned, if investing firms reach a favorable application of the regulations in the
country in which they choose to locate. Evidence on how regulatory policies might influence
the decision-making of pharmaceutical firms is given by a number of papers. Kyle (2007a), in a
1”Govt drug price controls continue to threaten Europe’s pharma industry”, Pharma Marketletter, December23, 2002
5

detailed analysis of international drug launch strategies, shows that drug launches are delayed in
countries with price controls. With a focus on developing countries, Lanjouw (2005) shows that
drugs are launched earlier in countries with stronger enforcement of Intellectual Property Rights
(IPRs). On the other side, Ahlering (2004), in a study of the relationship between regulatory
and policy variables in a particular country and the share of a pharmaceutical company’s
employment in that country, finds little relationship between employment in a country and such
factors as intellectual property protection (using the Ginarte-Park index to measure the strength
of IP), drug approval times, corporate tax rates, and R&D incentives. Ahlering does, however,
find evidence of a positive relationship between the number of price control mechanisms in a
country and the share of a company’s employment in that country.
Changes like those that took place in Germany are a key element of this study. Most
countries do not change their regulatory policies during the time frame of our sample. For
example, all of the countries with explicit price controls in our sample maintain these controls
throughout the time frame. As a result, it may be difficult to separate the effects of these
invariant policy choices from unobserved, invariant characteristics of the country. However,
countries that change their policies during the sample period provide an opportunity to examine
investment patterns before and after the change. The change in Germany’s reference pricing
scheme is one such opportunity. Other changes to reference pricing schemes during our period
took place in Denmark, Hungary, Spain, and Portugal. Additional variation in the drug price
policy environment can be obtained from price freezes that were instituted in several countries
during our period. Tables (3) and (4) lists all the policy changes relevant to this paper2.
3 The model and the empirical strategy
Following Head and Mayer (2004), we sketch a monopolistic competition trade model a la Dixit
and Stiglitz (1977). This model allows to derive a linear-in-logs estimable equation relating the
profitability in a potential location to the main determinants of FDI for the pharmaceutical
industry. Consider firms from the pharmaceutical industry, located in country i. Each firm
produces one variety, which is in our case associated to a particular pharmaceutical product.
Demand for a pharmaceutical product produced in country i from a consumer in country j is
expressed as
2An increasingly important and controversial factor in the pricing of drugs in the EU is parallel trade, orthe re-export of drugs from low-price countries (like Spain, Portugal and Greece). While parallel trade has thepotential to lead to price compression within the EU (and has been found to do so in non-drug markets ), Kyle(2007b) shows that in fact parallel trade has had little impact on drug prices, due in part to strategic responsesby pharmaceutical companies.
6

qij =p−σij∑R
r=1 nrp1−σrj
Yj, (1)
where Yj is the pharmaceutical consumption in country j, pij is the delivered price of the
pharmaceutical product produced in i and consumed in j, and σ > 1. The delivered price is
the factory price pi in the home country multiplied by the unit trade cost τij. We assume that
trade costs comprise all distance and time-related costs of transporting goods.
We want to write the profit that a firm choosing to locate in country r would earn. Firms
maximize profits and fix a resulting factory price that is a very simple expression over marginal
cost: pr = σσ−1
cr, with cr being the marginal cost in country r.
Incorporating the equilibrium price in the demand equation, we obtain the quantity that a
firm producing in i would ship to each destination j:
qij =σ − 1
σ
(ciτij)−σ∑R
r=1 nr(crτrj)1−σ
Yj, (2)
where Gj =∑R
r=1 nr(crτrj)1−σ is the price index in country j. We now replace the equi-
librium price and quantity in the gross profit earned in country j, πij = piτijqij − ciτijqij =
(pi − ci)τijqij, to get
πij =(ciτij)
1−σ
σGj
Yj. (3)
The profit earned by selling in country j is naturally an increasing function of the size of
demand in j, represented by the consumption Yj. The firm will get a share of that aggregate
demand, which depends on the final price paid by consumers in j (the numerator) and on a
measure of its competitors’ prices (the denominator). The lower the costs of production (ci)
or transaction costs (τij) of the producing firm in i, and the higher the costs of its competitors
(high Gj), the higher its operating profit.
The profit earned in a location r where the firm could locate is equal to the sum of operating
profits in all markets to which the firm could export from r (including r), minus the fixed cost
F necessary to establish a plant in country r, which we assume is invariant across countries.
Πr =(cr)
1−σ
σ
∑j
(τrj)1−σ
Gj
Yj − F (4)
Following Head and Mayer (2004), we express the net profit as a function of the Krugman
market potential in r, Mr:
Πr =(cr)
1−σ
σMr − F (5)
7
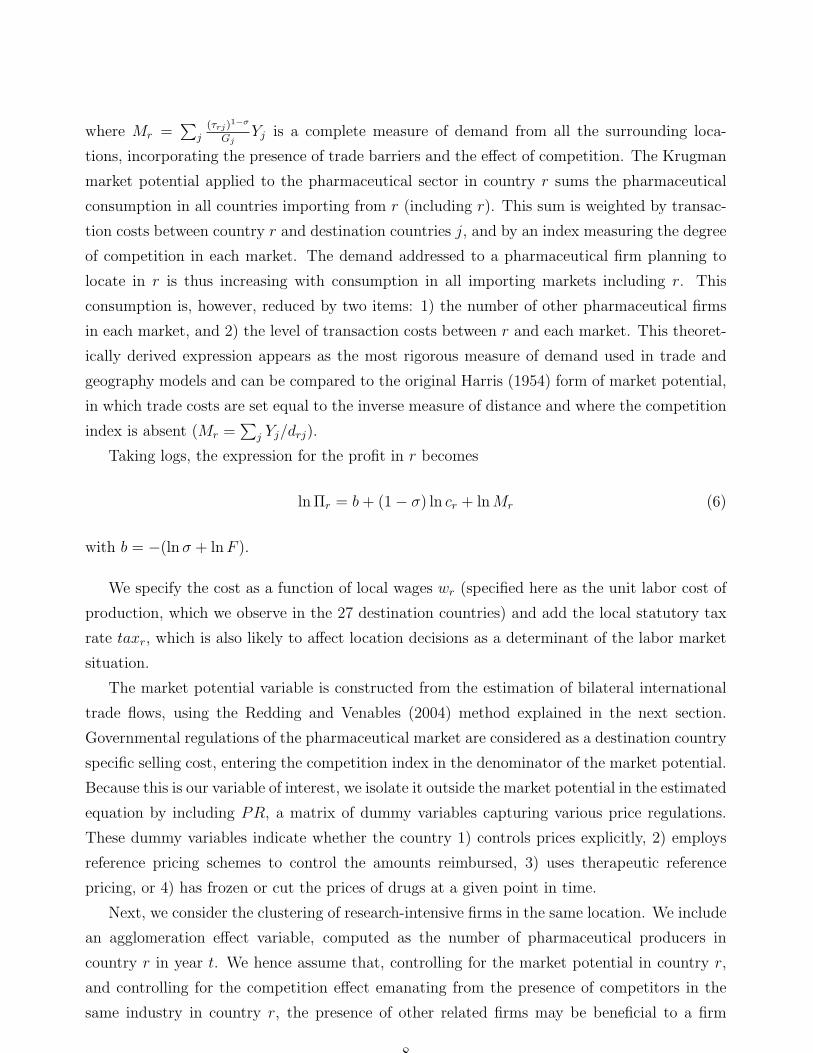
where Mr =∑
j(τrj)
1−σ
GjYj is a complete measure of demand from all the surrounding loca-
tions, incorporating the presence of trade barriers and the effect of competition. The Krugman
market potential applied to the pharmaceutical sector in country r sums the pharmaceutical
consumption in all countries importing from r (including r). This sum is weighted by transac-
tion costs between country r and destination countries j, and by an index measuring the degree
of competition in each market. The demand addressed to a pharmaceutical firm planning to
locate in r is thus increasing with consumption in all importing markets including r. This
consumption is, however, reduced by two items: 1) the number of other pharmaceutical firms
in each market, and 2) the level of transaction costs between r and each market. This theoret-
ically derived expression appears as the most rigorous measure of demand used in trade and
geography models and can be compared to the original Harris (1954) form of market potential,
in which trade costs are set equal to the inverse measure of distance and where the competition
index is absent (Mr =∑
j Yj/drj).
Taking logs, the expression for the profit in r becomes
ln Πr = b+ (1− σ) ln cr + lnMr (6)
with b = −(lnσ + lnF ).
We specify the cost as a function of local wages wr (specified here as the unit labor cost of
production, which we observe in the 27 destination countries) and add the local statutory tax
rate taxr, which is also likely to affect location decisions as a determinant of the labor market
situation.
The market potential variable is constructed from the estimation of bilateral international
trade flows, using the Redding and Venables (2004) method explained in the next section.
Governmental regulations of the pharmaceutical market are considered as a destination country
specific selling cost, entering the competition index in the denominator of the market potential.
Because this is our variable of interest, we isolate it outside the market potential in the estimated
equation by including PR, a matrix of dummy variables capturing various price regulations.
These dummy variables indicate whether the country 1) controls prices explicitly, 2) employs
reference pricing schemes to control the amounts reimbursed, 3) uses therapeutic reference
pricing, or 4) has frozen or cut the prices of drugs at a given point in time.
Next, we consider the clustering of research-intensive firms in the same location. We include
an agglomeration effect variable, computed as the number of pharmaceutical producers in
country r in year t. We hence assume that, controlling for the market potential in country r,
and controlling for the competition effect emanating from the presence of competitors in the
same industry in country r, the presence of other related firms may be beneficial to a firm
8

considering choosing r. The positive effect may arise from technological spillovers decreasing
the input cost cr, or decreasing the transaction cost τrj. Furman et al. (2007) (among others)
have documented the tendency of biopharmaceutical firms to locate in places with greater
R&D capabilities, and as a result we also include the country’s annual R&D spending in the
pharmaceutical sector. We denote these spillover-related variables Spillr.
Our database contains information about the origin countries of investing firms. In order to
take into account the bilateral cost of investment, we add two final variables to the estimation,
measuring distance between the investing and the potential host country (Distir), and whether
these countries share a common language (Langir).
The profit of a firm i in r can be decomposed into the part observed by the researcher ,
Vir and the unobserved aspects of the profit eir. The unobserved elements refer for example to
bilateral factors between the firm and the host country affecting the productivity or the firm’s
production cost. The form of the observed part is specified in the theoretical model up to the
vector of parameters β that we will estimate:
Vir = β0 + β1 lnwr + β2 ln taxr + β3Distir + β4Langir + β5 lnMr + β′6PR + β′7Spillr. (7)
We assume that firms choose the location yielding the highest profit. With error terms
distributed according to an extreme value distribution, the probability that a firm i chooses to
invest in country r writes in the following logit form:
Pir =exp(Vir)∑j exp(Vij)
(8)
We thus estimate the determinants of location choices in the pharmaceutical industry using
a logit model, on the data that are described in the next section. Following several papers
in the location choice literature, we estimate a Conditional Logit model of location choices.
This model is particularly well suited to applications in which choices are made based on the
observable characteristics of the alternatives. In this case, we model profits as a function of the
choice attributes described above and a common set of parameters. Chung and Alcacer (2002)
use the Random Parameters Logit model, which allows the effect of location characteristics to
vary across investors. While we do not pursue this estimation strategy, we do examine whether
different types of investment respond differently to regulation in some specifications.
4 Data
We estimate a model of location choice on 294 investments in the biopharmaceutical sector in
27 European countries during 2002-2006.
9

4.1 Investment data
The data on inward FDI comes from the Agence francaise des investissements internationaux
(AFII, France’s agency for international investments). The database is the result of a com-
prehensive search by web-crawlers of public announcements of new investments from a variety
of sources, including press releases, newspapers and the trade press, and Lexis-Nexis. The
announcements of foreign investments are in all sectors, in Europe, between 2002 and 2006.
The total number of announcements is 13 903, among which 672 investments in biotechnology
and drugs and cosmetics, which are the two industry classifications we focus on. It contains
information on the date of the announcement, the location of the investment (country, and
sometimes city), the activity undertaken (R&D, manufacturing, distribution, administrative,
etc.), the identity and country of origin of the investor, and the projected number of jobs created
(in some but not all cases).
While the AFII database contains information on both new investments and expansion of
existing investments, we restrict our attention to investments which represent the creation of
a new facility. Investing firms may be producers of branded drugs, generic producers, medical
services manufacturers, contract research organizations, and suppliers of intermediate inputs.
These firms were identified by reading the text of the investment announcement, which typically
contained a description of the firm’s main activity, and by looking up companies on the web.
Among these we keep focus on producers of branded- drugs producers, and analyze the behavior
of generic producers separately in an appendix. Our hypothesis is that only investments by
research-driven pharmaceutical firms may be negatively affected by the regulatory regime, since
it is primarily the profit margins of these firms that are affected by price regulation. We therefore
focus on research-driven firms in our main analysis. However, we include results restricted to
generic firms in an appendix as a robustness check. Finally, investments vary by the main
activity. Out of a total of 294 investments, there are 78 announcements of new investments
in sales offices or distribution facilities, 79 manufacturing plants, 84 new R&D facilities, 40
headquarters and administrative offices, and 8 other types of announcements (distribution
centers, call centers, etc.)
Origin countries of investing firms are in all parts of the world. Destination countries are the
25 current EU members, minus Malta and Cyprus, and plus Norway, Switzerland, and the Baltic
countries (Latvia, Lithuania, and Estonia), so in total 27 countries. Table (1) and Figure (1)
summarize the number of investments by country. The United-Kingdom, Germany and Ireland
are the three countries receiving the largest number of Bio-pharmaceutical investments over
the period. These three countries receive a relatively stable number of investments each year,
whereas Spain for example exhibits a sharply decreasing trend, with 12 investments in 2002,
10

8 in 2003, and respectively 2, 3 and 1 in the three subsequent years. Lithuania, Latvia, and
Luxembourg are the three countries in which only one new facility in the Bio-pharmaceutical
sector was created during 2002-2006.
4.2 Explanatory variables data
Our explanatory variables include the traditional FDI determinants and our main variable of
interest, drug price regulations. Information on regulatory policies mainly come from Kyle
(2007a), and was supplemented with data on a larger set of European countries and a later
time period using the sources described in the appendix.
Price regulations are in the form of three dummy variables indicating whether each country
uses each price policy: price control, reference pricing and therapeutic reference pricing. Table
(2) and Figure (2) summarize this information. We use two additional variables explaining
which countries have experienced changes in their regulatory framework during the 2002-2006
period. These are displayed in Tables (3) and (4).
The remaining explanatory variables refer to the traditional determinants of FDI used in
the location choice literature. Following equation (7), we start with variables relative to local
production costs: unit labor costs come from the Structural Business Statistics database from
Eurostat’s Industry, Trade and Services division. Eurostat’s data are available through 2004.
We extrapolate each variable forward to 2006 from 2001-2004 data.
Data on corporate taxes come from three sources. The first is the Devereux, Griffith and
Klemm (2002) database, available from the IFS. This dataset omits information for the new
EU members and stops in 2005. We fill in information on statutory tax rates in new EU
members in 2003 and 2004 from Finkenzeller and Spengel (2004). We supplement this data
with information from KPMG’s Corporate Tax Rate Survey 2006. The latter source provides
information for all countries for 2005 and 2006. Data accounting for spillovers (R&D spending
and the number of firms in the pharmaceutical sector for each country) are also extracted from
the Eurostat database.
The construction of a market potential variable requires data on three elements: trade costs
between countries r and j, consumption in pharmaceuticals in country j, and the competition
index in j. Following Redding and Venables (2004), we obtain these terms by estimating
gravitational trade equations. Bilateral exports from i to j can be writing as the amount
exported by a representative firm from i multiplied by the number of firms in i:
Xij = nipijqij = nic1−σi τ 1−σ
ij
YjGj
.
11
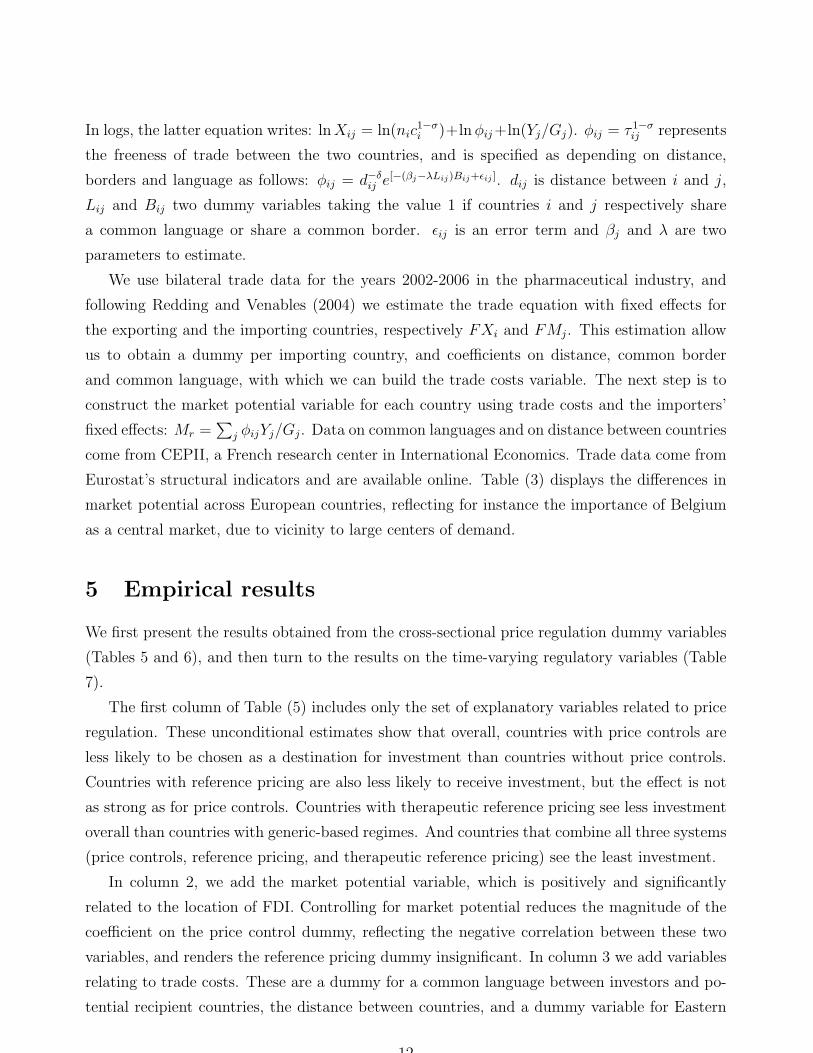
In logs, the latter equation writes: lnXij = ln(nic1−σi )+lnφij+ln(Yj/Gj). φij = τ 1−σ
ij represents
the freeness of trade between the two countries, and is specified as depending on distance,
borders and language as follows: φij = d−δij e[−(βj−λLij)Bij+εij ]. dij is distance between i and j,
Lij and Bij two dummy variables taking the value 1 if countries i and j respectively share
a common language or share a common border. εij is an error term and βj and λ are two
parameters to estimate.
We use bilateral trade data for the years 2002-2006 in the pharmaceutical industry, and
following Redding and Venables (2004) we estimate the trade equation with fixed effects for
the exporting and the importing countries, respectively FXi and FMj. This estimation allow
us to obtain a dummy per importing country, and coefficients on distance, common border
and common language, with which we can build the trade costs variable. The next step is to
construct the market potential variable for each country using trade costs and the importers’
fixed effects: Mr =∑
j φijYj/Gj. Data on common languages and on distance between countries
come from CEPII, a French research center in International Economics. Trade data come from
Eurostat’s structural indicators and are available online. Table (3) displays the differences in
market potential across European countries, reflecting for instance the importance of Belgium
as a central market, due to vicinity to large centers of demand.
5 Empirical results
We first present the results obtained from the cross-sectional price regulation dummy variables
(Tables 5 and 6), and then turn to the results on the time-varying regulatory variables (Table
7).
The first column of Table (5) includes only the set of explanatory variables related to price
regulation. These unconditional estimates show that overall, countries with price controls are
less likely to be chosen as a destination for investment than countries without price controls.
Countries with reference pricing are also less likely to receive investment, but the effect is not
as strong as for price controls. Countries with therapeutic reference pricing see less investment
overall than countries with generic-based regimes. And countries that combine all three systems
(price controls, reference pricing, and therapeutic reference pricing) see the least investment.
In column 2, we add the market potential variable, which is positively and significantly
related to the location of FDI. Controlling for market potential reduces the magnitude of the
coefficient on the price control dummy, reflecting the negative correlation between these two
variables, and renders the reference pricing dummy insignificant. In column 3 we add variables
relating to trade costs. These are a dummy for a common language between investors and po-
tential recipient countries, the distance between countries, and a dummy variable for Eastern
12

European destinations. The first and third of these are highly significant, and their inclusion
renders the reference pricing and therapeutic reference pricing dummies statistically insignifi-
cant, though the price control dummy retains its negative and significant association with the
probability of investment. We continue to add the elements of the profit function in columns
4-5. As expected, the nominal corporate tax rate is negatively associated with investment,
while the unit cost of production has a positive coefficient (presumably reflecting variation in
productivity or labor quality across locations). The latter finding is consistent with Head and
Mayer (2004). When the ”spillovers” variable (number of pharmaceutical establishments ac-
tive in the country) is included, the market potential variable becomes insignificant, reflecting
the high positive correlation between these variables. The price control dummy also becomes
insignificant.3 We separate manufacturing and non-manufacturing investments in columns 6
and 7, and find that the association between regulation and investment appears to be driven
by non-manufacturing investments.
The inclusion of the spillover variable is somewhat problematic. While the theory suggests
an important role for inter-firm spillovers, the variable with which we measure spillovers (the
number of pharmaceutical establishments in the country) makes it difficult to separately identify
spillovers from other motives for investment. If the regulatory regime affects the location
choices of firms, this will be influence the number of establishments that previously located in
the country. Thus, by controlling for the existing number of establishments, we are picking
up the effect of the regulatory regime on the change in the number of establishments in the
country. Since neither the price control variable nor the reference pricing variable vary within
countries during our sample (they are fixed over time), it is not surprising that we find no effect
of regulation on investment after controlling for the existing number of establishments. As a
result, our preferred specifications for interpreting the effects of the time-invariant regulatory
variables on investment will be those that exclude the spillovers variables. We will then turn to
an analysis of time-varying regulatory variables, exploiting policy changes during our sample
period to identify the effects of an increase in regulatory stringency on changes in investment
choices. In these specifications, we will include the spillovers variables, along with country fixed
effects.
Given that investment patterns may differ substantially between Western European coun-
tries and locations in Eastern Europe and the Baltic states, we present models estimated sepa-
rately for these two regions in Table (6). Regulation does not appear to play a role in location
3We do not have data on the spillovers variables for Switzerland, Greece, and Lithuania, which explains whythe number of observations are lower in the column that includes spillovers variables. The results associatedwith the other specifications are practically identical when these countries are omitted, reflecting the relativelysmall number of investments that take place there during this period (11 in Switzerland, 3 in Greece, and 1 inLithuania).
13

decisions in Eastern Europe, while price controls are significantly associated with a 40% re-
duction in the odds of investment in Western European countries (as in the full sample). This
distinction may reflect the types of investment taking place in these locations. Indeed, we find
that when restricting to Western European countries, the regulatory variables are not signifi-
cantly related to investment for manufacturing or R&D announcements, but that price controls
are associated with a reduction in the odds of other types of investment. The latter types of
investment include headquarters, administrative offices, sales offices, logistical and distribution
centers, and services to the firm.
There are some additional interesting differences between the different types of investment.
The corporate tax rate is strongly negatively associated with manufacturing investments but
not the other types, while market potential is positively but insignificantly associated with
manufacturing investment. This is perhaps not surprising given that production costs are
likely to be the most important determinant of manufacturing locations in this industry, where
transport costs are low. What is more surprising is the positive and significant coefficient
on market potential for R&D investment. Common language matters for R&D and other
investments, reflecting the greater importance of communication barriers in these types of
investment relative to manufacturing. The distance between the country of origin and potential
destination countries is not significantly related to location choices for manufacturing and R&D
investments, but it increases the likelihood of other investments (at the 10% level). This
may reflect the establishment of distribution centers and administrative offices associated with
distant headquarters. Companies may be able to service neighboring countries from their base,
but new facilities are required when expanding in more remote locations.
The specifications presented in Tables (5) and (6) are informative about the general associ-
ation between price regulation and FDI in European countries. In these specifications, we have
controlled for most of the key drivers of location choice. However, it is possible that there are
country-specific determinants of location choice that we have omitted and that are correlated
with regulatory regimes. In order to guard against this possibility, country fixed effects should
be included. However, given that the price control and reference pricing dummies are constant
throughout the sample period, it is impossible to measure their coefficients in a specification
that includes country fixed effects. We thus exploit other policy changes that took place during
the sample period (listed in Table 3). Several countries instituted therapeutic reference pricing
regimes or froze prices between 2002 and 2006. The results presented in Table (7) focus on
these time-varying regulatory variables, and include country fixed effects. They resemble a
“difference in differences” analysis, since we control for country-specific variation in the average
level of investment through the country fixed effects, and identify the additional variation in
investment that takes place in countries that change their policies relative to countries that do
14

not change their policies.
In these specifications, we do include the spillover variables because we are interested in
the change in investment relative to existing levels. We find that countries that instituted
therapeutic reference pricing regimes for the first time during the period in question have a
54% lower odds of investment following the policy change than countries that did not change
their policies (column 1 of Table 7). Price freezes do not appear to have any relationship with
investment. When the data is broken down by type of investment, R&D investments are the
only type with a significant coefficient on the therapeutic reference pricing dummy. Most of
the country characteristics are insignificant after controlling for country fixed effects, with the
exception of the common language dummy, which varies by investor and country and which
has a strong positive association with the likelihood of investment. R&D investments are more
likely to take place in countries in which more spending on R&D takes place (significant at the
10%) level, but the same is not true for manufacturing investments (in fact, R&D is negatively
but insignificantly associated with investment after country effects are included).
In the appendix, we consider the relationship between price regulation and investment by
generics producers. Since these firms do not have incentives to attempt to influence policy
by shifting investment away of countries with more stringent price controls, we do not antici-
pate that the negative relationship observed between regulatory stringency and investment by
research-oriented firms will be repeated. If anything, generics producers may be more likely to
locate in countries that tightly regulate prices of branded drugs because these countries have
greater demand for generic drugs. In appendix table (B1), we repeat our baseline regressions af-
ter restricting the dataset to generic firms. In the full sample, we find no significant relationship
between regulatory policy and investment. However, when we restrict attention to investments
in manufacturing facilities, we observe a positive relationship between price controls and in-
vestment (as predicted by the preceding argument about higher demand). Non-manufacturing
investments (in sales and marketing, distribution, etc.) are, as expected, insignificantly related
to the policy regime. Table (B2) repeats the analysis including country fixed effects, and here
we observe no significant relationship between policy changes and investment.
To summarize the results discussed above, we find that foreign investors are less likely to
locate new investments in countries with explicit price controls than countries with reference
pricing regimes or no price regulation. However, this finding is only observed in Western
European countries, and appears to be driven by investments in new sales and administrative
offices. The latter result may reflect stronger incentives for investments in marketing in countries
in which prices are not directly controlled, rather than a strategic action by pharmaceutical
firms seeking to send a message to countries with stringent regulatory regimes. When country
fixed effects are included, so that we examine the change in investment patterns associated with
15

changes in regulatory policy, we find that new investments significantly reduced in countries
that imposed therapeutic reference pricing regimes for the first time after 2002, and that this
finding appears to be driven by a reduction in R&D investments.
Why do we observe a significant impact on new R&D investments when country fixed
effects are included, but not when they are omitted (Table 5 reports a coefficient on TRP that is
negative but significant only at the 10% level)? One possibility is that cross-country variation in
investment dominates within-country variation, and that the countries that imposed therapeutic
reference pricing regimes for the first time are otherwise attractive destinations for investment.
When we include fixed effects, we isolate the impact of policy changes within a country, so that
our estimates are no longer confounded by cross-country variation in investment. A related
possibility is that country effects control for an omitted time-invariant, country-specific variable
that biased our estimates of the regulatory variables towards zero.
The finding that R&D investments are particularly affected by regulatory regimes may at
first seem surprising. One might ask why, if firms seek to influence government policy by re-
directing investment to countries with more favorable regulatory regimes, they do not do so
with manufacturing investments. Manufacturing facilities are less closely tied to the specific
science or skill base of a location, and one would expect that firms would incur lower costs in
choosing a second-best location for manufacturing. However, the potential impact of locating
a new R&D facility may be much greater – much more politically controversial. If governments
believe that new R&D facilities contribute more to the tax base and generate greater spillovers
for the region than do manufacturing facilities, they may be more sensitive to variations in
the location of R&D investment. Thus the potential benefit in terms of political influence
associated with the choice of an R&D location may be greater, and this may explain why the
effect is mainly observed among R&D investments.
A significant limitation of these findings is that only three countries instituted therapeutic
reference pricing during the sample period (Denmark, Germany, and Hungary). Spain began
including patented medicine in its reference pricing system in 2007. Once investment data
becomes available for 2007, we intend to incorporate it. It would be useful to extend the
analysis back in time to examine earlier changes to regulatory regimes, but we do not have
data that permits us to do so.
Finally, we present some comments and results as additional robustness checks. First,
because these announcements are voluntary public disclosures, there is a possibility that the
dataset contains a disproportionate share of large, publicly-traded firms. Since the R&D-
performing pharmaceutical firms tend to be large and publicly traded, we are likely capturing a
large majority of investments by these types of firms. However concerns about sample selection
are likely to be more significant for smaller, privately-traded biotech firms. It is important to
16

keep in mind the sample composition when interpreting our results. If large, public firms are
more likely to alter investment decisions in response to regulatory changes, our estimates will
overstate the effect of regulation on investment by small, private firms.
Second, the data come from published sources in several languages. However, there is
a possibility that because our data come from a French government agency, French-language
publications may be over-represented in our database. We deal with this possibility by including
in an appendix a set of estimates that exclude French-language publications. In response to
a concern that investments in France or by French companies were over-represented in our
data due to the origin of the dataset, we also include estimates of the models that exclude
investments made in France or by French companies, and found very similar results (see the
appendix).
6 Conclusions
This paper examines the relationship between cross-country differences in drug price regulation
and the location of biopharmaceutical FDI in Europe. We use a theoretically-grounded location-
choice model and data on 294 investments initiated in 27 European countries between 2002 and
2006 to estimate whether biopharmaceutical companies are influenced by the stringency of price
regulations in choosing the countries in which to locate new investments. We find that countries
with price controls receive fewer new investments, after controlling for other determinants of
investment. Countries that increased the stringency of price regulation by adding patented
medicines to a reference pricing regime during the sample period were approximately 50% less
likely to receive an investment after the policy went into effect.
17

Table 1: Bio-Pharmaceutical FDI by country and year
Country 2002 2003 2004 2005 2006 TotalAustria 1 2 0 4 0 7Belgium 1 2 6 4 1 14Bulgaria 0 0 1 0 4 5Switzerland 0 1 3 5 2 11Czech Republic 1 0 1 1 1 4Germany 7 6 4 6 11 34Denmark 3 6 3 2 3 17Estonia 0 0 2 0 1 3Spain 12 8 2 3 1 26Finland 0 1 1 1 0 3France 5 1 3 7 2 18UK 7 8 11 14 12 52Greece 0 1 0 2 0 3Hungary 3 2 1 3 1 10Ireland 6 5 8 7 5 31Italy 1 0 2 2 3 8Lithuania 0 0 0 0 1 1Luxembourg 0 0 0 1 0 1Latvia 0 0 0 0 1 1Netherlands 0 1 1 2 3 7Poland 1 2 4 3 1 11Portugal 1 0 0 3 1 5Romania 1 0 0 0 0 1Sweden 4 3 5 5 0 17Slovenia 0 0 2 0 1 3Slovakia 0 0 0 0 1 1Total 54 49 60 75 56 294
Source:AFII database
18

Figure 1: Bio-pharmaceutical FDI in Europe, 2002-2006
19

Figure 2: Price regulations in Europe
Orange: Both
RP and PC
Gold: RP only
Yellow: PC only
UK: none
20

Figure 3: Real Market Potential in Europe
21
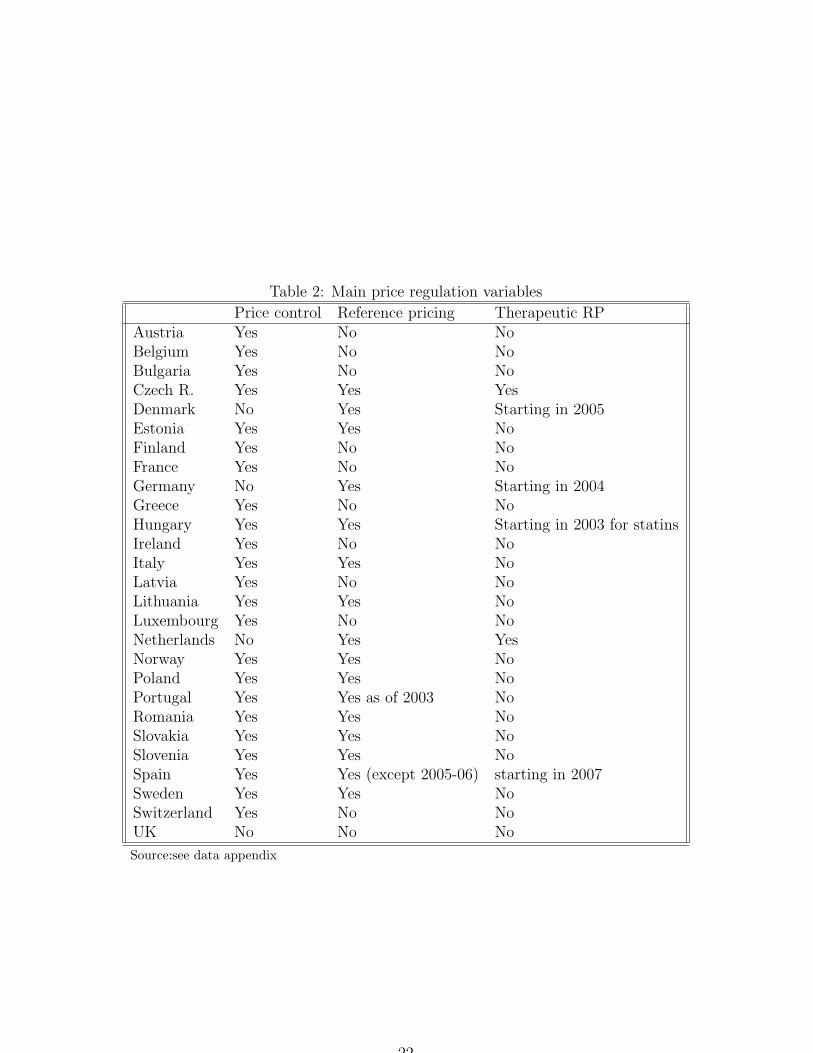
Table 2: Main price regulation variables
Price control Reference pricing Therapeutic RPAustria Yes No NoBelgium Yes No NoBulgaria Yes No NoCzech R. Yes Yes YesDenmark No Yes Starting in 2005Estonia Yes Yes NoFinland Yes No NoFrance Yes No NoGermany No Yes Starting in 2004Greece Yes No NoHungary Yes Yes Starting in 2003 for statinsIreland Yes No NoItaly Yes Yes NoLatvia Yes No NoLithuania Yes Yes NoLuxembourg Yes No NoNetherlands No Yes YesNorway Yes Yes NoPoland Yes Yes NoPortugal Yes Yes as of 2003 NoRomania Yes Yes NoSlovakia Yes Yes NoSlovenia Yes Yes NoSpain Yes Yes (except 2005-06) starting in 2007Sweden Yes Yes NoSwitzerland Yes No NoUK No No No
Source:see data appendix
22

Table 3: Price cuts and freezes, 2002-2006
Country Date DescriptionGermany Oct-03 16% reduction in reimbursed prices for patented
medicines.Hungary Apr-04 government froze retail drug prices at 85% of
their previous levels for 180 days.Hungary Jun-04 Parliament passed an amendment to the Price
Act allowing the government to freeze drugprices for up to nine months.
UK Nov-04 7% cut in prescription drug prices after negoti-ations with the Association of the British Phar-maceutical Industry (ABPI).
Spain March 2005,March 2006
The Ministry of Health imposed a compulsory4.2% price cut from March 2005 and a 2% pricecut from March 2006 for all products not sub-ject to reference prices and with a price higherthan EUR2.
Italy Approved June1, effective Octo-ber 1, 2006
The Italian Drug Agency (AIFA) imposed atemporary 5% cut on the price of drugs usedby the country’s National Health Service (SSN)Poland Jul-06 13% price cut for imported prod-ucts
Table 4: Changes to Reference Pricing Programs, 2002-2006
Country Date DescriptionPortugal 2003 Adopted reference pricing scheme in which
amount reimbursed depends on the price of theleast expensive equivalent generic drug available
Hungary 2003 Therapeutic reference pricing for statinsSpain 2004 Reference pricing suspended; price cuts used to
compensateGermany 2004 Included patented medicines in reference pric-
ing schemeDenmark 2005 Reference pricing scheme shifts from compar-
isons with cheapest generic drug to comparisonswith other European countries.
Spain 2007 Therapeutic reference pricing scheme goes intoeffect
23

Tab
le5:
Bas
elin
ere
sult
sin
cludin
gal
lco
untr
ies,
typ
esof
inve
stm
ent,
and
inve
stor
s(1
)(2
)(3
)(4
)(5
)(6
)(7
)Fu
llSa
mpl
eM
anuf
actu
ring
Non
-man
ufac
turi
ngpr
ice
cont
rols
-1.5
21-0
.880
-0.5
70-0
.452
-0.2
86-0
.018
-0.5
98(0
.136
)***
(0.1
79)*
**(0
.187
)***
(0.1
91)*
*(0
.214
)(0
.410
)(0
.220
)***
refe
renc
epr
icin
g-0
.388
-0.1
530.
249
0.32
10.
313
-0.0
830.
529
(0.1
33)*
**(0
.144
)(0
.155
)(0
.178
)*(0
.180
)*(0
.320
)(0
.218
)**
The
rape
utic
RP
-0.5
03-0
.568
-0.3
48-0
.329
-0.3
780.
450
-0.6
66(0
.199
)**
(0.2
01)*
**(0
.214
)(0
.212
)(0
.218
)*(0
.419
)(0
.249
)***
lnm
arke
tpo
tent
ial
0.39
60.
272
0.39
30.
130
0.21
30.
450
(0.0
77)*
**(0
.074
)***
(0.1
04)*
**(0
.123
)(0
.199
)(0
.125
)***
lndi
stan
ce0.
136
0.23
30.
092
0.26
00.
158
(0.1
68)
(0.1
82)
(0.1
90)
(0.3
41)
(0.2
16)
com
mon
lang
uage
1.15
90.
903
0.89
20.
654
0.99
5(0
.178
)***
(0.1
83)*
**(0
.191
)***
(0.3
49)*
(0.2
16)*
**E
aste
rnE
urop
e-0
.929
-0.5
61-0
.224
-0.5
15-0
.600
(0.2
14)*
**(0
.310
)*(0
.350
)(0
.557
)(0
.386
)ln
unit
cost
s0.
511
0.12
40.
562
0.45
0(0
.167
)***
(0.2
65)
(0.2
96)*
(0.2
06)*
*ln
corp
orat
eta
xra
te-1
.103
-1.4
81-1
.656
-0.6
38(0
.298
)***
(0.3
19)*
**(0
.461
)***
(0.3
98)
ln#
firm
s0.
391
(0.1
02)*
**ln
rdex
pend
itur
e0.
215
(0.0
87)*
*C
ombi
ned
effec
tsof
pric
ere
gula
tion
vari
able
s,ex
pres
sed
asod
dsra
tios
:R
P+
TR
P0.
410*
**0.
486*
**0.
906
0.99
30.
937
1.44
30.
872
Obs
erva
tion
s79
3879
3879
3872
5064
4819
7552
75L
ogL
ikel
ihoo
d-9
09.6
69-8
96.2
72-8
63.4
46-8
24.4
47-7
45.3
92-2
29.3
44-5
81.0
02P
seud
oR2
0.06
10.
075
0.10
90.
117
0.14
70.
098
0.14
5So
urce
:St
anda
rder
rors
inpa
rent
hese
s*
sign
ifica
ntat
10%
;**
sign
ifica
ntat
5%;
***
sign
ifica
ntat
1%
24

25

Tab
le6:
Com
par
ing
Acr
oss
Typ
esof
Inve
stm
ent
Dep
ende
ntva
riab
le:
loca
tion
choi
cedu
mm
yE
stim
atio
nm
etho
d:co
ndit
iona
llo
git
(1)
(2)
(3)
(4)
(5)
Eas
tern
Eur
ope
Wes
tern
Eur
ope
W.
Eur
ope,
Man
ufac
turi
ngW
.Eur
ope,
R&
DW
.E
urop
e,O
ther
pric
eco
ntro
ls-0
.485
0.42
6-0
.025
0.59
10.
651
(0.6
10)
(0.2
01)*
*(0
.374
)(0
.403
)(0
.303
)**
refe
renc
epr
icin
g1.
022
-0.5
280.
169
-0.9
25-0
.838
(0.6
53)
(0.2
38)*
*(0
.522
)(0
.483
)*(0
.337
)**
The
rape
utic
RP
-0.4
17-1
.184
-1.8
64-1
.017
-0.2
80(0
.953
)(0
.339
)***
(0.5
39)*
**(0
.709
)(0
.604
)co
rpor
ate
tax
rate
-0.3
430.
424
0.27
60.
612
0.36
9(0
.697
)(0
.115
)***
(0.2
21)
(0.2
25)*
**(0
.175
)**
lnm
arke
tpo
tent
ial
-0.6
950.
387
0.17
40.
285
0.55
7(0
.478
)(0
.205
)*(0
.375
)(0
.374
)(0
.321
)*ln
dist
ance
0.19
90.
545
0.47
90.
897
0.29
4(0
.322
)(0
.227
)**
(0.4
27)
(0.4
91)*
(0.3
40)
lnun
itco
sts
-0.4
96-0
.084
-0.3
36-0
.879
(0.2
04)*
*(0
.449
)(0
.363
)(0
.307
)***
com
mon
lang
uage
0.93
80.
583
1.18
70.
977
(0.1
90)*
**(0
.365
)(0
.347
)***
(0.2
94)*
**R
P+
TR
P0.
903
1.15
50.
716
0.82
9O
bser
vati
ons
261
4176
1072
1168
1936
Log
Lik
elih
ood
-59.
493
-665
.028
-169
.625
-175
.721
-303
.509
Pse
udoR
20.
066
0.08
10.
087
0.13
20.
095
Stan
dard
erro
rsin
pare
nthe
ses,
*si
gnifi
cant
at10
%;
**si
gnifi
cant
at5%
;**
*si
gnifi
cant
at1%
26

27

Tab
le7:
Impac
tsof
Pol
icy
Chan
ges
Dep
ende
ntva
riab
le:
loca
tion
choi
cedu
mm
yE
stim
atio
nm
etho
d:co
ndit
iona
llo
git
Cou
ntry
fixed
effec
tsin
clud
ed(1
)(2
)(3
)(4
)(5
)(6
)Fu
llsa
mpl
eM
anuf
actu
ring
R&
DO
ther
The
rape
utic
RP
-0.7
72-0
.696
0.12
1-1
.979
-0.8
23(0
.372
)**
(0.3
76)*
(0.7
48)
(0.8
80)*
*(0
.540
)P
rice
Free
ze-0
.327
-0.2
29-0
.639
0.03
4-0
.101
(0.2
57)
(0.2
62)
(0.6
16)
(0.5
23)
(0.3
90)
corp
orat
eta
xra
te-0
.001
0.34
10.
077
2.22
9-3
.416
-2.1
14(1
.150
)(1
.144
)(1
.156
)(1
.860
)(2
.771
)(2
.425
)C
omm
onla
ngua
ge0.
908
0.91
20.
912
0.64
61.
012
1.12
8(0
.200
)***
(0.1
99)*
**(0
.200
)***
(0.3
72)*
(0.3
60)*
**(0
.328
)***
lnm
arke
tpo
tent
ial
0.31
90.
099
0.23
4-0
.167
0.51
80.
490
(0.3
08)
(0.3
16)
(0.3
23)
(0.6
28)
(0.6
23)
(0.5
26)
lnR
&D
expe
ndit
ure
-0.0
07-0
.127
-0.0
42-0
.165
1.18
6-0
.128
(0.2
50)
(0.2
41)
(0.2
50)
(0.4
11)
(0.6
84)*
(0.4
84)
lndi
stan
ce0.
011
0.02
30.
010
0.06
8-0
.033
-0.0
32(0
.191
)(0
.191
)(0
.191
)(0
.368
)(0
.354
)(0
.292
)L
nun
itco
st-0
.786
-0.8
84-0
.730
-0.2
432.
552
-1.3
01(0
.944
)(0
.903
)(0
.928
)(1
.482
)(2
.929
)(1
.799
)ln
#fir
ms
1.39
01.
207
1.47
81.
722
1.05
51.
758
(0.6
10)*
*(0
.611
)**
(0.6
16)*
*(1
.219
)(1
.185
)(1
.055
)*T
RP
+Fr
eeze
(odd
sra
tio)
0.39
7**
0.59
50.
142*
*0.
397
Obs
erva
tion
s64
4864
4864
4817
4619
0427
98L
ogL
ikel
ihoo
d-7
21.2
09-7
22.5
74-7
20.8
25-1
90.4
88-1
90.4
43-2
93.3
16P
seud
oR
20.
175
0.17
30.
175
0.19
30.
261
0.22
8St
anda
rder
rors
inpa
rent
hese
s,*
sign
ifica
ntat
10%
;**
sign
ifica
ntat
5%;
***
sign
ifica
ntat
1%
28

Tab
le8:
Rob
ust
nes
sC
hec
ks
Excl
udin
gF
rench
Inve
stm
ents
Dep
ende
ntva
riab
le:
loca
tion
choi
cedu
mm
yE
stim
atio
nm
etho
d:co
ndit
iona
llo
git
(1)
(2)
(3)
(4)
(5)
(6)
(7)
(8)
Exc
ludi
ngFr
ench
-lan
guag
epu
blic
atio
nsE
xclu
ding
Fran
ceas
dest
inat
ion
oror
igin
Cou
ntry
FE
sno
n-m
fgM
fgC
ount
ryF
Es
non-
mfg
mfg
pric
ere
gula
tion
0.65
70.
658
0.61
60.
751
0.66
61.
188
(0.1
51)*
(0.1
69)
(0.3
21)
(0.1
72)
(0.1
73)
(0.5
81)
refe
renc
epr
ice
1.32
21.
594
0.97
71.
358
1.69
90.
916
(0.2
45)
(0.3
59)*
*(0
.331
)(0
.293
)(0
.453
)**
(0.3
64)
The
rape
utic
RP
0.67
00.
464
0.52
61.
100
0.61
40.
452
0.52
10.
720
(0.1
52)*
(0.1
83)*
(0.1
40)*
*(0
.499
)(0
.146
)**
(0.1
85)*
(0.1
43)*
*(0
.372
)fr
eeze
0.81
20.
637
(0.2
21)
(0.1
83)
lnm
arke
tpo
tent
ial
0.98
41.
324
1.14
40.
630
1.18
81.
468
1.37
20.
847
(0.1
30)
(0.4
38)
(0.1
71)
(0.1
85)
(0.1
60)
(0.5
35)
(0.2
18)*
*(0
.228
)co
mm
onla
ngua
ge2.
672
2.75
42.
810
2.55
72.
455
2.48
72.
562
2.33
1(0
.535
)***
(0.5
84)*
**(0
.667
)***
(0.9
80)*
*(0
.511
)***
(0.5
40)*
**(0
.639
)***
(0.9
23)*
*ln
dist
ance
1.03
50.
961
0.95
11.
143
1.05
40.
960
1.05
20.
944
(0.2
02)
(0.1
88)
(0.2
19)
(0.4
24)
(0.2
12)
(0.1
89)
(0.2
51)
(0.3
59)
corp
orat
eta
xra
te0.
267
1.31
30.
398
0.18
20.
249
1.81
10.
320
0.21
6(0
.088
)***
(1.5
84)
(0.1
73)*
*(0
.096
)***
(0.0
86)*
**(2
.230
)(0
.146
)**
(0.1
20)*
**ln
unit
cost
0.95
80.
410
0.96
00.
806
1.06
00.
223
1.11
00.
756
(0.2
69)
(0.4
12)
(0.3
21)
(0.4
18)
(0.2
92)
(0.2
48)
(0.3
62)
(0.4
06)
E.
Eur
ope
0.67
40.
667
0.65
60.
627
0.60
40.
741
(0.2
52)
(0.3
07)
(0.4
53)
(0.2
38)
(0.2
79)
(0.5
37)
ln#
firm
s1.
498
5.68
41.
405
1.65
41.
383
7.14
01.
340
1.32
8(0
.163
)***
(3.6
55)*
**(0
.174
)***
(0.3
82)*
*(0
.159
)***
(4.8
06)*
**(0
.178
)**
(0.3
07)
lnrd
expe
ndit
ure
1.28
80.
997
1.27
41.
376
1.22
30.
892
1.17
71.
499
(0.1
21)*
**(0
.258
)(0
.136
)**
(0.2
67)*
(0.1
06)*
*(0
.244
)(0
.112
)*(0
.306
)**
Obs
erva
tion
s60
2960
2943
9916
3052
6052
6038
7813
82L
ogL
ikel
ihoo
d-6
92.4
33-6
68.8
13-4
95.2
07-1
85.5
89-6
17.4
05-5
91.7
35-4
43.8
19-1
61.3
58P
seud
oR
20.
153
0.18
20.
170
0.15
80.
160
0.19
50.
181
0.16
2St
anda
rder
rors
inpa
rent
hese
s,*
sign
ifica
ntat
10%
;**
sign
ifica
ntat
5%;
***
sign
ifica
ntat
1%
29

References
Ahlering B. The Impact Of Regulatory Stringency On The Foreign Direct Investment Of Global Pharmaceutical
Firms. ESRC Center for Business Research Working Paper 2004.
Amiti M, Smarzynska Javorcik B. Trade Costs and Location of Foreign Firms in China. CEPR Discussion
Paper 2005 n. 4978.
Fosfuri A. Determinants of international activity: evidence from the chemical processing industry. Research
Policy , Volume 33 (10); 2004; 1599-1614.
Chung W, Alcacer J. Knowledge Seeking and Location Choice of Foreign Direct Investment in the United
States. Management Science 2002; 48(12); 1534-1554.
Crozet M, Mayer T, Muchielli JL. How do Firms agglomerate? A Study of FDI in France. Regional Science
and Urban Economics 2004; 34; 27-54.
Danzon P, Ketcham J. Reference pricing of pharmaceuticals for Medicare: Evidence from Germany, The
Netherlands and New Zealand. National Bureau of Economic Research 2003; 10007.
Danzon P, Wang, Y.R., Wang, L. (2004), “The impact of price regulation on the launch delay of new drugs
- evidence from twenty-five major markets in the 1990s”, Health Economics. Volume 14 Issue 3, Pages
269 - 292
Devereux M, Griffith R, Simpson H. Firm Location Decisions, Regional Grants and Agglomeration Externali-
ties. Journal of Public Economics 2007; 91; 413-435.
Furman J, Kyle M, Cockburn I, Henderson R. Knowledge Spillovers, Geographic Location & the Productivity
of Pharmaceutical Research. Annales d’Economie et de Statistique, forthcoming.
Head K, Mayer T. Market Potential and the Location of Japanese Investment in the European Union. The
Review of Economics and Statistics 2004; 86(4); 959-972.
Huttin M. Drug Price Divergence in Europe: Regulatory Aspects. Health Affairs 1999, 18 (3).
Kalo, K, N. Muszbek, J. Bodrogi and J. Bidlo, (2007), “Does therapeutic reference pricing always result in
cost-containment? The Hungarian evidence”, Health Policy, Volume 80, Issue 3, March 2007, Pages
402-412
Karaskevica, J. and E. Tragakes (2001) Health Systems in Transition: Latvia. Copenhagen, WHO Regional
Office for Europe on behalf of the European Observatory on Health Systems and Policies.
Kuszewski K, Gericke C. (2004) Health Systems in Transition: Poland. Copenhagen, WHO Regional Office
for Europe on behalf of the European Observatory on Health Systems and Policies.
Kyle, M. (2006), ”The Role of Firm Characteristics in Pharmaceutical Product Launches,” RAND Journal of
Economics, Autumn 2006, 37(3), 602-618.
Kyle, M. (2007a) ”Pharmaceutical Price Controls and Entry Strategies,” Review of Economics and Statistics,
February 2007, 89(1), 88-99.
Kyle, M. (2007b), ”Strategic Responses to Parallel Trade”, NBER Working paper #12968.
30

Jesse M, Habicht J, Aaviksoo A, Koppel A, Irs A, Thomson S. (2004) Health care systems in transition:
Estonia. Copenhagen, WHO Regional Office for Europe on behalf of the European Observatory on
Health Systems and Policies.
Lanjouw, J. (2005) ”Patents, Price Controls and Access to New Drugs: How Policy Affects Global Market
Entry”, NBER Working Paper # 11321.
Maskus K, Penubarti M. How Trade-Related are Intellectual Property Rights? Journal of International Eco-
nomics 1995; 39; 227-248.
Mossiolos P. et al (eds.) Regulating pharmaceuticals in Europe: striving for efficiency, equity and quality.
Open University Press; 2004.
Permanand G, Mossialos E. Constitutional asymmetry and pharmaceutical policy-making in the European
Union. Journal of European Public Policy 2005; 12(4); 687-709.
Pharmaceutical Research and Manufacturers of America. National Trade Estimate Report on Foreign Trade
Barriers (NTE) 2007.
Office of the U.S. Trade Representative. National Trade Estimate Report on Foreign Trade Barriers 2005.
Riemer. Upward Trends in Eastern Europe. Financial Times Supplement on Foreign Direct Investment 2005.
Vladescu C, Radulescu S, Olsavsky V. Health care systems in transition: Romania. Copenhagen, WHO
Regional Office for Europe on behalf of the European Observatory on Health Systems and Policies 2000.
31

Appendix A: Drug price regulation data
Information on regulatory policies by country come from a variety of sources. The starting point was Table 2
of Kyle (2007a). This was supplemented with information on a larger set of European countries and a
later time period using the following sources:
Kalo, K, N. Muszbek, J. Bodrogi and J. Bidlo, (2007), “Does therapeutic reference pricing always result in
cost-containment? The Hungarian evidence”, Health Policy, Volume 80, Issue 3, March 2007, Pages
402-412
Patricia Danzon and Jonathan Ketcham, (2003) “Reference pricing of pharmaceuticals for Medicare: Evidence
from Germany, The Netherlands and New Zealand”, National Bureau of Economic Research, working
paper 10007
Mossiolos, P. et al (eds.) (2004) Regulating pharmaceuticals in Europe: striving for efficiency, equity and
quality, Open University Press.
Kuszewski K, Gericke C. (2004) Health Systems in Transition: Poland. Copenhagen, WHO Regional Office
for Europe on behalf of the European Observatory on Health Systems and Policies.
Karaskevica, J. and E. Tragakes (2001) Health Systems in Transition: Latvia. Copenhagen, WHO Regional
Office for Europe on behalf of the European Observatory on Health Systems and Policies.
Jesse M, Habicht J, Aaviksoo A, Koppel A, Irs A, Thomson S. (2004) Health care systems in transition:
Estonia. Copenhagen, WHO Regional Office for Europe on behalf of the European Observatory on
Health Systems and Policies.
Vladescu, C., S. Radulescu, and V. Olsavsky (2000) Health care systems in transition: Romania. Copenhagen,
WHO Regional Office for Europe on behalf of the European Observatory on Health Systems and Policies.
Huttin, M. (1999), “Drug Price Divergence in Europe: Regulatory Aspects” Health Affairs, Volume 18, number
3, May/June 1999.
Pharmaceutical Research and Manufacturers of America (2007), National Trade Estimate Report on Foreign
Trade Barriers (NTE).
Office of the U.S. Trade Representative (2005), 2005 National Trade Estimate Report on Foreign Trade Barriers
32

Appendix B: Tables on generics producers
33

Tab
leB
-1:
Res
ult
sre
stri
cted
toge
ner
ics
pro
duce
rsin
cludin
gal
lco
untr
ies,
typ
esof
inve
stm
ent,
and
inve
stor
s(1
)(2
)(3
)(4
)(5
)(6
)(7
)Fu
llSa
mpl
eM
fgN
on-M
fgpr
ice
regu
lati
on-0
.252
0.50
80.
675
0.56
70.
220
1.52
3-0
.084
(0.3
07)
(0.3
67)
(0.3
84)*
(0.3
92)
(0.4
58)
(0.6
76)*
*(0
.542
)re
fere
nce
pric
e0.
163
0.39
90.
551
0.31
90.
211
1.09
8-0
.167
(0.2
28)
(0.2
45)
(0.2
52)*
*(0
.269
)(0
.281
)(0
.430
)**
(0.3
79)
The
rape
utic
RP
-0.0
73-0
.156
0.06
60.
040
-0.0
220.
277
-0.1
27(0
.344
)(0
.348
)(0
.382
)(0
.392
)(0
.404
)(0
.528
)(0
.632
)ln
mar
ket
pote
ntia
l0.
502
0.38
10.
231
-0.1
400.
308
0.13
3(0
.136
)***
(0.1
40)*
**(0
.172
)(0
.250
)(0
.285
)(0
.236
)ln
dist
ance
-0.0
190.
039
-0.1
74-0
.432
0.56
2(0
.253
)(0
.266
)(0
.292
)(0
.334
)(0
.444
)co
mm
onla
ngua
ge0.
553
0.47
50.
010
0.63
20.
365
(0.3
78)
(0.3
95)
(0.4
51)
(0.5
87)
(0.5
56)
EE
-0.5
62-0
.378
0.14
9-0
.333
-1.8
72(0
.305
)*(0
.494
)(0
.570
)(0
.665
)(1
.243
)ln
unit
cost
-0.0
120.
128
-0.2
250.
324
(0.2
42)
(0.3
59)
(0.3
02)
(0.5
05)
corp
orat
eta
xra
te0.
882
-0.1
650.
011
1.60
4(0
.584
)(0
.624
)(0
.697
)(1
.079
)ln
#fir
ms
0.73
7(0
.184
)***
lnrd
expe
ndit
ure
-0.0
44(0
.092
)O
bser
vati
ons
2511
2511
2511
2300
1926
1125
1175
Log
Lik
elih
ood
-305
.837
-298
.990
-295
.968
-285
.760
-241
.850
-137
.270
-129
.311
Pse
udo
R2
0.00
20.
025
0.03
40.
035
0.07
30.
052
0.14
5So
urce
:St
anda
rder
rors
inpa
rent
hese
s;*
sign
ifica
ntat
10%
;**
sign
ifica
ntat
5%;
***
sign
ifica
ntat
1%.
34

Table B-2: Results restricted to generics producers, including country fixed effects(1) (2) (3) (4) (5)
Full Sample Mfg Non-MfgTherapeutic RP 0.579 0.534 -0.120 0.722
(0.757) (0.782) (1.179) (1.254)freeze 0.211 0.125 0.554 0.294
(0.479) (0.502) (0.842) (0.703)corporate tax rate 1.457 1.462 1.418 2.470 -3.610
(1.600) (1.605) (1.607) (2.142) (4.429)common language 0.180 0.188 0.183 0.738 -0.355
(0.462) (0.462) (0.462) (0.651) (0.775)ln market potential 0.344 0.484 0.396 1.817 0.130
(0.570) (0.593) (0.609) (1.044)* (0.847)ln rd expenditure 0.075 0.071 0.079 0.130 0.684
(0.261) (0.262) (0.261) (0.312) (1.132)ln distance -0.239 -0.231 -0.236 -0.775 0.679
(0.295) (0.293) (0.294) (0.380)** (0.555)ln unit cost -1.251 -1.131 -1.243 -1.477 -2.484
(1.378) (1.362) (1.379) (1.566) (3.805)ln # firms -0.895 -0.718 -0.866 -1.773 -2.004
(0.996) (0.966) (1.008) (1.790) (1.575)Observations 1926 1926 1926 1002 924Log Likelihood -224.821 -225.029 -224.790 -105.242 -93.529PseudoR2 0.139 0.138 0.139 0.223 0.255Source: Standard errors in parentheses; * significant at 10%; ** significant at 5%;
*** significant at 1%
35