Embed Size (px)
Citation preview

San Jose State University San Jose State University
SJSU ScholarWorks SJSU ScholarWorks
Master's Projects Master's Theses and Graduate Research
4-8-2019
Regulatory Disclosure Policies and Potential Induced Changes in Regulatory Disclosure Policies and Potential Induced Changes in
Behavior: An Outcome Evaluation of Santa Clara County’s Behavior: An Outcome Evaluation of Santa Clara County’s
Enhanced Food Safety Program Elements Enhanced Food Safety Program Elements
Christian Cruz San Jose State University
Follow this and additional works at: https://scholarworks.sjsu.edu/etd_projects
Part of the Food Processing Commons, Health Policy Commons, Other Public Affairs, Public Policy
and Public Administration Commons, Policy Design, Analysis, and Evaluation Commons, Public
Administration Commons, and the Public Health Commons
Recommended Citation Recommended Citation Cruz, Christian, "Regulatory Disclosure Policies and Potential Induced Changes in Behavior: An Outcome Evaluation of Santa Clara County’s Enhanced Food Safety Program Elements" (2019). Master's Projects. 662. DOI: https://doi.org/10.31979/etd.r9gc-zfjq https://scholarworks.sjsu.edu/etd_projects/662
This Master's Project is brought to you for free and open access by the Master's Theses and Graduate Research at SJSU ScholarWorks. It has been accepted for inclusion in Master's Projects by an authorized administrator of SJSU ScholarWorks. For more information, please contact [email protected].

3
Regulatory Disclosure Policies and Potential Induced Changes in Behavior: An Outcome
Evaluation of Santa Clara County’s Enhanced Food Safety Program Elements
by
Christian Cruz
A Thesis Quality Research Paper
Submitted in Partial Fulfillment of the
Requirements for the Master’s Degree
In
Public Administration
Professor Frances Edwards, Ph.D.
Adviser
The Graduate School
San Jose State University
April 8, 2019

4

5
Table of Contents
BACKGROUND ........................................................................................................................... 7
Problem Statement and Research Question ............................................................................................. 7
Santa Clara County’s Food Safety Program .......................................................................................... 18
LITERATURE REVIEW ............................................................................................................. 23
Inspections and Health Outcomes .......................................................................................................... 24
How Disclosed Information is Used by Consumers .............................................................................. 26
Disclosure and the Incentives to Motive Changes Among Food Retailers ............................................ 28
METHODOLOGY ....................................................................................................................... 31
FINDINGS ................................................................................................................................... 35
Descriptive Statistics .............................................................................................................................. 35
Hypothesis Tests .................................................................................................................................... 38
ANALYSIS .................................................................................................................................. 43
Limitations ............................................................................................................................................. 44
Future Areas of Research ....................................................................................................................... 45
Conclusion ............................................................................................................................................. 49
REFERENCES ............................................................................................................................ 51
Appendix A .................................................................................................................................. 62
Appendix B .................................................................................................................................. 63
Appendix C .................................................................................................................................. 64

6
List of Tables
Table 1: Confirmed Cases of Foodborne Illness in Santa Clara County ....................................... 10
Table 2: Logic Model for Santa Clara County’s Food Safety Program ........................................ 32
Table 3: Sample Demographics of Randomly Selected Establishments ....................................... 35
Table 4: Major Violations Discovered: 2015 vs. 2017 .................................................................. 37
Table 5: Minor Violation Totals: 2015 vs. 2017 ........................................................................... 38
Table 6: Summary Table for Inferential Statistical Tests of Proportion of Food Establishments
Sampled Found to have Major or Minor Violations ..................................................................... 39
Table 7: Summary Table for Inferential Statistical Tests Examining Proportions of Sampled
Establishments Found to Have Committed a Major Violation by Type ....................................... 40
Table 8: Summary Table of Inferential Statistical Tests Examining Proportions of Sampled
Establishments Found to Have Committed a Minor Violation by Type ....................................... 40
List of Figures
Figure 1: Violations Totals by Type: 2015 vs. 2017 ..................................................................... 36

7
BACKGROUND Despite countless advances in food microbiology and public health regulations, foodborne illness
continues to be a major strain on public health outcomes and a costly economic burden. In the
United States, many agencies are responsible for ensuring the quality of food, both domestically
produced and imported. States and localities are delegated the responsibility of identifying and
ensuring sound practices in the latter stages of the food production process, namely the retail
distribution of food products to consumers.
Regulatory policies across the nation have only recently incorporated the evidenced-
based principles of hazard risk management (Law, 2003). Still, food-related acute
gastrointestinal illnesses have remained pervasive in the country, demonstrating the limits of
existing standards and approaches employed by regulators. Even more recent is the adoption of
these principles in the retail food domain. The trend has been complemented by transparency
requirements augmented by technological developments such as the internet and mobile
applications. Santa Clara County has recently become among the latest jurisdictions to adopt a
placarding requirement and a searchable website in an attempt to improve compliance with retail
food safety rules, as well as public health. This paper will attempt to determine whether or not
the efforts to make inspection data more assessable to consumers has resulted in greater
compliance with food safety laws by food retailers.
Problem Statement and Research Question Foodborne illness remains a critical yet preventable public health issue across the world. Despite
numerous scientific strides and the formation of international regulatory and coordination
frameworks, the World Health Organization found that foodborne illnesses sicken 10 percent of
the world’s population each year (Zuraw, 2015). Just under a half million of these cases are fatal.

8
Zuraw further noted that the actual incidence of such illnesses is much higher, as the vast
majority of cases go unreported. According to Henson et al. (2006), for each confirmed case of
foodborne illness there may be over 300 cases that go unnoticed. These illnesses are the result of
microbial, chemical, and physical contaminants that come into contact with foods and enter the
food system because of financially motivated gross negligence, poor sanitation infrastructure,
and the improper preparation and storage of foods (“Foodborne Illness and Germs”, 2018).
Although the United States and other developed nations are considered to have safer food
systems than their developing counterparts, food-related illnesses continue to remain a costly
public health matter. Published estimates vary dramatically, but the most recent estimate by the
Centers for Disease Control and Prevention (CDC) is 48 million cases per year and 3,000 related
deaths (“Foodborne Illness and Germs”). The profile of disease agents that sicken Americans
also differs from those that afflict developing countries. Diseases like Cholera and Typhoid
Fever are considered extremely rare in the Unites States, but Norovirus, non-Typhoidal
Salmonella, Campylobacter, and Listeria remain rampant (Zuraw, 2015). The costs associated
with such illnesses are estimated to be up to $72 billion each year (Minor et al., 2015).
Valuations of the total costs of foodborne illness are comprised of costs related to medical care,
loss of work time, reputation and liability costs, and the costs of regulation and surveillance
(Scharff, 2010).
According to Ogbu (2015) and Filion and Powell (2009), over two-thirds of foodborne
illnesses are attributed to retail food establishments. Among food retailers, substandard hygienic
behaviors and malpractice in food preparation and storage practices are believed to be the most
critical risk factors for foodborne illness. Retail food employees thus function as critical control
points in ensuring the acceptability of any food served by an establishment. Establishing and

9
maintaining a robust food safety culture has been a persistent challenge for food retailers due to
of high turnover rates, low employee motivation, and an unusually high number of non-native
English speakers (Strohbehn et al., 2014). Greig, Todd, Batleson, and Michaels (2007) found that
foods that require more intensive and frequent contact for preparation are more likely to be
contaminated. In a separate study that surveilled restaurant employees, handwashing was only
completed one-third of the total necessary times (Pellegrino, Crandall, O’Bryan, & Seo, 2015).
Foodborne illnesses also result from inadequate food preparation and storage practices that lead
to the proliferation and survival of any pathogens that would otherwise not pose a health risk. As
Americans continue to increasingly rely on food prepared outside the home, exposure to food-
related health risks will likely continue to correspondingly increase (Talty, 2016).
Santa Clara County has not been impervious to problems of foodborne illness. While the
vast majority of cases go unnoticed, several notable outbreaks have been the subject of numerous
media reports and lawsuits. One notable case occurred in October of 2015 at a Mexican seafood
restaurant in San Jose (Nelson, 2015). Over 190 people were sickened with the Shigella, a
bacterial illness spread through fecal-oral transmission. The outbreak was eventually traced back
to a single worker who did not properly wash his or her hands prior to preparing the patrons’
food. The 2015 outbreak was widely reported in the media due to its scale, but most outbreaks
and cases go unnoticed and do not garner the same level of attention. Table 1 outlines the
incidence figures of various types of foodborne illnesses derived from the Department of Public
Health’s Open Data Portal. As several have noted, reportable cases of foodborne illnesses only
represent a small portion of the total incidences (Henderson et al., 2006). Further, the County’s
Department of Public Health did not include the Norovirus total in its dataset; Norovirus
infections are said to be one of the most common agents of food-related illnesses (Scallan et al.,

10
2011). One can thus infer that the Department of Public Health’s dataset does not encompass the
true extent of foodborne illnesses in the County.
Table 1: Reportable Cases of Foodborne Illness in Santa Clara County Disease Type Annual Figures
2015 2016 2017 Amebiasis 6 16 4 Campylobacteriosis 494 572 594 Cryptosporidiosis 20 24 39 Giardiasis 117 24 39 Listeriosis 7 5 11 Salmonellosis (non-Typhoidal) 349 344 340 Shiga toxin-producing E. coli (STEC) 117 123 140 Shigellosis 264 151 153 Typhoid and Paratyphoid Fever 20 11 24 Vibrio Infections 9 5 22 Total 1403 1442 1521 Source: Santa Clara County Department of Public Health, 2018
Table 1: Confirmed Cases of Foodborne Illness in Santa Clara County
In order to address foodborne illnesses in the County and reports of noncompliance with
State regulations within the County, the Board of Supervisors approved of new requirements that
food establishments make visible a placard issued by the environmental health inspector
subsequent to an inspection (Santa Clara County, 2014). The inspection reports, along with a
numerical score, are also now posted on the Department of Environmental Health’s dedicated
website. By making inspection information assessable to consumers, county officials hope that
vendors will follow changing consumer preferences and improve compliance with the State’s
retail food code (Santa Clara County, 2013). This paper will attempt to answer the following
question: Has the county’s overhauled food safety program improved compliance with the food
safety laws among Santa Clara County food vendors?

11
Scientific and Regulatory Development
Despite the perpetual entwinement of humans and microbes around food, human understanding
about the existence and nature of such microscopic life only developed in the last 150 years.
Prior to the emergence of food microbiology, ancient civilizations around the world practiced
food preservation techniques such as smoking and salting to prolong freshness and delay the
onset of anything deemed foul to the senses (Anderson, 2011). Others, as indicated in
Mesopotamian and Abrahamic texts, emphasized the purity and cleanliness of food. Early
hygienic behaviors related to food resulted from the desires to conform to religious doctrines, not
a scientific understanding of the contamination of food by disease-causing agents. Early
regulatory decrees around the consumption and production of certain foods due to illness
emerged well before the discovery of pathogenic agents. According to Zaccheo, Palmacio,
Venable, Locarnini-Sciaroni, & Parisi (2017), “the leader of the Byzantine Empire, Emperor Leo
VI, forbade the eating of blood sausage because of its association with a fatal food poisoning
now presumed to be botulism” (p. 11). Zaccheo et al. (2017) also noted that it was not until 1683
when Dutch scientist Anton van Leeuwenhoek first viewed and confirmed the existence of
microbial life. This discovery would pave the way for Louis Pasteur, now deemed the father of
food microbiology, to develop the process of pasteurization and contribute to the germ theory of
disease, alongside German chemist Robert Koch (Oberg, 2012). Pasteur and Koch’s germ theory
would effectively lay to rest the idea of the spontaneous generation of bacterial life and bring to
prominence the conceptions of contamination and infection. The scientific advances made by
Pasteur continue to serve as the basis for contemporary food standards and regulations around
the world. Food regulatory standards, however, would take decades to adopt this new paradigm
of microbial contamination (Law, 2003).

12
Federal efforts to regulate the food industry would only emerge after growing public
awareness of the unsanitary environments that accompanied the growth of industrial food
production. According to Law (2003), rapid urbanization and the emergence of industrial
technology created a rift between food production and consumption; consumers “became
increasingly reliant on the market exchange for food” (p. 1105). Following numerous outbreaks
of illness and the publication of Upton Sinclair’s The Jungle, public concern would culminate in
some of the first federal food safety regulations (Anderson, 2011). Among the earliest notable
legislative developments were the Pure Food and Drug Act and the Federal Meat Inspection Acts
of 1906 (Johnson, 2011). Both laws aimed to ensure the quality and integrity of foods produced
in or imported into the United States. Law noted that subsequent laws, such as the Federal Food,
Drug, and Cosmetics Act of 1936 and the Restaurant Sanitation Program of 1934, would expand
the scope of the 1906 laws, as well as identify which agencies would have statutory authority to
carry out enforcement. These early efforts to ensure food safety by the Federal government were
effective in reducing incidences of Typhoidal Salmonella and Botulism that were rampant in the
industrial meat packing facilities. However, as Oberg (2012) noted, the scientific advances made
by Pasteur concerning contamination and germ theory were not reflected in early regulatory
standards. Oberg further found that many early food regulations were focused primarily on
efforts to curtail adulteration and fraud, such as mislabeling and the dilution of spirits to
maximize profits. Any evaluations of the sanitation practices of food producers were based on
sensory cues, such as the appearance of rotting carcasses or foul odors (Ogbu, 2015). Although
early food regulations were effective in mitigating large foodborne illness outbreaks, many of
these earlier standards are today deemed scientifically outdated.

13
Cotemporary efforts by the federal government in ensuring the safety and integrity of
foods eaten by Americans is dictated by a number of statutes and overseen by several federal
agencies. The three primary agencies currently responsible for safeguarding the nation’s food
supply are the Centers for Disease Control and Prevention (CDC), Food and Drug
Administration (FDA), and the United States Department of Agriculture (UDSA). The CDC is
tasked with investigating interstate outbreaks of foodborne illness (Morris, 2017). Surveillance
activities are also undertaken alongside local governments to prevent any local outbreak from
becoming a national concern. The FDA’s role in ensuring food safety is statutorily outlined in
the federal Food, Drug, and Cosmetic Act (Orberg, 2012). This law ensures the safety and
integrity of all foods, excluding meat, poultry, eggs, and certain seafoods. Of particular interest
to this paper is the FDA’s role in promoting retail food safety and hygiene. Retail foods
transactions are intrastate in nature, so the responsibility of regulating such activities is vested
with state and local governments (Ogbu, 2015). However, the FDA provides guidance through
its Retail Food Code to the states; the states, in turn, govern the practices of local regulators
(“Evolution of Food Safety”, 2012). Finally, the USDA, through its Food Safety and Inspection
Service (FSIS) program, regulates the production and processing of meat and poultry products.
While other agencies also take part to ensure the safety of the nation’s food, these efforts are
ancillary and function as support to the CDC, FDA, and USDA (“Advancements in Public
Health, 1990-1999: Safer and Healther Foods”, 1999).
The FDA’s Retail Food Code provides direction to state governments using the principles
of the Hazard Analysis Critical Control Point (HACCP) system. HACCP is a not an exacting
plan to be followed but instead employs a systems-based approach where risks for contamination
are believed to be encountered and reduced to a level considered satisfactory (Taylor, 2001).

14
Instead of traditional inspections based on an inspector’s evaluation of a food producer during a
point in time, HACCP guidance directed regulators to examine a producer’s quality control
processes. According to Sperber and Stier (2009) and Axelrad (2006), HACCP is comprised of 7
foundational principles used to minimize foodborne risks:
1. Performance of a hazard analysis to identify points of the production or preparation
process where risks can be introduced;
2. Identification of critical control points where the risks can be acted upon;
3. Outlining parameters, or limits, of the critical control points to decease the likelihood
of contamination from biological, chemical, or physical threats;
4. Developing a process to monitor critical control points to ensure that limits are not
exceeded;
5. Designing corrective actions that would be introduced in the event that a limit
assigned to a critical control point is exceeded;
6. Instituting verification procedures to determine the effectiveness in minimizing the
occurrence of hazards;
7. Ensuring that a sound recordkeeping system is in place.
HACCP is considered a flexible framework that can be and has been applicable to all phases of
the food production process, including processing and retail preparation (Weinroth, Belk, &
Belk, 2018).
HACCP was developed in the 1960s by Pillsbury and NASA during a joint effort to
minimize the proliferation of pathogens during extended space endeavors (Weinroth, Belk &
Belk, 2018). However, it was not fully embraced by the federal government and food industry
until 1993 after an E. coli outbreak hospitalized over 700 and resulted in the deaths of 4 children.

15
Today, HACCP is widely embraced in the United States and across developed nations. The
FDA’s Retail Food Code, a non-compulsory document established to provide guidance to state
public health departments, incorporates HACCP’s principles of quality control and risk
management (Axelrad, 2006). State and local regulatory agencies have been receptive in
incorporating HACCP into their respective food codes. According to the FDA, there are 66 state
agencies responsible for ensuring retail food safety throughout the country, and all but two
agencies have at least partially incorporated the FDA’s Food Code standards into their own
respective codes (“Adoption of the FDA Food Code by State and Territorial Agencies
Responsible for the Oversight of Restaurants and Retail Food Stores”, 2016). The California
Retail Food Code, which governs all county and local retail inspection programs, also employs
many of the risk-mitigation controls outlined by the FDA Food Code and HACCP.
The California Retail Food Code was signed into law as SB 144 in 2007 and lays out the
parameters for local enforcement agencies to follow (“Laws, Policies, and Legal Issues”, 2019).
The Code outlines the required food safety and preparation standards that are believed to
minimize the risk of foodborne health risks. According to Ogbu (2015) retail establishments are
defined in the Code as
an operation that stores, prepares, packages, serves, vends, or otherwise provides foods
for human consumption at the retail level. Permanent or nonpermanent food facilities
include, but are not limited to restaurants, public school cafeterias, restricted food service
facilities, mobile support units, temporary food facilities, vending machines, and certified
farmers’ markers. (p. 8)
Under the Retail Food Code, county governments are the principle entities responsible for
enforcing the code. However, a few cities, such as Berkeley, have opted to develop their own

16
enforcement programs. The Retail Food Code does not impose a prescribed checklist for
enforcement agencies to follow. Instead, it broadly outlines the components of retail food
preparation that are to be inspected; these are the areas where foodborne hazards are most likely
to occur (Ogbu, 2015). Some examples include evaluations of employee hygiene practices,
temperature management, and the presence of pests. Also articulated by the Retail Food Code are
the levels of severity of any findings of non-compliance. Anything deemed an imminent health
hazard is classified as a major violation, and potential hazards not considered an imminent threat
are considered minor violations. Any food establishment that is determined to have committed a
major violation is subject to immediate closure unless a suitable corrective action is taken (Santa
Clara County, 2013). Environmental health inspectors are tasked with implementing the statutory
mandates of the State Retail Food Code but use their own judgements to determine compliance
and the adequacy of any corrective actions taken. Also outlined by State law is the requirement
that retail food establishments make inspection reports available to consumers (Susko, Putnam,
& Villareal, 2013). However, the law only requires information to be presented upon request. No
requirements are imposed on either the local agencies or venders to anticipate consumer requests
and make the data assessable online or on storefronts (“Excerpt from the California Retail Food
Code”, 2018). Local enforcement agencies, such as Santa Clara County, also have broad
discretion to establish their own grading systems, if any.
Across California, local enforcement agencies responsible for implementing the Retail
Food Code have each pursued their own grading metrics or systems. According to Ogbu (2015),
some of the types of placard grading systems found around California include letter grading,
percentage grading, and color-coded grading. Some of the less populated counties in the northern
part of the State employ neither a grading system nor a placard posting requirement, but many do

17
make their inspections reports available online. Such placard grading systems are designed to
convey the findings of the most recent inspection in a succinct and accurate manner to potential
patrons of a food establishment (Simon et al., 2005). While no research was found on the
efficacy of one different grading system compared to the others on improving public knowledge
and health, some have contended that letter grading systems may be more difficult to
comprehend for English language learners or those not accustomed to letter-based academic
grading systems (Ogbu, 2015). Systems that use a numeric or percentage-based system, such as
the one in San Francisco, may fail to convey the severity of any violations discovered. A
restaurant with one major violation, an imminent health hazard, may have a higher score than
one with several minor violations (Santa Clara County, 2013). Color-coded systems, such as the
one used by Sacramento County, are considered to lack nuance, as establishments with an
excellent record of hygiene and sanitation are grouped together with those that are merely
satisfactory enough to receive a green card. After careful examination of the various systems, the
Board of Supervisors chose to develop a dual approach that combines a color-coded placard with
a numeric score (Santa Clara County, 2014).
In addition to the State Retail Food Code, the State Food Handler Certification Law of
2011 also functions as the one of the primary statutory mandates imposed on local food
establishments. Although not examined in this paper and not directly related to the disclosure
requirements imposed by the State and County, food safety education and certification measures
are believed to be a critical safeguard for public health. Credentialing, unlike disclosure
requirements, is aimed to directly address the knowledge deficiencies of food handlers and
managers (Ogbu, 2015). Under California’s food handler card law, newly hired food employees
whose job entails contact with foods are required to attain a food safety certificate within 30 days

18
of being hired (“California Food Handler Card”). Additionally, certified managers are required to
be onsite and actively engaged in ensuring food handling practices at all times. The certification
requires three hours of training for employees and can be obtained from an accredited vendor
either in-person or online. According to one study (Park, Kwak, & Chang, 2010), food safety
training programs do in fact increase knowledge of the appropriate handling and hygienic
procedures, but desired shifts in actual workplace behaviors require continuous management and
education processes beyond the initial training.
Santa Clara County’s Food Safety Program Santa Clara County’s efforts to modernize its food inspection program were prompted by a local
news investigation, as well as the recognition that technology should be leveraged to disclose
inspection information (Wadsworth, 2013). In 2013, an investigative report by the local NBC
news affiliate found that a number of food establishments refused to share inspection reports
when requested, in violation of the State Retail Food Code (Susko, Putnam, & Villareal, 2013).
At the time of the report, Santa Clara County had no grading system in place and no storefront
placarding requirements. Consumers were entirely reliant on either the ineffective disclosure
requirements imposed on establishments, or they were left to undertake a meticulous search for
the data on the County’s dated website. If the County’s Department of Environmental Health
(DEH) was notified of such a violation, an inspector would visit the establishment and ask if the
report was readily available (Santa Clara County, 2013). During the 2013 initial discussion with
DEH staff, it was concluded that no practical enforcement mechanisms existed; food
establishments that denied an inspection report to a member of the public would not behave in a
similar manner when asked by a County official, and no penalties would be levied. In March of
2013, the Board of Supervisors requested that the DEH begin a feasibility study of instituting a

19
new placard requirement (Santa Clara County, 2014). As part of its initial efforts, DEH would
consult with a variety of stakeholder groups, including consumer advocates and business interest
groups (“Placarding and Scoring Program”, 2014). A survey of neighboring jurisdictions was
also completed by the DEH and Board of Supervisors to compare the various grading systems
that had been in effect for years. In April of 2014, the Board of Supervisors unanimously
approved of the Ordinance No. NS-517.86 that required the placing of color-coded placards that
conveyed the findings of inspections. According to the 2014 Board of Supervisors’ meeting
notes, the color-coded placard would be complemented by a numerical score which would be
available on the county’s redesigned DEH website.
The system adopted by the Board of Supervisors integrates the risk factor principles of
the HACCP manifested in the placarding requirement with a numeric scoring system. Under the
new ordinance, the color-coded placard issued after an inspection corresponds to the presence of
any major violations found (Santa Clara County, 2014). A green pass placard is issued if no more
than one major violation is found, and the violation must have been corrected during the time of
inspection (See Appendix A; “Placarding and Scoring Program”, 2014). A yellow, conditional
placard indicates two or more major violations discovered; corrective actions must have been
implemented at the time of inspection in order for a conditional placard to be issued (“Food
Safety Program – Placarding and Scoring”). Conditional placards require a follow-up inspection
to ensure that corrective actions undertaken during the inspection are indeed satisfactory. Finally,
if any number of major violations are discovered and no corrective action can be feasibly taken
at the time of inspection, the restaurant must be immediately closed and is issued a red closed
placard. A follow-up inspection may be conducted at the owner’s request once it is believed the
situation has been rectified.

20
The numerical scoring system that supplements the color-coded placard requirement is
based on whether or not an establishment receives any of three distinct violation classifications.
The three types of violations can each result in a numerical score deduction on an inspection
report (Santa Clara County, 2013). The scores are not indicated on the storefront placard but
instead posted on the County’s dedicated website for inspection results (Appendix B). A perfect
score represents a numerical score of 100, and points are deducted with every violation found;
the amount deducted will depend on the violation type (“Food Safety Program – Placarding and
Scoring”). Major violations represent the same imminent health hazards that determine the
placard color issued and also result in an eight point deduction. Minor violations are those that
can pose health hazard if not rectified but are not considered imminent threats to public health
(“Placarding and Scoring Program”, 2014). These violations are each followed by a three point
deduction from the total score. Lastly, the County deducts two points for each good retail
practice violation discovered. Good retail practice violations include and consider factors such as
the general cleanliness of the facility and its active onsite management (Santa Clara County,
2014). Both minor and good retail practice violations do not affect the color of the placard
issued.
The inspection report is completed on a standardized form which lists out the 50 violation
types (See Appendix C). Along with numerical scores and any violations found, the form
includes a narrative report and the inspector’s feedback on the staff’s knowledge of best practices
in food hygiene. With the implementation of the new placarding and scoring program, County
officials prognosticated that the availability of new information would promote public health by
incentivizing food vendors to improve their sanitation and preparation processes as a reaction to
increased consumer information. The literature on transparency regulatory policies and their
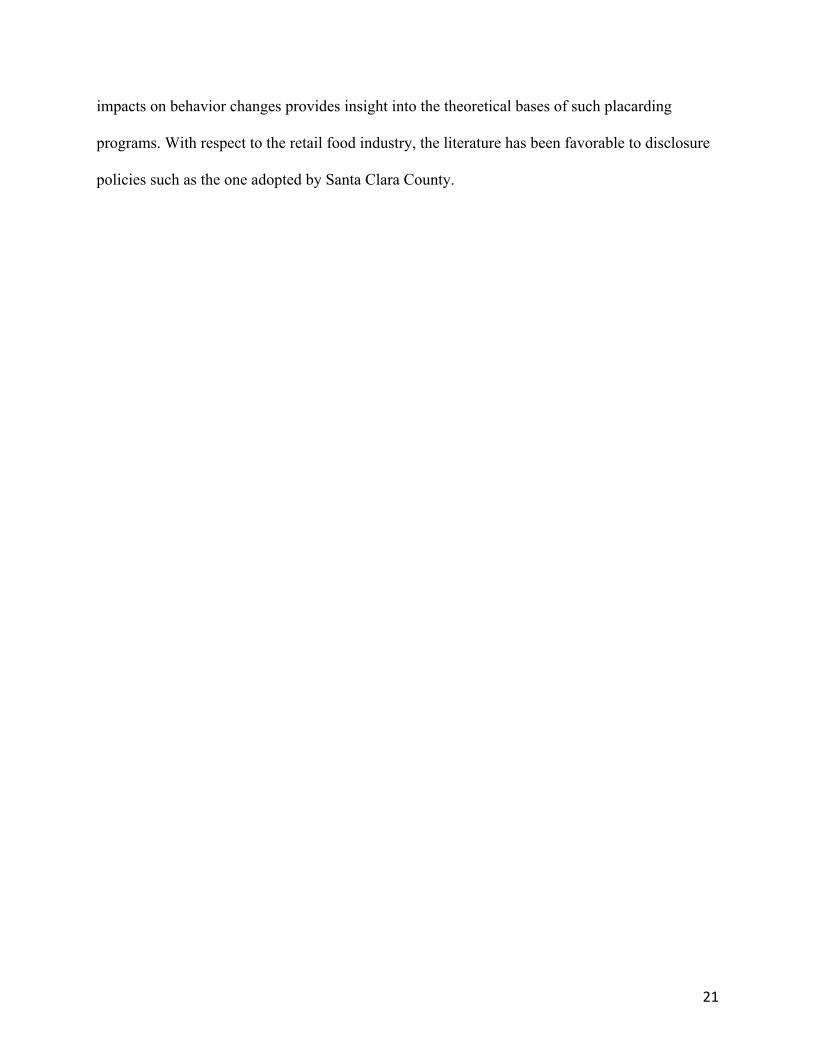
21
impacts on behavior changes provides insight into the theoretical bases of such placarding
programs. With respect to the retail food industry, the literature has been favorable to disclosure
policies such as the one adopted by Santa Clara County.

22

23
LITERATURE REVIEW Restaurant placarding or inspection transparency programs, such the one in Santa Clara County,
are reliant on the assumptions that inspections do mitigate and prevent illness, that consumers are
able to assess the information published, and that food establishments will respond to consumer
behaviors. Over the years, research on placarding programs has examined each of these elements
using models of economic incentives and information processing and assessment. The
conclusions in the body of research that exists do appear to comport with the assumptions that
serve as the basis for the publishing of inspection data. Moreover, the impacts of inspections and
disclosures on actual health outcomes do appear to be beneficial. These models together
comprise what Fung, Weil, Graham, and Faggoto (2004) refer to as the transparency action
cycle. The subsequent literature cited will examine the nature of each of the causal pathways that
together serve as the basis for transparency regulations in environmental health.
Transparency regulatory schemes are viewed as an emerging, viable policy alternative to
standards-based regulation and subsidization. It has been noted, however, that the success of
such policies is not guaranteed to achieve the desired ends of policymakers (Fung, Weil,
Graham, and Faggoto (2004). Fung et al. (2004) note that such policies either introduce new
information or make assessable existing information to rectify critical knowledge gaps that
prevent individuals in a population from making the best possible decisions. They further note
that cross domains, policymakers have deemed it necessary to protect the public by disclosing
the relevant streams of information in order to mitigate any associated risks with the decisions of
concern. The effectiveness of these policies is, though, contingent upon shifts in behavior from
both the parties involved in evaluating the information, and the parties that either disclose the
information or that the information concerns (Winston, 2008). If the changes in behavior are
aligned with the intent of policymakers, the disclosure policy is deemed effective.

24
Inspections and Health Outcomes While disclosing inspection data is aimed to change the habits of both consumers and food
vendors alike, policymakers are concerned with maximizing public health outcomes (Jin &
Leslie, 2003). Inspection policies and processes assume a nexus between the determinations
made during inspections and actual foodborne-related illness health outcomes; more positive
evaluations are supposed to correspond to some more positive measure of health. Guidelines and
statutes, both at the federal and state levels, have increasingly focused on the risk-factors that are
highly associated with incidence of foodborne illnesses (Ogbu, 2015). Inspections conducted by
Santa Clara County are in turn focused on these risk-based factors (“Placarding and Scoring
Program”, 2014). These risk factors are comprised of hygiene practices and facilities
maintenance, and they are believed to account for 75 percent of reported illnesses (Fleetwood et
al., 2018). Although many jurisdictions do use risk-based inspections, inquiry into the extent of
any relationship between inspection results and health poses a significant challenge for
researchers due to the jurisdictional variations in classifying violations, inspector differences,
and the dependent variables used to measure health (Yeager et al., 2013). Still, several studies
have attempted to provide some insight into the efficacy of inspection efforts in promoting better
health.
Several studies have attempted to gauge the impacts of food establishment inspections on
the incidences of foodborne illness outbreaks by comparing data on establishments where
outbreaks had occurred to those where none occurred over a given period of time. As previously
noted, these studies employ varying measures of health risks or outcomes and examine different
jurisdictions that have adopted their own respective approaches to inspecting food vendors.
Among the earliest studies examining the extent of any association was a study that examined

25
restaurants in King County, Washington between 1986 and 1987 (Irwin et al., 1989). Irwin,
Ballard, Grendon, & Kobayashi (1989) examined the scores and violations of restaurants that
had reported outbreaks of foodborne illnesses, and they compared the data to those control
restaurants that had no such reports of illness. They discovered that there was indeed a
heightened risk for contracting a biological foodborne illness among restaurants that received
lower scores. According to the study, “Restaurants of an overall score of less than 86 were about
five times more likely to have an outbreak. Restaurants that received an inspection result of
unsatisfactory or suspended were three times as likely to have an outbreak” (Irwin et al., 1989, p.
589). Certain infractions that involved not keeping food at a proper temperature and those
relating to food storage were also found to be statistically significant in their associations with
outbreaks. Another study that compared inspection reports to illness outbreaks in Minnesota
from 2005 to 2011 found no relation between illness and overall scores (Petran, White &
Hedberg, 2012). However, it was found that certain violations were highly likely to be associated
with underlying pathogen classifications that were behind various outbreaks. For example, hand
washing violations and inadequate work policies involving employee illness were more likely to
be found in restaurants that experienced Norovirus outbreaks, while Salmonella outbreaks were
more likely to occur in restaurants that were cited for improper management of food temperature.
In contrast, Cruz, Katz, & Suarez’s (2001) retrospective evaluation of Miami-Dade County
restaurants found no association between overall score and reported outbreaks.
Research conducted using data from Los Angeles and the United Kingdom have
employed different measures to operationalize health outcomes or risks. In their study of food
establishments in Norther Ireland, Fleetwood et al. (2018) compared compliance scores to data
from the United Kingdom’s Local Authority Enforcement Management System (LAEMS) and
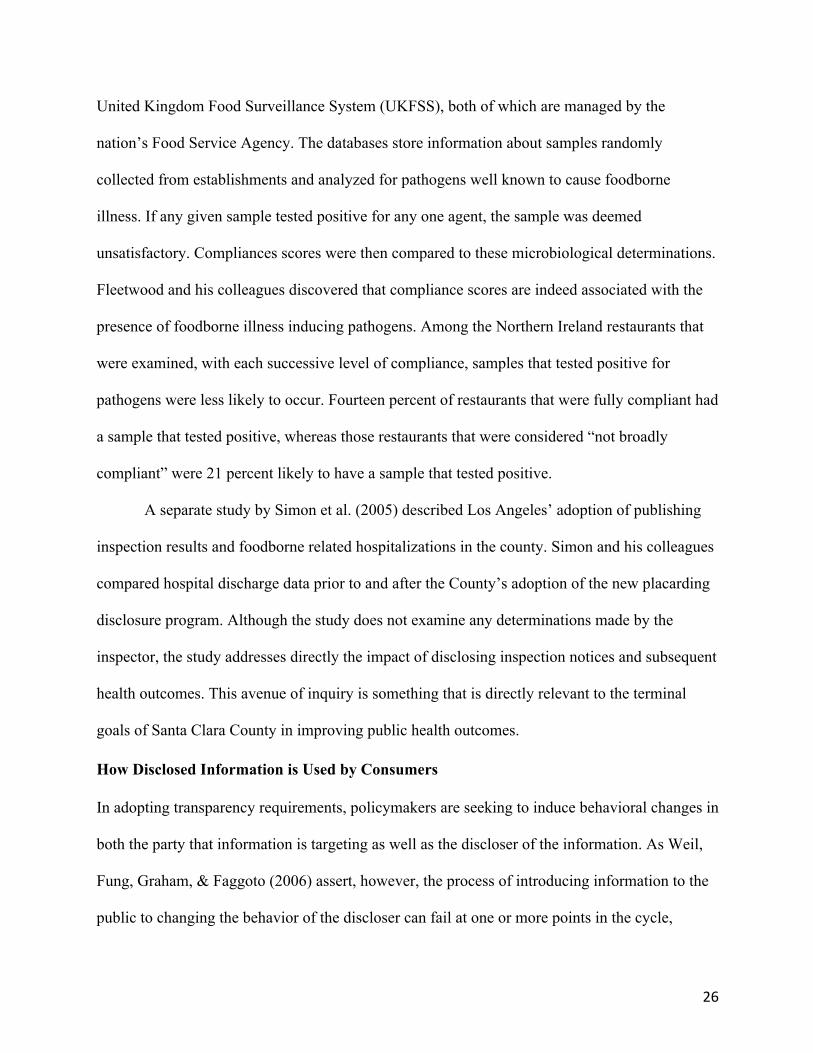
26
United Kingdom Food Surveillance System (UKFSS), both of which are managed by the
nation’s Food Service Agency. The databases store information about samples randomly
collected from establishments and analyzed for pathogens well known to cause foodborne
illness. If any given sample tested positive for any one agent, the sample was deemed
unsatisfactory. Compliances scores were then compared to these microbiological determinations.
Fleetwood and his colleagues discovered that compliance scores are indeed associated with the
presence of foodborne illness inducing pathogens. Among the Northern Ireland restaurants that
were examined, with each successive level of compliance, samples that tested positive for
pathogens were less likely to occur. Fourteen percent of restaurants that were fully compliant had
a sample that tested positive, whereas those restaurants that were considered “not broadly
compliant” were 21 percent likely to have a sample that tested positive.
A separate study by Simon et al. (2005) described Los Angeles’ adoption of publishing
inspection results and foodborne related hospitalizations in the county. Simon and his colleagues
compared hospital discharge data prior to and after the County’s adoption of the new placarding
disclosure program. Although the study does not examine any determinations made by the
inspector, the study addresses directly the impact of disclosing inspection notices and subsequent
health outcomes. This avenue of inquiry is something that is directly relevant to the terminal
goals of Santa Clara County in improving public health outcomes.
How Disclosed Information is Used by Consumers In adopting transparency requirements, policymakers are seeking to induce behavioral changes in
both the party that information is targeting as well as the discloser of the information. As Weil,
Fung, Graham, & Faggoto (2006) assert, however, the process of introducing information to the
public to changing the behavior of the discloser can fail at one or more points in the cycle,
27
effectively rendering the entire policy ineffective. For the county’s newly transparency-focused
food program to achieve its intended ends, the information must be incorporated into the
decision-making calculus of the consumers patronizing food vendors in the jurisdiction.
Policymakers requiring the disclosure of such information must consider the constraints on
information processing capacity and the propensity to rely on information cues to make decisions
(Henson et al., 2006). Fung, Graham, Weil, & Faggoto (2004) claim that for the information to
be valuable, it must be comprehensible, relevant to the issue at hand, and proximate to the point
where the person makes the decision in time or spatially. Research examining the impacts of
publishing or posting inspection data is sparse, but what has been done does appear to
substantiate the utility of making inspection data available for consumers to consider and act on.
Existing research on the need and demand for readily available inspection data indicates
that consumers are interested but lack the information to make the most informed decisions about
which establishments to patronize. Jones and Grimm (2008) found that the public is unanimously
aware that establishments are subject to inspections by local officials. Within the same sample of
individuals, 87 percent believed inspection data should be easily assessable before deciding
where to eat; a plurality identified a score of 90 on a 100-point scale as the minimum acceptable
score for a restaurant. Dundes and Rajapaska’s (2001) study of college undergraduates found
similar results but applied to a hypothetical alphabetical grading metric. When presented with the
opportunity to evaluate an establishment on a numerical or alphabetical scale, subjects in both
studies indicated preferences for only those that received highly positive evaluations. When not
equipped with adequate information on restaurant hygiene, consumers resort to using arbitrary,
less reliable cues, including the number of individuals seen dining and reputational station
among family and friends (Henson et al., 2006).

28
In seeking to rectify the information asymmetries consumers face when choosing where
to purchase food, policymakers assume that the information will be both processed and acted on.
The research on how consumers use inspection data does support the idea that when consumers
are provided with comprehensible information that is provided in a manner that is proximate to
the point of decision-making, the information can be used to seek to minimize risks of foodborne
illness. Harris, Hanks, Line, & McGinley (2017) found that consumers will process information
heuristically when confronting a positive score. Conversely, if a score is interpreted as negative,
the prospective consumer will process any provided information in a systematic manner. They
add, however, that the placard must be posted in a visible spot and presented in a comprehensible
manner, consistent with the aforementioned requirements of information to be integrated into an
individual’s decision-making calculations (Fung, Weil, Graham, & Fagotto, 2004). Henson et al.
(2006) found that the posting of inspection results was not as salient in the decision of whether to
dine at a particular restaurant as other visual cues, including perceived cleanliness and number of
patrons. However, taken together, subjects did report hygiene as a dispositive factor in whether
or not to dine.
Disclosure and the Incentives to Motive Changes Among Food Retailers Once consumers are provided with the information to make informed decisions about the risks
associated with patronizing a particular establishment, food vendors themselves would ideally be
motivated by market incentives to change their behaviors to meet shifting consumer preferences.
In order for the policy change to be deemed effective, behaviors on the part of the disclosers
need to shift in accordance with the goals of the policymakers (Fung, Weil, Graham, & Fagotto,
2004). In the case of Santa Clara County’s efforts to provide consumers with more information
about vendor hygiene, vendors are expected to exercise greater compliance with safety practices

29
and norms as outlined by the State and County (“Placarding and Scoring Program”, 2014).
Several studies have attempted to gauge the impact of the disclosure of hygiene information on
vendor practices. The results have indicated that making such information assessable can be an
effective tool for motivating such changes.
Studies attempting to gauge the nature and extent of the response to disclosure policies
have yielded largely positive results. In their examination of Los Angeles County restaurants in
1998, Jin and Leslie (2003) found that the implementation of placarding postings did in fact raise
subsequent scores by 5% (2003). Fielding, Aguirre, & Palaiologos (2001) were led to similar
conclusions in a study also done of Los Angeles County. A separate study of restaurants in Salt
Lake City found that the jurisdiction’s launching of a website where inspection results would be
posted was followed by a decrease in the number of critical inspection violations by up to 30
percent for some inspection categories (Waters, VanderSlice, DeLegge, & Durrant, 2013). In a
later study by Jin and Leslie (2009), the perceived salience of restaurant reputation and changes
following inspection determinations varied by the type of establishment. Chain restaurants
believed they were less susceptible to critical evaluations by inspectors due to their national
profiles.
Other studies pursue other methods of inquiry to understand the impact of reputational
incentives on vendor behaviors. According to Makofske (2017), growing ubiquity of social
media platforms, and informal sharing of relevant information, has become an increasingly used
tool for consumers in choosing where to spend their money. The same study also notes that
platforms such as Yelp have partnered with local jurisdictions to post inspection data on their
websites. Inspection data of Santa Clara County establishments is posted alongside Yelp reviews
following an agreement between the company and HD Scores, a company that collects such

30
information for public agencies (Yurieff, 2018). It is not believed, however, that HD Scores has
a formal partnership with the County to disseminate the information. Rather, the company likely
obtained the information from the County’s own website. In a separate study, Almanza, Ismail,
and Mills (2002) examined the impact of media reports of restaurant hygiene on food handling
behaviors. The study found that they were in fact responsive to media reports on inspection
records, and subsequent scores were found to increase.
The body of literature on the impact of the compulsory disclosure of establishment
inspection data provides some basis for the adoption of such policies. Existing research covers
most of the causal pathways identified in the desired transparency action cycle from disclosure to
potential changes in consumer behavior to shifts towards more positive health outcomes (Fung,
Weil, Graham, & Fagotto, 2004). From the impact of inspections on mitigating health risks to the
desired changes to safer food establishment handling practices, the research leads one to believe
that the aims of policymakers in instituting transparency as a regulatory tool can be effective in
the area of food safety. Also following an examination of the literature, notable lines of inquiry
have yet to be undertaken by researchers. This includes studies on the various placard formats
and the role of other disclosing entities such as Yelp in shaping consumer judgements about
where to spend their money.

31
METHODOLOGY In order to ascertain whether or not Santa Clara County’s efforts to modernize its food safety
program have achieved its intended outcomes, an outcome evaluation served as the most
appropriate evaluative approach to employ. In their book, Program Planning and Evaluation for
the Public Manager, Ronald and Kathleen Sylvia noted that articulating the theoretical and
program goals, inputs, and measures aids in understanding how the program is intended to work,
as well has how the various components interrelate (2012). In order lay out a program’s
components to conduct an outcome evaluation, Sylvia and Sylvia suggested the use of a visual
instrument to succinctly lay out each element of a given program. A logic model will outline
seven elements of a program: (1) theoretical goals, (2) program goals that are defined by
program administrators, (3) program functions, (4) identifying intermediate and measurable
goals that operationalize less actionable program goals, (5) program measures, (6) program
outcomes, and (7) outcome valence. According to Sylvia and Sylvia, the fourth step, program
measures, is the stage where any evaluative efforts are determined. In addressing the program
measures of performance, the proximate indicators are assessed for any shifts in the program’s
intended direction. Table 2 provides information on each component of the County’s food safety
program as a first step of the outcome evaluation.

32
Table 2: Logic model for Santa Clara County’s Food Program Theoretical Goals Program
Goals Program Functions
Proximate Indicators
Selected Program Measures
Program Outcomes
Outcome Valance
T1: Ensuring the safety and integrity of all foods served to patrons of Santa Clara County food establishments
G1: Increasing compliance with the State Retail Food Code (T1)
F1: Conducting routine and/or follow-up inspections
I1: Number of reported foodborne illnesses in the County (F1-4)
M1: Comparing the number of foodborne illnesses reported (I1)
O1: (M1) +/-
G2: Minimizing the incidence of foodborne illnesses in Santa Clara County (T1)
F2: Issuance of a color-coded placard
I2: Number of major violations found (F1), (F2)
M2: Comparing number of major violations found in first year versus subsequent years (I2)
O2: (M2)
G3: Ensuring that consumers have sufficient information about an establishment’s record of hygiene and food handling practices (T1)
F3: Posting inspection reports and numerical scores on County DEH’s updated website
I3: Number of minor violations found (F1)
M3: Comparing minor violations found in the first year and subsequent years (I3)
O3: (M3)
F4: Revoking the operational permits of any establishments found to have imminent health hazards that cannot be corrected (G1), (G2)
I4: Number of closures or red cards issued
M4: Have the number of closures increased since the adopted on the new placarding and scoring program? (I4)
O4: (M4)
Table 2: Logic Model for Santa Clara County’s Food Safety Program
As part of the evaluation of Santa Clara County’s Food Safety Program, a quasi-
experimental, longitudinal statistical analysis was used to examine program measures M2 and

33
M3. In order to gauge the effect of both program measures, paired sample t-tests were performed
in an attempt to answer the following questions:
a. Are there any statistically significant differences in the proportion of restaurants found to
have a major violation between 2015 and 2017?
b. Are there any statistically significant differences in the proportion of food establishments
found to have a minor violation between 2015 and 2017?
Although the County adopted the ordinance in April of 2014, the program did not take effect
until October of that year (Santa Clara County, 2014). Therefore, 2015 was the first full year of
implementation, and the first time that data from all food establishments in the County are
available for analysis. Also, 2017 was used as the final year of evaluation instead of 2018 due to
incomplete inspection data from 2018. Statistical significance will be determined using the
standard confidence level of 95%, or a p-value of .05. SPSS version 25 will be used to perform
both analyses. Due to the limitations of the dataset, analysis on placard colors issued could not be
feasibly completed. Further, because of the County’s record retention policy of three years, the
analysis examined Years 1 (2015) and 3 (2017) of the program. The design did not use a true
pre-test/post-test analysis. The methods employed in answering questions A and B are
comparable to Ogbu’s (2015) analysis of Alameda County’s adoption of a new hybrid color-
coded and scoring scheme. However, due to the disparities in how Santa Clara County and
Alameda County categorize and group infractions, the results generated were not comparable.
Additionally, like Ogbu’s analysis, the results will also be broken down according to
establishment type. However, the classification system employed by Alameda County somewhat
differs from that of Santa Clara County’s. Both measure size, but the numerical delineations are
distinct.

34
Prior to the statistical analysis being performed, the several steps in data collection and
re-coding were performed. All data was collected through a public records request submitted to
the Santa Clara County Department of Environmental Health. The data was received in an .xlsx
format, and included numerical facility identification codes, establishment name, establishment
type, address, inspection date, each violation found, violation severity, and a violation
description that corresponds to the labels on the county’s standardized inspection form. For the
purpose of the analysis, information on an establishment’s address, name, and violation
description were hidden in the dataset due to the information’s limited utility to perform the
analysis. A random sample of 382 establishments was drawn from the over 6000 available using
the tools available on the Microsoft Excel platform. Data was then recoded as a binary 0 or 1
variable to indicate the presence of major and minor violations to tests hypotheses A and B.
Finally, the recoded data was transferred to SPSS in order to perform the inferential statistical
analyses. To ensure validity, only routine inspection data was used in the sample. Also, only
establishments with data available for both years were selected. In answering questions A and B,
this research attempts to answer the broader research question of this paper of whether or not the
revamped Food Safety Program has improved compliance with food safety laws.

35
FINDINGS Descriptive Statistics This study examined 382 of the roughly 6,400 retail food establishments in Santa Clara County.
The composition of the sample is also presented according to the categories presented in the
dataset provided by the Department of Environmental Health. Table 3 presents the sample
demographics and frequencies. As displayed, the County categorizes retail food establishments
according to their respective sizes, as measured by the number of people employed.
Table 3: Sample Demographics of Randomly Selected Establishments N % 0-5 Employees 235 61.5 6-25 Employees 109 28.5 26+ Employees 18 4.71 Schools 20 5.25 Total 382 100%
Table 3: Sample Demographics of Randomly Selected Establishments
Of the 382 retail food establishments randomly selected, smaller establishments which employ 0-
5 individuals make up over 60 percent. Medium-sized are considered those that have 6-25
employees comprise just over 28 percent. Larger establishments and schools together account for
roughly 10 percent of establishments sampled. Grocers are primarily categorized into one of the
three employee count categories, as many prepare food onsite. However, those that do not
prepare food onsite do make up a distinct category, but none were selected to be in the sample.
Also grouped into the categories which identify number of employers are a variety of other
establishments including commissaries, health facilities, and markets. Schools, however, are
included in their own distinct category.

36
270
546
239
526
MAJOR MINOR
Violation Totals
2015 2017
Figure 1: Violations Totals by Type: 2015 vs. 2017
An examination of the total counts of both major and minor violations shows that both
categories of violations have decreased between 2015 and 2017. Figure 1 displays the violation
totals for both 2015 and 2017. Major violations, which are identified by the State Retail Food
Code as posing imminent threats to public health, decreased overall. The number of minor
violations discovered in the sampled establishments also saw a modest decrease in 2017 from
2015. Tables 4 and 5 show violations counts for both 2015 and 2017 and also includes a tally of
each violation type discovered. The tables also illustrate that certain types of infractions
discovered during an inspection are either exclusively major, exclusively minor, or either minor
or major.
Figure 1: Violations Counts by Type: 2015 vs. 2017
For example, if an inspector finds an employee who has a bodily discharge from his or her eyes,
nose, or mouth, the violation would automatically be categorized as major. The findings of any

37
rodents, birds, or insects can be determined to be either major or minor, depending on the
infraction’s severity and the inspector’s discretion. A complete list of infractions and their
designated categorizations can be found in the County’s standardized inspection report in
Appendix C.
Table 4: Major Violations Discovered: 2015 vs. 2017
Table 4: Major Violations Discovered in 2015 and 2017 Violation Description 2015 2017 Total Change Communicable Disease: Did not report, restrict, or exclude a food employee
1 0 1 -1
Discharge 0 0 0 -
Food Contact Surfaces Unclean and Unsanitized 53 29 82 -24
Food not in Food Condition/Unsafe/Adulterated 7 4 11 -3 Food not Obtained from an Approved Source 1 2 3 +1 Hands not Clean/Improperly Washed/Gloves not Used Properly
15 9 24 -6
Hot and Cold Water not Available 7 6 13 -6 Improper Cooking Times and Temperatures 1 0 1 +1
Improper Cooling Methods 16 9 25 -7
Improper Hot and Cold Holding Methods 82 85 167 +3 Improper Reheating Procedures for Hot Heating 0 5 5 -5 Improper Shell Stock Tags/Conditions/Display 0 2 2 -2
Improperly Using Time as a Public Health Control Procedures and Records
9 22 31 +13
Inadequate Handwashing Facilities: Supplied or Assessable 65 54 119 -9 Non-compliance with Variance ROP/HAACP Plan 4 0 4 -4 Observed Rodents, Insects, Birds, or Animals 7 8 15 +2
Sewage and Wastewater Improperly Disposed 2 4 6 +2 Total 270 239 509 Source: Santa Clara County
38
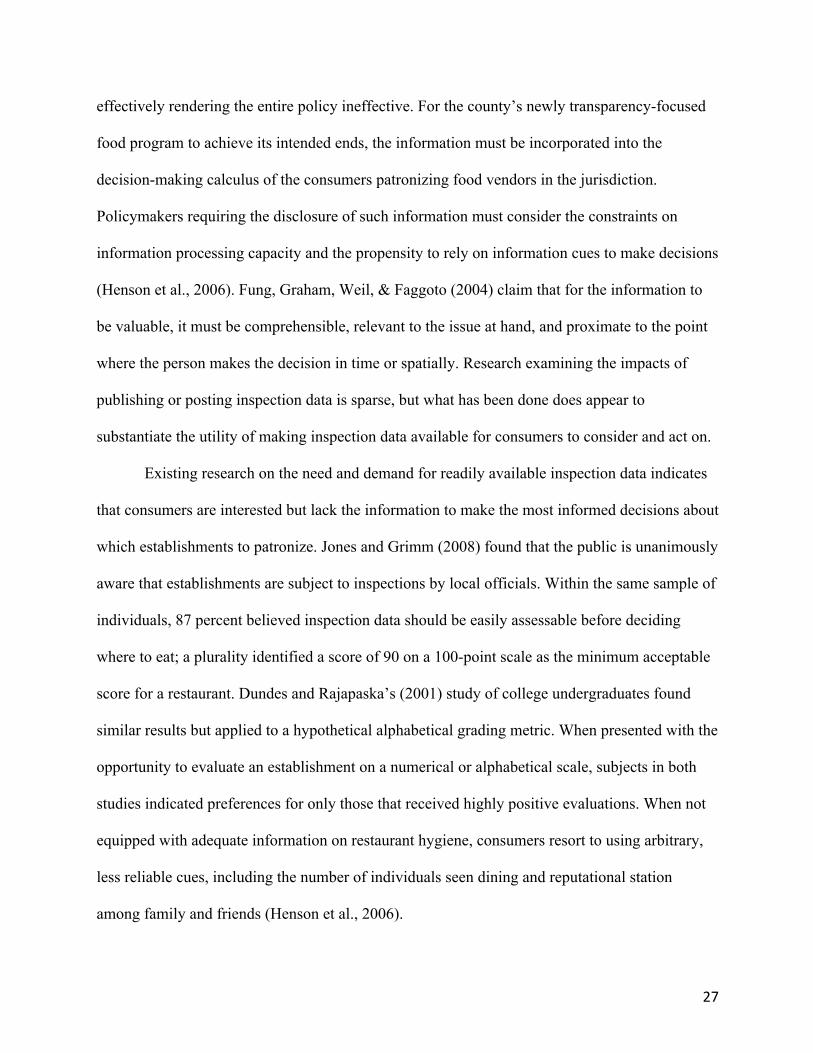
Table 5: Minor Violations Discovered in 2015 and 2017 Violation Description 2015 2017 Total Change Food Contact Surfaces Unclean and Unsanitized 81 64 145 -17
Food not in Good Condition/Unsafe/adulterated 15 12 27 -3
Hands not Clean/Improperly Washed 26 18 44 -8 Hot and Cold Water not Available 56 57 113 +1
Improper Cooling Methods 23 28 51 5
Improper Eating, Tasting, Drinking or Tobacco Use in Food Preparation Area
14 11 25 -3
Improper Hold and Cold Holder Temperatures 49 70 119 21 Improperly Using Time as a Public Heath Control Procedures and Records
10 10 20 0
Inadequate Demonstration of Knowledge; Food Manager Certification
111 100 211 -11
Inadequate Hand wash Facilities: Supplied or Accessible 93 93 186 0
Non-compliance with Consumer Advisory for Raw or Undercooked Foods
2 2 4 0
Non-Compliance with variance/ROP/HAACP Plan 1 2 3 +1
Not in Compliance with Shell Stock Tags, condition 7 7 14 0
Observed Rodents, Insects, Birds, or Animals 48 42 90 -6
Returned and Reservice of Food 2 0 2 -2
Sewage and Wastewater Improperly Disposed 8 10 18 +2 Total 546 526 1072 -20 Source: Santa Clara County
Table 5: Minor Violation Totals: 2015 vs. 2017
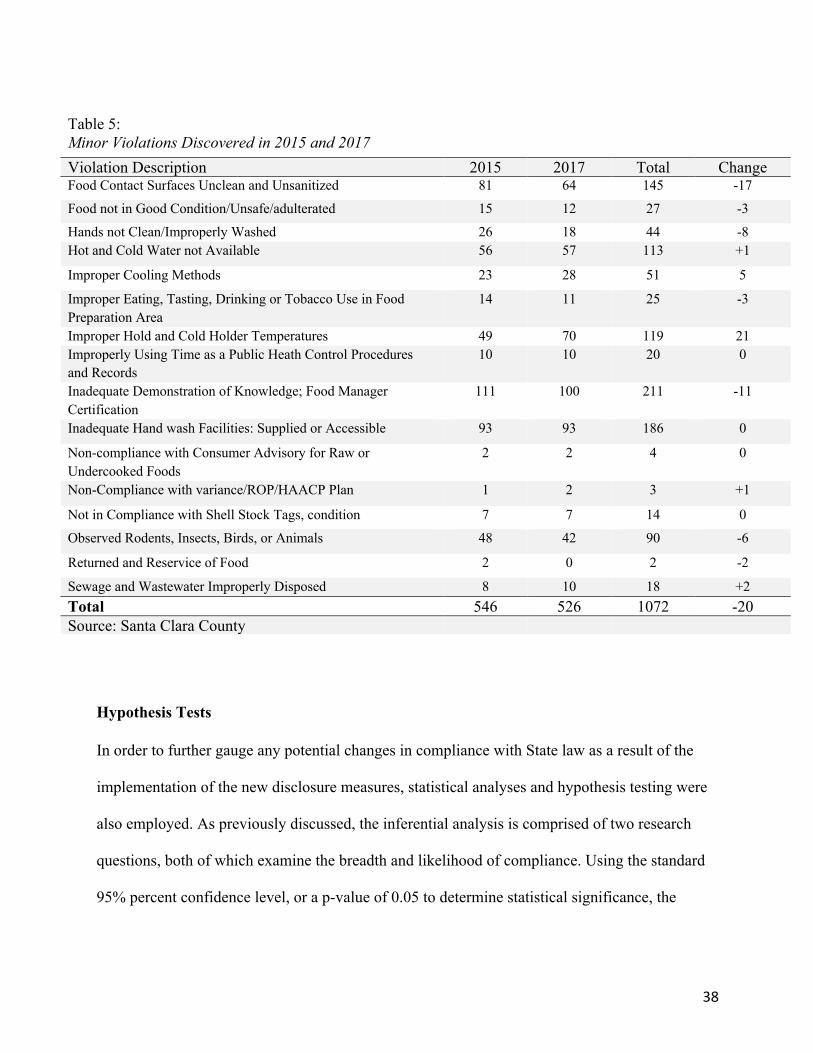
Hypothesis Tests In order to further gauge any potential changes in compliance with State law as a result of the
implementation of the new disclosure measures, statistical analyses and hypothesis testing were
also employed. As previously discussed, the inferential analysis is comprised of two research
questions, both of which examine the breadth and likelihood of compliance. Using the standard
95% percent confidence level, or a p-value of 0.05 to determine statistical significance, the
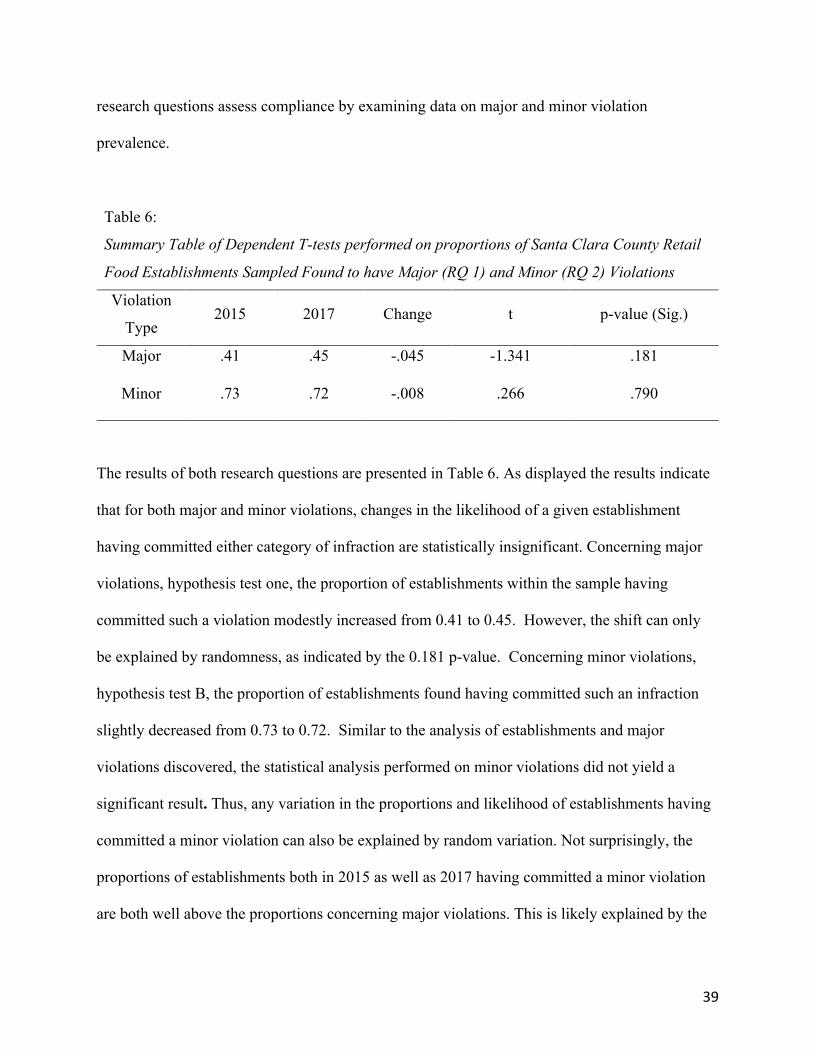
39
research questions assess compliance by examining data on major and minor violation
prevalence.
Table 6:
Summary Table of Dependent T-tests performed on proportions of Santa Clara County Retail
Food Establishments Sampled Found to have Major (RQ 1) and Minor (RQ 2) Violations
Violation
Type 2015 2017 Change t p-value (Sig.)
Major .41 .45 -.045 -1.341 .181
Minor .73 .72 -.008 .266 .790
Table 6: Summary Table for Inferential Statistical Tests of Proportion of Food Establishments Sampled Found to have Major or Minor Violations
The results of both research questions are presented in Table 6. As displayed the results indicate
that for both major and minor violations, changes in the likelihood of a given establishment
having committed either category of infraction are statistically insignificant. Concerning major
violations, hypothesis test one, the proportion of establishments within the sample having
committed such a violation modestly increased from 0.41 to 0.45. However, the shift can only
be explained by randomness, as indicated by the 0.181 p-value. Concerning minor violations,
hypothesis test B, the proportion of establishments found having committed such an infraction
slightly decreased from 0.73 to 0.72. Similar to the analysis of establishments and major
violations discovered, the statistical analysis performed on minor violations did not yield a
significant result. Thus, any variation in the proportions and likelihood of establishments having
committed a minor violation can also be explained by random variation. Not surprisingly, the
proportions of establishments both in 2015 as well as 2017 having committed a minor violation
are both well above the proportions concerning major violations. This is likely explained by the
40
greater number of minor infraction types and the higher thresholds required for a major violation
to be recorded by an inspector.
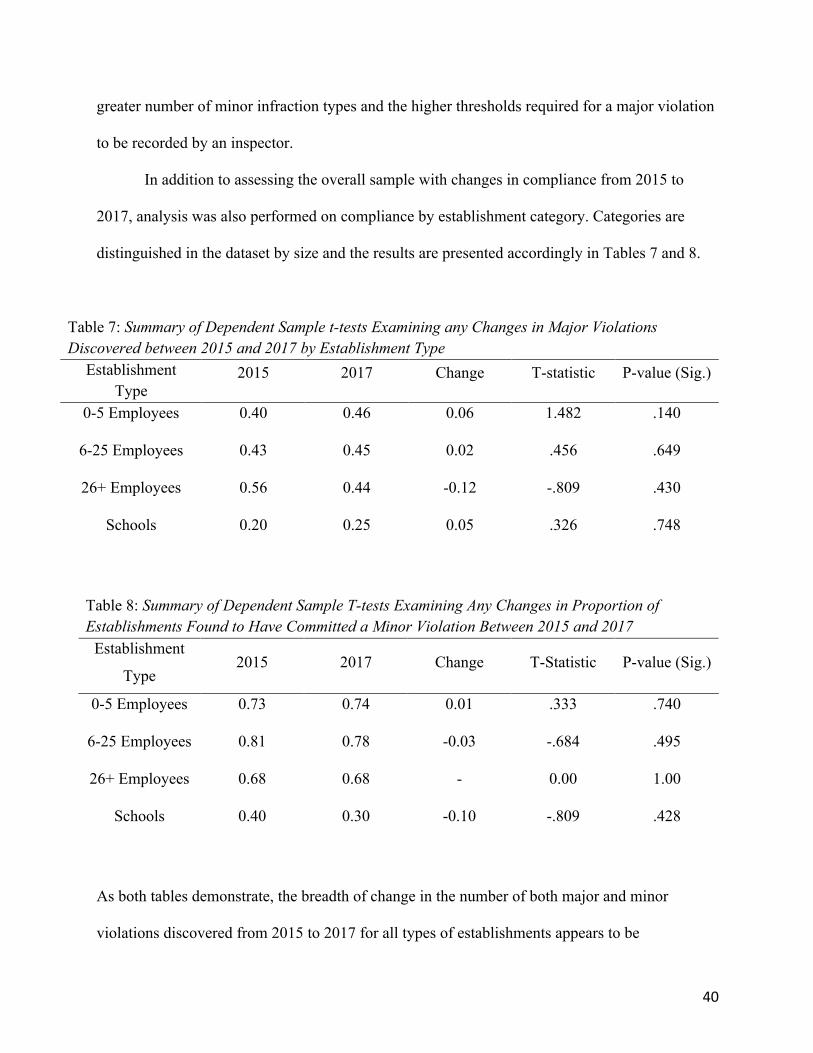
In addition to assessing the overall sample with changes in compliance from 2015 to
2017, analysis was also performed on compliance by establishment category. Categories are
distinguished in the dataset by size and the results are presented accordingly in Tables 7 and 8.
Table 7: Summary of Dependent Sample t-tests Examining any Changes in Major Violations Discovered between 2015 and 2017 by Establishment Type
Establishment Type
2015 2017 Change T-statistic P-value (Sig.)
0-5 Employees 0.40 0.46 0.06 1.482 .140
6-25 Employees 0.43 0.45 0.02 .456 .649
26+ Employees 0.56 0.44 -0.12 -.809 .430
Schools 0.20 0.25 0.05 .326 .748
Table 7: Summary Table for Inferential Statistical Tests Examining Proportions of Sampled Establishments Found to Have Committed a Major Violation by Type
Table 8: Summary of Dependent Sample T-tests Examining Any Changes in Proportion of Establishments Found to Have Committed a Minor Violation Between 2015 and 2017
Establishment
Type 2015 2017 Change T-Statistic P-value (Sig.)
0-5 Employees 0.73 0.74 0.01 .333 .740
6-25 Employees 0.81 0.78 -0.03 -.684 .495
26+ Employees 0.68 0.68 - 0.00 1.00
Schools 0.40 0.30 -0.10 -.809 .428
Table 8: Summary Table of Inferential Statistical Tests Examining Proportions of Sampled Establishments Found to Have Committed a Minor Violation by Type
As both tables demonstrate, the breadth of change in the number of both major and minor
violations discovered from 2015 to 2017 for all types of establishments appears to be

41
underwhelming. While there were modest decreases in the proportions of larger establishments
and schools found to have committed a major violation, the changes appear to be the result of
random variation and cannot be generalized to the broader population. Interestingly, schools
were found in both 2015 and 2017 to have better performed than every other category of
establishments. Table 8 illustrates that the proportions of establishments which have committed
minor violations also remains largely unchanged. Consistent with the aggregated results
displayed in Table 6, minor violations were similarly less likely to be encountered than major
violations for each type of establishment. Also, as with major violations, schools were less likely
to have committed minor violations.
The results of this study attempt to add to the already extensive body of literature on the
matter of inspection data disclosure and changes in food preparation behaviors. Overall, an
examination of both the descriptive figures and the inferential analysis returned mixed findings.
From the 382 sampled establishments, the overall counts of both major and minor violations
discovered appear to have declined. Conversely, the inferential analysis did not demonstrate that
establishments as a whole have shifted their behaviors and practices in the manner intended by
the County.

42

43
ANALYSIS Transparency requirements are becoming an increasingly employed regulatory strategy for
changing private behaviors. As much of the literature discusses, success of such policies is
contingent on the comprehension and integration of the disclosed information by the intended
recipients of the information and, ultimately, changes in behavior of the disclosing parties. More
recently, the compulsory disclosure of information has been considered to be a viable tool in
minimizing the incidence of foodborne illness and promoting public health. Public policy
decisionmakers, such as the Santa Clara County Board of Supervisors, have approved of
enhanced disclosure requirements of inspection and violation data to the public, hoping that the
public will make informed decisions about where to eat. In turn, food establishments in the
County would theoretically modulate their practices, knowing that consumers are equipped with
the pertinent information to make informed decisions. As discussed in the review of the
literature, the results of comparable policies have been mixed. As neighboring jurisdictions have
adopted comparable initiatives since Santa Clara County approved its own, it is incumbent on
researchers and public agencies to ensure that their efforts are in fact achieving their desired
ends. This research paper aims to add to the growing body of literature on enhanced disclosure
regulatory requirements imposed on food-preparing and food-serving establishments,
particularly in the State of California.
The results from this paper’s efforts to evaluate the impacts of Santa Clara County’s
enhanced disclosure policies for local food establishments yielded mixed results. The analysis
was comprised of both a descriptive and inferential analysis and generated conflicting results. In
examining the descriptive violation totals for both major and minor violations, both violation
classifications experienced modest decreases from 2015 compared to 2017. In 2015, the total

44
major and minor violations found among the 382 sampled establishments amounted were 270
and 546, respectively. 239 major violations were discovered in 2017, and 536 minor violations
were found to have been committed. The analysis was also comprised of inferential hypothesis
tests which examined the proportions of establishments sampled having committed either a
major or minor violation. For both major as well as minor violations, any changes in the
proportions of establishments, or likelihood of encountering one in violation, encountered were
found to be statistically insignificant. This was also true when the analysis was applied to the
subcategories of establishments. Although the results of this paper were neither entirely negative
nor positive, the disclosure requirements are still relatively new. The County will undoubtedly
continue to modulate any efforts to ensure compliance with State’s Food Code and promote
public health. Along with ensuring that its new efforts to provide information to consumers are
effective in promoting public health, other strategies and considerations need to be addressed in
order to maximize the desired health outcomes. These include the county’s large ethnic
population, the proliferation of mobile food facilities, and promoting sound management
practices within food establishments. In order for environmental health regulators to successfully
mitigate foodborne illness sources, it is imperative for researchers, practitioners, and
policymakers to further inquire about the nature and extent of their impacts on relevant behaviors
and outcomes.
Limitations In attempting to examine the effects of the County’s efforts to disclose inspection data on
compliance and performance, several obstacles related to data collection and implementation
timelines introduce limitations to the generalizability of the study. First, the updated disclosure
requirements are still a relatively new requirement imposed on local establishments. The

45
requirements, along with the companion website and mobile application, are in year three of
operation. Three years of data points and inspections may or may not be adequate in undertaking
any longitudinal analysis of the policy. Secondly, due to the Department of Environmental
Health’s data retention policy of three years, there is no available inspection data for the pre-
implementation period. Therefore, a true pre-test post-test analysis was not possible to perform,
and insights into whether or not behaviors and compliance have changed as a result of the
program could not be gathered. Instead, similar to Ogbu’s (2015) analysis of Alameda County’s
adoption of comparable disclosure policies, this study was limited to measuring the nature and
extent of compliance during the period of the policy’s existence.
Future Areas of Research Santa Clara County and the broader Silicon Valley are believed to be experiencing a burgeoning
food scene, and some have attributed this to the area’s ethnic and immigrant population. The
County is home to a disproportionate number of Asian residents compared to national and State
level data (“Quick Facts: Santa Clara County, California”). Latinos are more prevalent in Santa
Clara County than nationwide, but slightly less than Statewide. While this may present numerous
opportunities for tourism and economic development, the prevalence of ethnically owned or
themed establishments will likely continue to present challenges to mitigating foodborne
illnesses. It should be noted that the nature of the relationship between ethnic establishments and
ethnic populations is not precisely known, but it can be reasonably inferred that the relationship
is positive. Further, no such data exists on the number of ethically-run food establishments in the
County. None of the data provided by the Department of Environmental Health contains
information of such a nature. The research has been fairly consistent, however, that ethnically

46
managed food establishments have a higher propensity to experience foodborne illness outbreaks
(CDC, 2012).
The literature on ethnic food handling norms, inspection performance, and outbreak
incidence presents a challenge that needs to be taken into consideration by local policymaking
bodies, such as those in Santa Clara County. While various explanations for why ethnic
populations present such a challenge for environmental health professionals, some of the
possible sources include language factors, the use of niche ingredients and equipment, and foods
that are subject to intensive manual preparation (Harris, Murphy, DiPietro, & Rivera, 2015). In
Quinlan’s (2013) analysis of the FDA’s FSNet food surveillance system, it was found that ethnic
minorities experience higher rates of foodborne illness across most bacterial or viral sources.
Patil, Cates, and Morales (2005) found that overall knowledge of food handling best practices
was lower among ethnic Americans than their Caucasian counterparts. Concerning inspection
scores and evaluations, ethnic restaurants were found to have performed significantly lower than
non-ethnic establishments (Roberts, Kwon, Shanklin, Liu, & Yen, 2011). The body of research
implicates ethnically-operated establishments as a notable and growing source of foodborne
illnesses. In order to address this factor, the county will be best served to adopt a much more
concerted and targeted strategy in addition to the disclosure regulations.
In efforts to target ethnic establishments, the county would need to undertake a more
extensive and culturally competent campaign to educate local operators and employees. In a
discussion on the matter, Harris (2016) noted that cultural outreach and educational efforts
concerning food preparation and oversight practices must take into account the perceived
position of the targeted population within the broader local society and its dominant culture, and
the role of food within that particular culture. Promoting standardization in managerial and

47
preparation practices is also believed to be disproportionately absent from ethnic establishments,
and instilling such practices would considerably benefit owners’ bottom line and also serve to
promote public health (Quinlan, 2013).
Another issue that has increasingly vexed local policymakers has been the proliferation of
mobile food facilities, or food trucks. These facilities have been an increasingly ubiquitous
element of urban living and provide a more affordable business model compared to traditional
brick-and-mortar establishments (Kaufman, 2018). Food trucks have grown at a rate of 7.2
percent in the last five years, far outpacing the 2 percent growth in traditional establishments
(“What Data Can Tell Us About the State of the Food Truck Industry”, 2017). Research is sparse
on the implications this phenomenon may have on public health, and data on the numbers of
food trucks operating within Santa Clara County was not included in the dataset used in the
paper. The county, however, has been well aware of the trend and has explored various options
to monitor and regulate these establishments. In one report, the county conceded that mobile
food facilities are not subject to the same regulatory processes as traditional establishments
(“Mobile Food Facilities”, 2018). The challenges in regulating and inspecting such facilities stem
from the irregular routes and venues many food trucks serve. While traditional “roach-coach”
facilities that regularly serve construction sites and business parks have been the predominant
mobile food facilities in the past, the newer business model of specialty trucks that do not follow
an itinerary and only announce their locations through social media have been a larger source of
concern for regulators (“Oversight of Food Truck Operations by the Department of
Environmental Health”, 2013). This has made conducting unannounced inspections on such
operations challenging for Department of Environmental Health staff. Social media and GPS
tracking have been proposed as solutions to confronting these emerging challenges, but no

48
substantive actions have been taken since they were evoked in the 2013 Civil Grand Jury Report.
As the specialty mobile food facility market expands, county officials and the Board of
Supervisors should return to devising solutions to ensure that these producers are satisfactorily
complying with the regulations and best practices related to retail food preparation and service .
In seeking to encourage greater compliance with the State Retail Food Code and
maximizing public health outcomes, local officials must also consider the managerial nuances
and unique challenges of the industry. As previously noted in the discussion, retail food
establishments account for most outbreaks. Within that subset of outbreaks, employee hygienic
practices were reported to be a factor in many of these cases (Harris, 2016). An examination of
the literature shows that undesired behaviors on the part of employees can be largely attributed to
low motivation, demographic and language barriers, and high turnover (Pellegrino, Crandell,
O'Bryan & Seo, 2014). Literature on disclosure policies, particularly pertaining to the retail food
industry, does not address how transparency impacts employee actions. Such regulatory actions
target ownership and management, but the extent to which their subsequent impacts trickle down
to and permeate everyday employee deliberations is unknown. It appears to be more likely that
such top-down approaches motivating behavioral changes are misaligned with the dynamics of
the industry. The efficacy of mandatory training certifications such as California’s Food Handler
Card Law have also been questioned, as the lax certification requirements entail that certification
courses do not optimally impart the knowledge necessary to execute food handling and hygienic
best practices and change behaviors (Park, Kwak & Chang, 2010). One approach suggested by
industry experts has been the development and fostering of a positive food safety culture. As
Wan and Marterer (2018) noted, the development of a food safety culture will allow for best
practices to “become a normal way of doing things and a source of personal pride…Inspections,
49
audits, and testing are all necessary, but they identify problems after the fact and depend on fear
of detection and penalties to incentivize compliance”(¶ 3).
Conclusion Disclosure policies have been an increasingly viable and cost-effective regulatory strategy. In
the realm of retail food safety, such policies have been increasingly adopted in recent years in
efforts to increase food safety behavior performance and minimize foodborne illness cases.
While the research on such policies has been mixed, Santa Clara County has been among the
recent wave or jurisdictions to adopt such policies. This paper attempted to examine the extent of
food safety related behavioral changes as measured by inspection performance metrics outlined
by the State Retail Food Code and implemented by the County Food Safety Program. The results
generated from the descriptive and inferential analyses show mixed results in performance
changes from 2015 to 2017. While overall violation counts decreased, the breadth of compliance,
or the proportion of establishments in violation, remained largely unchanged. Still, the program
provides new information to consumers that was not available prior to the adoption of the
enhanced requirements. This paper was not without its limitations, but it provides additional
avenues for research that must be considered for the county be successful in mitigating
foodborne illness.

50

51
REFERENCES Adoption of the FDA Food Code by State and Territorial Agencies Responsible for the Oversight
of Restaurants and Retail Food Stores. (2016). Retrieved November 23, 2018, from Food
and Drug Administration website:
https://www.fda.gov/downloads/Food/GuidanceRegulation/RetailFoodProtection/FoodCo
de/UCM577858.pdf
Almanza, B., Ismail, J., & Mills, J. (2002). The Impact of Publishing Foodservice Inspection
Scores. Journal of Foodservice Business Research, 5(4). Retrieved October 14, 2018,
from https://www.tandfonline.com/doi/abs/10.1300/J369v05n04_04
Anderson, R. (2011). Bugs Through the Ages: The Foodborne Illness Fight. Retrieved November
21, 2018, from https://www.foodsafetynews.com/2011/01/fbi-through-the-ages/
Axelrad, S. (2006). Why FDA Has Adopted HACCP Regulations to Ensure Safety of Food.
Retrieved November 20, 2018, from http://nrs.harvard.edu/urn-
3:HUL.InstRepos:8965572
California Food Handler Card. (n.d.). Retrieved March 17, 2019, from
https://www.calrest.org/food-safety/california-food-handler-card
Centers for Disease Control and Prevention. (1999). Achievements in Public Health, 1900-1999:
Safer and Healthier Foods. Retrieved November 21, 2018, from
https://www.cdc.gov/mmwr/preview/mmwrhtml/mm4840a1.htm
Choi, J., Miao, L., Almanza, B., & Nelson, C. (2013). Consumers’ Responses to Restaurant
Inspection Reports: The Effects of Information Source and Message Style. Journal of
Foodservice Business Research, 16(3). Retrieved October 14, 2018, from
https://www.tandfonline.com/doi/abs/10.1080/15378020.2013.810536.

52
County of Santa Clara. (2013, October 8). Minutes of the Board of Supervisors meeting.
Retrieved from http://sccgov.iqm2.com/Citizens/Detail_Motion.aspx?ID=192108
County of Santa Clara. (2014, April 14). Minutes of the Board of Supervisors meeting. Retrieved
from http://sccgov.iqm2.com/Citizens/Detail_LegiFile.aspx?ID=70249
Cruz, M., Katz, D., & Suarez, J. (2001). An Assessment of the Ability of Routine Restaurant
Inspections to Predict Food-Borne Outbreaks in Miami-Dade County, Florida. American
Journal of Public Health, 91(5). Retrieved October 14, 2018, from
https://www.ncbi.nlm.nih.gov/pmc/articles/PMC1446663/
Dundes, L., & Rajapaska, S. (2001). Scores and Grades: A Sampling of How College Students
and Food Safety Professionals Interpret Restaurant Inspection Results. Journal of
Environmental Health, 64(5), 14-19. Retrieved October 14, 2018, from
https://www.ncbi.nlm.nih.gov/pubmed/11764676
Evolution of Food Safety. (2012). Retrieved November 21, 2018, from
https://safefoodalliance.com/newsletter/2012-10/evolution-of-food-safety/
Excerpt from the California Retail Food Code. (2018). Retrieved November 22, 2018, from
California Association of Environmental Health Administrators website.
Fielding, J., Aguirre, A., & Palailogos, E. (2001). Effectiveness of Altered Incentives in a Food
Safety Inspection Program. Preventative Medicine, 32. doi:10.1006/pmed.2000.0796
Filion, K., & Powell, D. (2009). The Use of Restaurant Inspection Disclosure Systems as a
Means of Communicating Food Safety Information. Journal of Food Service, 20(6).
Retrieved October 14, 2018, from
https://onlinelibrary.wiley.com/doi/abs/10.1111/j.1748-0159.2009.00151.x

53
Fleetwood, J., Rahman, S., Holland, D., Milson, D., Thomson, L., & Poppy, G. (2018). As Clean
as They Look? Food Hygiene Inspection Scores, Microbiological Contamination, and
Foodborne Illness. Food Control, 96. doi:https://doi.org/10.1016/j.foodcont.2018.08.034
Foodborne Illness and Germs. (2018). Retrieved November 21, 2018, from
https://www.cdc.gov/foodsafety/foodborne-germs.html
Food Facility Placarding and Scoring Program. (2018, March). Retrieved November 23, 2018,
from https://www.sccgov.org/sites/cpd/programs/fsp/Pages/Placarding.aspx
Food Safety Differences Between Restaurants Linked and Not Linked to Outbreaks. (2016).
Retrieved March 21, 2019, from
https://www.cdc.gov/nceh/ehs/ehsnet/plain_language/differences-restaurants-linked-to-
outbreaks.htm
Food Safety Program - Placarding and. (n.d.). Retrieved November 23, 2018, from
https://www.sccgov.org/sites/cpd/programs/fsp/Documents/Placarding/FP_Placarding_W
orkshop_Handout.pdf
Fung, A., Weil, D., Graham, M., & Faggoto, E. (2004). The Political Economy of Transparency:
What Makes Disclosure Policies Effective?. Retrieved November 20, 2018, from Ash
Institute of Democratic Governance and Innovation website:
https://ash.harvard.edu/files/political_econ_transparency.pdf
Grieg, J., Todd, E., Bartleson, C., & Michaels, B. (2007). Outbreaks Where Food Workers Have
Been Implicated in the Spread of Foodborne Disease. Part 1. Description of the Problem,
Methods, and Agents Involved. Journal of Food Protection, 70(7). Retrieved October 14,
2018, from http://jfoodprotection.org/doi/pdf/10.4315/0362-028X-
70.7.1752?code=FOPR-site

54
Harris, K. (2016). 263 Culture and Theory: Considerations for the Ethnic Restaurant and Food
Safety Culture. Athens Journal of Tourism, 3(4). Retrieved March 19, 2019, from
https://www.athensjournals.gr/tourism/2016-3-4-1-Harris.pdf
Harris, K., Hanks, L., Line, N., & McGinley, S. (2017). Understanding Responses to Posted
Restaurant Safety Scores: An Information Processing and Regulatory Focus Perspective.
Journal of Hospitality Management, 60(1), 67-76.
http://dx.doi.org/10.1016/j.ijhm.2016.09.002
Harris, K., Murphy, S., DiPetro, R., & Line, N. (2017). The Antecedents and Outcomes of food
Safety Motivators for Restaurant Workers: An Expectancy Framework. International
Journal of Hospitality Management, 63(1). http://dx.doi.org/10.1016/j.ijhm.2017.02.004
Henson, S., Majowicz, S., Masakure, O., Sockett, P., Jones, A., Hart, R., . . . Knowles, L. (2006).
Consumer Assessment of the Safety of Restaurants: The Role of Inspection Notices and
Other Information Cues. Journal of Food Safety, 26(4). Retrieved October 14, 2018, from
https://onlinelibrary.wiley.com/doi/abs/10.1111/j.1745-4565.2006.00049.x
Irwin, K., Ballard, J., Grendon, J., & Kobayashi, J. (1989). Results of Routine Restaurant
Inspections Can Predict Outbreaks of Foodborne Illness: The Seattle-King County
Experience. American Journal of Public Health, 79(5). Retrieved October 14, 2018, from
https://www.ncbi.nlm.nih.gov/pmc/articles/PMC1349498/
Jin, G., & Leslie, P. (2003). The Effect of Information on Product Quality: Evidence from
Restaurant Hygiene Grade Cards. The Quarterly Journal of Economics, 118(2), 409-451.
Retrieved October 14, 2018, from https://www.jstor.org/stable/25053911

55
Jin, G., & Leslie, P. (2009). Repetitional Incentives for Restaurant Hygene. American Economic
Journal: Microeconomics, 1(1), 237-267. Retrieved October 14, 2018, from
https://www.jstor.org/stable/25760354
Johnson, A. (2011). Factors that Affect What is Written Down on a Retail Food Inspection
Report (Unpublished master's thesis). Purdue University. Retrieved November 23, 2018,
from https://search.proquest.com/docview/1836823607?pq-origsite=gscholar
Kaufman, R. (2018, December). Food Truck Growth Continues to Shape Cities. Next City.
Retrieved March 19, 2019, from https://nextcity.org/daily/entry/food-truck-growth-
continues-to-shape-cities
Law, M. (2003). The Origins of State Pure Food Regulation. Journal of Economic History,
63(4), 1103-1130. Retrieved November 21, 2018, from
https://www.jstor.org/stable/3132366
Laws, Policies, and Legal Issues. (2019). Retrieved March 1, 2019, from
https://www.sccgov.org/sites/cpd/Pages/Laws-Policies-Legal.aspx
Makosfe, M. (2017). The Effect of Information Salience on Product Quality: Louisville
Restaurant Hygiene and Yelp.com. Retrieved October 14, 2018, from Miami University
website: https://papers.ssrn.com/sol3/papers.cfm?abstract_id=2835123
Minor, T., Lasher, A., Klontz, K., Brown, B., Nardinelli, C., & Zorn, D. (2015). The Per Case
and Total Annual Costs of Foodborne Illness in the United States. Risk Analysis, 35(6),
1125-1139. doi:10.1111/risa.12316
Mobile Food Facilities. (2018). Retrieved March 19, 2019, from
https://www.sccgov.org/sites/cpd/programs/MFF/Pages/home.aspx

56
Morris, S. (2017). A National Strategy Is Needed to Address Fragmentation in Federal Oversight
(United States of America, Government Accountability Office). Retrieved November 1,
2019, from https://www.gao.gov/products/GAO-17-74
Nelson, K. (2015, November 05). San Jose Restaurant Linked to Shigella Outbreak Reopens. The
Mercury News. Retrieved November 22, 2018, from
https://www.mercurynews.com/2015/11/05/san-jose-restaurant-linked-to-shigella-
outbreak-reopens/
Oberg, C. (2012). History of Food Microbiology. Retrieved from
http://amyd.quimica.unam.mx/pluginfile.php/909/mod_resource/content/2/Oberg 2012.
History of Food Microb.pdf
Ogbu, C. (2015). Effect of Placard Grading on Food Safety in Retail Food Facilities
(Unpublished doctoral dissertation). Walden University. Retrieved October 20, 2018,
from
https://scholarworks.waldenu.edu/cgi/viewcontent.cgi?referer=https://www.google.com/
&httpsredir=1&article=2839&context=dissertations
Oversight of Food Truck Operations by the Department of Environmental Health. (2013).
Retrieved March 12, 2019, from
http://www.scscourt.org/court_divisions/civil/cgj/2013/OversightFoodTruckOperations.p
df
Park, S., Kwak, T., & Chang, H. (2010). Evaluation of the Food Safety Training for Food
Handlers in Restaurant Operations. Nutrition Research and Practice, 4(1). Retrieved
March 12, 2019, from https://www.ncbi.nlm.nih.gov/pmc/articles/PMC2830416/pdf/nrp-
4-58.pdf.

57
Patil, S., Cates, S., & Morales, R. (2005). Consumer food safety knowledge, practices, and
demographic differences: Findings from a meta-analysis. Journal of Food Protection,
68(9), 1884-1894. Retrieved March 11, 2019, from
https://www.ncbi.nlm.nih.gov/pubmed/16161688
Pellegrino, R., Crandell, P., O'Bryan, C., & Seo, H. (2014). A Review of Motivational Models
for Improving Hand Hygiene Among an Increasingly Diverse Food Service Workforce.
Food Control, 50(1), 446-456. http://dx.doi.org/10.1016/j.foodcont.2014.09.015
Petran, R., White, B., & Hedberg, C. (2012). Health Department Inspection Criteria More Likely
to Be Associated with Outbreak Restaurants in Minnesota. Journal of Environmental
Health, 75(11), 2007-2015. doi:10.4315/0362-028X.JFP-12
Placarding and Scoring Program. (2014). Retrieved October 22, 2018, from Santa Clara County
of Environmental Health website:
https://www.sccgov.org/sites/cpd/programs/fsp/Documents/Placarding/FP_Placarding_W
orkshop_PowerPoint.pdf
Quick Facts: Santa Clara County, California. (n.d.). Retrieved March 19, 2019, from
https://www.census.gov/quickfacts/santaclaracountycalifornia
Quinlan, J. (2013). Foodborne Illness Incidence Rates and Food Safety Risks for Populations of
Low Socioeconomic Status and Minority Race/Ethnicity: A Review of the Literature.
International Journal of Environmental Research and Public Health, 10(1).
doi:10.3390/ijerph10083634
Reportable Disease Quarterly Update. (2018). Retrieved November 24, 2018, from https://data-
sccphd.opendata.arcgis.com/datasets/reportable-diseases-quarterly-update

58
Roberts, K., Kwon, J., Shanklin, C., & Yen, W. (2011). Food Safety Practices Lacking in
Independent Ethnic Restaurants. Journal of Culinary Science and Technology, 9(1).
Retrieved March 18, 2019, from
http://www.informaworld.com/openurl?genre=article&issn=1542-
8052&volume=9&issue=1&spage=1
Scallan, E., Hoekstra, R., Angulo, F., Tauxe, R., Alain, M., Roy, S., . . . Griffin, P. (2011).
Foodborne Illness Acquired in the United States- Major Pathogens. Emerging Infections
Diseases, 17(1), 7-15. doi:10.3201/eid1701.P11101
Scharff, R. (2010). Health Related Costs: Foodborne Illness in the United States. Retrieved
November 19, 2018, from http://www.cidrap.umn.edu/news-perspective/2010/03/study-
says-foodborne-illness-costs-us-152-billion-year
Sevier, O., & Hatfield, T. (200). Grading Systems for Retail Food Facilities: A Risk-Based
Analysis. Journal of Environmental Health, 63(3), 22-27. Retrieved October 14, 2018,
from:https://www.researchgate.net/publication/283250629_Grading_systems_for_retail_f
ood_facilities_A_risk_based_analysis.
Simon, P., Leslie, P., Run, G., Zin, G., Reporter, R., Aguirre, A., & Felding, J. (2005). Impact of
Restaurant Hygiene Cards on Foodborne-Disease Hospitalizations in Los Angeles.
Journal of Environmental Health, 67(7). Retrieved October 14, 2018, from
https://www.ncbi.nlm.nih.gov/pubmed/15794461
Sperber, W., & Stier, R. (2009). Happy 50th Birthday to HACCP: Retrospective and Prospective.
Food Safety Magazine. Retrieved November 21, 2018, from
https://www.foodsafetymagazine.com/magazine-archive1/december-2009january-
2010/happy-50th-birthday-to-haccp-retrospective-and-prospective/

59
Strohbehn, C., Shelley, M., Arendt, S., Correia, A., Meyer, J., Fatima, U., . . . Jun, J. (2014).
Retail Foodservice Employees’ Perceptions of Barriers and Motivational Factors That
Influence Performance of Safe Food Behaviors. Food Protection Trends, 34(3).
Retrieved October 14, 2018, from http://www.foodprotection.org/files/food-protection-
trends/May-Jun-14-Strohbehn.pdf
Susko, J., Putnam, J., & Villareal, M. (2013, February 3). Silicon Valley Restaurants: No Grades,
No Accountability. Retrieved November 21, 2018, from
https://www.nbcbayarea.com/investigations/SCC-Restaurants-Bugs-or-no-No-Way-to-
Know-189747251.html
Sylvia, R., & Sylvia, K. (2012). Program Planning and Evaluation for the Public Manager (4th
ed.). Long Grove, IL: Wave Land Press.
Talty, A. (2016, October). New Study Finds Millennials Spend 44 Percent Of Food Dollars On
Eating Out. Retrieved November 22, 2018, from
https://www.forbes.com/sites/alexandratalty/2016/10/17/millennials-spend-44-percent-of-
food-dollars-on-eating-out-says-food-institute/#780c3dd33ff6
Taylor, E. (2001). HACCP in Small Companies: Benefit or Burden? Food Control, 12(4).
doi:10.1016/S0956-7135(00)00043-8
Wadsworth, J. (2013). County Meeting with Restaurants Owners for New Health, Safety
Grading System. San Jose Inside. Retrieved November 22, 2018, from
https://www.sanjoseinside.com/2013/10/10/10_10_13_santa_clara_county_restaurants_h
ealth_safety_grades/

60
Wan, S., & Marterer, B. (2018). Building a Stronger Food safety Culture. Food Safety Magazine.
Retrieved from https://www.foodsafetymagazine.com/enewsletter/building-a-stronger-
food-safety-culture/
Waters, A., VanderSlice, J., Deleggee, R., & Durant, L. (2013). Impact of Internet Posting of
Restaurant Inspection Scores on Critical Violations. Journal of Environmental Health,
75(10). Retrieved October 14, 2018, from
https://www.ncbi.nlm.nih.gov/pubmed/23858661.
Weil, D., Fung, A., Graham, M., & Fagotto, E. (2006). The Effectiveness of Regulatory
Disclosure Policies. Journal of Policy Analysis and Management, 25(1), 155-181.
Retrieved October 14, 2018, from https://www.jstor.org/stable/30162705.
Weinroth, M., Belk, A., & Belk, K. (2018). History, Development, and Current Status of Food
Systems Worldwide. Animal Frontiers, 8(4), 9-15. doi:10.1093/af/vfy016
What Data Can Tell Us About the State of the Food Truck Industry. (2017). Retrieved March 15,
2019, from https://foodtruckr.com/2017/09/what-data-can-tell-us-about-the-state-of-the-
food-truck-industry/
Winston, C. (2008). Review: The Efficacy of Information Policy: A Review of Archon Fung,
Mary Graham, and David Weil's "Full Disclosure: The Perils and Promise of
Transparency". Journal of Economic Literature, 46(3).
doi:https://www.jstor.org/stable/27647042
Yeager, V., Menachemi, N., Braden, B., Taylor, D., Manzella, B., & Ouimet, C. (2013).
Relationship Between Food Safety and Critical Violations on Restaurant Inspections: An
Empirical Investigation of Bacterial Pathogen Content. Journal of Environmental Health,

61
75(6), 68-73. Retrieved October 22, 2018, from
https://www.ncbi.nlm.nih.gov/pubmed/23397652
Yurieff, K. (2018). Yelp will roll out restaurant hygiene scores in the US. CNN. Retrieved
October 22, 2018, from https://money.cnn.com/2018/07/24/technology/yelp-restaurant-
hygiene-score/index.html
Zaccheo, A., Palmaccio, E., Venable, M., Locarnini-Sciaroni, I., & Parisi, S. (2017). Food
Hygiene and Applied Food Microbiology in an Anthropological Cross Cultural
Perspective. Retrieved November 21, 2018, from http://www.springer.com/978-3-319-
44973-9
Zuraw, L. (2015). WHO Releases First Global Estimates of Foodborne Disease. Retrieved
November 21, 2018, from https://www.foodsafetynews.com/2015/12/who-releases-first-
global-estimates-of-foodborne-disease/

62
Appendix A Source: (“Food Placarding and Scoring Program”, 2018)

63
Appendix B Source: Placarding and Scoring Program, 2014

64
Appendix C

65
Source: Santa Clara County