Embed Size (px)
Citation preview

MARCH/APRIL 1995
David C. Wheelock is a senior economist at the Federal Reserve Bank of St. Louis. Heidi L Beyer provided research assistance.
The surge of bank failures in the UnitedStates during the 1980s focused the atten-tion of policymakers and researchers on
the causes of failure, especially on the roleof government policy. Deposit insurance hadleft the banking industry more leveragedthan it would otherwise have been, andencouraged individual banks to take greaterrisks as losses eroded their net worth. Inresponse, regulators imposed risk-adjustedcapital requirements and Congress enactedthe Federal Deposit Insurance CorporationImprovement Act of 1991 (FDICIA), whichmandated risk-based deposit insurancepremiums and refined the risk-based capitalstandards.1 Similarly, the enactment of TheInterstate Banking and Branching EfficiencyAct of 1994, which permitted interstatebranching, stemmed from the view thatbranching restrictions hamper geographicdiversification and had contributed to thehigh number of failures in regions sufferingeconomic downturns.
The United States last experienced highnumbers of bank failures during the GreatDepression, when some 9,000 banks failed.Researchers have blamed various governmentpolicies, especially branching restrictions, forcontributing to banking instability during theDepression. There has, however, been little
empirical study of the effects of bankingmarket structure and regulation on failuresduring this period, a gap which this articleattempts to fill.
Previous studies have taken little noticeof the wide interstate variation in the numberof failures and failure rates during the GreatDepression. This article investigates whetherthis variation can be explained solely by dif-ferences in the extent to which incomedeclined, or whether various state bankingpolicies or differences in market structurecontributed to interstate variation in failurerates. It also investigates why banking marketstructures differed across states. The analysisindicates that, after controlling for the extentto which economic activity declined, theproportion of deposits in failed banks waslower in states where branch banking wasmore prevalent. In addition, both the bankfailure rate and proportion of deposits infailed banks varied inversely with the relativenumber of federally chartered (national)banks in a state. Finally, the study showsthat the state deposit insurance systems ofthe 1920s had lingering effects on bankingmarket structures even after insurance hadended. Thus, as researchers have found forthe 1980s, government policies, such asbranching restrictions and deposit insurance,appear to have had measurable impacts onmarket outcomes and bank failures duringthe Great Depression.
BANK FAILURES IN THEDEPRESSION: CAUSESAND CONSEQUENCES
From 1929 to 1933, U.S. gross nationalproduct declined 29 percent (in constantdollars), the price level fell 25 percent, theunemployment rate reached 25 percent,and some 9,000 banks suspended operationsbecause of financial distress. A bank thatsuspended operations need not have "failed,"in that a receiver need not have been appointedto liquidate the bank. Suspended banks,however, include only those that closed on
1 FDICIA also limited the discretion ofregulators to permit insolvent banksfrom continuing to operate. Someresearchers argue that the closurepolicy known as "too-big-to-fail" hadencouraged excessive risk-takingbecause it had the effect of expand-
beyond $100,000 per account atbanks that regulators deemed toolarge to close. See Keeley (1990)for further analysis of the role ofdeposit insurance during the 1980s.
FEDERAL RESERVE BANK OF ST. LOUIS
27Digitized for FRASER http://fraser.stlouisfed.org/ Federal Reserve Bank of St. Louis
MARCH/APRIL 1995
account of financial difficulty. Followingmuch of the literature, I use the terms "sus-pension" and "failure" interchangeably.
Economists have debated the causes ofthe Depression since the 1930s. In the past30 years, this debate has focused on the roleof bank failures. In Monetary History of theUnited States, Friedman and Schwartz (1963)argue that banking panics in the autumn of1930, and the spring and autumn of 1931sharply reduced the supply of money, which,in turn, caused economic activity to decline.Other researchers, however, such as Temin(1976), contend that bank failures occurredlargely as a result of falling national income.In Temin's view, the economic downturnreduced the demand for money, and bankfailures were the means by which the moneysupply fell to accommodate that decline.
The debate over the role of bankfailures and monetary forces in causing theGreat Depression continues to simmer, andis reviewed by Wheelock (1992b). A recentview, originating with Bernanke (1983), pro-poses a non-monetary explanation of howbank failures contributed to the Depression.Bernanke argues that apart from their impacton the money supply, bank failures depressedoutput by raising the cost of credit interme-diation.
Much of the research on the causesand consequences of bank failures during theDepression has had a macroeconomic orien-tation, with little emphasis on the role of reg-ulation or market structure. Someresearchers, however, have argued that theprevalence of unit banking left the U.S.banking system especially vulnerable tofailures during the Depression, and thatnationwide branching helped limit failuresand banking panics in other countries.For example, the conventional view is thatnationwide branching protected the Canadianbanking system during the Depression (forexample, see White, 1984; or Grossman,1994), though Kryznowski and Roberts (1993)estimate that on a market value basis, allCanadian banks were insolvent at somepoint during the Depression. This focus onbranching vs. unit banking has been national,with little consideration of whether differencesin state branching laws, other banking regu-
lations or market structure contributed tointerstate differences in bank failure rates.Regional variation in failures has largely beenignored or simply attributed to differences inthe extent to which income declined.
Several studies have attempted todetermine whether the causes of bank failuresduring the Depression were like those of fail-ures during the 1920s. For example, Temin(1976) finds that, like the 1920s, decliningagricultural income explains many of thefailures of 1930 and 1931. White (1984)shows that the characteristics of banks thatfailed in 1930 were like those of previousfailures. Calomiris and Mason (1994) presentsimilar findings for failures during the Chicagobanking panic of June 1932. On the otherhand, Wicker (1980) shows that many fail-ures in 1930 stemmed from the collapse ofone Southern financial institution, Caldwelland Company, which he concludes was largelyindependent of the decline in economicactivity. Stauffer (1981) offers further evidencethat bank failures were independent of thedecline in activity by showing that in the11 cotton-producing states with significantdeclines in output, bank failures were moreclosely related to banking market structurethan to changes in local income. Whetherthis was also true of other states, however,is unclear.
INTERSTATE VARIATIONIN BANK FAILURES ANDFAILURE RATES
This article investigates the interstate vari-ation in bank failures during 1929-32. Thefailures of 1933 are not studied here becausethe bank holiday in March 1933, and subse-quent institutional changes, substantiallyaltered the timing and likely causes of failures.All banks were shut during the bank holiday,and only those licensed by regulators werepermitted to reopen. Not all banks that wouldreopen had done so by the end of 1933, andsome that did were later found to be insolvent.This suggests that the determinants of bankfailures in 1933 should be studied apart fromthose of other Depression years. Similarly, Ileave for future research the causes of failuresduring the remainder of the 1930s.
FEDERAL RESERVE BANK OF ST. LOUIS
28Digitized for FRASER http://fraser.stlouisfed.org/ Federal Reserve Bank of St. Louis

MARCH/APRIL 1995
Figure 1 shows the distribution of bankfailures across the United States during 1929-32(see the appendix for data sources). RhodeIsland escaped the period without any bankfailures. No other state had fewer than twofailures. Other states with fewer than 10 bankfailures include Vermont, Maine, New Hamp-shire, Delaware, New Mexico and Wyoming.Generally, Midwestern states suffered thehighest numbers of bank failures. Illinois had602 failures, the most of any state. Only threeother states had more than 300 failures: Iowawith 476, Nebraska with 358 and Missouriwith 328. The mean number of failures acrossall states was 120, and the median was 91failures. For comparison, from 1980 to 1989,the two states with the most bank failures wereTexas with 350 and Oklahoma with 105.
The number of failures can, of course, bea misleading statistic because the number ofbanks varies widely across states. Figure 2maps the distribution of bank failure ratesduring 1929-32, in which the annual failurerate is defined as the total number of suspen-sions during a year divided by the number ofbanks operating at mid-year. Even thoughIllinois had the most failures, it did not havethe highest failure rate. That dubious dis-tinction went to Nevada, which had a yearlyaverage failure rate of more than 16 percent,despite having just 19 bank failures duringthe period. Illinois, other Midwestern andSouthern states with high numbers of bankfailures, however, generally also had highfailure rates. Besides Nevada, other states withhigh failure rates included South Carolina,Florida and Arkansas, each with a rate of15 percent. At the other extreme, five NewEngland states, plus New Mexico, Wyoming,New York, Massachusetts and New Jersey, allhad failure rates under 3 percent. The meanfailure rate among all states was 6.6 percent,while the median was 5.5 percent. For com-parison, between 1980 and 1989, the averageannual bank failure rate in the United Stateswas 0.77 percent. Eight states had no failuresduring the period, while Alaska, Oregon andTexas had failure rates of 6.3 percent, 2.4 per-cent and 2.3 percent, respectively, the mostof any states.
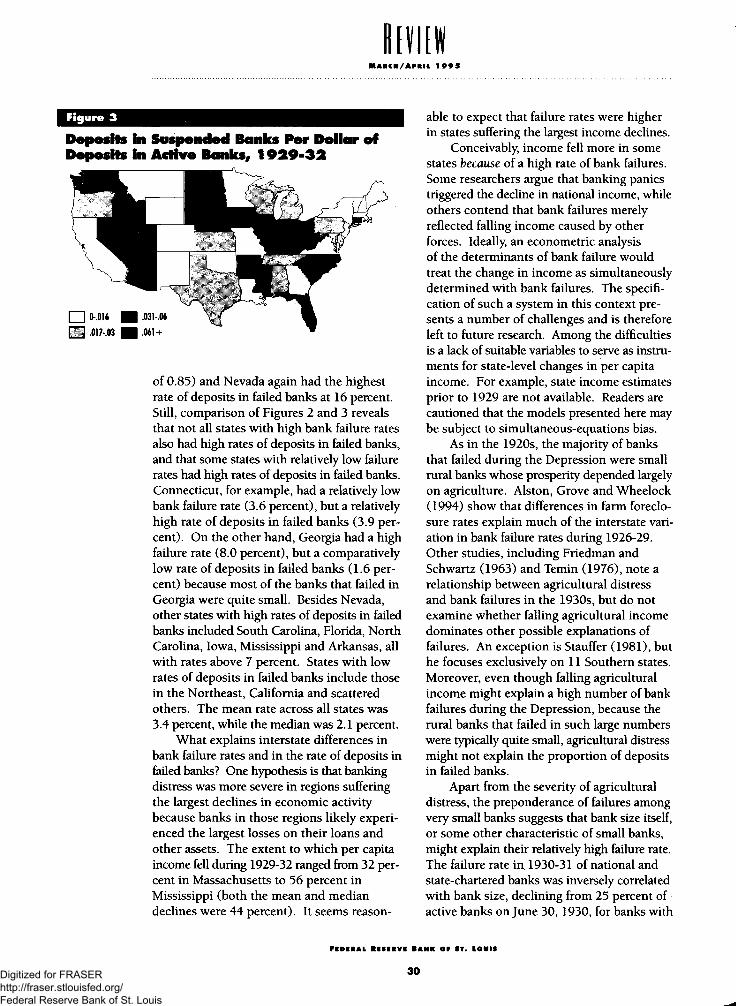
Figure 3 maps the average annual rate ofdeposits in failed banks during 1929-32, where
Figure 1
Number of Bank Suspensions, 1929-32
Figure 2
Bank Suspensions Per Active Bank,1929-32
the annual rate of deposits in failed banks isthe sum of deposits in failed banks during ayear divided by the volume of deposits in allbanks at mid-year. A state could have had alow number of bank failures, or a low failurerate, but a high rate of deposits in failed banksif those banks that did fail held a high shareof the state's bank deposits. On the otherhand, a high number of failures, or a highfailure rate, did not necessarily produce ahigh rate of deposits in failed banks if failingbanks held a comparatively low share of astate's deposits. Moreover, there is no reasonto expect that the determinants of the bankfailure rate and rate of deposits in failedbanks will be the same.
During 1929-32, the rate of deposits infailed banks and the bank failure rate werehighly correlated (a correlation coefficient
FEDERAL RESERVE BANK OF ST. LOUIS
29Digitized for FRASER http://fraser.stlouisfed.org/ Federal Reserve Bank of St. Louis
MARCH/APRIL 1995
Figure 3
Deposits in Suspended Banks Per Dollar ofDeposits in Active Banks, 1929-32
of 0.85) and Nevada again had the highestrate of deposits in failed banks at 16 percent.Still, comparison of Figures 2 and 3 revealsthat not all states with high bank failure ratesalso had high rates of deposits in failed banks,and that some states with relatively low failurerates had high rates of deposits in failed banks.Connecticut, for example, had a relatively lowbank failure rate (3.6 percent), but a relativelyhigh rate of deposits in failed banks (3.9 per-cent). On the other hand, Georgia had a highfailure rate (8.0 percent), but a comparativelylow rate of deposits in failed banks (1.6 per-cent) because most of the banks that failed inGeorgia were quite small. Besides Nevada,other states with high rates of deposits in failedbanks included South Carolina, Florida, NorthCarolina, Iowa, Mississippi and Arkansas, allwith rates above 7 percent. States with lowrates of deposits in failed banks include thosein the Northeast, California and scatteredothers. The mean rate across all states was3.4 percent, while the median was 2.1 percent.
What explains interstate differences inbank failure rates and in the rate of deposits infailed banks? One hypothesis is that bankingdistress was more severe in regions sufferingthe largest declines in economic activitybecause banks in those regions likely experi-enced the largest losses on their loans andother assets. The extent to which per capitaincome fell during 1929-32 ranged from 32 per-cent in Massachusetts to 56 percent inMississippi (both the mean and mediandeclines were 44 percent). It seems reason-
able to expect that failure rates were higherin states suffering the largest income declines.
Conceivably, income fell more in somestates because of a high rate of bank failures.Some researchers argue that banking panicstriggered the decline in national income, whileothers contend that bank failures merelyreflected falling income caused by otherforces. Ideally, an econometric analysisof the determinants of bank failure wouldtreat the change in income as simultaneouslydetermined with bank failures. The specifi-cation of such a system in this context pre-sents a number of challenges and is thereforeleft to future research. Among the difficultiesis a lack of suitable variables to serve as instru-ments for state-level changes in per capitaincome. For example, state income estimatesprior to 1929 are not available. Readers arecautioned that the models presented here maybe subject to simultaneous-equations bias.
As in the 1920s, the majority of banksthat failed during the Depression were smallrural banks whose prosperity depended largelyon agriculture. Alston, Grove and Wheelock(1994) show that differences in farm foreclo-sure rates explain much of the interstate vari-ation in bank failure rates during 1926-29.Other studies, including Friedman andSchwartz (1963) and Temin (1976), note arelationship between agricultural distressand bank failures in the 1930s, but do notexamine whether falling agricultural incomedominates other possible explanations offailures. An exception is Stauffer (1981), buthe focuses exclusively on 11 Southern states.Moreover, even though falling agriculturalincome might explain a high number of bankfailures during the Depression, because therural banks that failed in such large numberswere typically quite small, agricultural distressmight not explain the proportion of depositsin failed banks.
Apart from the severity of agriculturaldistress, the preponderance of failures amongvery small banks suggests that bank size itself,or some other characteristic of small banks,might explain their relatively high failure rate.The failure rate in 1930-31 of national andstate-chartered banks was inversely correlatedwith bank size, declining from 25 percent ofactive banks on June 30, 1930, for banks with
FEDERAL RESERVE BANK OF ST. LOUIS
30Digitized for FRASER http://fraser.stlouisfed.org/ Federal Reserve Bank of St. Louis
MARCH/APRIL 1995
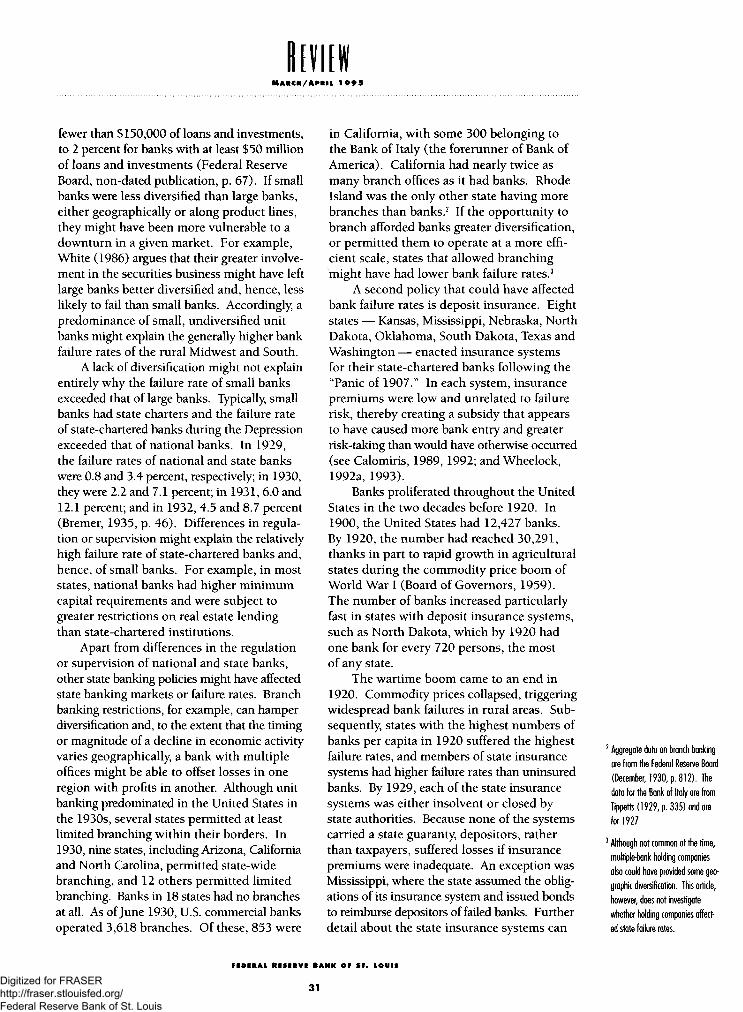
fewer than $150,000 of loans and investments,to 2 percent for banks with at least $50 millionof loans and investments (Federal ReserveBoard, non-dated publication, p. 67). If smallbanks were less diversified than large banks,either geographically or along product lines,they might have been more vulnerable to adownturn in a given market. For example,White (1986) argues that their greater involve-ment in the securities business might have leftlarge banks better diversified and, hence, lesslikely to fail than small banks. Accordingly, apredominance of small, undiversified unitbanks might explain the generally higher bankfailure rates of the rural Midwest and South.
A lack of diversification might not explainentirely why the failure rate of small banksexceeded that of large banks. Typically, smallbanks had state charters and the failure rateof state-chartered banks during the Depressionexceeded that of national banks. In 1929,the failure rates of national and state bankswere 0.8 and 3.4 percent, respectively; in 1930,they were 2.2 and 7.1 percent; in 1931, 6.0 and12.1 percent; and in 1932, 4.5 and 8.7 percent(Bremer, 1935, p. 46). Differences in regula-tion or supervision might explain the relativelyhigh failure rate of state-chartered banks and,hence, of small banks. For example, in moststates, national banks had higher minimumcapital requirements and were subject togreater restrictions on real estate lendingthan state-chartered institutions.
Apart from differences in the regulationor supervision of national and state banks,other state banking policies might have affectedstate banking markets or failure rates. Branchbanking restrictions, for example, can hamperdiversification and, to the extent that the timingor magnitude of a decline in economic activityvaries geographically, a bank with multipleoffices might be able to offset losses in oneregion with profits in another. Although unitbanking predominated in the United States inthe 1930s, several states permitted at leastlimited branching within their borders. In1930, nine states, including Arizona, Californiaand North Carolina, permitted state-widebranching, and 12 others permitted limitedbranching. Banks in 18 states had no branchesat all. As of June 1930, U.S. commercial banksoperated 3,618 branches. Of these, 853 were
in California, with some 300 belonging tothe Bank of Italy (the forerunner of Bank ofAmerica). California had nearly twice asmany branch offices as it had banks. RhodeIsland was the only other state having morebranches than banks.2 If the opportunity tobranch afforded banks greater diversification,or permitted them to operate at a more effi-cient scale, states that allowed branchingmight have had lower bank failure rates.3
A second policy that could have affectedbank failure rates is deposit insurance. Eightstates — Kansas, Mississippi, Nebraska, NorthDakota, Oklahoma, South Dakota, Texas andWashington — enacted insurance systemsfor their state-chartered banks following the"Panic of 1907." In each system, insurancepremiums were low and unrelated to failurerisk, thereby creating a subsidy that appearsto have caused more bank entry and greaterrisk-taking than would have otherwise occurred(see Calomiris, 1989, 1992; and Wheelock,1992a, 1993).
Banks proliferated throughout the UnitedStates in the two decades before 1920. In1900, the United States had 12,427 banks.By 1920, the number had reached 30,291,thanks in part to rapid growth in agriculturalstates during the commodity price boom ofWorld War I (Board of Governors, 1959).The number of banks increased particularlyfast in states with deposit insurance systems,such as North Dakota, which by 1920 hadone bank for every 720 persons, the mostof any state.
The wartime boom came to an end in1920. Commodity prices collapsed, triggeringwidespread bank failures in rural areas. Sub-sequently, states with the highest numbers ofbanks per capita in 1920 suffered the highestfailure rates, and members of state insurancesystems had higher failure rates than uninsuredbanks. By 1929, each of the state insurancesystems was either insolvent or closed bystate authorities. Because none of the systemscarried a state guaranty, depositors, ratherthan taxpayers, suffered losses if insurancepremiums were inadequate. An exception wasMississippi, where the state assumed the oblig-ations of its insurance system and issued bondsto reimburse depositors of failed banks. Furtherdetail about the state insurance systems can
2 Aggregate data on branch bankingare from the Federal Reserve Board(December, 1930, p. 812). Thedata for the Bank of Italy are fromTippetts (1929, p. 335) and arefor 1927.
3 Although not common at the time,multiple-bank holding companiesalso could have provided some geo-graphic diversification. This article,however, does not investigatewhether holding companies affect-ed state failure rates.
FEDERAL RESERVE BANK OF ST. LOUIS
31Digitized for FRASER http://fraser.stlouisfed.org/ Federal Reserve Bank of St. Louis

MARCH/APRIL 1995
be found in Federal Deposit InsuranceCorporation (1956) or Calomiris (1989).
Although states with deposit insurancesystems had high numbers of bank failuresduring the 1920s, they still had significantlymore banks per capita in 1929 than otherstates. Generally, the more banks per capitaa state had in 1929, the higher its bank failurerate during 1929-32. (The correlation coeffi-cient is 0.33, which is significant at the 0.05level). Thus, by affecting the number of banksper capita or other aspects of market structure,or if banks that had been members of statedeposit insurance systems continued to holdriskier portfolios, deposit insurance couldhave contributed to bank failures during theGreat Depression.
INTERSTATE VARIATION INFAILURE RATES: TESTINGTHE HYPOTHESES
The main objective of this article is todiscern whether differences in state bankingpolicies contributed to interstate variation infailure rates during the Great Depression.Accordingly, in modeling the determinants ofbank failure rates during 1929-32, I controlfor cross-state differences in the level of eco-nomic distress by including the percentagechange in per capita income, and the averageannual farm and business failure rates as inde-pendent variables. I expect that the more percapita income fell and the higher the rates offarm and business failures, the higher werestate bank failure rates and rates of depositsin failed banks.
To test whether within-state branchinghelped to limit failures, perhaps by enablinggreater diversification or scale, I include theratio of branches to operating banks in 1930as another independent variable. I expectthat failure rates and the rate of deposits infailed banks were lower where branchingwas more prevalent.
Next, I include dummy variablesreflecting whether a state had a depositinsurance system during the 1920s. Byaffecting a state's banking market structure,deposit insurance could have had an impacton failure rates during the 1930s even thoughinsurance no longer existed. Deposit insurance
caused more entry and encouraged greaterrisk-taking than would have otherwiseoccurred and, hence, the banking systems ofstates with insurance might have been morevulnerable to a decline in economic activity.In other words, failure rates might have beenhigher because deposit insurance generatedmore banks than were economically viableonce insurance had ended, or because banksthat had been insured continued to holdespecially risky portfolios.
Apart from its impact on the number ofbanks per capita, the collapse of state depositinsurance systems in the 1920s caused declinesin the number of state-chartered banks rela-tive to the number of national banks. In 1908,the Comptroller of the Currency ruled thatnational banks could not join state depositinsurance systems. This led to a relativeincrease in the number and deposit sharesof state-chartered banks in the states enactinginsurance systems. The decade-long shake-out of rural banks that followed the collapseof commodity prices in 1920 reduced thenumber of state banks. More than 5,700 banksfailed in the '20s, and Alston, Grove andWheelock (1994) show that rural failure rateswere higher in states with deposit insurancesystems, after controlling for the extent ofagricultural distress. Moreover, Wheelock(1993) finds that the demise of deposit insur-ance caused especially large declines in therelative number of state-chartered banks, bothbecause the rate of failure among insuredstate banks was high and because many statebanks switched to national charters to escapestate insurance systems. These effects wereespecially large in states where the insurancesystems collapsed (or were closed by stateauthorities) early in the decade. For thisreason, the impact of deposit insurance onmarket structure, and hence on failures duringthe 1930s, might differ in states where insur-ance ended early in the '20s from its impactin other insurance states. Therefore, I includeone dummy variable, set equal to 1 in statesin which insurance lasted to either 1928or 1929 (Mississippi, North Dakota andNebraska), and to zero otherwise. I set asecond dummy equal to 1 in states in whichinsurance ended by the mid-1920s (Kansas,Oklahoma, South Dakota and Texas), and to
FEDERAL RESERVE BANK OF ST. LOUIS
32Digitized for FRASER http://fraser.stlouisfed.org/ Federal Reserve Bank of St. Louis

MARCH/APRIL 1995
Table 1
Determinants of Interstate Variation in Bank Failure RatesDependent Variable: average failure rate, 1929-32, models 1-4;Dependent Variable: log of the ratio of deposits to failed banks, 1929-32, models 5-8
(1) (2) (3) (4) (5) (6) (7) (8)
Intercept
Per capita income
Farm failure rate
Business failure rate
Branching ratio
DI(MS,ND,NE)
Dl (KS, OK, SD, TX)
/n Banks per capita
/n National bank ratio
/n Average bank size
- 8 . 9 8(1.83)*
-23.57(2.41)**
0.21(3.28)***
-0.73(0.52)
.85
-7.82(1.73)*
-26.93(2.79)***
0.16(2.63r
-0.15(0.11)
-1.73(1.33)
2.30(1.35)
-3.61(2.85)—
.88
-7.91(1.77)*
-24.16(2.47)**
0.11(1.67)
-0.03(0.03)
-1 .33(1.02)
2.31(1.37)
-2.99(2.24)**
-1 .50(1.38)
.88
-5.71(0.72)
-19.92(2.03)**
0.16(1.87)*
-0 .42(0.26)
-1 .52(1.02)
-2 .40(2.11)**
-0.76(0.85)
.86
-7.22(4.95)***
-5.79(1.73)*
0.03(1.11)
0.28(0.71)
.10
-6.54(4.14)***
-4 .40(1.18)
0.03(1.27)
0.34(0.87)
-1 .00(2.21)**
0.16(0.24)
-0.38(0.65)
.15
-6.38(4.35)***
-1.91(0.53)
0.01(0.33)
0.34(0.95)
-0.78(1.82)*
0.13(0.21)
0.06(0.10)
-1.03(2.76)***
.27
-3.47(1.23)
-1.66(0.50)
-0.004(0.16)
0.41(1.09)
-0 .09(0.23)
-1.00(2.73)***
-0.41(1.32)
.26
Note: The coefficients of models 1-4 are multiplied by 100; absolute values of t-statistics are in parentheses; ***, ** and * indicate statistical signifi-cance at the .01, .05 and .10 levels. The adjusted R2 is presented for use in comparing alternative specifications but, because of the heteroscedasticitycorrection, does not indicate the proportion of the variation in the dependent variable explained by models 1-4.
zero otherwise. The insurance systems ofthese states had all ceased to function by 1926,though, in some cases, did not officially closeuntil a later date. Although Washington hadan insurance system, it collapsed after thefailure of the first, and largest, insured bankin 1921. Because of its short life, 1 treatWashington as not having had insurance.Like other states where insurance ended early,
however, many of Washington's state banksswitched to federal charters.
If deposit insurance left states with morebanks than were economically viable, or withbanks having especially risky portfolios, thecoefficients on one or both of these dummiesshould be positive in the failure rate regres-sions. On the other hand, if insurance causedthe relative number of banks with federal
FEDERAL RESERVE BANK OF ST. LOUIS
33Digitized for FRASER http://fraser.stlouisfed.org/ Federal Reserve Bank of St. Louis
MARCH/APRIL 1 9 9 5
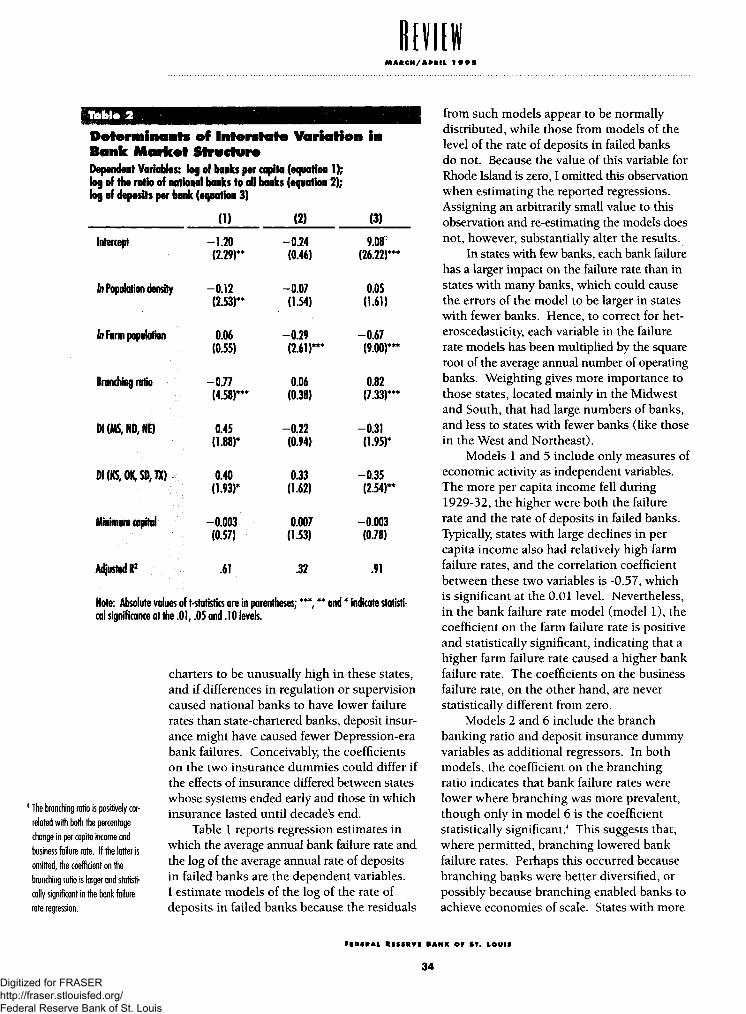
Table 2
Determinants off Interstate Variation inBank Market StructureDependent Variables: log of banks per capita (equation 1);log of the ratio of national banks to all banks (equation 2);log of deposits per bank (equation 3)
(1) (2) (3)
Intercept
/n Population density
In Farm population
Branching ratio
DI(MS,ND,NE)
DI(KS,OK,SD,TX)
Minimum capital
Adjusted R2
- 1 . 2 0(2.29)**
- 0 . 1 2(2.53)**
0.06(0.55)
- 0 . 7 7(4.58)*"
0.45(1.88)*
0.40(1.93)*
-0 .003(0.57)
.61
- 0 . 2 4(0.46)
- 0 . 0 7(1.54)
- 0 . 2 9(2.61)***
0.06(0.38)
-0 .22(0.94)
0.33(1.62)
0.007(1.53)
.32
9.or(26.22)***
0.05(1.61)
-0.67(9.00)***
0.82(7.33)***
-0.31(1.95)*
-0.35(2.54)**
-0.003(0.78)
.91
Note: Absolute values of t-statistics are in parentheses; ***, ** and * indicate statisti-cal significance at the .01, .05 and .10 levels.
4 The branching ratio is positively cor-related with both the percentagechange in per capita income andbusiness failure rate. If the latter isomitted, the coefficient on thebranching ratio is larger and statisti-cally significant in the bank failurerate regression.
charters to be unusually high in these states,and if differences in regulation or supervisioncaused national banks to have lower failurerates than state-chartered banks, deposit insur-ance might have caused fewer Depression-erabank failures. Conceivably, the coefficientson the two insurance dummies could differ ifthe effects of insurance differed between stateswhose systems ended early and those in whichinsurance lasted until decade's end.
Table 1 reports regression estimates inwhich the average annual bank failure rate andthe log of the average annual rate of depositsin failed banks are the dependent variables.I estimate models of the log of the rate ofdeposits in failed banks because the residuals
from such models appear to be normallydistributed, while those from models of thelevel of the rate of deposits in failed banksdo not. Because the value of this variable forRhode Island is zero, I omitted this observationwhen estimating the reported regressions.Assigning an arbitrarily small value to thisobservation and re-estimating the models doesnot, however, substantially alter the results.
In states with few banks, each bank failurehas a larger impact on the failure rate than instates with many banks, which could causethe errors of the model to be larger in stateswith fewer banks. Hence, to correct for het-eroscedasticity, each variable in the failurerate models has been multiplied by the squareroot of the average annual number of operatingbanks. Weighting gives more importance tothose states, located mainly in the Midwestand South, that had large numbers of banks,and less to states with fewer banks (like thosein the West and Northeast).
Models 1 and 5 include only measures ofeconomic activity as independent variables.The more per capita income fell during1929-32, the higher were both the failurerate and the rate of deposits in failed banks.Typically, states with large declines in percapita income also had relatively high farmfailure rates, and the correlation coefficientbetween these two variables is -0.57, whichis significant at the 0.01 level. Nevertheless,in the bank failure rate model (model 1), thecoefficient on the farm failure rate is positiveand statistically significant, indicating that ahigher farm failure rate caused a higher bankfailure rate. The coefficients on the businessfailure rate, on the other hand, are neverstatistically different from zero.
Models 2 and 6 include the branchbanking ratio and deposit insurance dummyvariables as additional regressors. In bothmodels, the coefficient on the branchingratio indicates that bank failure rates werelower where branching was more prevalent,though only in model 6 is the coefficientstatistically significant.4 This suggests that,where permitted, branching lowered bankfailure rates. Perhaps this occurred becausebranching banks were better diversified, orpossibly because branching enabled banks toachieve economies of scale. States with more
FEDERAL RESERVE BANK OF ST. LOUIS
34Digitized for FRASER http://fraser.stlouisfed.org/ Federal Reserve Bank of St. Louis

MARCH/APRIL 1 9 9 5
branching tended to have larger banks. Thecorrelation coefficient between the branchingratio and the log of deposits per bank is 0.72,which is significant at the 0.01 level.
The coefficients on the deposit insurancedummy variables in model 6 are not statisti-cally different from zero. In model 2, however,the dummy for states where insurance endedby the mid-1920s (Kansas, Oklahoma, SouthDakota and Texas) has a negative and signifi-cant coefficient. In these states, the averageannual bank failure rate was some 3 percentagepoints lower because of deposit insurance.Apparently, deposit insurance affected marketstructure in a way that reduced failure rates.This might be explained by the comparativelylarge increase in the relative number of nationalbanks, which had lower failure rates than statebanks, in these states. Models 3 and 7 testfor this possibility by including the log of theratio of national banks to total banks as anadditional independent variable. Doing soreduces somewhat the absolute size and sta-tistical significance of the deposit insurancecoefficient. Insurance appears to have hadno effect on the national bank ratio in stateswhere insurance lasted at least until 1928.The coefficient on deposit insurance for thesestates is positive and fairly large (though notstatistically significant), suggesting that insur-ance affected bank failure rates in these statesby causing excessive numbers of banks orrisk-taking.
Models 4 and 8 further indicate howbanking market structure affected bank failurerates during the Depression. I excludebranching and deposit insurance from thesespecifications because their effects on bankfailures appear to have worked through theirinfluence on market structure. Further analysisof the determinants of market structure is pre-sented in the next section.
The market structure measures includedin models 4 and 8 are the logs of banks percapita in 1929, the ratio of national to all banksin 1929, and the average volume of depositsper bank in 1929. Only the coefficients onthe ratio of national to all banks is statisticallysignificant. Its negative coefficients indicatethat bank failure rates and rates of depositsin failed banks were smaller where nationalbanks were relatively more prevalent. Multi-
collinearity might explain the absence of asignificant relationship between bank size,or the number of banks per capita, and failurerates. The correlation coefficient betweenthe logs of the national bank ratio and averagedeposits per bank is 0.49, which is significantat the 0.01 level, while that between the logsof the national bank ratio and number ofbanks per capita is -0.34, which is significantat the 0.02 level. The correlation betweenthe national bank ratio and bank size makesit impossible to determine whether differencesin regulation or supervision of state andnational banks had an impact on failures,except as they might have influenced banksize. The absence of a significant relationshipbetween bank size and failure rates, however,suggests that any influence size had on failuresis reflected in the ratio of national banks toall banks.
The inclusion of banks per capita, thenational bank ratio and average bank size inthe bank failure rate model reduces the sta-tistical significance of the percentage changein per capita income and the farm failurerate. The correlation coefficients betweenthe market structure variables and the twomeasures of economic activity are all statisti-cally significant at the 1 percent level. Thestates with the largest declines in per capitaincome and the highest farm failure ratesalso had the highest numbers of banks percapita, the lowest national bank ratios andsmallest average bank sizes. Although theDepression affected the entire nation, ruralfarming regions were hit especially hard.Unfortunately, these states also tended tohave banking markets consisting of manysmall, undiversified banks. Thus, it is diffi-cult, if not impossible, to apportion thecomparatively high bank failure rates ofthese states between changes in the level ofeconomic activity and the vulnerability oftheir banking systems.5 The evidence pre-sented here, however, suggests that bankingmarket structure affected the performance ofstate banking systems, and adds weight toother research associating banking distressand declining economic activity in the 1930swith banking system fragility (see Bernankeand James, 1991; Calomiris, 1993; andGrossman, 1994).
5 Conceivably, income fell more andfarm failure rates were higher inthese states because their bankingmarket structures were more vul-nerable to bank failures. As notedpreviously, the measures of eco-nomic activity ideally would be
simultaneous-equations frameworkto capture any impact of bank fail-ures on economic activity.
FEDERAL RESERVE BANK OF ST. LOUIS
35Digitized for FRASER http://fraser.stlouisfed.org/ Federal Reserve Bank of St. Louis

MARCH/APRIL 1995
THE DETERMINANTSOF BANKING MARKETSTRUCTURE
The evidence presented in the precedingsection shows that government policies affectedbank failure rates during the Depression, atleast in part, by causing differences in bankingmarket structure across states. Further insightinto the effects of government policies onmarket outcomes can thus be gleaned fromstudying interstate variations in bankingmarket structure.
Wheelock (1993) investigates the impactof government policies on banking marketstructure during the 1920s. There, I showthat the number of banks per capita was lowerwhere branch banking was more prevalent,in states that imposed high minimum capitalrequirements on state-chartered banks, andin states with deposit insurance systems. Inaddition, the number of banks per capita waslower in more densely populated states. Thecosts of transportation and communicationmake the finding of an inverse relationshipbetween population density and the numberof banks per capita unsurprising. An inverserelationship between the prevalence of branch-ing and the number of banks per capita is alsonot surprising. Where permitted, branchoffices can serve markets that otherwise wouldrequire independent banks. To the extent thatbranches substitute for unit banks, the numberof banks per capita will be lower. Finally,because deposit insurance subsidized entry,and was instituted only in unit banking states,it caused the number of banks per capita to behigher than it would otherwise have been.
Model 1 of Table 2 reports a regressionof the log of banks per capita in 1929 on thelog of population density, the branching ratio,the deposit insurance dummy variables, thelog of the ratio of farm to total state popula-tion, and the minimum capital requirementimposed on state banks. Only the coefficientson the latter two variables are insignificant.As expected, the less densely populated a statewas, the higher were banks per capita. Inaddition, in states where there were depositinsurance systems, or where branch bankingwas less prevalent, banks per capita wereagain higher.
The same variables are included in amodel of the log of the ratio of the numberof national banks to total banks. The mostimportant determinant of this ratio is theratio of farm to total state population: thegreater the fraction of the population in agri-culture, the lower the relative number ofnational banks. National banks were moreprevalent in Northeastern manufacturingstates and other states where agriculture wasrelatively unimportant. On the one hand,this reflects the lower population density ofagricultural states, and that such states oftenset low minimum capital requirements fortheir state-chartered banks to ensure thepresence of banking facilities in rural areas.Note that the coefficient on the minimumcapital ratio is positive and, for a one-tailtest, statistically significant at the 0.10 level.State-chartered banks also typically enjoyedfewer lending restrictions than national banks,especially on real estate loans. Consequently,state-chartered banks were able to serve moreof the banking needs of agricultural borrowers.
In model 2, the coefficients on the twodeposit insurance dummy variables differsignificantly from one another. The coefficienton the variable for states where depositinsurance ended early in the 1920s (Kansas,Oklahoma, South Dakota and Texas) is positiveand, for a one-tail test, statistically significantat the 0.10 level. The failure of large numbersof state banks, and the decision of othersto switch to national charters, explain whydeposit insurance had a positive influenceon the national bank ratio in these states.Insurance lasted longer, and generally per-formed better, in Mississippi, North Dakotaand Nebraska and, hence, there was no effectof insurance on the national bank ratio.
Finally, the coefficient on the branchingratio is not statistically different from zero.Until the McFadden Act of 1927 enablednational banks to open branches, virtuallyall branching was done by state-charteredinstitutions. The ability to branch mighthave increased the demand for state chartersand, hence, all else equal, had a negativeinfluence on the national bank ratio. Onthe other hand, it could have also held downstate chartering because branch offices sub-stituted for independent state banks.
FEDERAL RESERVE BANK OF ST. LOUIS
36Digitized for FRASER http://fraser.stlouisfed.org/ Federal Reserve Bank of St. Louis
MARCH/APRIL 1995
Model 3 of Table 2 is a regression ofthe log of average deposits per bank in 1929.This variable is negatively correlated withthe number of banks per capita and positivelycorrelated with the national bank ratio. Hence,the estimates of this model are unsurprising.Banks were larger in more densely populatedstates and where agriculture was less impor-tant. Average bank size was also larger wherebranching was more prevalent. Apparently,branching enabled banks to achieve largerscale than they otherwise would. Finally,states which had deposit insurance systemstended to have, on average, smaller banks.These were uniformly rural states that prohib-ited branching. Deposit insurance provided asubsidy that, because of branching restrictions,led to the entry of many small unit banks.The demise of deposit insurance removedthis subsidy and, at least in four states, con-tributed to a shift toward more banks withfederal charters. Despite this, the negativeimpact of insurance on average bank sizeapparently remained in 1929.
In response to the bank failures of theGreat Depression, Congress enacted federaldeposit insurance, imposed new restrictionson the activities of commercial banks, andmaintained a strict prohibition of interstatebranching. Although these policies appearedto work well for many years, their weaknesseswere exposed in the 1980s, prompting reforms.Looking back, economic historians havedemonstrated the destabilizing effects of depositinsurance and branch banking restrictions inthe 1920s. This article illuminates how thesepolicies affected banking market structureand, ultimately, state-level bank failure ratesduring the Depression. Even though statedeposit insurance had ended by 1929, itseffects lingered into the 1930s, causing bothhigher numbers of banks per capita and higherratios of national banks to total banks in statesthat earlier had insurance systems. At thesame time, branching restrictions, whereenforced, contributed to the small averagesize of unit banks and to their higher rate offailure during the Depression. Thus, as othershave shown for the 1980s, the geographic
distribution of bank failures during theDepression was in part a function of marketstructure and government banking policies.
REFERENCESAlston, Lee J., Grove, Wayne A., and David C. Wheelock. "Why Do
Banks Fail? Evidence from the 1920s," Explorations in EconomicHistory (October 1994) , pp. 409-31 .
Bankers Encyclopedia Company. Folk's Bankers Encyclopedia(March 1929) .
Bernanke, Ben S. "Nonmonetary Effects of the financial Crises in thePropagation of the Great Depression," American Economic Review(June 1983) , pp. 257-76.
, and James, Harold. "The Gold Standard, Deflation, andFinancial Crises in the Great Depression: An InternationalComparison," in Hubbard, R. Glenn, ed., Financial Markets andFinancial Crises. University of Chicago Press, 1 9 9 1 , pp. 33-68.
Board of Governors of the Federal Reserve System. Banking andMonetary Statistics, 1914-41 (1943) .
. All Bank Statistics, 1896-1955 (1959) .
Bremer, C. D. American Bank Failures. Columbia University Press, 1935.
Calomiris, Charles W. "Financial Factors in the Great Depression,"Journal of Economic Perspectives (spring 1993) , pp. 61-86.
"Do 'Vulnerable' Economies Need Deposit Insurance?Lessons from U.S. Agriculture in the 1920s," in Philip L Brock, editor,If Texas Were Chile: A Primer on Banking Reform. Institute forContemporary Studies, 1992, pp. 237-314.
. "Deposit Insurance: Lessons from the Record," FederalReserve Bank of Chicago Economic Perspectives (May/June 1989) ,pp. 10-30.
, and Joseph R. Mason. "Contagion and Bank FailuresDuring the Great Depression: The June 1932 Chicago Banking Panic,"working paper, 1994.
Department of Agriculture. "The Farm Real Estate Situation, 1930-31,"Bureau of Agricultural Economics Circular Ho. 209 (1931) .
. "The Farm Real Estate Situation, 1932-33," Bureau ofAgricultural Economics Circular No. 309 ( 1933) .
Department of Commerce, Bureau of the Census. Fifteenth Census ofthe United States, Population, vol. I (1931) .
. Fifteenth Census of the United States, Agriculture,volume IV (1932) .
. Statistical Abstract of the United States (1930, 1 9 3 1 ,1932,1933).
. Personal Income By States Since 1929, A Supplement tothe Survey of Current Business (1956) .
FEDERAL RESERVE BANK OF ST. LOUIS
37Digitized for FRASER http://fraser.stlouisfed.org/ Federal Reserve Bank of St. Louis
MARCH/APRIL 1 9 9 5
Federal Deposit Insurance Corporation. Annual Report (1956) .
Federal Reserve Board. Bulletin (December 1930) .
. "Bank Suspensions in the United States, 1892-1931,"(not dated).
Friedman, Milton, and Anna J. Schwartz. A Monetary History of theUnited States, 1867-1960. Princeton University Press, 1963.
Grossman, Richard S. "The Shoe that Didn't Drop: Explaining BankingStability During the Great Depression," Journal of Economic History(September 1994) , pp. 654-82.
Keeley, Michael C. "Deposit Insurance, Risk, and Market Power inBanking," American Economic Review (December 1990) ,pp. 1183-200.
Kryznowski, Lawrence, and Gordon S. Roberts. "Canadian BankingSolvency, 1922-1940," Journal of Money, Credit and Banking(August 1993) , pp. 361-76.
Stauffer, Robert F. "The Bank Failures of 1930-31," Journal of Money,Credit and Banking (February 1981) , pp. 109-13.
Temin, Peter. Did Monetary Forces Cause the Great Depression? W.W.Norton, 1976.
Tippetts, Charles S. State Banks and the Federal Reserve System.D. Van Nostrand Co., 1929.
Wheelock, David C. "Government Policy and Banking Market Structurein the 1920s," Journal of Economic History (December 1993),pp. 857-79.
. "Deposit Insurance and Bank Failures: New Evidence fromthe 1920s," Economic Inquiry (July 1992) , pp. 530-43.
. "Monetary Policy in the Great Depression: What the FedDid, and Why," this Review (March/April 1992) , pp. 3-28.
White, Eugene N. "Before the Glass-Steagall Act: An Analysis of theInvestment Banking Activities of National Banks," Explorations inEconomic History (January 1986), pp. 33-55.
. "A Reinterpretation of the Banking Crisis of 1930,"Journal of Economic History (March 1984) , pp. 119-38.
Wicker, Elmus. "A Reconsideration of the Causes of the BankingPanic of 1930," Journal of Economic History (September 1980),pp. 571-84.
Appendix
SOURCES FOR STATE-LEVEL DATA
Bank failures and deposits in failed banks: Board of Governors(1943, pp. 284-85).
Branch bank offices: Federal Reserve Board (December 1930,pp. 811-12).
Business failure rate: Department of Commerce, Statistical Abstract( 1 9 3 0 , 1 9 3 1 , 1 9 3 2 , 1 9 3 3 ) .
Farm failure rate: Department of Agriculture ( 1 9 3 1 , 1 9 3 3 ) .
Farm population: Department of Commerce (1932, p. 40) .
Minimum capital requirement for state banks: Bankers EncyclopediaCompany (March 1929).
Number of banks and bank deposits: Board of Governors (1959) .
Per capita personal income: Department of Commerce (1956, p. 142).
Population density: Department of Commerce (1931 , p. 13).
FEDERAL RESERVE BANK OF ST. LOUIS
38Digitized for FRASER http://fraser.stlouisfed.org/ Federal Reserve Bank of St. Louis